
SmartmoneyCrypto
96 Публикации

SmartmoneyCrypto
Отправить жалобу
Заблокировать пользователя
📉📈 Market Structure & Levels
8 подписок(и/а)
29 подписчиков(а)
77 понравилось
Посты
Все
Цитирования
🚀 SOL/USDT – BUY SIGNAL | BULLISH MOMENTUM AHEAD?$SOL
{future}(SOLUSDT)
Solana (SOL) is on our watchlist for a potential bullish move. Buyers are looking for an opportunity to push the price toward higher resistance levels.
📊 TRADE SETUP
🟢 Entry Zone: $92.50 – $93.00
🎯 Take Profit Targets:
- TP1: $94.00
- TP2: $96.00
- TP3: $98.00
- TP4: $99.00
🛑 Stop Loss: $89.40
📈 Trading Strategy:
- Watch for bullish confirmation around the entry zone.
- Consider taking partial profits at each target.
- Move your stop loss carefully as the trade progresses.
- Avoid chasing the price if it moves too far from the entry zone.
💡 My Trading View: The $94 level is the first important target. If buyers maintain momentum and break above this level, SOL could potentially extend toward $96–$99.
⚠️ Risk Management: Always use proper position sizing and never risk more than you can afford to lose. This is a trade idea, not a guaranteed outcome.
🔥 What do you think? Can SOL reach $99?
👍 Like | 💬 Comment | 🔔 Follow for more crypto trading setups!
#SOL #SOLUSDT #Solana #CryptoTrading #Binance #Altcoins #TradingSignals #Bullish
🚀 SOL/USDT – BUY SIGNAL | BULLISH MOMENTUM AHEAD?
$SOL
Solana (SOL) is on our watchlist for a potential bullish move. Buyers are looking for an opportunity to push the price toward higher resistance levels.
📊 TRADE SETUP
🟢 Entry Zone: $92.50 – $93.00
🎯 Take Profit Targets:
- TP1: $94.00
- TP2: $96.00
- TP3: $98.00
- TP4: $99.00
🛑 Stop Loss: $89.40
📈 Trading Strategy:
- Watch for bullish confirmation around the entry zone.
- Consider taking partial profits at each target.
- Move your stop loss carefully as the trade progresses.
- Avoid chasing the price if it moves too far from the entry zone.
💡 My Trading View: The $94 level is the first important target. If buyers maintain momentum and break above this level, SOL could potentially extend toward $96–$99.
⚠️ Risk Management: Always use proper position sizing and never risk more than you can afford to lose. This is a trade idea, not a guaranteed outcome.
🔥 What do you think? Can SOL reach $99?
👍 Like | 💬 Comment | 🔔 Follow for more crypto trading setups!
#SOL #SOLUSDT #Solana #CryptoTrading #Binance #Altcoins #TradingSignals #Bullish
Solana (SOL) is on our watchlist for a potential bullish move. Buyers are looking for an opportunity to push the price toward higher resistance levels.
📊 TRADE SETUP
🟢 Entry Zone: $92.50 – $93.00
🎯 Take Profit Targets:
- TP1: $94.00
- TP2: $96.00
- TP3: $98.00
- TP4: $99.00
🛑 Stop Loss: $89.40
📈 Trading Strategy:
- Watch for bullish confirmation around the entry zone.
- Consider taking partial profits at each target.
- Move your stop loss carefully as the trade progresses.
- Avoid chasing the price if it moves too far from the entry zone.
💡 My Trading View: The $94 level is the first important target. If buyers maintain momentum and break above this level, SOL could potentially extend toward $96–$99.
⚠️ Risk Management: Always use proper position sizing and never risk more than you can afford to lose. This is a trade idea, not a guaranteed outcome.
🔥 What do you think? Can SOL reach $99?
👍 Like | 💬 Comment | 🔔 Follow for more crypto trading setups!
#SOL #SOLUSDT #Solana #CryptoTrading #Binance #Altcoins #TradingSignals #Bullish
62
·
--
Рост
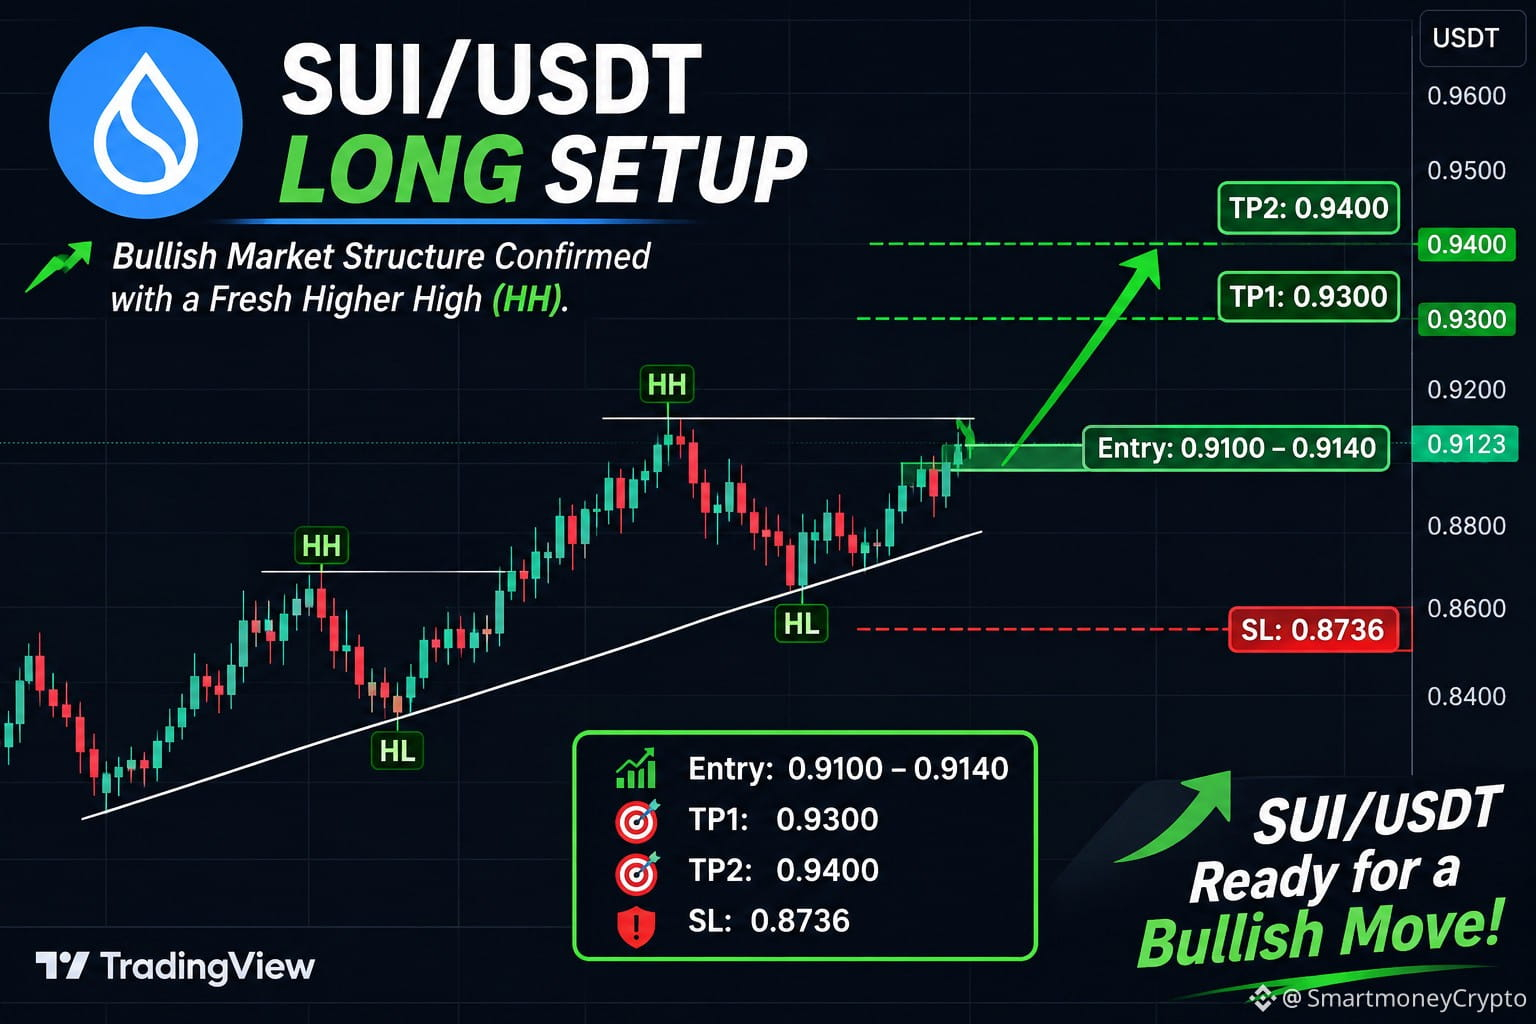
🚀 SUI/USDT – BULLISH LONG SETUP | HIGHER HIGH CONFIRMED!
SUI is showing promising bullish market structure after forming a fresh Higher High (HH), indicating that buyers may be gaining control.
📊 Technical Analysis
The price structure is showing bullish momentum with Higher Highs (HH) and Higher Lows (HL). If buyers maintain control and price holds above the entry zone, SUI could attempt another upward move.
🟢 LONG ENTRY ZONE: 0.9100 – 0.9140
🎯 TAKE PROFIT TARGETS:
- TP1: 0.9300
- TP2: 0.9400
🛑 STOP LOSS: 0.8736
📈 What to Watch Next?
1. A successful hold above the entry zone could strengthen the bullish outlook.
2. A breakout with strong buying volume may push SUI toward TP1.
3. A sustained move above 0.9300 could open the way toward TP2.
4. If price breaks below the stop-loss level, the bullish setup becomes invalid.
⚠️ Risk Management: Don't enter blindly. Wait for confirmation, manage position size, and always use a stop loss. This is a technical trading idea, not a guaranteed prediction.
🔥 Can SUI reach $0.9400?
What's your target for SUI?
👇 Share your analysis in the comments!
#SUI #SUIUSDT #CryptoTrading #Binance #Altcoins #TechnicalAnalysis #TradingSignals #BullishSetup
$SUI
{future}(SUIUSDT)
💰💰
🚀 SUI/USDT – BULLISH LONG SETUP | HIGHER HIGH CONFIRMED!
SUI is showing promising bullish market structure after forming a fresh Higher High (HH), indicating that buyers may be gaining control.
📊 Technical Analysis
The price structure is showing bullish momentum with Higher Highs (HH) and Higher Lows (HL). If buyers maintain control and price holds above the entry zone, SUI could attempt another upward move.
🟢 LONG ENTRY ZONE: 0.9100 – 0.9140
🎯 TAKE PROFIT TARGETS:
- TP1: 0.9300
- TP2: 0.9400
🛑 STOP LOSS: 0.8736
📈 What to Watch Next?
1. A successful hold above the entry zone could strengthen the bullish outlook.
2. A breakout with strong buying volume may push SUI toward TP1.
3. A sustained move above 0.9300 could open the way toward TP2.
4. If price breaks below the stop-loss level, the bullish setup becomes invalid.
⚠️ Risk Management: Don't enter blindly. Wait for confirmation, manage position size, and always use a stop loss. This is a technical trading idea, not a guaranteed prediction.
🔥 Can SUI reach $0.9400?
What's your target for SUI?
👇 Share your analysis in the comments!
#SUI #SUIUSDT #CryptoTrading #Binance #Altcoins #TechnicalAnalysis #TradingSignals #BullishSetup
$SUI
💰💰
SUI is showing promising bullish market structure after forming a fresh Higher High (HH), indicating that buyers may be gaining control.
📊 Technical Analysis
The price structure is showing bullish momentum with Higher Highs (HH) and Higher Lows (HL). If buyers maintain control and price holds above the entry zone, SUI could attempt another upward move.
🟢 LONG ENTRY ZONE: 0.9100 – 0.9140
🎯 TAKE PROFIT TARGETS:
- TP1: 0.9300
- TP2: 0.9400
🛑 STOP LOSS: 0.8736
📈 What to Watch Next?
1. A successful hold above the entry zone could strengthen the bullish outlook.
2. A breakout with strong buying volume may push SUI toward TP1.
3. A sustained move above 0.9300 could open the way toward TP2.
4. If price breaks below the stop-loss level, the bullish setup becomes invalid.
⚠️ Risk Management: Don't enter blindly. Wait for confirmation, manage position size, and always use a stop loss. This is a technical trading idea, not a guaranteed prediction.
🔥 Can SUI reach $0.9400?
What's your target for SUI?
👇 Share your analysis in the comments!
#SUI #SUIUSDT #CryptoTrading #Binance #Altcoins #TechnicalAnalysis #TradingSignals #BullishSetup
$SUI
💰💰
49
·
--
Рост
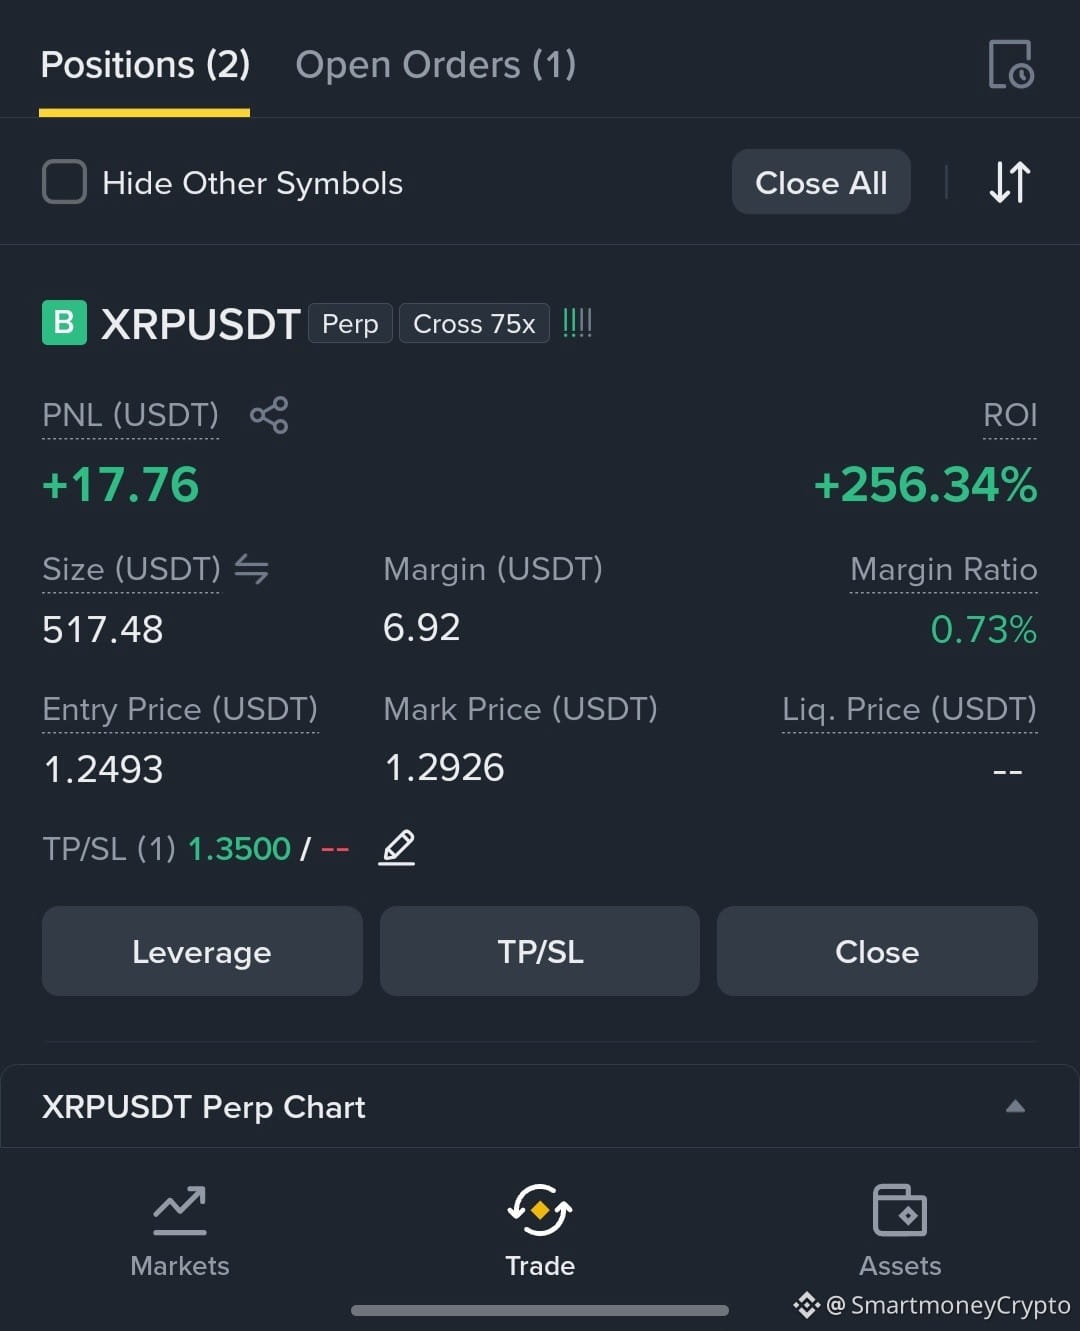
🚀 XRP LONG POSITION UPDATE – BULLISH MOMENTUM CONTINUES! 🔥
XRP is showing positive momentum, and my LONG position is currently performing well!
📊 Trade Overview:
- Trading Pair: XRPUSDT Perpetual
- Position: 🟢 LONG
- Entry Price: $1.2493
- Current Mark Price: $1.2926
- Take Profit: 🎯 $1.3500
- Stop Loss: Not set
💰 Position Performance:
- Unrealized PNL: +17.76 USDT
- ROI: +256.34%
- Price Movement: +3.04%
🎯 My Target: $1.3500
Market Outlook:
XRP is showing encouraging bullish momentum. If buyers maintain control and price continues making higher highs, the $1.30 level could become an important area to watch before the next move toward $1.3500.
⚠️ My Trading Strategy:
I'm watching price action closely and waiting for further confirmation. No blind entries — risk management always comes first.
🔥 Can XRP reach $1.35?
What's your target for XRP?
👇 Share your thoughts in the comments!
#XRP #XRPUSDT #Ripple #CryptoTrading #Binance #Altcoins #BullishMomentum #TradingUpdate
$XRP
{future}(XRPUSDT)
🚀 XRP LONG POSITION UPDATE – BULLISH MOMENTUM CONTINUES! 🔥
XRP is showing positive momentum, and my LONG position is currently performing well!
📊 Trade Overview:
- Trading Pair: XRPUSDT Perpetual
- Position: 🟢 LONG
- Entry Price: $1.2493
- Current Mark Price: $1.2926
- Take Profit: 🎯 $1.3500
- Stop Loss: Not set
💰 Position Performance:
- Unrealized PNL: +17.76 USDT
- ROI: +256.34%
- Price Movement: +3.04%
🎯 My Target: $1.3500
Market Outlook:
XRP is showing encouraging bullish momentum. If buyers maintain control and price continues making higher highs, the $1.30 level could become an important area to watch before the next move toward $1.3500.
⚠️ My Trading Strategy:
I'm watching price action closely and waiting for further confirmation. No blind entries — risk management always comes first.
🔥 Can XRP reach $1.35?
What's your target for XRP?
👇 Share your thoughts in the comments!
#XRP #XRPUSDT #Ripple #CryptoTrading #Binance #Altcoins #BullishMomentum #TradingUpdate
$XRP
XRP is showing positive momentum, and my LONG position is currently performing well!
📊 Trade Overview:
- Trading Pair: XRPUSDT Perpetual
- Position: 🟢 LONG
- Entry Price: $1.2493
- Current Mark Price: $1.2926
- Take Profit: 🎯 $1.3500
- Stop Loss: Not set
💰 Position Performance:
- Unrealized PNL: +17.76 USDT
- ROI: +256.34%
- Price Movement: +3.04%
🎯 My Target: $1.3500
Market Outlook:
XRP is showing encouraging bullish momentum. If buyers maintain control and price continues making higher highs, the $1.30 level could become an important area to watch before the next move toward $1.3500.
⚠️ My Trading Strategy:
I'm watching price action closely and waiting for further confirmation. No blind entries — risk management always comes first.
🔥 Can XRP reach $1.35?
What's your target for XRP?
👇 Share your thoughts in the comments!
#XRP #XRPUSDT #Ripple #CryptoTrading #Binance #Altcoins #BullishMomentum #TradingUpdate
$XRP
117
·
--
Рост
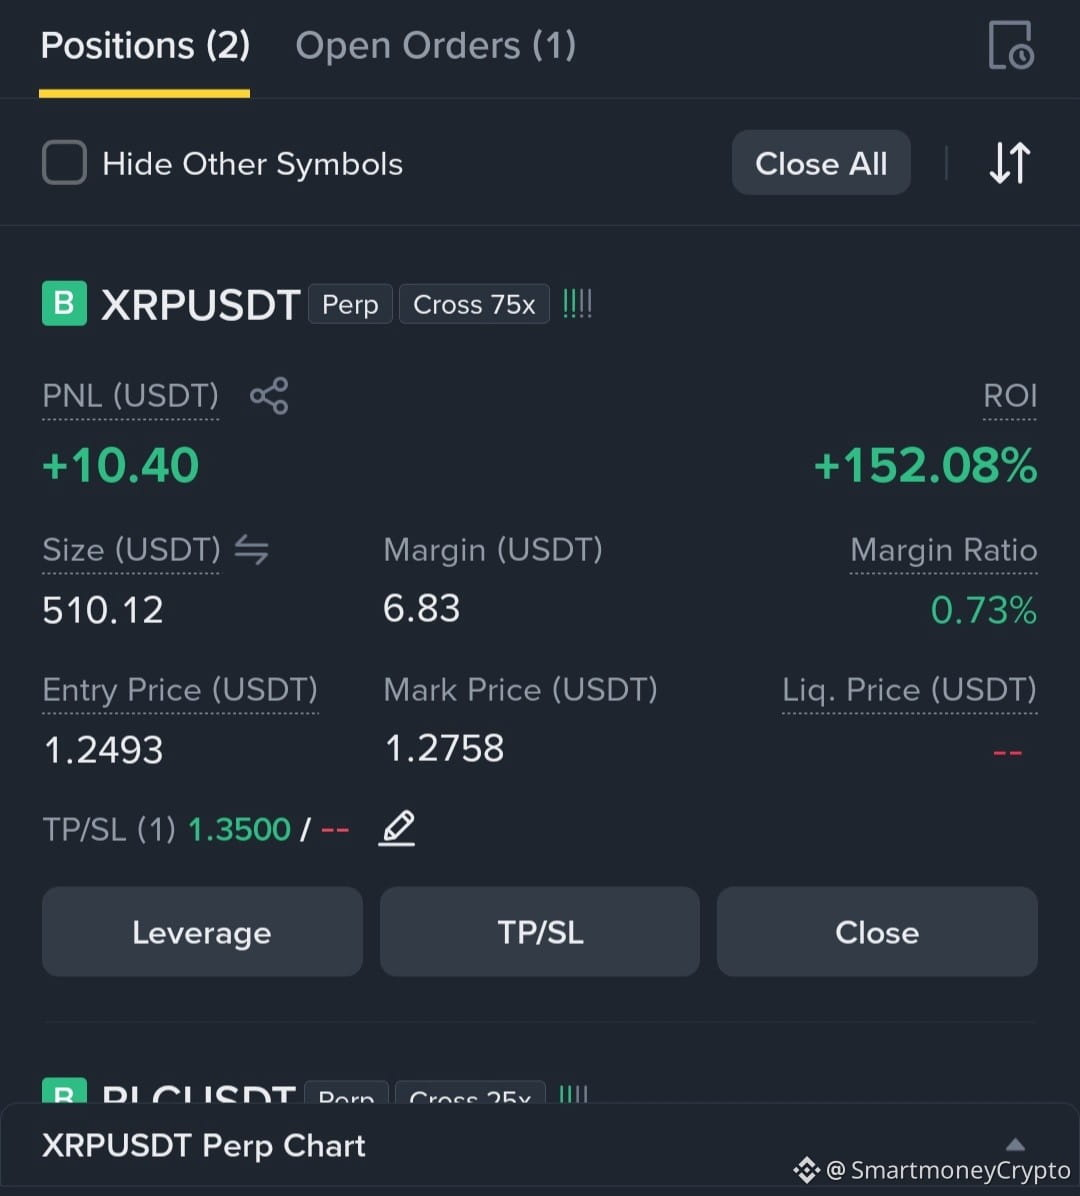
Trade running in profits XRPUSDT
$XRP
{future}(XRPUSDT)
Target 1.3500
Trade running in profits XRPUSDT
$XRP
Target 1.3500
$XRP
Target 1.3500
118
we are making good profits in RUNE🚀🚀$RUNE
{future}(RUNEUSDT)
Here is setup thai I give
🚀 RUNEUSDT – BUY SETUP | Potential Bullish Opportunity
The RUNEUSDT pair is on our watchlist for a potential bullish move. Buyers should focus on proper risk management and confirmation before entering the trade.
📊 Trade Setup
🟢 Direction: BUY / LONG
🛑 Stop Loss: 0.5108
🎯 Take Profit Targets:
- TP1: 0.5400
- TP2: 0.6193
- TP3: 0.6495
📈 Trading Strategy
The first target at 0.5400 is the initial profit-taking zone. If bullish momentum continues, RUNE could potentially extend toward 0.6193 and 0.6495.
What Should Traders Watch?
1. Strong buying volume.
2. Bullish market structure.
3. Support holding above the entry area.
4. BTC stability and overall altcoin sentiment.
⚠️ Risk Management:
Always calculate your position size according to your risk tolerance. Avoid chasing the price and respect your stop loss.
💬 What's your target for RUNE? Can it reach 0.6495?
Share your analysis in the comments!
#RUNE #RUNEUSDT #THORChain #CryptoTrading #Binance #Altcoins #TradingSetup #CryptoAnalysis
we are making good profits in RUNE🚀🚀
$RUNE
Here is setup thai I give
🚀 RUNEUSDT – BUY SETUP | Potential Bullish Opportunity
The RUNEUSDT pair is on our watchlist for a potential bullish move. Buyers should focus on proper risk management and confirmation before entering the trade.
📊 Trade Setup
🟢 Direction: BUY / LONG
🛑 Stop Loss: 0.5108
🎯 Take Profit Targets:
- TP1: 0.5400
- TP2: 0.6193
- TP3: 0.6495
📈 Trading Strategy
The first target at 0.5400 is the initial profit-taking zone. If bullish momentum continues, RUNE could potentially extend toward 0.6193 and 0.6495.
What Should Traders Watch?
1. Strong buying volume.
2. Bullish market structure.
3. Support holding above the entry area.
4. BTC stability and overall altcoin sentiment.
⚠️ Risk Management:
Always calculate your position size according to your risk tolerance. Avoid chasing the price and respect your stop loss.
💬 What's your target for RUNE? Can it reach 0.6495?
Share your analysis in the comments!
#RUNE #RUNEUSDT #THORChain #CryptoTrading #Binance #Altcoins #TradingSetup #CryptoAnalysis
Here is setup thai I give
🚀 RUNEUSDT – BUY SETUP | Potential Bullish Opportunity
The RUNEUSDT pair is on our watchlist for a potential bullish move. Buyers should focus on proper risk management and confirmation before entering the trade.
📊 Trade Setup
🟢 Direction: BUY / LONG
🛑 Stop Loss: 0.5108
🎯 Take Profit Targets:
- TP1: 0.5400
- TP2: 0.6193
- TP3: 0.6495
📈 Trading Strategy
The first target at 0.5400 is the initial profit-taking zone. If bullish momentum continues, RUNE could potentially extend toward 0.6193 and 0.6495.
What Should Traders Watch?
1. Strong buying volume.
2. Bullish market structure.
3. Support holding above the entry area.
4. BTC stability and overall altcoin sentiment.
⚠️ Risk Management:
Always calculate your position size according to your risk tolerance. Avoid chasing the price and respect your stop loss.
💬 What's your target for RUNE? Can it reach 0.6495?
Share your analysis in the comments!
#RUNE #RUNEUSDT #THORChain #CryptoTrading #Binance #Altcoins #TradingSetup #CryptoAnalysis
209
🚀 RUNEUSDT – BUY SETUP | Potential Bullish Opportunity$RUNE
{future}(RUNEUSDT)
The RUNEUSDT pair is on our watchlist for a potential bullish move. Buyers should focus on proper risk management and confirmation before entering the trade.
📊 Trade Setup
🟢 Direction: BUY / LONG
🛑 Stop Loss: 0.5108
🎯 Take Profit Targets:
- TP1: 0.5400
- TP2: 0.6193
- TP3: 0.6495
📈 Trading Strategy
The first target at 0.5400 is the initial profit-taking zone. If bullish momentum continues, RUNE could potentially extend toward 0.6193 and 0.6495.
What Should Traders Watch?
1. Strong buying volume.
2. Bullish market structure.
3. Support holding above the entry area.
4. BTC stability and overall altcoin sentiment.
⚠️ Risk Management:
Always calculate your position size according to your risk tolerance. Avoid chasing the price and respect your stop loss.
💬 What's your target for RUNE? Can it reach 0.6495?
Share your analysis in the comments!
#RUNE #RUNEUSDT #THORChain #CryptoTrading #Binance #Altcoins #TradingSetup #CryptoAnalysis
🚀 RUNEUSDT – BUY SETUP | Potential Bullish Opportunity
$RUNE
The RUNEUSDT pair is on our watchlist for a potential bullish move. Buyers should focus on proper risk management and confirmation before entering the trade.
📊 Trade Setup
🟢 Direction: BUY / LONG
🛑 Stop Loss: 0.5108
🎯 Take Profit Targets:
- TP1: 0.5400
- TP2: 0.6193
- TP3: 0.6495
📈 Trading Strategy
The first target at 0.5400 is the initial profit-taking zone. If bullish momentum continues, RUNE could potentially extend toward 0.6193 and 0.6495.
What Should Traders Watch?
1. Strong buying volume.
2. Bullish market structure.
3. Support holding above the entry area.
4. BTC stability and overall altcoin sentiment.
⚠️ Risk Management:
Always calculate your position size according to your risk tolerance. Avoid chasing the price and respect your stop loss.
💬 What's your target for RUNE? Can it reach 0.6495?
Share your analysis in the comments!
#RUNE #RUNEUSDT #THORChain #CryptoTrading #Binance #Altcoins #TradingSetup #CryptoAnalysis
The RUNEUSDT pair is on our watchlist for a potential bullish move. Buyers should focus on proper risk management and confirmation before entering the trade.
📊 Trade Setup
🟢 Direction: BUY / LONG
🛑 Stop Loss: 0.5108
🎯 Take Profit Targets:
- TP1: 0.5400
- TP2: 0.6193
- TP3: 0.6495
📈 Trading Strategy
The first target at 0.5400 is the initial profit-taking zone. If bullish momentum continues, RUNE could potentially extend toward 0.6193 and 0.6495.
What Should Traders Watch?
1. Strong buying volume.
2. Bullish market structure.
3. Support holding above the entry area.
4. BTC stability and overall altcoin sentiment.
⚠️ Risk Management:
Always calculate your position size according to your risk tolerance. Avoid chasing the price and respect your stop loss.
💬 What's your target for RUNE? Can it reach 0.6495?
Share your analysis in the comments!
#RUNE #RUNEUSDT #THORChain #CryptoTrading #Binance #Altcoins #TradingSetup #CryptoAnalysis
175
🚀 CGPTUSDT – BUY OPPORTUNITY | BULLISH SETUPCGPTUSDT is presenting a potential bullish trading opportunity. Buyers may take control if price holds the entry zone and bullish momentum develops.
$CGPT
📊 TRADE SETUP
🟢 Entry Zone: 0.01845 – 0.01860
🛑 Stop Loss: 0.01755
🎯 Take Profit Targets:
- TP1: 0.01920
- TP2: 0.01960
📈 Market Strategy
The entry zone is the key area to watch. A successful bounce with strong buying volume could push the price toward the first target at 0.01920.
If bullish momentum continues, the next potential target is 0.01960.
⚠️ Risk Management
- Avoid entering without confirmation.
- Always respect your stop loss.
- Don't risk more than you can afford to lose.
- Consider booking partial profits at TP1.
🔥 Stay disciplined. Trade the setup, not your emotions!
What do you think? Can CGPTUSDT reach 0.01960?
#CGPTUSDT #CryptoTrading #Binance #Altcoins #BuySignal #TechnicalAnalysis #CryptoMarket
{future}(CGPTUSDT)
🚀 CGPTUSDT – BUY OPPORTUNITY | BULLISH SETUP
CGPTUSDT is presenting a potential bullish trading opportunity. Buyers may take control if price holds the entry zone and bullish momentum develops.
$CGPT
📊 TRADE SETUP
🟢 Entry Zone: 0.01845 – 0.01860
🛑 Stop Loss: 0.01755
🎯 Take Profit Targets:
- TP1: 0.01920
- TP2: 0.01960
📈 Market Strategy
The entry zone is the key area to watch. A successful bounce with strong buying volume could push the price toward the first target at 0.01920.
If bullish momentum continues, the next potential target is 0.01960.
⚠️ Risk Management
- Avoid entering without confirmation.
- Always respect your stop loss.
- Don't risk more than you can afford to lose.
- Consider booking partial profits at TP1.
🔥 Stay disciplined. Trade the setup, not your emotions!
What do you think? Can CGPTUSDT reach 0.01960?
#CGPTUSDT #CryptoTrading #Binance #Altcoins #BuySignal #TechnicalAnalysis #CryptoMarket
$CGPT
📊 TRADE SETUP
🟢 Entry Zone: 0.01845 – 0.01860
🛑 Stop Loss: 0.01755
🎯 Take Profit Targets:
- TP1: 0.01920
- TP2: 0.01960
📈 Market Strategy
The entry zone is the key area to watch. A successful bounce with strong buying volume could push the price toward the first target at 0.01920.
If bullish momentum continues, the next potential target is 0.01960.
⚠️ Risk Management
- Avoid entering without confirmation.
- Always respect your stop loss.
- Don't risk more than you can afford to lose.
- Consider booking partial profits at TP1.
🔥 Stay disciplined. Trade the setup, not your emotions!
What do you think? Can CGPTUSDT reach 0.01960?
#CGPTUSDT #CryptoTrading #Binance #Altcoins #BuySignal #TechnicalAnalysis #CryptoMarket
412
Статья
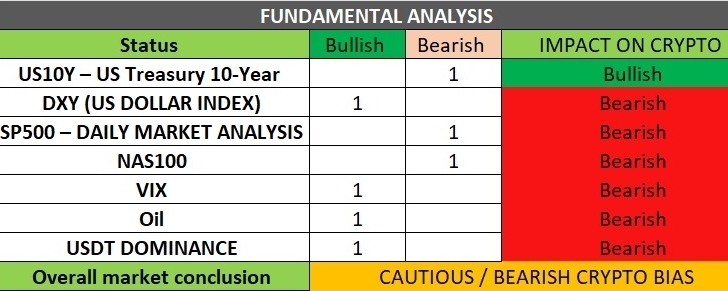
🚨 WHY ARE CRYPTO & GOLD FACING BEARISH PRESSURE? | MACRO MARKET ANALYSIS 📉Markets are not moving randomly. Behind the current bearish sentiment in Bitcoin, altcoins, and Gold, several important macroeconomic indicators are worth monitoring.
Let's break down the 7 key indicators that every serious trader should understand before taking their next position.
1️⃣ US10Y – US TREASURY 10-YEAR YIELD
📊 Key Levels:
- Previous rally: 4.55% → 5.326%
- Current support zone: 4.928%
- Important psychological level: 5.00%
US10Y has shown weakening momentum after rejection from 5.326%.
🔎 What to watch:
- Falling yields may provide relief for Bitcoin, Gold, and other risk assets.
- A recovery above 5% could bring renewed pressure.
2️⃣ DXY – US DOLLAR INDEX
📊 Current Reference: 101.963
The US Dollar Index is showing bullish momentum.
A stronger dollar generally creates headwinds for:
- Bitcoin and cryptocurrencies.
- Gold (XAUUSD).
- Other dollar-denominated assets.
A DXY reversal towards the downside could provide an opportunity for BTC and Gold to recover.
3️⃣ S&P 500 – BEARISH BREAKDOWN WARNING
📊 Reference Level: 7,577.7
Weakness in the S&P 500 can indicate declining investor confidence and increasing risk-off sentiment.
Potential impact:
- Bitcoin may experience additional selling pressure.
- Altcoins could face stronger downside volatility.
- Gold may attract safe-haven demand, although dollar strength and yields can limit its upside.
4️⃣ NASDAQ 100 – TECHNOLOGY MARKET WEAKNESS
NASDAQ 100 weakness is another important warning signal.
Technology stocks are generally sensitive to interest rates and liquidity conditions.
If NAS100 continues declining:
- Risk appetite may weaken.
- Bitcoin and altcoins could face additional selling.
- Investors may reduce exposure to high-risk assets.
Watch DXY and Treasury yields for confirmation.
5️⃣ VIX – RISING MARKET FEAR
📊 Reference Level: 19.41
VIX measures expected volatility in the US stock market.
When VIX rises sharply, it can indicate increasing uncertainty and fear.
Possible market impact:
- BTC: Higher volatility and potential selling pressure.
- Altcoins: Increased downside risk.
- Gold: Potential safe-haven demand, but short-term selling is also possible.
- USD: May benefit from safe-haven demand.
Remember: Rising VIX does not automatically mean every asset will fall.
6️⃣ CRUDE OIL – THE INFLATION FACTOR 🛢️
Oil is more than just a commodity. It is an important indicator of global inflation, supply-demand dynamics, and geopolitical risk.
Why should crypto and Gold traders monitor oil?
- Higher oil prices can increase inflation expectations.
- Persistent inflation may keep interest rates higher for longer.
- Higher yields and a stronger dollar can pressure Gold and crypto.
- Geopolitical uncertainty can increase safe-haven demand.
Oil's impact depends on how inflation expectations, monetary policy, and the dollar respond.
7️⃣ USDT DOMINANCE – CRYPTO RISK-OFF SIGNAL
📊 Current Structure: Bullish Recovery
USDT Dominance is showing a bullish short-term structure.
This is an important indicator for crypto traders.
When USDT.D rises, it can suggest that investors are moving towards stablecoins instead of holding BTC and altcoins.
What this means:
- Increasing USDT.D = Potential bearish pressure on crypto.
- Decreasing USDT.D = Potential recovery in BTC and altcoins.
Watch this chart alongside BTC market structure before entering trades.
---
🎯 MY OVERALL MARKET OUTLOOK
The combination of a stronger DXY, uncertain Treasury yields, weakness in major equity indices, rising VIX, and bullish USDT Dominance creates a cautious environment for crypto markets.
However, Gold and Bitcoin do not always move in the same direction.
Gold can benefit from safe-haven demand, while Bitcoin may behave more like a risk asset during periods of market stress.
🔥 WHAT SHOULD TRADERS DO NOW?
1. Avoid entering trades based on one indicator.
2. Monitor DXY and US10Y for macro confirmation.
3. Watch S&P 500 and NAS100 for risk sentiment.
4. Track VIX for volatility changes.
5. Monitor USDT.D for crypto market positioning.
6. Wait for technical confirmation before opening LONG or SHORT positions.
7. Protect capital with proper stop-loss management.
MY MESSAGE TO TRADERS:
Don't trade against the macro environment without a clear setup. Understand liquidity, monitor economic indicators, and let price action confirm your decision.
📌 What do you think?
Are we preparing for another bearish move in BTC and Gold, or could a reversal in DXY and US Treasury yields trigger a strong recovery?
$BTC $XAU
Share your analysis below! 👇
#Bitcoin #BTC #CryptoMarket #Gold #XAUUSD #DXY #US10Y #SP500 #NASDAQ #VIX #USDTDominance #MacroAnalysis #TradingStrategy
🚨 WHY ARE CRYPTO & GOLD FACING BEARISH PRESSURE? | MACRO MARKET ANALYSIS 📉
Markets are not moving randomly. Behind the current bearish sentiment in Bitcoin, altcoins, and Gold, several important macroeconomic indicators are worth monitoring.
Let's break down the 7 key indicators that every serious trader should understand before taking their next position.
1️⃣ US10Y – US TREASURY 10-YEAR YIELD
📊 Key Levels:
- Previous rally: 4.55% → 5.326%
- Current support zone: 4.928%
- Important psychological level: 5.00%
US10Y has shown weakening momentum after rejection from 5.326%.
🔎 What to watch:
- Falling yields may provide relief for Bitcoin, Gold, and other risk assets.
- A recovery above 5% could bring renewed pressure.
2️⃣ DXY – US DOLLAR INDEX
📊 Current Reference: 101.963
The US Dollar Index is showing bullish momentum.
A stronger dollar generally creates headwinds for:
- Bitcoin and cryptocurrencies.
- Gold (XAUUSD).
- Other dollar-denominated assets.
A DXY reversal towards the downside could provide an opportunity for BTC and Gold to recover.
3️⃣ S&P 500 – BEARISH BREAKDOWN WARNING
📊 Reference Level: 7,577.7
Weakness in the S&P 500 can indicate declining investor confidence and increasing risk-off sentiment.
Potential impact:
- Bitcoin may experience additional selling pressure.
- Altcoins could face stronger downside volatility.
- Gold may attract safe-haven demand, although dollar strength and yields can limit its upside.
4️⃣ NASDAQ 100 – TECHNOLOGY MARKET WEAKNESS
NASDAQ 100 weakness is another important warning signal.
Technology stocks are generally sensitive to interest rates and liquidity conditions.
If NAS100 continues declining:
- Risk appetite may weaken.
- Bitcoin and altcoins could face additional selling.
- Investors may reduce exposure to high-risk assets.
Watch DXY and Treasury yields for confirmation.
5️⃣ VIX – RISING MARKET FEAR
📊 Reference Level: 19.41
VIX measures expected volatility in the US stock market.
When VIX rises sharply, it can indicate increasing uncertainty and fear.
Possible market impact:
- BTC: Higher volatility and potential selling pressure.
- Altcoins: Increased downside risk.
- Gold: Potential safe-haven demand, but short-term selling is also possible.
- USD: May benefit from safe-haven demand.
Remember: Rising VIX does not automatically mean every asset will fall.
6️⃣ CRUDE OIL – THE INFLATION FACTOR 🛢️
Oil is more than just a commodity. It is an important indicator of global inflation, supply-demand dynamics, and geopolitical risk.
Why should crypto and Gold traders monitor oil?
- Higher oil prices can increase inflation expectations.
- Persistent inflation may keep interest rates higher for longer.
- Higher yields and a stronger dollar can pressure Gold and crypto.
- Geopolitical uncertainty can increase safe-haven demand.
Oil's impact depends on how inflation expectations, monetary policy, and the dollar respond.
7️⃣ USDT DOMINANCE – CRYPTO RISK-OFF SIGNAL
📊 Current Structure: Bullish Recovery
USDT Dominance is showing a bullish short-term structure.
This is an important indicator for crypto traders.
When USDT.D rises, it can suggest that investors are moving towards stablecoins instead of holding BTC and altcoins.
What this means:
- Increasing USDT.D = Potential bearish pressure on crypto.
- Decreasing USDT.D = Potential recovery in BTC and altcoins.
Watch this chart alongside BTC market structure before entering trades.
---
🎯 MY OVERALL MARKET OUTLOOK
The combination of a stronger DXY, uncertain Treasury yields, weakness in major equity indices, rising VIX, and bullish USDT Dominance creates a cautious environment for crypto markets.
However, Gold and Bitcoin do not always move in the same direction.
Gold can benefit from safe-haven demand, while Bitcoin may behave more like a risk asset during periods of market stress.
🔥 WHAT SHOULD TRADERS DO NOW?
1. Avoid entering trades based on one indicator.
2. Monitor DXY and US10Y for macro confirmation.
3. Watch S&P 500 and NAS100 for risk sentiment.
4. Track VIX for volatility changes.
5. Monitor USDT.D for crypto market positioning.
6. Wait for technical confirmation before opening LONG or SHORT positions.
7. Protect capital with proper stop-loss management.
MY MESSAGE TO TRADERS:
Don't trade against the macro environment without a clear setup. Understand liquidity, monitor economic indicators, and let price action confirm your decision.
📌 What do you think?
Are we preparing for another bearish move in BTC and Gold, or could a reversal in DXY and US Treasury yields trigger a strong recovery?
$BTC $XAU
Share your analysis below! 👇
#Bitcoin #BTC #CryptoMarket #Gold #XAUUSD #DXY #US10Y #SP500 #NASDAQ #VIX #USDTDominance #MacroAnalysis #TradingStrategy
Let's break down the 7 key indicators that every serious trader should understand before taking their next position.
1️⃣ US10Y – US TREASURY 10-YEAR YIELD
📊 Key Levels:
- Previous rally: 4.55% → 5.326%
- Current support zone: 4.928%
- Important psychological level: 5.00%
US10Y has shown weakening momentum after rejection from 5.326%.
🔎 What to watch:
- Falling yields may provide relief for Bitcoin, Gold, and other risk assets.
- A recovery above 5% could bring renewed pressure.
2️⃣ DXY – US DOLLAR INDEX
📊 Current Reference: 101.963
The US Dollar Index is showing bullish momentum.
A stronger dollar generally creates headwinds for:
- Bitcoin and cryptocurrencies.
- Gold (XAUUSD).
- Other dollar-denominated assets.
A DXY reversal towards the downside could provide an opportunity for BTC and Gold to recover.
3️⃣ S&P 500 – BEARISH BREAKDOWN WARNING
📊 Reference Level: 7,577.7
Weakness in the S&P 500 can indicate declining investor confidence and increasing risk-off sentiment.
Potential impact:
- Bitcoin may experience additional selling pressure.
- Altcoins could face stronger downside volatility.
- Gold may attract safe-haven demand, although dollar strength and yields can limit its upside.
4️⃣ NASDAQ 100 – TECHNOLOGY MARKET WEAKNESS
NASDAQ 100 weakness is another important warning signal.
Technology stocks are generally sensitive to interest rates and liquidity conditions.
If NAS100 continues declining:
- Risk appetite may weaken.
- Bitcoin and altcoins could face additional selling.
- Investors may reduce exposure to high-risk assets.
Watch DXY and Treasury yields for confirmation.
5️⃣ VIX – RISING MARKET FEAR
📊 Reference Level: 19.41
VIX measures expected volatility in the US stock market.
When VIX rises sharply, it can indicate increasing uncertainty and fear.
Possible market impact:
- BTC: Higher volatility and potential selling pressure.
- Altcoins: Increased downside risk.
- Gold: Potential safe-haven demand, but short-term selling is also possible.
- USD: May benefit from safe-haven demand.
Remember: Rising VIX does not automatically mean every asset will fall.
6️⃣ CRUDE OIL – THE INFLATION FACTOR 🛢️
Oil is more than just a commodity. It is an important indicator of global inflation, supply-demand dynamics, and geopolitical risk.
Why should crypto and Gold traders monitor oil?
- Higher oil prices can increase inflation expectations.
- Persistent inflation may keep interest rates higher for longer.
- Higher yields and a stronger dollar can pressure Gold and crypto.
- Geopolitical uncertainty can increase safe-haven demand.
Oil's impact depends on how inflation expectations, monetary policy, and the dollar respond.
7️⃣ USDT DOMINANCE – CRYPTO RISK-OFF SIGNAL
📊 Current Structure: Bullish Recovery
USDT Dominance is showing a bullish short-term structure.
This is an important indicator for crypto traders.
When USDT.D rises, it can suggest that investors are moving towards stablecoins instead of holding BTC and altcoins.
What this means:
- Increasing USDT.D = Potential bearish pressure on crypto.
- Decreasing USDT.D = Potential recovery in BTC and altcoins.
Watch this chart alongside BTC market structure before entering trades.
---
🎯 MY OVERALL MARKET OUTLOOK
The combination of a stronger DXY, uncertain Treasury yields, weakness in major equity indices, rising VIX, and bullish USDT Dominance creates a cautious environment for crypto markets.
However, Gold and Bitcoin do not always move in the same direction.
Gold can benefit from safe-haven demand, while Bitcoin may behave more like a risk asset during periods of market stress.
🔥 WHAT SHOULD TRADERS DO NOW?
1. Avoid entering trades based on one indicator.
2. Monitor DXY and US10Y for macro confirmation.
3. Watch S&P 500 and NAS100 for risk sentiment.
4. Track VIX for volatility changes.
5. Monitor USDT.D for crypto market positioning.
6. Wait for technical confirmation before opening LONG or SHORT positions.
7. Protect capital with proper stop-loss management.
MY MESSAGE TO TRADERS:
Don't trade against the macro environment without a clear setup. Understand liquidity, monitor economic indicators, and let price action confirm your decision.
📌 What do you think?
Are we preparing for another bearish move in BTC and Gold, or could a reversal in DXY and US Treasury yields trigger a strong recovery?
$BTC $XAU
Share your analysis below! 👇
#Bitcoin #BTC #CryptoMarket #Gold #XAUUSD #DXY #US10Y #SP500 #NASDAQ #VIX #USDTDominance #MacroAnalysis #TradingStrategy
421
🚨 BITCOIN LIQUIDITY MAP: WHERE WILL BTC MOVE NEXT? 🐋BTC traders, pay attention! The next major move could be driven by liquidity.
$BTC
Bitcoin's liquidity map highlights several important zones where leveraged traders could face liquidations. These levels may become key targets for institutional players and smart money.
Let's break down the important liquidity zones. 👇
🔴 1. UPPER LIQUIDITY ZONES (SHORT LIQUIDATIONS)
💰 $79,500 – $79,800
- Upper liquidity zone.
- Potential short liquidation area.
- A move above this region could trigger a short squeeze.
💰 $78,600 – $78,900
- Strong liquidity cluster.
- Important area to monitor.
- A liquidity sweep here could create a short-term volatility spike.
🟢 2. LOWER LIQUIDITY ZONES (LONG LIQUIDATIONS)
💰 $77,200 – $77,400
- Strong long liquidation cluster.
- Important downside liquidity target.
- A breakdown could accelerate selling pressure.
💰 $76,800 – $77,000
- Important downside liquidity pool.
- Watch for a potential liquidity sweep and reaction.
💰 $76,000 – $76,200
- Lower liquidity zone.
- Could become a deeper downside target if bearish momentum continues.
🧠 WHAT SHOULD TRADERS EXPECT?
There are two important scenarios:
📈 BULLISH SCENARIO
If BTC moves toward $77,200–$77,400, sweeps liquidity, and quickly reclaims the zone, a relief bounce toward $78,600–$78,900 could develop.
📉 BEARISH SCENARIO
If BTC loses $77,200 with strong selling pressure, the next downside liquidity zones are $76,800–$77,000 and potentially $76,000–$76,200.
A move above $78,900 could also open the way toward $79,500–$79,800.
⚠️ MY TRADING STRATEGY
I'm watching these liquidity levels carefully.
I will not enter a trade simply because price reaches a liquidity zone. I want confirmation through:
- Market Structure Shift (MSS)
- Break of Structure (BOS)
- Fair Value Gap (FVG)
- Volume confirmation
- Liquidity sweep and rejection
Remember: Liquidity zones are potential reaction areas, not guaranteed reversal points. Always manage your risk.
🔥 THE BIG QUESTION:
Which side will Bitcoin hunt first?
1️⃣ $79,500 – $79,800 (Short Liquidations)
2️⃣ $77,200 – $77,400 (Long Liquidations)
👇 Drop your prediction in the comments!
Follow for more BTC liquidity maps, Smart Money Concepts, and professional crypto market analysis.
#Bitcoin #BTC #CryptoAnalysis #LiquidityMap #SmartMoneyConcepts #BTCTrading #BinanceSquare #CryptoMarket
{spot}(BTCUSDT)
🚨 BITCOIN LIQUIDITY MAP: WHERE WILL BTC MOVE NEXT? 🐋
BTC traders, pay attention! The next major move could be driven by liquidity.
$BTC
Bitcoin's liquidity map highlights several important zones where leveraged traders could face liquidations. These levels may become key targets for institutional players and smart money.
Let's break down the important liquidity zones. 👇
🔴 1. UPPER LIQUIDITY ZONES (SHORT LIQUIDATIONS)
💰 $79,500 – $79,800
- Upper liquidity zone.
- Potential short liquidation area.
- A move above this region could trigger a short squeeze.
💰 $78,600 – $78,900
- Strong liquidity cluster.
- Important area to monitor.
- A liquidity sweep here could create a short-term volatility spike.
🟢 2. LOWER LIQUIDITY ZONES (LONG LIQUIDATIONS)
💰 $77,200 – $77,400
- Strong long liquidation cluster.
- Important downside liquidity target.
- A breakdown could accelerate selling pressure.
💰 $76,800 – $77,000
- Important downside liquidity pool.
- Watch for a potential liquidity sweep and reaction.
💰 $76,000 – $76,200
- Lower liquidity zone.
- Could become a deeper downside target if bearish momentum continues.
🧠 WHAT SHOULD TRADERS EXPECT?
There are two important scenarios:
📈 BULLISH SCENARIO
If BTC moves toward $77,200–$77,400, sweeps liquidity, and quickly reclaims the zone, a relief bounce toward $78,600–$78,900 could develop.
📉 BEARISH SCENARIO
If BTC loses $77,200 with strong selling pressure, the next downside liquidity zones are $76,800–$77,000 and potentially $76,000–$76,200.
A move above $78,900 could also open the way toward $79,500–$79,800.
⚠️ MY TRADING STRATEGY
I'm watching these liquidity levels carefully.
I will not enter a trade simply because price reaches a liquidity zone. I want confirmation through:
- Market Structure Shift (MSS)
- Break of Structure (BOS)
- Fair Value Gap (FVG)
- Volume confirmation
- Liquidity sweep and rejection
Remember: Liquidity zones are potential reaction areas, not guaranteed reversal points. Always manage your risk.
🔥 THE BIG QUESTION:
Which side will Bitcoin hunt first?
1️⃣ $79,500 – $79,800 (Short Liquidations)
2️⃣ $77,200 – $77,400 (Long Liquidations)
👇 Drop your prediction in the comments!
Follow for more BTC liquidity maps, Smart Money Concepts, and professional crypto market analysis.
#Bitcoin #BTC #CryptoAnalysis #LiquidityMap #SmartMoneyConcepts #BTCTrading #BinanceSquare #CryptoMarket
$BTC
Bitcoin's liquidity map highlights several important zones where leveraged traders could face liquidations. These levels may become key targets for institutional players and smart money.
Let's break down the important liquidity zones. 👇
🔴 1. UPPER LIQUIDITY ZONES (SHORT LIQUIDATIONS)
💰 $79,500 – $79,800
- Upper liquidity zone.
- Potential short liquidation area.
- A move above this region could trigger a short squeeze.
💰 $78,600 – $78,900
- Strong liquidity cluster.
- Important area to monitor.
- A liquidity sweep here could create a short-term volatility spike.
🟢 2. LOWER LIQUIDITY ZONES (LONG LIQUIDATIONS)
💰 $77,200 – $77,400
- Strong long liquidation cluster.
- Important downside liquidity target.
- A breakdown could accelerate selling pressure.
💰 $76,800 – $77,000
- Important downside liquidity pool.
- Watch for a potential liquidity sweep and reaction.
💰 $76,000 – $76,200
- Lower liquidity zone.
- Could become a deeper downside target if bearish momentum continues.
🧠 WHAT SHOULD TRADERS EXPECT?
There are two important scenarios:
📈 BULLISH SCENARIO
If BTC moves toward $77,200–$77,400, sweeps liquidity, and quickly reclaims the zone, a relief bounce toward $78,600–$78,900 could develop.
📉 BEARISH SCENARIO
If BTC loses $77,200 with strong selling pressure, the next downside liquidity zones are $76,800–$77,000 and potentially $76,000–$76,200.
A move above $78,900 could also open the way toward $79,500–$79,800.
⚠️ MY TRADING STRATEGY
I'm watching these liquidity levels carefully.
I will not enter a trade simply because price reaches a liquidity zone. I want confirmation through:
- Market Structure Shift (MSS)
- Break of Structure (BOS)
- Fair Value Gap (FVG)
- Volume confirmation
- Liquidity sweep and rejection
Remember: Liquidity zones are potential reaction areas, not guaranteed reversal points. Always manage your risk.
🔥 THE BIG QUESTION:
Which side will Bitcoin hunt first?
1️⃣ $79,500 – $79,800 (Short Liquidations)
2️⃣ $77,200 – $77,400 (Long Liquidations)
👇 Drop your prediction in the comments!
Follow for more BTC liquidity maps, Smart Money Concepts, and professional crypto market analysis.
#Bitcoin #BTC #CryptoAnalysis #LiquidityMap #SmartMoneyConcepts #BTCTrading #BinanceSquare #CryptoMarket
80
·
--
Рост
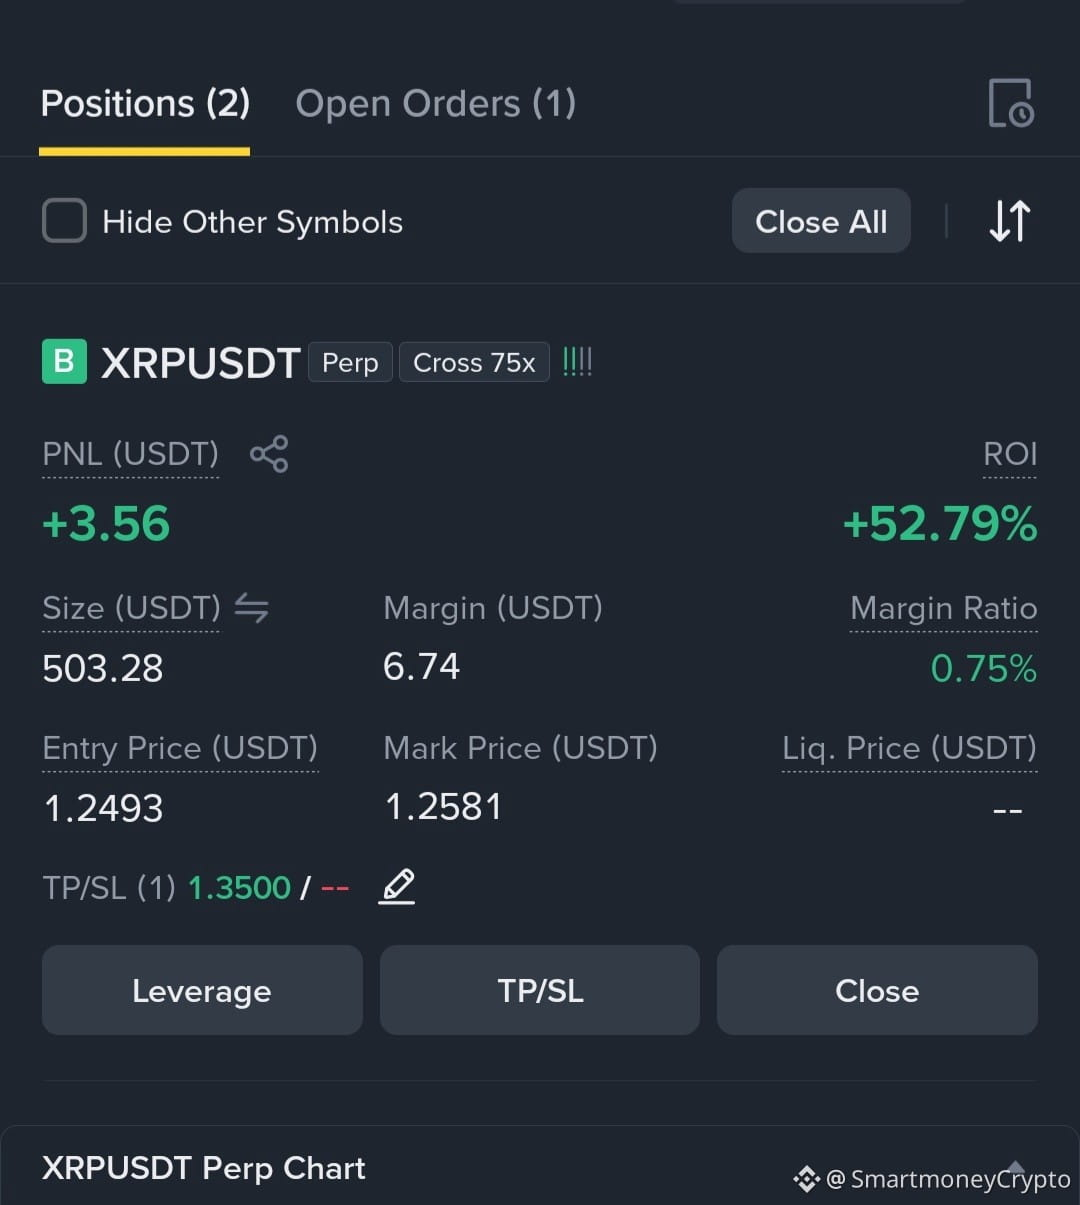
🚀 XRPUSDT LONG TRADE UPDATE – TARGET $1.3500! 📈
$XRP
{future}(XRPUSDT)
🔥 What do you think? Can XRP reach $1.3500?
📊 TRADE DETAILS
- Pair: XRPUSDT Perpetual
- Direction: BUY / LONG 🟢
- Entry Price: $1.2493
- Current Price: $1.2581
- Take Profit (TP): $1.3500
- Current Unrealized PNL: +3.56 USDT
- Current ROI: +52.79%
- Leverage: 75x
🎯 MY TARGET: $1.3500
XRP is showing positive movement from my entry level. My target is $1.3500, which represents approximately 8% upside from the entry price.
My Trading Strategy:
1. Holding the LONG position while monitoring price action.
2. Watching for bullish momentum and continuation.
3. Monitoring support levels to protect the trade.
4. Taking profit at my planned target of $1.3500.
⚠️ RISK MANAGEMENT
This is a demo trade, and 75x leverage carries extremely high risk in live trading. A small adverse price movement can significantly affect the position. A proper stop-loss is essential.
💭 MY OPINION
I believe $1.3500 is a worthwhile target to monitor, but price confirmation matters more than predictions. I will remain patient and let the market decide.
#XRP #XRPUSDT #CryptoTrading #Binance #Altcoins #TradingStrategy #DemoTrading
🚀 XRPUSDT LONG TRADE UPDATE – TARGET $1.3500! 📈
$XRP
🔥 What do you think? Can XRP reach $1.3500?
📊 TRADE DETAILS
- Pair: XRPUSDT Perpetual
- Direction: BUY / LONG 🟢
- Entry Price: $1.2493
- Current Price: $1.2581
- Take Profit (TP): $1.3500
- Current Unrealized PNL: +3.56 USDT
- Current ROI: +52.79%
- Leverage: 75x
🎯 MY TARGET: $1.3500
XRP is showing positive movement from my entry level. My target is $1.3500, which represents approximately 8% upside from the entry price.
My Trading Strategy:
1. Holding the LONG position while monitoring price action.
2. Watching for bullish momentum and continuation.
3. Monitoring support levels to protect the trade.
4. Taking profit at my planned target of $1.3500.
⚠️ RISK MANAGEMENT
This is a demo trade, and 75x leverage carries extremely high risk in live trading. A small adverse price movement can significantly affect the position. A proper stop-loss is essential.
💭 MY OPINION
I believe $1.3500 is a worthwhile target to monitor, but price confirmation matters more than predictions. I will remain patient and let the market decide.
#XRP #XRPUSDT #CryptoTrading #Binance #Altcoins #TradingStrategy #DemoTrading
$XRP
🔥 What do you think? Can XRP reach $1.3500?
📊 TRADE DETAILS
- Pair: XRPUSDT Perpetual
- Direction: BUY / LONG 🟢
- Entry Price: $1.2493
- Current Price: $1.2581
- Take Profit (TP): $1.3500
- Current Unrealized PNL: +3.56 USDT
- Current ROI: +52.79%
- Leverage: 75x
🎯 MY TARGET: $1.3500
XRP is showing positive movement from my entry level. My target is $1.3500, which represents approximately 8% upside from the entry price.
My Trading Strategy:
1. Holding the LONG position while monitoring price action.
2. Watching for bullish momentum and continuation.
3. Monitoring support levels to protect the trade.
4. Taking profit at my planned target of $1.3500.
⚠️ RISK MANAGEMENT
This is a demo trade, and 75x leverage carries extremely high risk in live trading. A small adverse price movement can significantly affect the position. A proper stop-loss is essential.
💭 MY OPINION
I believe $1.3500 is a worthwhile target to monitor, but price confirmation matters more than predictions. I will remain patient and let the market decide.
#XRP #XRPUSDT #CryptoTrading #Binance #Altcoins #TradingStrategy #DemoTrading
348
🥈 SILVER/USDT – BUY SIGNAL 🚀 | POTENTIAL UPSIDE AHEAD!Silver is showing a potential bullish opportunity. Traders can watch the 49.40 entry zone for a possible upward move toward the next resistance levels.
📊 Trading Setup
🔹 Pair: SILVER/USDT
🔹 Platform: MEXC
🟢 Buy Entry: 49.40
🎯 Take Profit Targets:
- TP1: 49.90
- TP2: 50.50
- TP3: 53.90
🛑 Stop Loss: 48.00
📈 Trade Strategy:
- Wait for price confirmation around the entry zone.
- Consider securing partial profits at TP1 and TP2.
- Let the remaining position target TP3 if bullish momentum continues.
- Always respect your stop loss and manage risk.
⚠️ Risk Management: Never risk more than you can afford to lose. Avoid entering blindly, and remember that market conditions can change quickly.
💬 **What is your target for Silver? TP1, TP2, or TP3?
#SILVER #SILVERUSDT #TradingSignal #CryptoTrading #MEXC #TechnicalAnalysis #TradingPapa
🥈 SILVER/USDT – BUY SIGNAL 🚀 | POTENTIAL UPSIDE AHEAD!
Silver is showing a potential bullish opportunity. Traders can watch the 49.40 entry zone for a possible upward move toward the next resistance levels.
📊 Trading Setup
🔹 Pair: SILVER/USDT
🔹 Platform: MEXC
🟢 Buy Entry: 49.40
🎯 Take Profit Targets:
- TP1: 49.90
- TP2: 50.50
- TP3: 53.90
🛑 Stop Loss: 48.00
📈 Trade Strategy:
- Wait for price confirmation around the entry zone.
- Consider securing partial profits at TP1 and TP2.
- Let the remaining position target TP3 if bullish momentum continues.
- Always respect your stop loss and manage risk.
⚠️ Risk Management: Never risk more than you can afford to lose. Avoid entering blindly, and remember that market conditions can change quickly.
💬 **What is your target for Silver? TP1, TP2, or TP3?
#SILVER #SILVERUSDT #TradingSignal #CryptoTrading #MEXC #TechnicalAnalysis #TradingPapa
📊 Trading Setup
🔹 Pair: SILVER/USDT
🔹 Platform: MEXC
🟢 Buy Entry: 49.40
🎯 Take Profit Targets:
- TP1: 49.90
- TP2: 50.50
- TP3: 53.90
🛑 Stop Loss: 48.00
📈 Trade Strategy:
- Wait for price confirmation around the entry zone.
- Consider securing partial profits at TP1 and TP2.
- Let the remaining position target TP3 if bullish momentum continues.
- Always respect your stop loss and manage risk.
⚠️ Risk Management: Never risk more than you can afford to lose. Avoid entering blindly, and remember that market conditions can change quickly.
💬 **What is your target for Silver? TP1, TP2, or TP3?
#SILVER #SILVERUSDT #TradingSignal #CryptoTrading #MEXC #TechnicalAnalysis #TradingPapa
210
🚨 BITCOIN (BTC) MARKET ANALYSIS – BEARISH STRUCTURE, RELIEF BOUNCE POSSIBLE!📉 Current Price: $77,243
$BTC
Bitcoin has broken down from its rising channel, indicating a shift toward a bearish market structure. However, technical indicators suggest that a short-term relief bounce may still be possible.
🔍 Key Technical Observations:
1️⃣ Bearish Market Structure: BTC has broken below its rising channel, showing increasing selling pressure.
2️⃣ Consolidation: Price is currently consolidating around $77,243 as the market searches for its next direction.
3️⃣ RSI Bullish Divergence: RSI is showing bullish divergence, suggesting a potential short-term recovery.
4️⃣ Momentum Check: RSI remains below 50, meaning bullish momentum is not yet confirmed.
🎯 Important Trading Levels:
🔴 Preferred Short Zone: $77,800 – $78,400
Wait for price to enter this zone and show clear rejection before considering a short position.
🟢 Bullish Confirmation: $78,500
A successful reclaim and retest of $78,500 could create an opportunity for a potential long setup.
⚠️ TRADING STRATEGY:
- Avoid entering short blindly at the current price.
- Wait for a pullback and bearish rejection confirmation.
- Don't chase the market during consolidation.
- Always use a proper stop-loss and manage risk.
📌 Final Outlook:
BTC remains bearish from a market-structure perspective, but RSI divergence leaves room for a temporary relief bounce.
Patience is the key. Wait for confirmation instead of predicting the next move.
#Bitcoin #BTC #CryptoAnalysis #TechnicalAnalysis #BitcoinTrading #CryptoMarket #Binance
{future}(BTCUSDT)
🚨 BITCOIN (BTC) MARKET ANALYSIS – BEARISH STRUCTURE, RELIEF BOUNCE POSSIBLE!
📉 Current Price: $77,243
$BTC
Bitcoin has broken down from its rising channel, indicating a shift toward a bearish market structure. However, technical indicators suggest that a short-term relief bounce may still be possible.
🔍 Key Technical Observations:
1️⃣ Bearish Market Structure: BTC has broken below its rising channel, showing increasing selling pressure.
2️⃣ Consolidation: Price is currently consolidating around $77,243 as the market searches for its next direction.
3️⃣ RSI Bullish Divergence: RSI is showing bullish divergence, suggesting a potential short-term recovery.
4️⃣ Momentum Check: RSI remains below 50, meaning bullish momentum is not yet confirmed.
🎯 Important Trading Levels:
🔴 Preferred Short Zone: $77,800 – $78,400
Wait for price to enter this zone and show clear rejection before considering a short position.
🟢 Bullish Confirmation: $78,500
A successful reclaim and retest of $78,500 could create an opportunity for a potential long setup.
⚠️ TRADING STRATEGY:
- Avoid entering short blindly at the current price.
- Wait for a pullback and bearish rejection confirmation.
- Don't chase the market during consolidation.
- Always use a proper stop-loss and manage risk.
📌 Final Outlook:
BTC remains bearish from a market-structure perspective, but RSI divergence leaves room for a temporary relief bounce.
Patience is the key. Wait for confirmation instead of predicting the next move.
#Bitcoin #BTC #CryptoAnalysis #TechnicalAnalysis #BitcoinTrading #CryptoMarket #Binance
$BTC
Bitcoin has broken down from its rising channel, indicating a shift toward a bearish market structure. However, technical indicators suggest that a short-term relief bounce may still be possible.
🔍 Key Technical Observations:
1️⃣ Bearish Market Structure: BTC has broken below its rising channel, showing increasing selling pressure.
2️⃣ Consolidation: Price is currently consolidating around $77,243 as the market searches for its next direction.
3️⃣ RSI Bullish Divergence: RSI is showing bullish divergence, suggesting a potential short-term recovery.
4️⃣ Momentum Check: RSI remains below 50, meaning bullish momentum is not yet confirmed.
🎯 Important Trading Levels:
🔴 Preferred Short Zone: $77,800 – $78,400
Wait for price to enter this zone and show clear rejection before considering a short position.
🟢 Bullish Confirmation: $78,500
A successful reclaim and retest of $78,500 could create an opportunity for a potential long setup.
⚠️ TRADING STRATEGY:
- Avoid entering short blindly at the current price.
- Wait for a pullback and bearish rejection confirmation.
- Don't chase the market during consolidation.
- Always use a proper stop-loss and manage risk.
📌 Final Outlook:
BTC remains bearish from a market-structure perspective, but RSI divergence leaves room for a temporary relief bounce.
Patience is the key. Wait for confirmation instead of predicting the next move.
#Bitcoin #BTC #CryptoAnalysis #TechnicalAnalysis #BitcoinTrading #CryptoMarket #Binance
72
🚀 XRP SPOT BUY – ACCUMULATION OPPORTUNITY?I'm looking at XRP for a potential spot buying opportunity at the current market level.
💎 Asset: XRP/USDT
📊 Strategy: Spot Buying
📍 Entry Zone: Current market price (around $1.25)
⏳ Holding: Short to Medium Term
📈 Why I'm Watching XRP
1. Potential Recovery: XRP may attempt a recovery after its recent price decline.
2. Key Support: The $1.20–$1.22 region is an important area to monitor for buying interest.
3. Market Opportunity: Current weakness could provide an opportunity for long-term spot accumulation.
4. Ripple Developments: Institutional and regulatory developments continue to keep XRP in focus.
🎯 Important Price Levels
- Support: $1.20–$1.22
- Resistance 1: $1.30
- Resistance 2: $1.33
- Resistance 3: $1.40
💡 My Strategy
I'm considering accumulating XRP through spot buying rather than using leverage.
Instead of investing the entire amount at once, consider buying in multiple portions to manage volatility.
A strong recovery above resistance levels, supported by volume, could improve the bullish outlook.
⚠️ Risk Management: If XRP breaks below key support, reassess the buying strategy. Never invest money you cannot afford to lose.
What's your opinion? Is XRP preparing for a recovery, or could we see another dip before the next rally?
$XRP
👇 Share your thoughts in the comments!
{spot}(XRPUSDT)
#XRP #Ripple #XRPUSDT #CryptoTrading #SpotTrading #BinanceSquare #CryptoMarket
🚀 XRP SPOT BUY – ACCUMULATION OPPORTUNITY?
I'm looking at XRP for a potential spot buying opportunity at the current market level.
💎 Asset: XRP/USDT
📊 Strategy: Spot Buying
📍 Entry Zone: Current market price (around $1.25)
⏳ Holding: Short to Medium Term
📈 Why I'm Watching XRP
1. Potential Recovery: XRP may attempt a recovery after its recent price decline.
2. Key Support: The $1.20–$1.22 region is an important area to monitor for buying interest.
3. Market Opportunity: Current weakness could provide an opportunity for long-term spot accumulation.
4. Ripple Developments: Institutional and regulatory developments continue to keep XRP in focus.
🎯 Important Price Levels
- Support: $1.20–$1.22
- Resistance 1: $1.30
- Resistance 2: $1.33
- Resistance 3: $1.40
💡 My Strategy
I'm considering accumulating XRP through spot buying rather than using leverage.
Instead of investing the entire amount at once, consider buying in multiple portions to manage volatility.
A strong recovery above resistance levels, supported by volume, could improve the bullish outlook.
⚠️ Risk Management: If XRP breaks below key support, reassess the buying strategy. Never invest money you cannot afford to lose.
What's your opinion? Is XRP preparing for a recovery, or could we see another dip before the next rally?
$XRP
👇 Share your thoughts in the comments!
#XRP #Ripple #XRPUSDT #CryptoTrading #SpotTrading #BinanceSquare #CryptoMarket
💎 Asset: XRP/USDT
📊 Strategy: Spot Buying
📍 Entry Zone: Current market price (around $1.25)
⏳ Holding: Short to Medium Term
📈 Why I'm Watching XRP
1. Potential Recovery: XRP may attempt a recovery after its recent price decline.
2. Key Support: The $1.20–$1.22 region is an important area to monitor for buying interest.
3. Market Opportunity: Current weakness could provide an opportunity for long-term spot accumulation.
4. Ripple Developments: Institutional and regulatory developments continue to keep XRP in focus.
🎯 Important Price Levels
- Support: $1.20–$1.22
- Resistance 1: $1.30
- Resistance 2: $1.33
- Resistance 3: $1.40
💡 My Strategy
I'm considering accumulating XRP through spot buying rather than using leverage.
Instead of investing the entire amount at once, consider buying in multiple portions to manage volatility.
A strong recovery above resistance levels, supported by volume, could improve the bullish outlook.
⚠️ Risk Management: If XRP breaks below key support, reassess the buying strategy. Never invest money you cannot afford to lose.
What's your opinion? Is XRP preparing for a recovery, or could we see another dip before the next rally?
$XRP
👇 Share your thoughts in the comments!
#XRP #Ripple #XRPUSDT #CryptoTrading #SpotTrading #BinanceSquare #CryptoMarket
1
1
723
SL Hit but setup is now still valid
Mangae your Risk Always 🔥
SL Hit but setup is now still valid
Mangae your Risk Always 🔥
Mangae your Risk Always 🔥
431
🚨 BINANCE SECURITY ALERT: TRADERS URGED TO STAY CALM AND PROTECT CAPITALThe crypto market is facing uncertainty following reports of a major Binance security incident, with an estimated impact of $6.3 billion.
According to the update being circulated:
- Approximately $3 billion in affected assets has reportedly been frozen.
- Binance has reportedly committed to covering losses through its SAFU fund and company resources.
- Withdrawals are reported to be temporarily paused amid security checks.
- Deposits are reported to be operating normally.
📊 What Should Traders Do Now?
During uncertain market conditions, protecting your capital should be your top priority.
1. Avoid Excessive Leverage: High leverage can increase liquidation risk during volatile market conditions.
2. Don't Revenge Trade: Never enter trades emotionally to recover previous losses.
3. Avoid FOMO: Don't chase sudden price movements without proper confirmation.
4. Use Stop Losses: Always define your risk before entering a trade.
5. Stay Alert: Avoid suspicious links, fake announcements, and anyone requesting your OTP, password, or recovery codes.
6. Wait for Confirmation: Let the market stabilize before taking high-risk positions.
💡 Final Thoughts
Remember, the market will always provide new opportunities. Missing one trade is better than losing your trading capital.
Professional traders understand that survival comes before profitability.
Protect Your Capital. Control Your Emotions. Follow Your Strategy.
Stay calm, stay disciplined, and trade smart! 💪
$BTC $SOL $BNB
#Binance #CryptoMarket #CryptoNews #Bitcoin #TradingPsychology #RiskManagement #SAFU #CryptoTrading
🚨 BINANCE SECURITY ALERT: TRADERS URGED TO STAY CALM AND PROTECT CAPITAL
The crypto market is facing uncertainty following reports of a major Binance security incident, with an estimated impact of $6.3 billion.
According to the update being circulated:
- Approximately $3 billion in affected assets has reportedly been frozen.
- Binance has reportedly committed to covering losses through its SAFU fund and company resources.
- Withdrawals are reported to be temporarily paused amid security checks.
- Deposits are reported to be operating normally.
📊 What Should Traders Do Now?
During uncertain market conditions, protecting your capital should be your top priority.
1. Avoid Excessive Leverage: High leverage can increase liquidation risk during volatile market conditions.
2. Don't Revenge Trade: Never enter trades emotionally to recover previous losses.
3. Avoid FOMO: Don't chase sudden price movements without proper confirmation.
4. Use Stop Losses: Always define your risk before entering a trade.
5. Stay Alert: Avoid suspicious links, fake announcements, and anyone requesting your OTP, password, or recovery codes.
6. Wait for Confirmation: Let the market stabilize before taking high-risk positions.
💡 Final Thoughts
Remember, the market will always provide new opportunities. Missing one trade is better than losing your trading capital.
Professional traders understand that survival comes before profitability.
Protect Your Capital. Control Your Emotions. Follow Your Strategy.
Stay calm, stay disciplined, and trade smart! 💪
$BTC $SOL $BNB
#Binance #CryptoMarket #CryptoNews #Bitcoin #TradingPsychology #RiskManagement #SAFU #CryptoTrading
According to the update being circulated:
- Approximately $3 billion in affected assets has reportedly been frozen.
- Binance has reportedly committed to covering losses through its SAFU fund and company resources.
- Withdrawals are reported to be temporarily paused amid security checks.
- Deposits are reported to be operating normally.
📊 What Should Traders Do Now?
During uncertain market conditions, protecting your capital should be your top priority.
1. Avoid Excessive Leverage: High leverage can increase liquidation risk during volatile market conditions.
2. Don't Revenge Trade: Never enter trades emotionally to recover previous losses.
3. Avoid FOMO: Don't chase sudden price movements without proper confirmation.
4. Use Stop Losses: Always define your risk before entering a trade.
5. Stay Alert: Avoid suspicious links, fake announcements, and anyone requesting your OTP, password, or recovery codes.
6. Wait for Confirmation: Let the market stabilize before taking high-risk positions.
💡 Final Thoughts
Remember, the market will always provide new opportunities. Missing one trade is better than losing your trading capital.
Professional traders understand that survival comes before profitability.
Protect Your Capital. Control Your Emotions. Follow Your Strategy.
Stay calm, stay disciplined, and trade smart! 💪
$BTC $SOL $BNB
#Binance #CryptoMarket #CryptoNews #Bitcoin #TradingPsychology #RiskManagement #SAFU #CryptoTrading
129
🚀 RLCUSDT.P — BUY SETUP | POTENTIAL UPSIDE
📈📈 Trade Idea: LONG (BUY)
Keep an eye on RLCUSDT.P for a potential bullish move. Here are the planned entry zone, stop loss, and take-profit levels.
🟢 Entry Zone: 0.5120 – 0.5170
🛑 Stop Loss: 0.4858
🎯 Take-Profit Targets:
- TP1: 0.5230
- TP2: 0.6320
- TP3: 0.7400
💡 Trade Management:
✅ Consider securing partial profits at TP1.
✅ Manage risk carefully and protect your capital.
✅ Always use a stop loss and avoid risking too much on a single trade.
⚠️ Risk Warning: This is a trading idea, not a guarantee of profit. Cryptocurrency perpetual futures carry significant risk, and the setup may fail. Do your own research before entering.
🔥 Follow for more crypto setups, technical analysis, and trading ideas!
#RLCUSDT #RLC #CryptoTrading #BinanceFutures #TradingSignals #TechnicalAnalysis #Altcoins #CryptoMarket
$RLC
{future}(RLCUSDT)
🚀 RLCUSDT.P — BUY SETUP | POTENTIAL UPSIDE 📈
📈 Trade Idea: LONG (BUY)
Keep an eye on RLCUSDT.P for a potential bullish move. Here are the planned entry zone, stop loss, and take-profit levels.
🟢 Entry Zone: 0.5120 – 0.5170
🛑 Stop Loss: 0.4858
🎯 Take-Profit Targets:
- TP1: 0.5230
- TP2: 0.6320
- TP3: 0.7400
💡 Trade Management:
✅ Consider securing partial profits at TP1.
✅ Manage risk carefully and protect your capital.
✅ Always use a stop loss and avoid risking too much on a single trade.
⚠️ Risk Warning: This is a trading idea, not a guarantee of profit. Cryptocurrency perpetual futures carry significant risk, and the setup may fail. Do your own research before entering.
🔥 Follow for more crypto setups, technical analysis, and trading ideas!
#RLCUSDT #RLC #CryptoTrading #BinanceFutures #TradingSignals #TechnicalAnalysis #Altcoins #CryptoMarket
$RLC
Keep an eye on RLCUSDT.P for a potential bullish move. Here are the planned entry zone, stop loss, and take-profit levels.
🟢 Entry Zone: 0.5120 – 0.5170
🛑 Stop Loss: 0.4858
🎯 Take-Profit Targets:
- TP1: 0.5230
- TP2: 0.6320
- TP3: 0.7400
💡 Trade Management:
✅ Consider securing partial profits at TP1.
✅ Manage risk carefully and protect your capital.
✅ Always use a stop loss and avoid risking too much on a single trade.
⚠️ Risk Warning: This is a trading idea, not a guarantee of profit. Cryptocurrency perpetual futures carry significant risk, and the setup may fail. Do your own research before entering.
🔥 Follow for more crypto setups, technical analysis, and trading ideas!
#RLCUSDT #RLC #CryptoTrading #BinanceFutures #TradingSignals #TechnicalAnalysis #Altcoins #CryptoMarket
$RLC
234
Статья
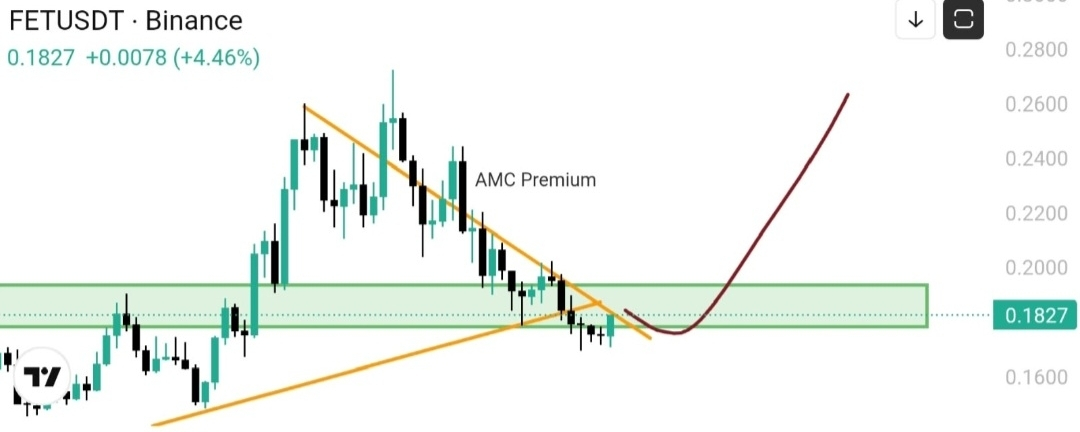
FET Buy setup 🚀🔥🔥Title: Is FET Bottoming Out at $0.1827? Here’s Why I’m Watching This Setup Closely 🧐
FET is currently trading around $0.1827, up +4.46% in the last 24 hours. Looking at the chart, we are seeing a very familiar pattern playing out: a descending wedge hitting a major demand zone.
Here is my honest take on this setup: We are at a critical inflection point, and I’m leaning toward a bounce.
🔍 Why This Chart Matters
The yellow descending trendline has been heavily suppressing FET’s price, but the lower orange support line is simultaneously pushing up. These two are converging right into the green demand zone (roughly the $0.17–$0.19 range). The price is currently chopping around inside this zone without breaking down, which signals that sellers are exhausting.
The red curved arrow I drew isn't random—if we hold this support, my next targets are $0.22–$0.24, with the potential to push toward previous highs.
📈 My Trading Plan
I don't recommend chasing pumps or panic selling. Here is how I’m personally playing this:
· Entry: Scaling in on dips between $0.175–$0.185.
· Stop Loss: Strictly below $0.165.
· Take Profit: First target at $0.22**, second target at **$0.24.
If we break below the green zone and fail to reclaim it, this structure is invalidated, and I’ll cut my losses. This is a technical trade, not blind faith.
⚠️ Risk Warning
FET is known for its volatility. The AI narrative can pump hard, but it can dump just as fast. Position sizing is always more important than directional bias. This is just my personal chart analysis—not financial advice. Always DYOR (Do Your Own Research).
What do you guys think? Will FET hold the $0.18 level, or are we going to test $0.16? Let’s discuss in the comments! 👇🔥
$FET
{spot}(FETUSDT)
FET Buy setup 🚀🔥🔥
Title: Is FET Bottoming Out at $0.1827? Here’s Why I’m Watching This Setup Closely 🧐
FET is currently trading around $0.1827, up +4.46% in the last 24 hours. Looking at the chart, we are seeing a very familiar pattern playing out: a descending wedge hitting a major demand zone.
Here is my honest take on this setup: We are at a critical inflection point, and I’m leaning toward a bounce.
🔍 Why This Chart Matters
The yellow descending trendline has been heavily suppressing FET’s price, but the lower orange support line is simultaneously pushing up. These two are converging right into the green demand zone (roughly the $0.17–$0.19 range). The price is currently chopping around inside this zone without breaking down, which signals that sellers are exhausting.
The red curved arrow I drew isn't random—if we hold this support, my next targets are $0.22–$0.24, with the potential to push toward previous highs.
📈 My Trading Plan
I don't recommend chasing pumps or panic selling. Here is how I’m personally playing this:
· Entry: Scaling in on dips between $0.175–$0.185.
· Stop Loss: Strictly below $0.165.
· Take Profit: First target at $0.22**, second target at **$0.24.
If we break below the green zone and fail to reclaim it, this structure is invalidated, and I’ll cut my losses. This is a technical trade, not blind faith.
⚠️ Risk Warning
FET is known for its volatility. The AI narrative can pump hard, but it can dump just as fast. Position sizing is always more important than directional bias. This is just my personal chart analysis—not financial advice. Always DYOR (Do Your Own Research).
What do you guys think? Will FET hold the $0.18 level, or are we going to test $0.16? Let’s discuss in the comments! 👇🔥
$FET
FET is currently trading around $0.1827, up +4.46% in the last 24 hours. Looking at the chart, we are seeing a very familiar pattern playing out: a descending wedge hitting a major demand zone.
Here is my honest take on this setup: We are at a critical inflection point, and I’m leaning toward a bounce.
🔍 Why This Chart Matters
The yellow descending trendline has been heavily suppressing FET’s price, but the lower orange support line is simultaneously pushing up. These two are converging right into the green demand zone (roughly the $0.17–$0.19 range). The price is currently chopping around inside this zone without breaking down, which signals that sellers are exhausting.
The red curved arrow I drew isn't random—if we hold this support, my next targets are $0.22–$0.24, with the potential to push toward previous highs.
📈 My Trading Plan
I don't recommend chasing pumps or panic selling. Here is how I’m personally playing this:
· Entry: Scaling in on dips between $0.175–$0.185.
· Stop Loss: Strictly below $0.165.
· Take Profit: First target at $0.22**, second target at **$0.24.
If we break below the green zone and fail to reclaim it, this structure is invalidated, and I’ll cut my losses. This is a technical trade, not blind faith.
⚠️ Risk Warning
FET is known for its volatility. The AI narrative can pump hard, but it can dump just as fast. Position sizing is always more important than directional bias. This is just my personal chart analysis—not financial advice. Always DYOR (Do Your Own Research).
What do you guys think? Will FET hold the $0.18 level, or are we going to test $0.16? Let’s discuss in the comments! 👇🔥
$FET
1
341
🔴 SPCX Short Setup: Why This Rally Into Resistance Deserves Your AttentionSPCX is flashing a textbook short opportunity, and the chart is giving us a clear roadmap. After a brutal slide from the $176 highs earlier this month, price has bounced weakly into a heavy supply zone. This isn’t a call to blindly short strength—it’s a tactical play on a lower high forming beneath key resistance.
Here is the exact breakdown.
📍 The Trade Setup
· Entry Zone: 163.00 – 164.50
· TP1: 160.70
· TP2: 158.70
· TP3: 154.50
· Stop Loss: 168.80
🧠 Why This Setup Makes Sense (The “Why”)
The daily chart for SPCX tells a story of distribution. Since topping out near $176 on October 6, the stock has been making lower highs and lower lows . The recent bounce from the $143 lows is approaching a critical confluence of resistance.
1. The Falling Knife: The move from $176 to $143 was sharp and accompanied by heavy volume, signaling genuine selling pressure, not just a pullback . Rallies after such drops are often sold into by trapped buyers looking to break even.
2. The 163–164 Zone: This area aligns with the breakdown point from October 12 and the prior support that has now flipped to resistance . If bulls can’t reclaim this level decisively, the path of least resistance remains down.
3. Fundamental Headwind: While SpaceX’s Q2 revenue growth was impressive (up 92%), the valuation is stretched with a price-to-sales ratio near 68x . In a market that is increasingly scrutinizing AI and tech valuations, any rally into resistance is likely to face institutional selling pressure.
🛡️ Risk Management (Non-Negotiable)
The stop loss at 168.80 is placed above the recent swing high structure. If price reclaims this level, the short thesis is invalidated, and we step aside. This setup offers a favorable risk-to-reward ratio, targeting the recent lows near 154.50 if momentum resumes.
📉 The Verdict
This is a momentum short into a resistance zone. Do not chase the entry if price runs past 165 without a clear rejection. Wait for the price action to confirm the rejection at the 163–164 level before executing. If we see a strong hourly close above 165, stand down—the bulls might be taking control.
Disclaimer: This is technical analysis, not financial advice. Always do your own research and manage your risk. Trading leveraged products carries significant risk of loss.
#SPCX #ShortSetup #TechnicalAnalysis #TradingStrategy
$SPCXB
{spot}(SPCXBUSDT)
🔴 SPCX Short Setup: Why This Rally Into Resistance Deserves Your Attention
SPCX is flashing a textbook short opportunity, and the chart is giving us a clear roadmap. After a brutal slide from the $176 highs earlier this month, price has bounced weakly into a heavy supply zone. This isn’t a call to blindly short strength—it’s a tactical play on a lower high forming beneath key resistance.
Here is the exact breakdown.
📍 The Trade Setup
· Entry Zone: 163.00 – 164.50
· TP1: 160.70
· TP2: 158.70
· TP3: 154.50
· Stop Loss: 168.80
🧠 Why This Setup Makes Sense (The “Why”)
The daily chart for SPCX tells a story of distribution. Since topping out near $176 on October 6, the stock has been making lower highs and lower lows . The recent bounce from the $143 lows is approaching a critical confluence of resistance.
1. The Falling Knife: The move from $176 to $143 was sharp and accompanied by heavy volume, signaling genuine selling pressure, not just a pullback . Rallies after such drops are often sold into by trapped buyers looking to break even.
2. The 163–164 Zone: This area aligns with the breakdown point from October 12 and the prior support that has now flipped to resistance . If bulls can’t reclaim this level decisively, the path of least resistance remains down.
3. Fundamental Headwind: While SpaceX’s Q2 revenue growth was impressive (up 92%), the valuation is stretched with a price-to-sales ratio near 68x . In a market that is increasingly scrutinizing AI and tech valuations, any rally into resistance is likely to face institutional selling pressure.
🛡️ Risk Management (Non-Negotiable)
The stop loss at 168.80 is placed above the recent swing high structure. If price reclaims this level, the short thesis is invalidated, and we step aside. This setup offers a favorable risk-to-reward ratio, targeting the recent lows near 154.50 if momentum resumes.
📉 The Verdict
This is a momentum short into a resistance zone. Do not chase the entry if price runs past 165 without a clear rejection. Wait for the price action to confirm the rejection at the 163–164 level before executing. If we see a strong hourly close above 165, stand down—the bulls might be taking control.
Disclaimer: This is technical analysis, not financial advice. Always do your own research and manage your risk. Trading leveraged products carries significant risk of loss.
#SPCX #ShortSetup #TechnicalAnalysis #TradingStrategy
$SPCXB
Here is the exact breakdown.
📍 The Trade Setup
· Entry Zone: 163.00 – 164.50
· TP1: 160.70
· TP2: 158.70
· TP3: 154.50
· Stop Loss: 168.80
🧠 Why This Setup Makes Sense (The “Why”)
The daily chart for SPCX tells a story of distribution. Since topping out near $176 on October 6, the stock has been making lower highs and lower lows . The recent bounce from the $143 lows is approaching a critical confluence of resistance.
1. The Falling Knife: The move from $176 to $143 was sharp and accompanied by heavy volume, signaling genuine selling pressure, not just a pullback . Rallies after such drops are often sold into by trapped buyers looking to break even.
2. The 163–164 Zone: This area aligns with the breakdown point from October 12 and the prior support that has now flipped to resistance . If bulls can’t reclaim this level decisively, the path of least resistance remains down.
3. Fundamental Headwind: While SpaceX’s Q2 revenue growth was impressive (up 92%), the valuation is stretched with a price-to-sales ratio near 68x . In a market that is increasingly scrutinizing AI and tech valuations, any rally into resistance is likely to face institutional selling pressure.
🛡️ Risk Management (Non-Negotiable)
The stop loss at 168.80 is placed above the recent swing high structure. If price reclaims this level, the short thesis is invalidated, and we step aside. This setup offers a favorable risk-to-reward ratio, targeting the recent lows near 154.50 if momentum resumes.
📉 The Verdict
This is a momentum short into a resistance zone. Do not chase the entry if price runs past 165 without a clear rejection. Wait for the price action to confirm the rejection at the 163–164 level before executing. If we see a strong hourly close above 165, stand down—the bulls might be taking control.
Disclaimer: This is technical analysis, not financial advice. Always do your own research and manage your risk. Trading leveraged products carries significant risk of loss.
#SPCX #ShortSetup #TechnicalAnalysis #TradingStrategy
$SPCXB
79
Войдите, чтобы посмотреть больше материала
Присоединяйтесь к пользователям криптовалют по всему миру на Binance Square
⚡️ Получайте новейшую и полезную информацию о криптоактивах.
💬 Нам доверяет крупнейшая в мире криптобиржа.
👍 Получите достоверные аналитические данные от верифицированных создателей контента.
Эл. почта/номер телефона
В тренде
BTCRebounds80K
Просмотров: 47,245
618 обсуждают
BITCOIN UPDATE I’M STILL BEARISH, AND HERE’S WHY! 🚨⚠️
As you all witnessed, BTC bounced back from the $75,700 area and touched $81K. First, the market trapped long traders, and then it trapped short traders.
I’m still bearish. First of all, as everyone knows, Democrats won today’s US midterm elections, and in my view, this outcome is bearish for the market.
The market can remain volatile in the short term and trap as many traders as it wants, but that doesn’t change the overall market outlook.
There are several important upcoming events, including US Non Farm Payrolls (November 6), US CPI Inflation (November 10), US PPI (November 13), US Retail Sales (November 17), FOMC Meeting Minutes (November 18), US PCE Inflation (November 25), Federal Reserve interest rate expectations, the US Dollar Index (DXY), Treasury Yields, Nasdaq performance, Bitcoin ETF flows, and ongoing( Iran ) Israel geopolitical developments. All of these could have a significant impact on Bitcoin and the overall crypto market.
But don’t get too carried away by Bitcoin’s recent movement. Technically speaking, there hasn’t been any major bullish move yet. Yesterday, BTC was trading between $80K and $82K, and even today, it’s still around the same range.
If you want to turn bullish, that’s entirely your choice.
In my previous post, I clearly explained that BTC had technical support in the $75K / $76K zone, and the price bounced from that support and made its way back towards $80K. But this wasn’t something I had failed to mention before. In fact, I repeatedly mentioned in my posts that BTC could move towards $80K, $81K, or even $82K.
Despite that, I’m still bearish.
And I don’t have just one reason to support my bearish outlook. I have several reasons, which I’ve already explained in my previous posts.
For now, I’ll continue to wait for BTC to drop below $74K, which I believe could happen very soon. In my view, such a correction is also necessary for the market.
Anyone looking for crypto guidance just let me know.
#BTCRebounds80K
Strategic Adviser
·Лайков: 22
·Просмотров: 20.2k
Binance98PercentReplenished
Просмотров: 34,487
510 обсуждают
USMidterms-WhatAreMarketsExpecting?
Просмотров: 325,138
2,006 обсуждают