
Title: Is FET Bottoming Out at $0.1827? Here’s Why I’m Watching This Setup Closely 🧐
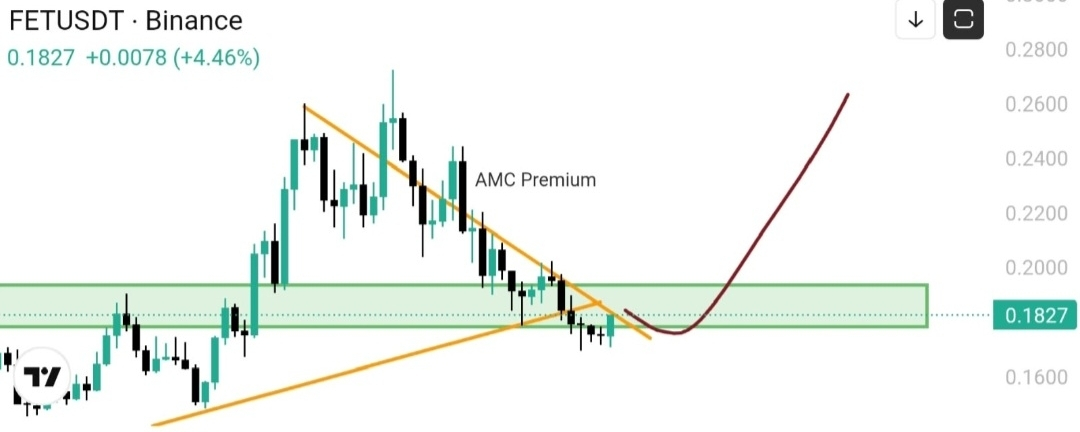
FET is currently trading around $0.1827, up +4.46% in the last 24 hours. Looking at the chart, we are seeing a very familiar pattern playing out: a descending wedge hitting a major demand zone.
Here is my honest take on this setup: We are at a critical inflection point, and I’m leaning toward a bounce.
🔍 Why This Chart Matters
The yellow descending trendline has been heavily suppressing FET’s price, but the lower orange support line is simultaneously pushing up. These two are converging right into the green demand zone (roughly the $0.17–$0.19 range). The price is currently chopping around inside this zone without breaking down, which signals that sellers are exhausting.
The red curved arrow I drew isn't random—if we hold this support, my next targets are $0.22–$0.24, with the potential to push toward previous highs.
📈 My Trading Plan
I don't recommend chasing pumps or panic selling. Here is how I’m personally playing this:
· Entry: Scaling in on dips between $0.175–$0.185.
· Stop Loss: Strictly below $0.165.
· Take Profit: First target at $0.22**, second target at **$0.24.
If we break below the green zone and fail to reclaim it, this structure is invalidated, and I’ll cut my losses. This is a technical trade, not blind faith.
⚠️ Risk Warning
FET is known for its volatility. The AI narrative can pump hard, but it can dump just as fast. Position sizing is always more important than directional bias. This is just my personal chart analysis—not financial advice. Always DYOR (Do Your Own Research).
What do you guys think? Will FET hold the $0.18 level, or are we going to test $0.16? Let’s discuss in the comments! 👇🔥