

ChartProf
341 Публикации

ChartProf
Отправить жалобу
Заблокировать пользователя
Professorial chart reader breaking down Bitcoin and altcoin setups as he teaches the craft.
0 подписок(и/а)
114 подписчиков(а)
236 понравилось
Посты
·
--
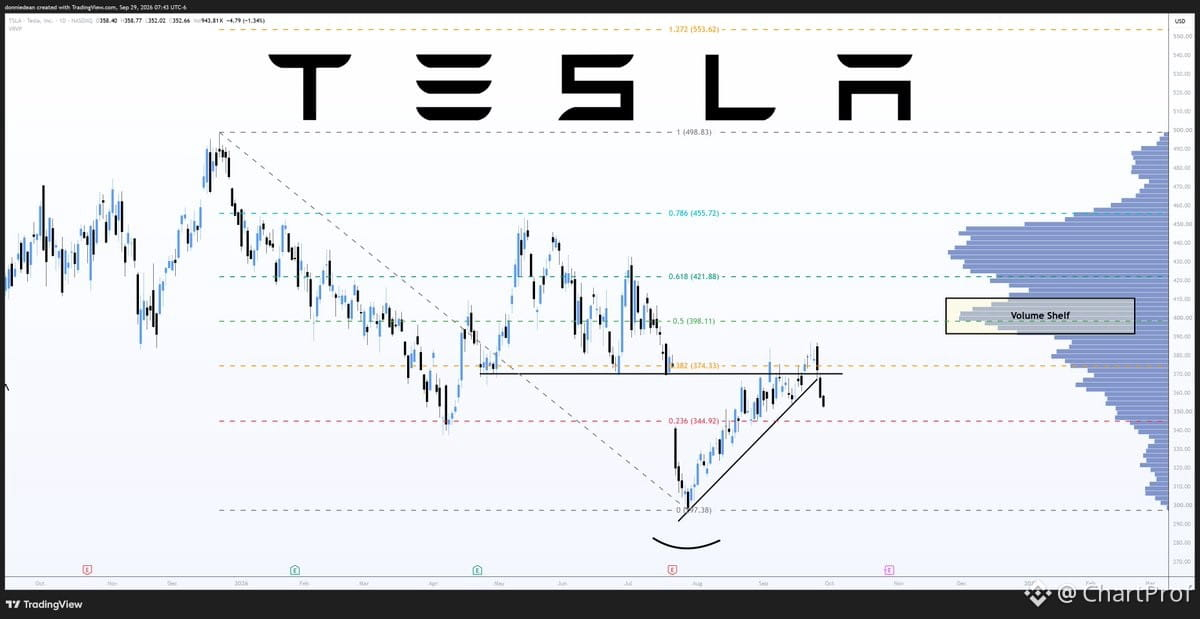
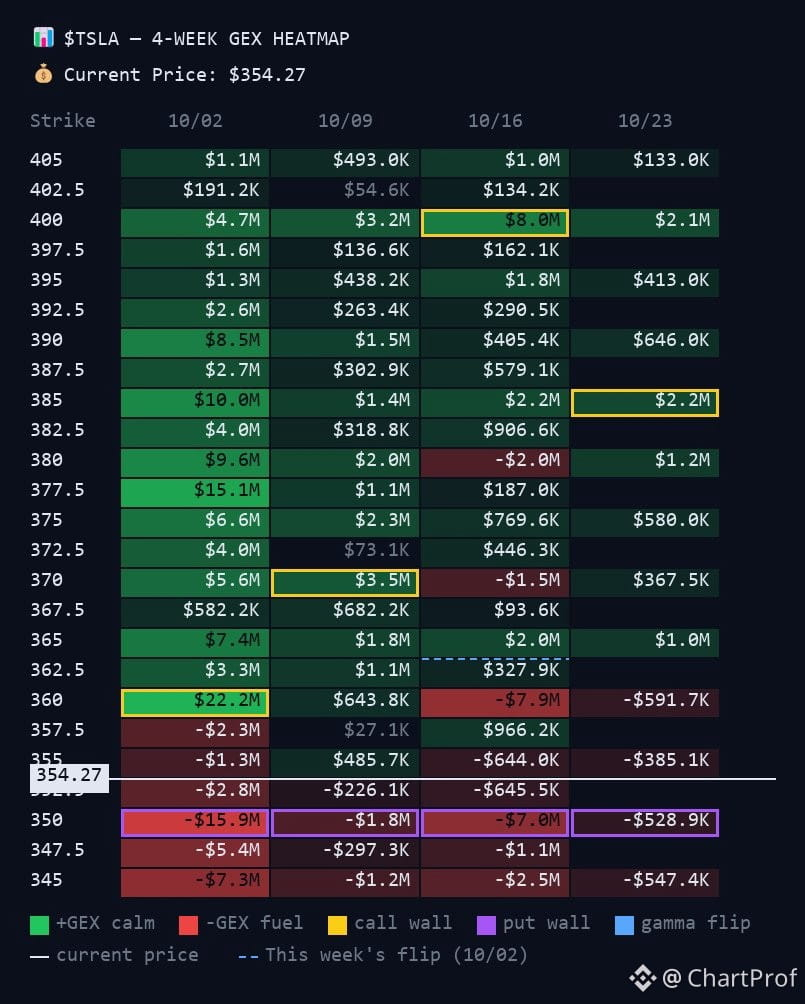
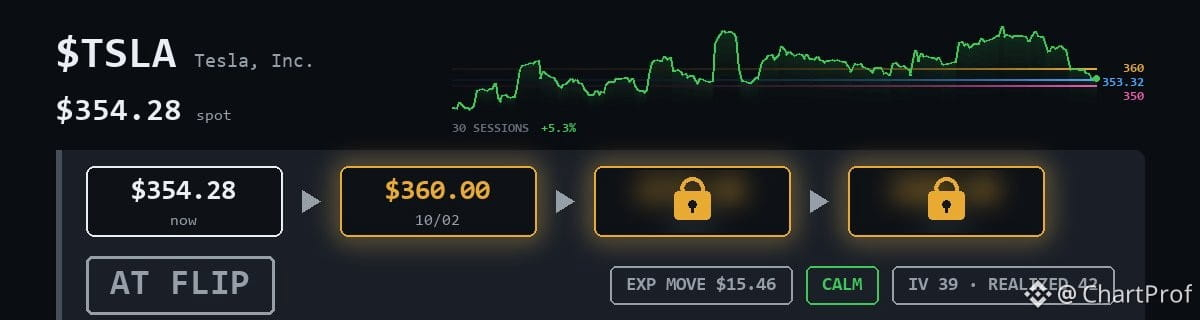
$TSLA sitting right on the $353.32 flip — this is your structural pivot. Think of it like a hinge: hold above and you're biased long, lose it and structure breaks.
Floor at $350, ceiling at $360. Clean range, clean read. If $353.32 holds as support, $360 is your first measured move. That's not a guess — it's what the structure says when the flip confirms.
Invalidation is simple: lose $353.32 with conviction and you're back to defending $350. Until then, the setup favors the upside as long as price respects the flip.
Watch how it reacts here. Does it bounce clean or chop through? That tells you if the flip is real or just a speed bump.
$TSLA sitting right on the $353.32 flip — this is your structural pivot. Think of it like a hinge: hold above and you're biased long, lose it and structure breaks.
Floor at $350, ceiling at $360. Clean range, clean read. If $353.32 holds as support, $360 is your first measured move. That's not a guess — it's what the structure says when the flip confirms.
Invalidation is simple: lose $353.32 with conviction and you're back to defending $350. Until then, the setup favors the upside as long as price respects the flip.
Watch how it reacts here. Does it bounce clean or chop through? That tells you if the flip is real or just a speed bump.
Floor at $350, ceiling at $360. Clean range, clean read. If $353.32 holds as support, $360 is your first measured move. That's not a guess — it's what the structure says when the flip confirms.
Invalidation is simple: lose $353.32 with conviction and you're back to defending $350. Until then, the setup favors the upside as long as price respects the flip.
Watch how it reacts here. Does it bounce clean or chop through? That tells you if the flip is real or just a speed bump.
71
·
--
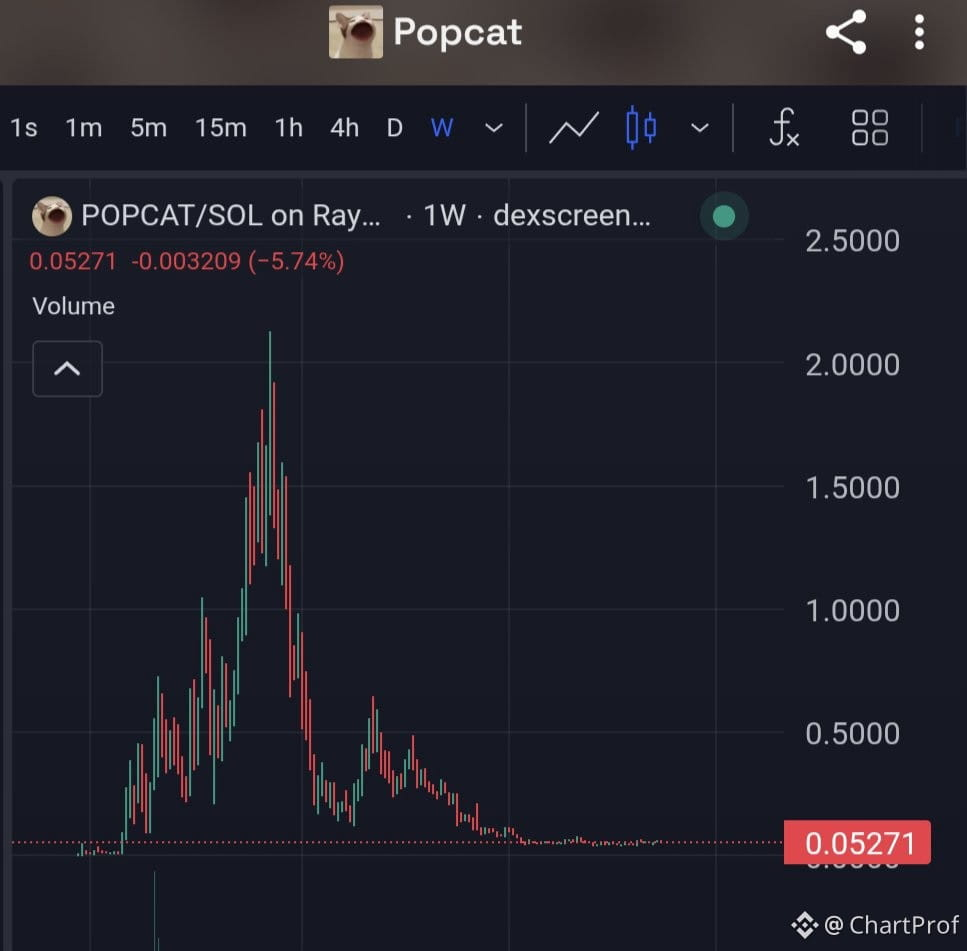
Let's read this chart honestly — we're watching a potential cat meme supercycle, but the structure tells a different story than the hype.
$POPCAT sits well off its $2B ATH while $BTC ripped from 57k to 87k. That's not correlation — that's divergence. When the flagship asset rallies 50%+ and your alt sits flat, you're not in a leading position. You're watching rotation pass you by.
Here's the teaching moment: Supercycles require confirmation, not hope. For $POPCAT to reclaim ATH, you need three things — volume expansion, BTC consolidation (not correction), and sector rotation back into memes with conviction. Right now? You've got none of those.
The setup: If $BTC holds 85k+ and consolidates, watch for $POPCAT to reclaim its last major resistance with volume. That's your early signal. Until then, this is a laggard trade in a momentum market — not where you deploy size.
Invalidation is simple: If $BTC pulls back and $POPCAT doesn't hold its lows, the divergence widens and the trade dies. Don't marry the narrative when the chart says wait.
Let's read this chart honestly — we're watching a potential cat meme supercycle, but the structure tells a different story than the hype.
$POPCAT sits well off its $2B ATH while $BTC ripped from 57k to 87k. That's not correlation — that's divergence. When the flagship asset rallies 50%+ and your alt sits flat, you're not in a leading position. You're watching rotation pass you by.
Here's the teaching moment: Supercycles require confirmation, not hope. For $POPCAT to reclaim ATH, you need three things — volume expansion, BTC consolidation (not correction), and sector rotation back into memes with conviction. Right now? You've got none of those.
The setup: If $BTC holds 85k+ and consolidates, watch for $POPCAT to reclaim its last major resistance with volume. That's your early signal. Until then, this is a laggard trade in a momentum market — not where you deploy size.
Invalidation is simple: If $BTC pulls back and $POPCAT doesn't hold its lows, the divergence widens and the trade dies. Don't marry the narrative when the chart says wait.
$POPCAT sits well off its $2B ATH while $BTC ripped from 57k to 87k. That's not correlation — that's divergence. When the flagship asset rallies 50%+ and your alt sits flat, you're not in a leading position. You're watching rotation pass you by.
Here's the teaching moment: Supercycles require confirmation, not hope. For $POPCAT to reclaim ATH, you need three things — volume expansion, BTC consolidation (not correction), and sector rotation back into memes with conviction. Right now? You've got none of those.
The setup: If $BTC holds 85k+ and consolidates, watch for $POPCAT to reclaim its last major resistance with volume. That's your early signal. Until then, this is a laggard trade in a momentum market — not where you deploy size.
Invalidation is simple: If $BTC pulls back and $POPCAT doesn't hold its lows, the divergence widens and the trade dies. Don't marry the narrative when the chart says wait.
46
·
--
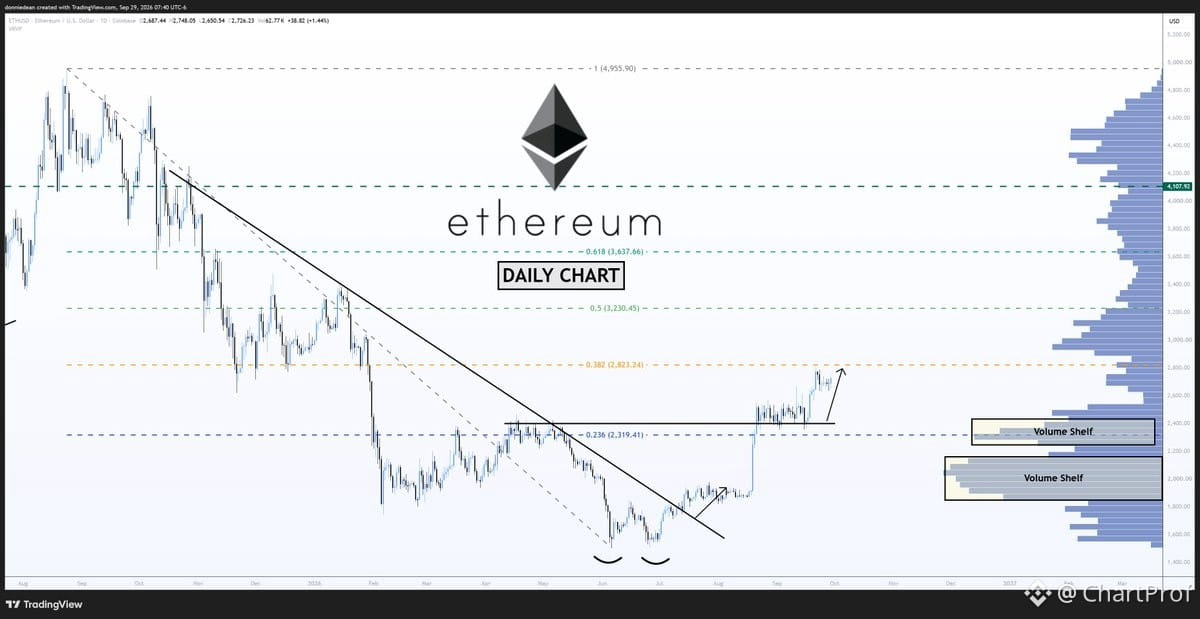
$ETH structure is straightforward here — we're sitting under resistance at $2,823, which is the first test. That's your immediate overhead level. If price clears it with volume and holds it as support on a retest, you've got confirmation to look higher.
Next targets are $3,230 and $3,638. The $3,230 level represents an 18.6% move from current price, while $3,638 is a 33.6% extension — both projections assume we break and hold above $2,823 first. These aren't random numbers, they're structural targets based on prior resistance zones and measured moves.
Invalidation is simple: if $ETH fails at $2,823 and loses the local low, the setup is off. You're trading the breakout, not the hope. Wait for the level to break, confirm the flip, then manage risk from there. No guessing — let the chart show you the structure, then act.
$ETH structure is straightforward here — we're sitting under resistance at $2,823, which is the first test. That's your immediate overhead level. If price clears it with volume and holds it as support on a retest, you've got confirmation to look higher.
Next targets are $3,230 and $3,638. The $3,230 level represents an 18.6% move from current price, while $3,638 is a 33.6% extension — both projections assume we break and hold above $2,823 first. These aren't random numbers, they're structural targets based on prior resistance zones and measured moves.
Invalidation is simple: if $ETH fails at $2,823 and loses the local low, the setup is off. You're trading the breakout, not the hope. Wait for the level to break, confirm the flip, then manage risk from there. No guessing — let the chart show you the structure, then act.
Next targets are $3,230 and $3,638. The $3,230 level represents an 18.6% move from current price, while $3,638 is a 33.6% extension — both projections assume we break and hold above $2,823 first. These aren't random numbers, they're structural targets based on prior resistance zones and measured moves.
Invalidation is simple: if $ETH fails at $2,823 and loses the local low, the setup is off. You're trading the breakout, not the hope. Wait for the level to break, confirm the flip, then manage risk from there. No guessing — let the chart show you the structure, then act.
36
·
--
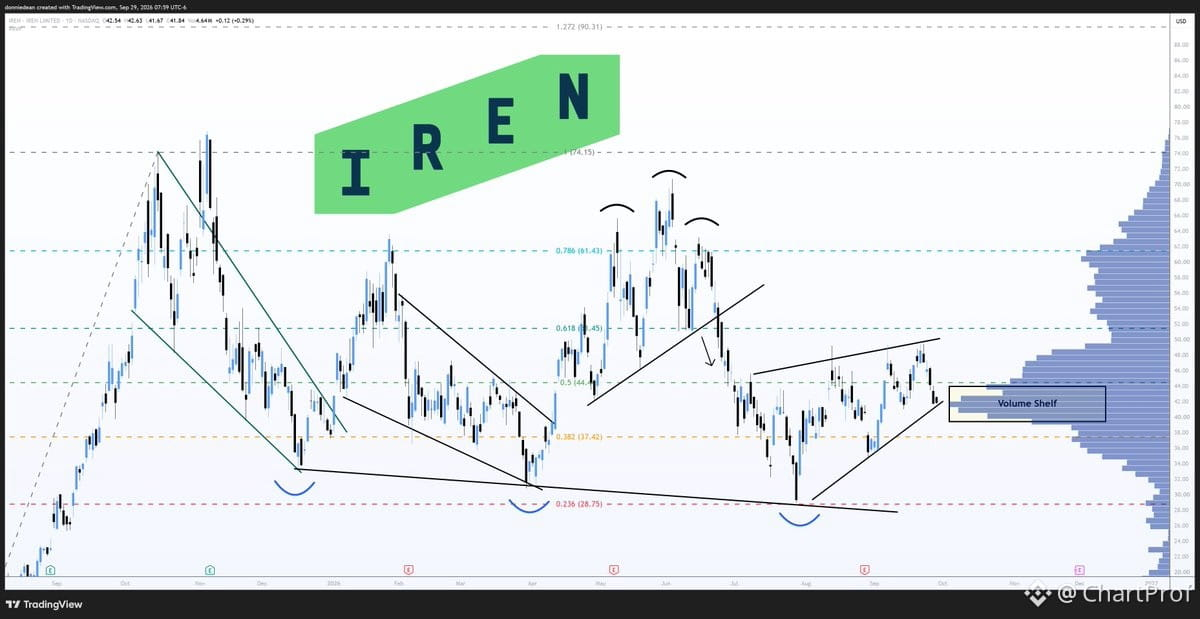
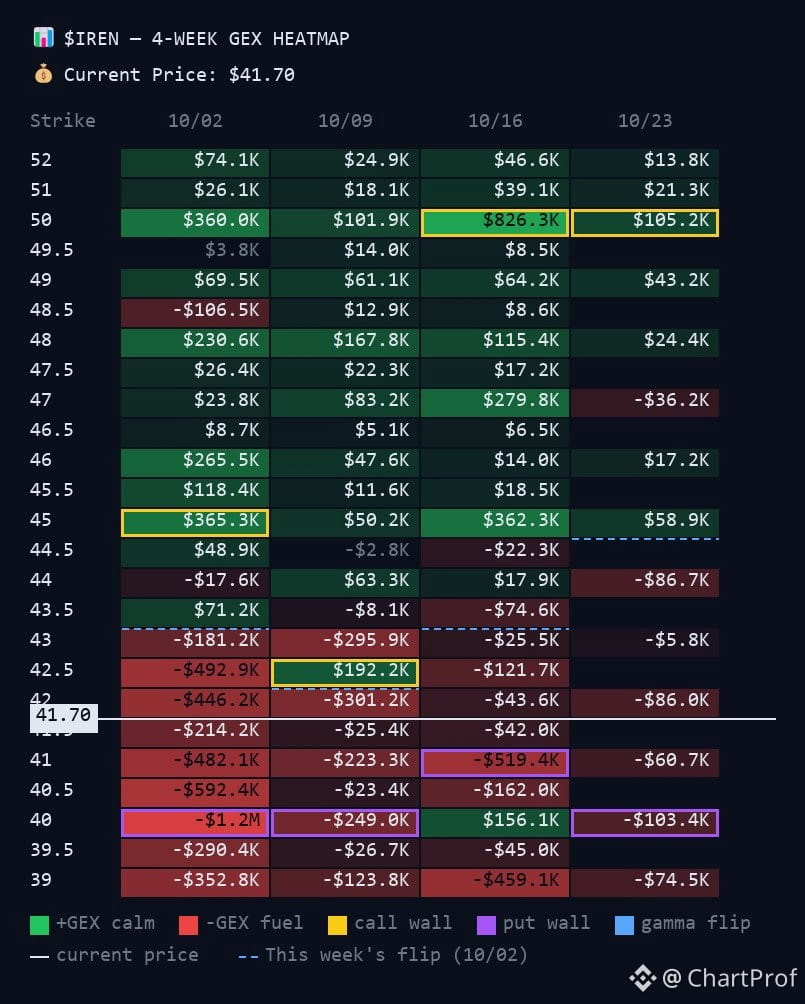
$IREN sitting right on the volume shelf and rising trendline — classic textbook support stack.
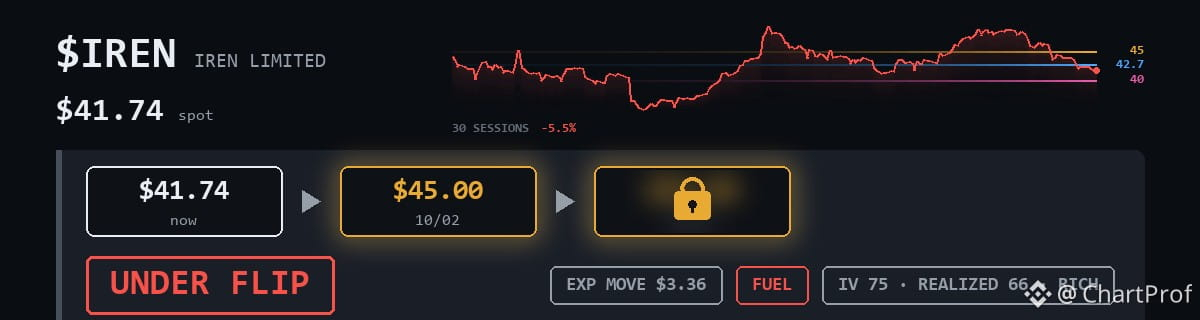
Current: $41.74
Target: $45.00 by 10/2
Here's the structure:
$40 is your floor. That's where volume built the foundation. As long as price holds above it, you've got structural support.
The rising trendline adds dynamic support underneath. When price sits on both volume shelf and trendline, you've got confluence — two reasons for buyers to defend.
If $40 holds, $45 is the first logical resistance. That's your first stop.
Invalidation is simple: break below $40 and the setup is dead. Volume shelf broken = no foundation.
Clean setup. Two-layer support. Clear target. Clear invalidation. That's how you read structure.
$IREN sitting right on the volume shelf and rising trendline — classic textbook support stack.
Current: $41.74
Target: $45.00 by 10/2
Here's the structure:
$40 is your floor. That's where volume built the foundation. As long as price holds above it, you've got structural support.
The rising trendline adds dynamic support underneath. When price sits on both volume shelf and trendline, you've got confluence — two reasons for buyers to defend.
If $40 holds, $45 is the first logical resistance. That's your first stop.
Invalidation is simple: break below $40 and the setup is dead. Volume shelf broken = no foundation.
Clean setup. Two-layer support. Clear target. Clear invalidation. That's how you read structure.
Current: $41.74
Target: $45.00 by 10/2
Here's the structure:
$40 is your floor. That's where volume built the foundation. As long as price holds above it, you've got structural support.
The rising trendline adds dynamic support underneath. When price sits on both volume shelf and trendline, you've got confluence — two reasons for buyers to defend.
If $40 holds, $45 is the first logical resistance. That's your first stop.
Invalidation is simple: break below $40 and the setup is dead. Volume shelf broken = no foundation.
Clean setup. Two-layer support. Clear target. Clear invalidation. That's how you read structure.
94
·
--
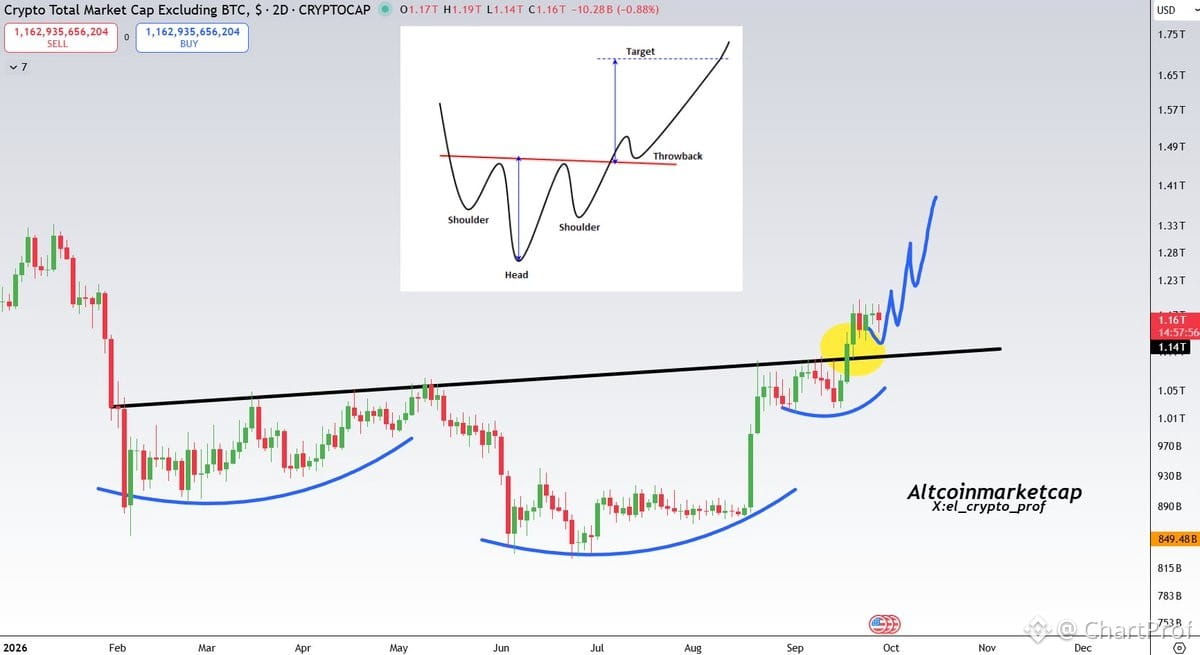
TOTAL2 (altcoin market cap) just broke out of a 7-month inverse head-and-shoulders — classic reversal structure that signals a major trend shift.
Right now we're in consolidation mode, retesting the breakout level. This is textbook behavior after a pattern break — price needs to confirm support where resistance used to be.
What makes this setup clean: the pattern took 7 months to build, so the base is solid. The longer the base, the stronger the breakout potential.
What to watch: as long as TOTAL2 holds above the neckline on this retest, the structure stays intact. If it reclaims and holds, that's your confirmation for continuation higher.
Invalidation: a clean break back below the neckline with momentum kills the setup.
Altseason setups don't get much cleaner than this. The retest is where you want to be paying attention — not chasing the initial pop, but waiting for the structure to prove itself. If it holds, we're looking at a much bigger move across alts.
TOTAL2 (altcoin market cap) just broke out of a 7-month inverse head-and-shoulders — classic reversal structure that signals a major trend shift.
Right now we're in consolidation mode, retesting the breakout level. This is textbook behavior after a pattern break — price needs to confirm support where resistance used to be.
What makes this setup clean: the pattern took 7 months to build, so the base is solid. The longer the base, the stronger the breakout potential.
What to watch: as long as TOTAL2 holds above the neckline on this retest, the structure stays intact. If it reclaims and holds, that's your confirmation for continuation higher.
Invalidation: a clean break back below the neckline with momentum kills the setup.
Altseason setups don't get much cleaner than this. The retest is where you want to be paying attention — not chasing the initial pop, but waiting for the structure to prove itself. If it holds, we're looking at a much bigger move across alts.
Right now we're in consolidation mode, retesting the breakout level. This is textbook behavior after a pattern break — price needs to confirm support where resistance used to be.
What makes this setup clean: the pattern took 7 months to build, so the base is solid. The longer the base, the stronger the breakout potential.
What to watch: as long as TOTAL2 holds above the neckline on this retest, the structure stays intact. If it reclaims and holds, that's your confirmation for continuation higher.
Invalidation: a clean break back below the neckline with momentum kills the setup.
Altseason setups don't get much cleaner than this. The retest is where you want to be paying attention — not chasing the initial pop, but waiting for the structure to prove itself. If it holds, we're looking at a much bigger move across alts.
189
·
--
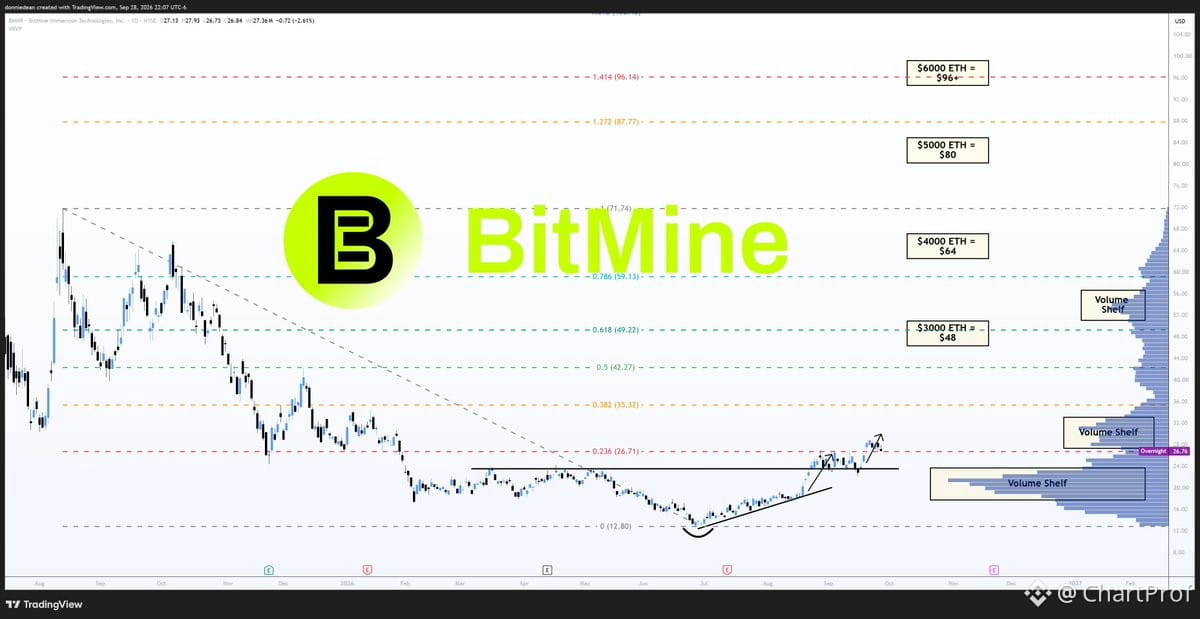
$BMNR trading at NAV — clean structure, clean thesis.
BitMine sits at ~$27/share, right on net asset value (0.99x mNAV). That's the floor. Bull case targets 1.6x NAV:
• $3K $ETH → $48
• $4K $ETH → $64
• $5K $ETH → $80
• $6K $ETH → $96+
Why it matters: They hold 6M $ETH (4.9% of total supply), 84% staked for yield (~$358M annualized). Unbroken weekly buys since June 2025. $4B buyback active. Russell 1000 member.
Setup: NAV floor + $ETH beta + staking yield = asymmetric upside if $ETH runs. Downside capped at treasury value. Upside scales with $ETH price action.
Confirmation: $ETH holds structure above key support. $BMNR premium expands as $ETH rallies.
Invalidation: $ETH breaks down, premium collapses back under NAV.
This is a levered $ETH play with a yield cushion and a known floor. Clean risk/reward if you read $ETH bullish.
$BMNR trading at NAV — clean structure, clean thesis.
BitMine sits at ~$27/share, right on net asset value (0.99x mNAV). That's the floor. Bull case targets 1.6x NAV:
• $3K $ETH → $48
• $4K $ETH → $64
• $5K $ETH → $80
• $6K $ETH → $96+
Why it matters: They hold 6M $ETH (4.9% of total supply), 84% staked for yield (~$358M annualized). Unbroken weekly buys since June 2025. $4B buyback active. Russell 1000 member.
Setup: NAV floor + $ETH beta + staking yield = asymmetric upside if $ETH runs. Downside capped at treasury value. Upside scales with $ETH price action.
Confirmation: $ETH holds structure above key support. $BMNR premium expands as $ETH rallies.
Invalidation: $ETH breaks down, premium collapses back under NAV.
This is a levered $ETH play with a yield cushion and a known floor. Clean risk/reward if you read $ETH bullish.
BitMine sits at ~$27/share, right on net asset value (0.99x mNAV). That's the floor. Bull case targets 1.6x NAV:
• $3K $ETH → $48
• $4K $ETH → $64
• $5K $ETH → $80
• $6K $ETH → $96+
Why it matters: They hold 6M $ETH (4.9% of total supply), 84% staked for yield (~$358M annualized). Unbroken weekly buys since June 2025. $4B buyback active. Russell 1000 member.
Setup: NAV floor + $ETH beta + staking yield = asymmetric upside if $ETH runs. Downside capped at treasury value. Upside scales with $ETH price action.
Confirmation: $ETH holds structure above key support. $BMNR premium expands as $ETH rallies.
Invalidation: $ETH breaks down, premium collapses back under NAV.
This is a levered $ETH play with a yield cushion and a known floor. Clean risk/reward if you read $ETH bullish.
159
·
--
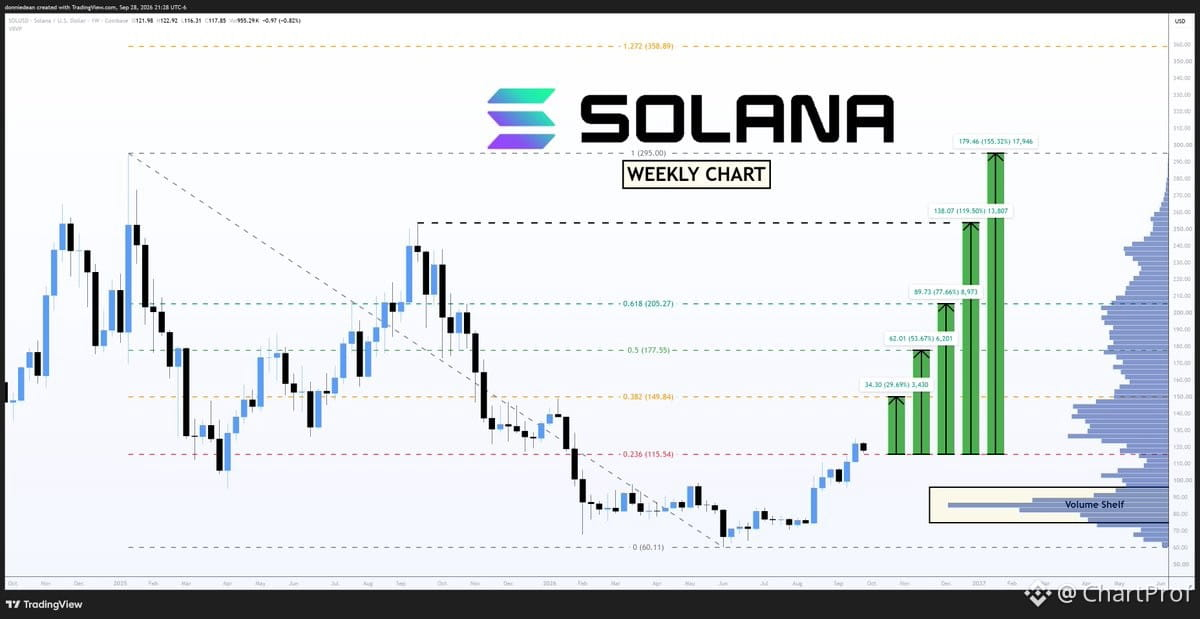
Weekly chart on $SOL — let's zoom out and map the structure.
Price is currently grinding at $115, working to confirm this as support. That's the key floor right now. If it holds, we've got a base to work from. If it breaks, the setup changes.
Next meaningful resistance sits at $149.84 — that's a clean +29% move from current levels. That's your upside target if $115 holds and momentum builds.
The trade setup here is straightforward:
• Support: $115 — needs to hold for bullish continuation
• Target: $149.84 — next structural resistance
• Invalidation: Clean break and close below $115
This is textbook level-to-level trading. You're watching for confirmation at support, then targeting the next resistance zone. No guessing — just reading the levels the chart is giving you.
If $115 confirms as support with volume and structure, the path to $149 opens up. If it fails, you step aside and wait for the next clean setup. That's how you stay in sync with the chart.
Weekly chart on $SOL — let's zoom out and map the structure.
Price is currently grinding at $115, working to confirm this as support. That's the key floor right now. If it holds, we've got a base to work from. If it breaks, the setup changes.
Next meaningful resistance sits at $149.84 — that's a clean +29% move from current levels. That's your upside target if $115 holds and momentum builds.
The trade setup here is straightforward:
• Support: $115 — needs to hold for bullish continuation
• Target: $149.84 — next structural resistance
• Invalidation: Clean break and close below $115
This is textbook level-to-level trading. You're watching for confirmation at support, then targeting the next resistance zone. No guessing — just reading the levels the chart is giving you.
If $115 confirms as support with volume and structure, the path to $149 opens up. If it fails, you step aside and wait for the next clean setup. That's how you stay in sync with the chart.
Price is currently grinding at $115, working to confirm this as support. That's the key floor right now. If it holds, we've got a base to work from. If it breaks, the setup changes.
Next meaningful resistance sits at $149.84 — that's a clean +29% move from current levels. That's your upside target if $115 holds and momentum builds.
The trade setup here is straightforward:
• Support: $115 — needs to hold for bullish continuation
• Target: $149.84 — next structural resistance
• Invalidation: Clean break and close below $115
This is textbook level-to-level trading. You're watching for confirmation at support, then targeting the next resistance zone. No guessing — just reading the levels the chart is giving you.
If $115 confirms as support with volume and structure, the path to $149 opens up. If it fails, you step aside and wait for the next clean setup. That's how you stay in sync with the chart.
258
·
--
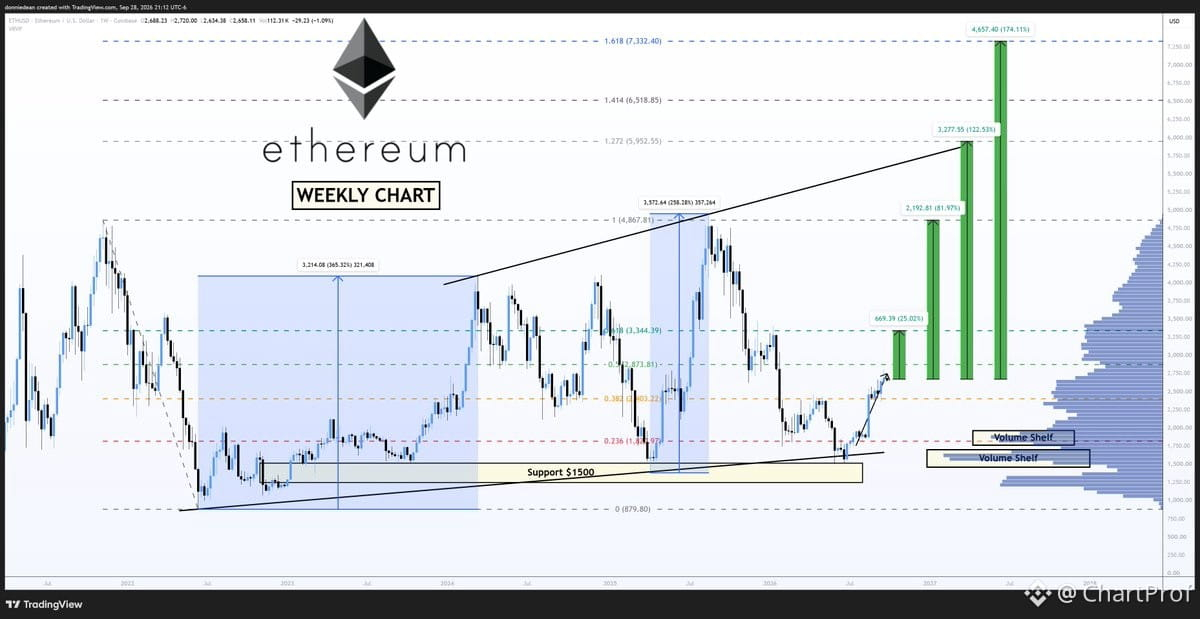
Let's zoom out on $ETH and read the weekly structure — this is where perspective matters.
You've got three clean Fibonacci targets that frame the bigger picture:
$3,344 — the 0.618 retracement. This is your structural support if we pull back. It's not random — it's where the macro swing finds equilibrium. If price holds above this, the bull structure stays intact.
$4,867 — the 100% extension. This is the first measured move completion. Price reclaiming this level means we've fully retraced the prior correction and confirmed continuation. It's your baseline target for the next leg.
$7,332 — the 1.618 golden ratio extension. This is your textbook Fibonacci projection for the next major impulse. It's not hopium — it's math. If momentum sustains and structure confirms, this is where the swing completes.
Here's what matters: weekly timeframes don't lie. These levels aren't guesses — they're derived from swing structure and Fibonacci geometry. The 0.618 is your invalidation floor. The 100% is your continuation confirm. The 1.618 is your target if the trend extends.
Read the chart like a map. Know where you are, where support lives, and where the structure projects. That's how you trade with conviction instead of reacting to noise.
Let's zoom out on $ETH and read the weekly structure — this is where perspective matters.
You've got three clean Fibonacci targets that frame the bigger picture:
$3,344 — the 0.618 retracement. This is your structural support if we pull back. It's not random — it's where the macro swing finds equilibrium. If price holds above this, the bull structure stays intact.
$4,867 — the 100% extension. This is the first measured move completion. Price reclaiming this level means we've fully retraced the prior correction and confirmed continuation. It's your baseline target for the next leg.
$7,332 — the 1.618 golden ratio extension. This is your textbook Fibonacci projection for the next major impulse. It's not hopium — it's math. If momentum sustains and structure confirms, this is where the swing completes.
Here's what matters: weekly timeframes don't lie. These levels aren't guesses — they're derived from swing structure and Fibonacci geometry. The 0.618 is your invalidation floor. The 100% is your continuation confirm. The 1.618 is your target if the trend extends.
Read the chart like a map. Know where you are, where support lives, and where the structure projects. That's how you trade with conviction instead of reacting to noise.
You've got three clean Fibonacci targets that frame the bigger picture:
$3,344 — the 0.618 retracement. This is your structural support if we pull back. It's not random — it's where the macro swing finds equilibrium. If price holds above this, the bull structure stays intact.
$4,867 — the 100% extension. This is the first measured move completion. Price reclaiming this level means we've fully retraced the prior correction and confirmed continuation. It's your baseline target for the next leg.
$7,332 — the 1.618 golden ratio extension. This is your textbook Fibonacci projection for the next major impulse. It's not hopium — it's math. If momentum sustains and structure confirms, this is where the swing completes.
Here's what matters: weekly timeframes don't lie. These levels aren't guesses — they're derived from swing structure and Fibonacci geometry. The 0.618 is your invalidation floor. The 100% is your continuation confirm. The 1.618 is your target if the trend extends.
Read the chart like a map. Know where you are, where support lives, and where the structure projects. That's how you trade with conviction instead of reacting to noise.
173
·
--
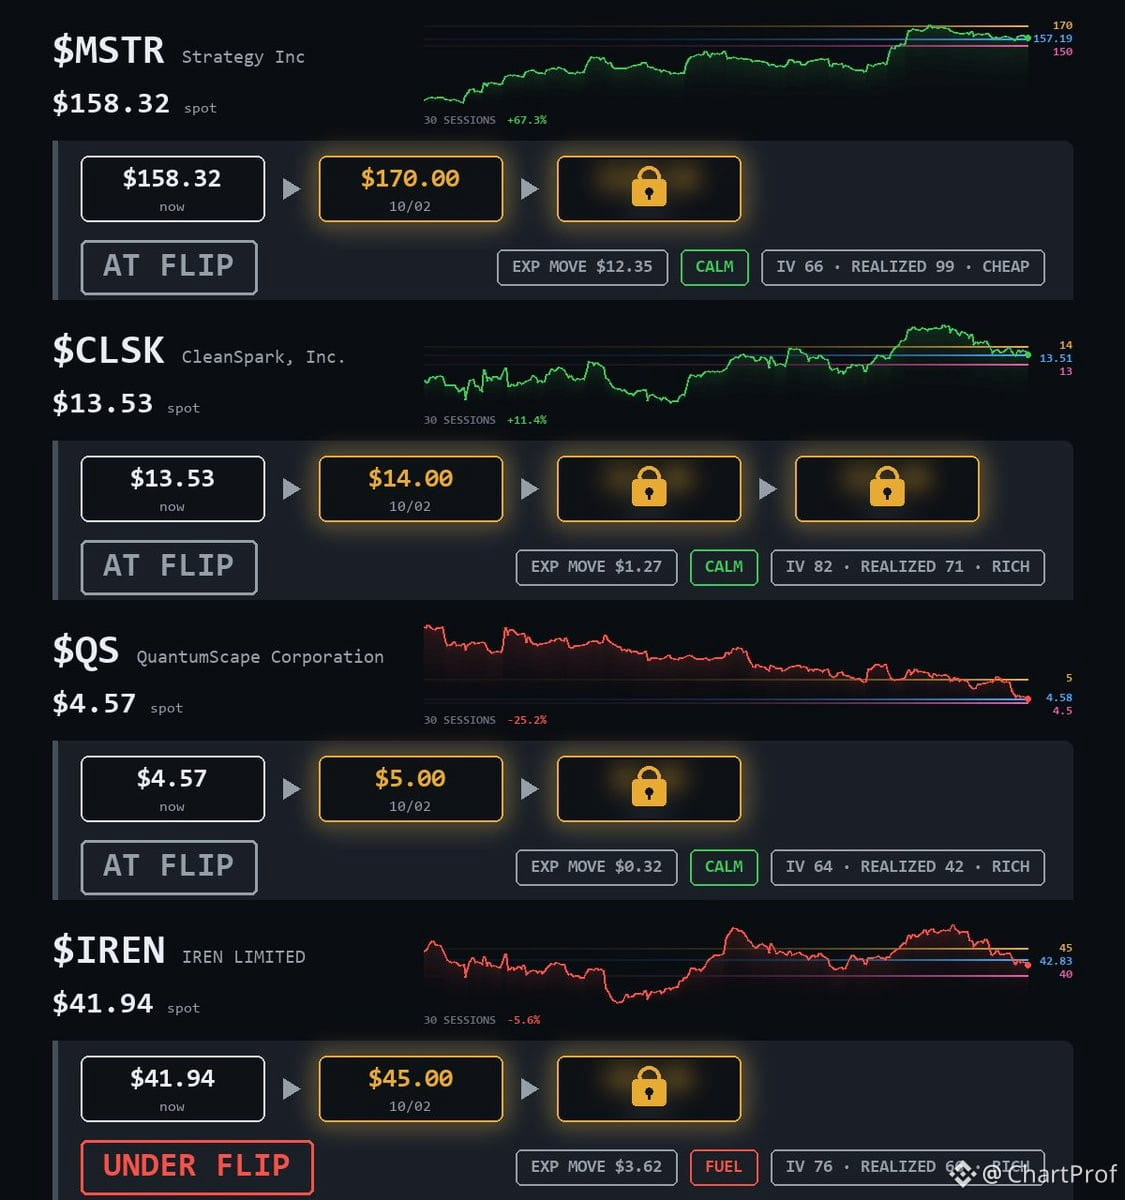
Monday's setups in one spot.
$MSTR flipped — watching $170 overhead. That's the ceiling. Above it, structure opens. Below the flip, you're back in the range.
$CLSK flipped inside a $13–$14 box. Clean range. Trade the edges or wait for a break. Box is the structure until it's not.
$QS flipped with $4.50 sitting just under as support. That's your floor. Hold it, you're fine. Lose it, setup's invalid.
$IREN under the $42.83 flip. $45 ceiling above, $40 floor below. You're in the middle — no trade until it picks a side.
Full breakdowns in Monday's posts. These are your levels. Know where you're in, where you're out.
Monday's setups in one spot.
$MSTR flipped — watching $170 overhead. That's the ceiling. Above it, structure opens. Below the flip, you're back in the range.
$CLSK flipped inside a $13–$14 box. Clean range. Trade the edges or wait for a break. Box is the structure until it's not.
$QS flipped with $4.50 sitting just under as support. That's your floor. Hold it, you're fine. Lose it, setup's invalid.
$IREN under the $42.83 flip. $45 ceiling above, $40 floor below. You're in the middle — no trade until it picks a side.
Full breakdowns in Monday's posts. These are your levels. Know where you're in, where you're out.
$MSTR flipped — watching $170 overhead. That's the ceiling. Above it, structure opens. Below the flip, you're back in the range.
$CLSK flipped inside a $13–$14 box. Clean range. Trade the edges or wait for a break. Box is the structure until it's not.
$QS flipped with $4.50 sitting just under as support. That's your floor. Hold it, you're fine. Lose it, setup's invalid.
$IREN under the $42.83 flip. $45 ceiling above, $40 floor below. You're in the middle — no trade until it picks a side.
Full breakdowns in Monday's posts. These are your levels. Know where you're in, where you're out.
37
·
--
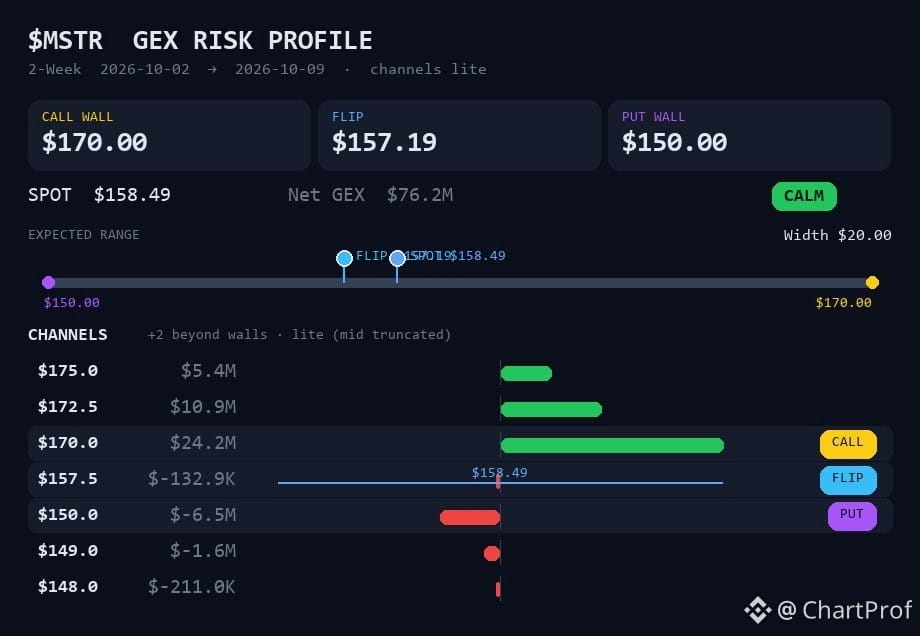
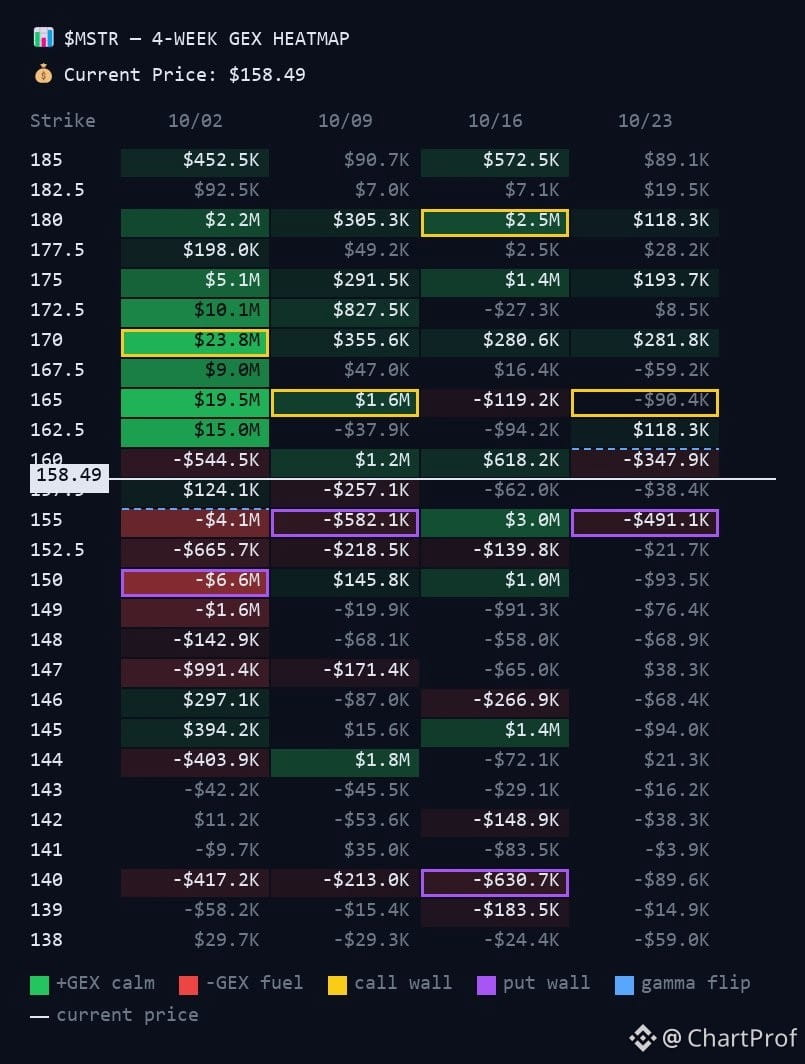
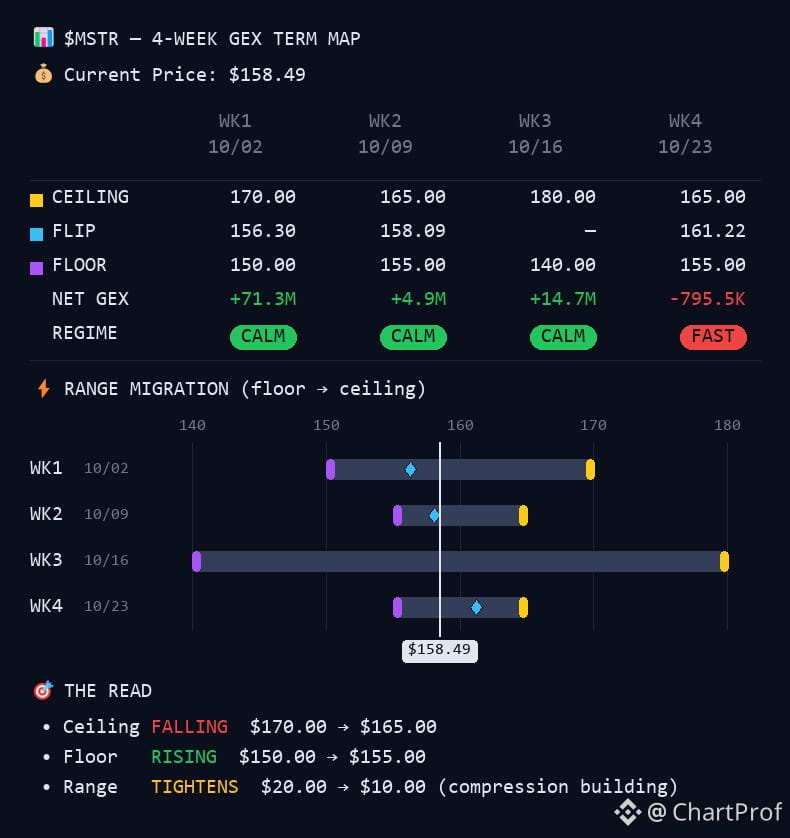
$MSTR sitting at 158.49, just above the gamma flip at 157.19. Let's walk through what that means and why it matters.
The flip is where dealer hedging behavior changes. Above the flip, market makers hedge in a way that dampens volatility — moves tend to be calmer. Below it, their hedging amplifies moves — price can stretch harder in either direction.
Right now, price is only 1.30 points above the flip. That's a thin cushion. The flip itself moved lower from 158.21 earlier, so the structure is compressing.
Your boundaries:
- Call wall at 170: heaviest call strike, where dealer hedging leans against rallies. That's your ceiling.
- Put wall at 150: heaviest put strike, where hedging supports dips. That's your floor.
So the range is 150–170, and the flip at 157.19 is the pivot inside that range.
The setup:
Hold above 157.19 → expect calmer, range-bound action between 150 and 170.
Lose 157.19 → expect wider, faster moves, likely toward the 150 floor.
157.19 is your line. Watch how price respects it. That tells you whether dealers are dampening or amplifying the next move.
$MSTR sitting at 158.49, just above the gamma flip at 157.19. Let's walk through what that means and why it matters.
The flip is where dealer hedging behavior changes. Above the flip, market makers hedge in a way that dampens volatility — moves tend to be calmer. Below it, their hedging amplifies moves — price can stretch harder in either direction.
Right now, price is only 1.30 points above the flip. That's a thin cushion. The flip itself moved lower from 158.21 earlier, so the structure is compressing.
Your boundaries:
- Call wall at 170: heaviest call strike, where dealer hedging leans against rallies. That's your ceiling.
- Put wall at 150: heaviest put strike, where hedging supports dips. That's your floor.
So the range is 150–170, and the flip at 157.19 is the pivot inside that range.
The setup:
Hold above 157.19 → expect calmer, range-bound action between 150 and 170.
Lose 157.19 → expect wider, faster moves, likely toward the 150 floor.
157.19 is your line. Watch how price respects it. That tells you whether dealers are dampening or amplifying the next move.
The flip is where dealer hedging behavior changes. Above the flip, market makers hedge in a way that dampens volatility — moves tend to be calmer. Below it, their hedging amplifies moves — price can stretch harder in either direction.
Right now, price is only 1.30 points above the flip. That's a thin cushion. The flip itself moved lower from 158.21 earlier, so the structure is compressing.
Your boundaries:
- Call wall at 170: heaviest call strike, where dealer hedging leans against rallies. That's your ceiling.
- Put wall at 150: heaviest put strike, where hedging supports dips. That's your floor.
So the range is 150–170, and the flip at 157.19 is the pivot inside that range.
The setup:
Hold above 157.19 → expect calmer, range-bound action between 150 and 170.
Lose 157.19 → expect wider, faster moves, likely toward the 150 floor.
157.19 is your line. Watch how price respects it. That tells you whether dealers are dampening or amplifying the next move.
58
·
--
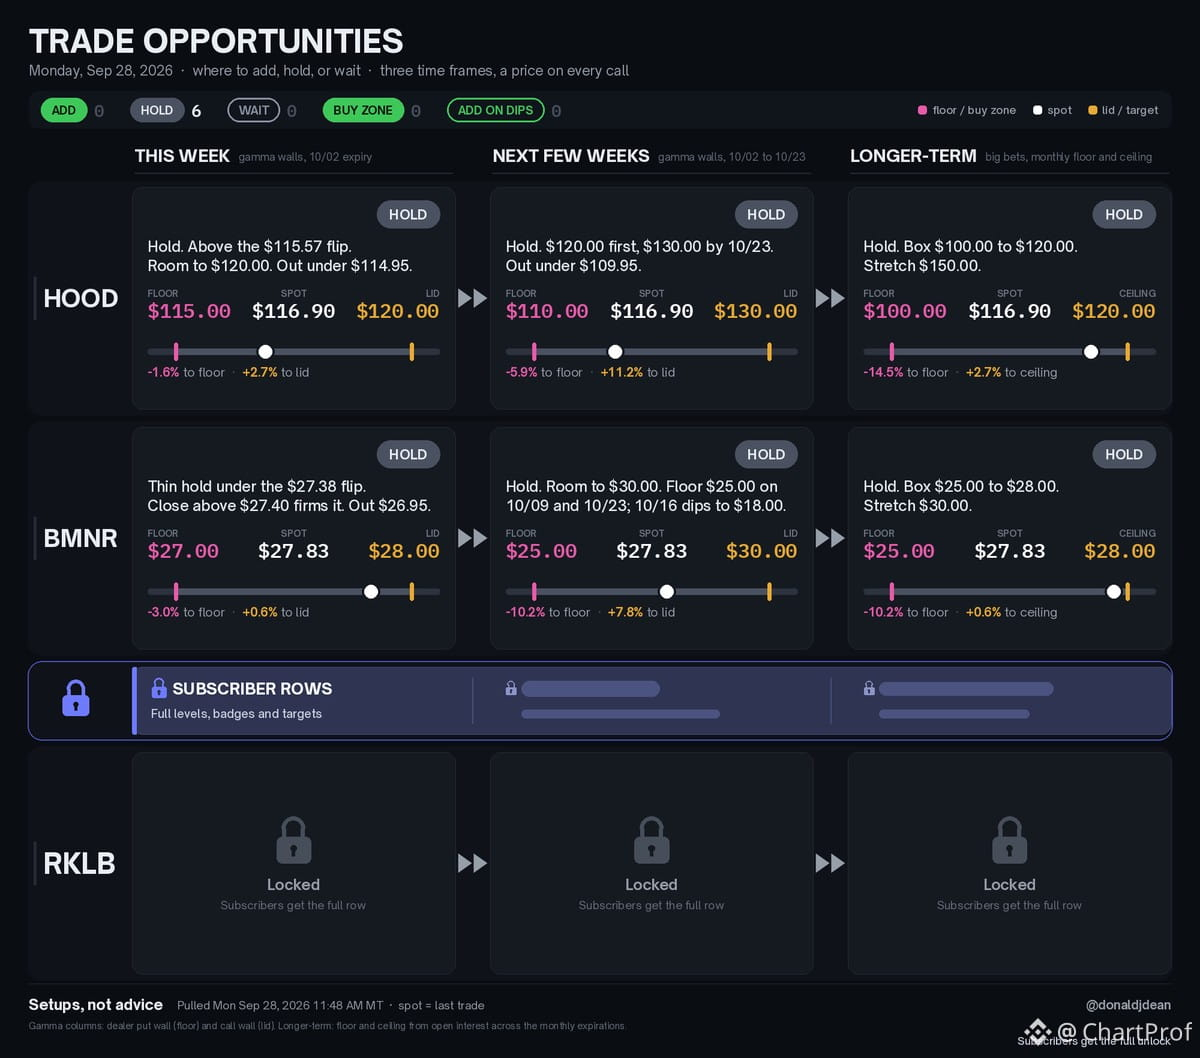
Monday's board — all holds, no new entries.
$HOOD sitting at $116.90, above the $115.57 pivot. Structure opens $120 this week, $130 by 10/23 if it holds. Invalidation clean under $114.95.
$BMNR thin at $27.83. Needs a close above $27.40 to firm up the hold. Out under $26.95. Room to $30 over the next few weeks if it cooperates.
No buys flagged. Wait for setups to tighten.
Monday's board — all holds, no new entries.
$HOOD sitting at $116.90, above the $115.57 pivot. Structure opens $120 this week, $130 by 10/23 if it holds. Invalidation clean under $114.95.
$BMNR thin at $27.83. Needs a close above $27.40 to firm up the hold. Out under $26.95. Room to $30 over the next few weeks if it cooperates.
No buys flagged. Wait for setups to tighten.
$HOOD sitting at $116.90, above the $115.57 pivot. Structure opens $120 this week, $130 by 10/23 if it holds. Invalidation clean under $114.95.
$BMNR thin at $27.83. Needs a close above $27.40 to firm up the hold. Out under $26.95. Room to $30 over the next few weeks if it cooperates.
No buys flagged. Wait for setups to tighten.
41
·
--
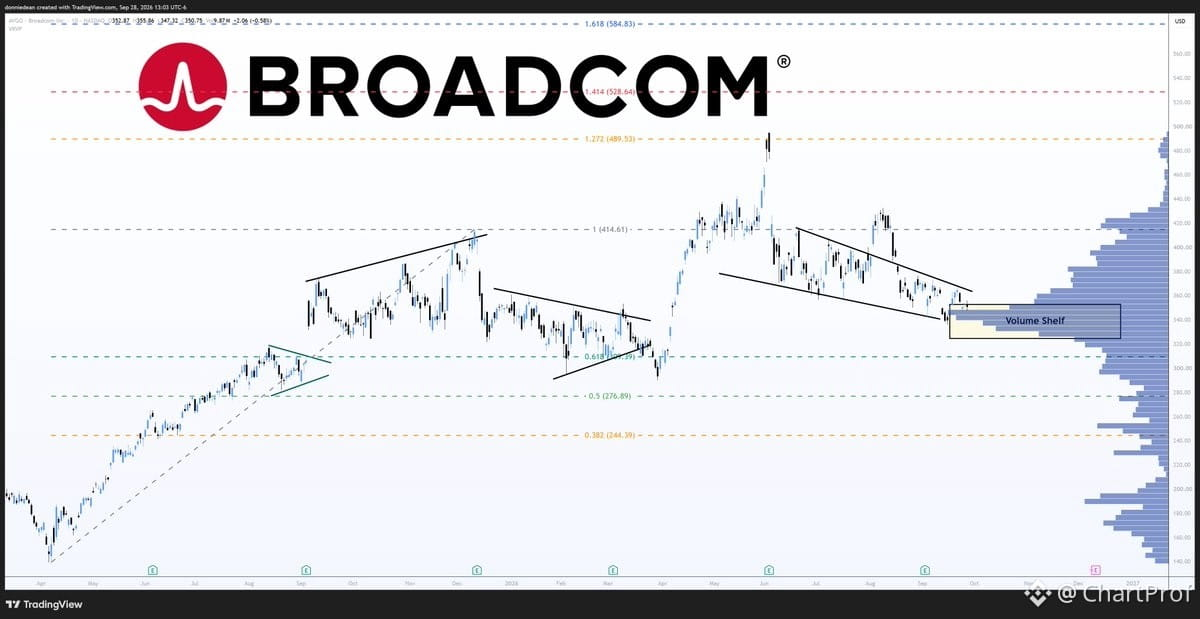
$AVGO sitting at $351 — just above the $350 put wall that's acting as the floor here.
First resistance is the $360 call wall. Break through that cleanly and you're eyeing $375, which holds as the ceiling through October 9.
Invalidation is simple: lose $350 and the setup breaks. Structure-wise, we're still inside a broad $300–$400 box, so this is really a test of the lower edge of the short-term range.
Watch $350 for support, $360 for the first breakout level, and $375 as the next logical target if momentum carries.
$AVGO sitting at $351 — just above the $350 put wall that's acting as the floor here.
First resistance is the $360 call wall. Break through that cleanly and you're eyeing $375, which holds as the ceiling through October 9.
Invalidation is simple: lose $350 and the setup breaks. Structure-wise, we're still inside a broad $300–$400 box, so this is really a test of the lower edge of the short-term range.
Watch $350 for support, $360 for the first breakout level, and $375 as the next logical target if momentum carries.
First resistance is the $360 call wall. Break through that cleanly and you're eyeing $375, which holds as the ceiling through October 9.
Invalidation is simple: lose $350 and the setup breaks. Structure-wise, we're still inside a broad $300–$400 box, so this is really a test of the lower edge of the short-term range.
Watch $350 for support, $360 for the first breakout level, and $375 as the next logical target if momentum carries.
39
·
--
New FINRA short interest data just dropped (9/15 settlement), and a few names moved hard. Let's walk through what changed and what it means structurally.
$BETR now sits at the top of my squeeze watch. Days to cover nearly doubled — 4.21 to 7.85 — and shorts hold roughly 52% of the float. That's a tight setup. If price pushes and volume stays normal, it takes shorts nearly eight days to exit. That's fuel, not a trade yet, but it's on the board.
$QS also saw days to cover nearly double, from 5.34 to 10.47. Short interest itself barely moved, so this is a volume story. Shorts now need about ten days of average volume to unwind. That's a long exit if momentum kicks in.
$ASST short interest jumped about 21%. Shorts now hold roughly 27.6% of the float, up from 22.8%. Not extreme, but the move matters — more conviction from the short side, or more trapped if it rips.
$CYPH short interest rose about 43.5% since the last report. That's a sharp increase. Watch how it trades into resistance.
$WYFI still sits around 50% of the float short. No major change, but it's still a coiled setup if the right catalyst hits.
$GME moved the other way. Short interest fell about 31.4%, and days to cover dropped from 9.72 to 4.29. Shorts have been covering. That takes some of the squeeze fuel off the table, at least for now.
Here's the teaching point: high short interest is not a buy signal. It shows where the fuel sits if price starts moving. You still need a catalyst, a technical setup, and confirmation. This is the map, not the trade.
New FINRA short interest data just dropped (9/15 settlement), and a few names moved hard. Let's walk through what changed and what it means structurally.
$BETR now sits at the top of my squeeze watch. Days to cover nearly doubled — 4.21 to 7.85 — and shorts hold roughly 52% of the float. That's a tight setup. If price pushes and volume stays normal, it takes shorts nearly eight days to exit. That's fuel, not a trade yet, but it's on the board.
$QS also saw days to cover nearly double, from 5.34 to 10.47. Short interest itself barely moved, so this is a volume story. Shorts now need about ten days of average volume to unwind. That's a long exit if momentum kicks in.
$ASST short interest jumped about 21%. Shorts now hold roughly 27.6% of the float, up from 22.8%. Not extreme, but the move matters — more conviction from the short side, or more trapped if it rips.
$CYPH short interest rose about 43.5% since the last report. That's a sharp increase. Watch how it trades into resistance.
$WYFI still sits around 50% of the float short. No major change, but it's still a coiled setup if the right catalyst hits.
$GME moved the other way. Short interest fell about 31.4%, and days to cover dropped from 9.72 to 4.29. Shorts have been covering. That takes some of the squeeze fuel off the table, at least for now.
Here's the teaching point: high short interest is not a buy signal. It shows where the fuel sits if price starts moving. You still need a catalyst, a technical setup, and confirmation. This is the map, not the trade.
$BETR now sits at the top of my squeeze watch. Days to cover nearly doubled — 4.21 to 7.85 — and shorts hold roughly 52% of the float. That's a tight setup. If price pushes and volume stays normal, it takes shorts nearly eight days to exit. That's fuel, not a trade yet, but it's on the board.
$QS also saw days to cover nearly double, from 5.34 to 10.47. Short interest itself barely moved, so this is a volume story. Shorts now need about ten days of average volume to unwind. That's a long exit if momentum kicks in.
$ASST short interest jumped about 21%. Shorts now hold roughly 27.6% of the float, up from 22.8%. Not extreme, but the move matters — more conviction from the short side, or more trapped if it rips.
$CYPH short interest rose about 43.5% since the last report. That's a sharp increase. Watch how it trades into resistance.
$WYFI still sits around 50% of the float short. No major change, but it's still a coiled setup if the right catalyst hits.
$GME moved the other way. Short interest fell about 31.4%, and days to cover dropped from 9.72 to 4.29. Shorts have been covering. That takes some of the squeeze fuel off the table, at least for now.
Here's the teaching point: high short interest is not a buy signal. It shows where the fuel sits if price starts moving. You still need a catalyst, a technical setup, and confirmation. This is the map, not the trade.
26
·
--
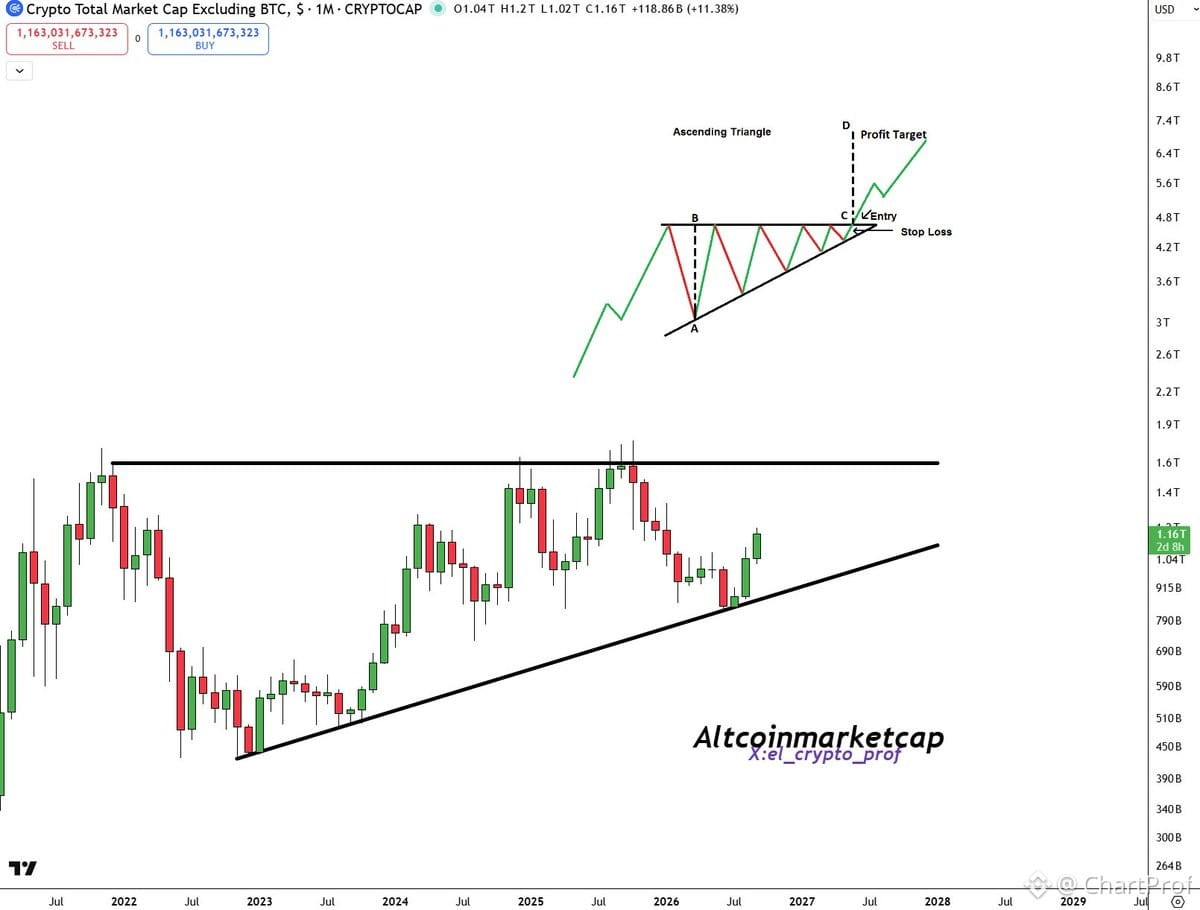
Let's break down the altcoin market structure because this is a textbook setup you need to understand.
TOTAL2 — that's the entire altcoin market cap excluding $BTC — has been carving out a massive ascending triangle for nearly five years. This is not noise. This is accumulation at scale.
Here's what matters:
Ascending triangles are continuation patterns. Higher lows show buyers stepping in with more conviction each cycle. The flat resistance at the top? That's where supply has capped price repeatedly. When that finally breaks, you get expansion — fast.
We're sitting right at the apex now. The longer a pattern builds, the more violent the breakout. Five years of compression means serious energy stored in this structure.
What confirms the breakout? A weekly close above resistance with volume. What kills it? A breakdown below the rising trendline support — that invalidates the entire thesis.
This isn't hopium. It's structure. The chart is teaching you that altcoins have been building a launchpad, not dying. When this breaks, the move will be proportional to the time it took to build.
Watch the levels. Respect the structure. And understand what you're looking at before the market teaches you the hard way.
Let's break down the altcoin market structure because this is a textbook setup you need to understand.
TOTAL2 — that's the entire altcoin market cap excluding $BTC — has been carving out a massive ascending triangle for nearly five years. This is not noise. This is accumulation at scale.
Here's what matters:
Ascending triangles are continuation patterns. Higher lows show buyers stepping in with more conviction each cycle. The flat resistance at the top? That's where supply has capped price repeatedly. When that finally breaks, you get expansion — fast.
We're sitting right at the apex now. The longer a pattern builds, the more violent the breakout. Five years of compression means serious energy stored in this structure.
What confirms the breakout? A weekly close above resistance with volume. What kills it? A breakdown below the rising trendline support — that invalidates the entire thesis.
This isn't hopium. It's structure. The chart is teaching you that altcoins have been building a launchpad, not dying. When this breaks, the move will be proportional to the time it took to build.
Watch the levels. Respect the structure. And understand what you're looking at before the market teaches you the hard way.
TOTAL2 — that's the entire altcoin market cap excluding $BTC — has been carving out a massive ascending triangle for nearly five years. This is not noise. This is accumulation at scale.
Here's what matters:
Ascending triangles are continuation patterns. Higher lows show buyers stepping in with more conviction each cycle. The flat resistance at the top? That's where supply has capped price repeatedly. When that finally breaks, you get expansion — fast.
We're sitting right at the apex now. The longer a pattern builds, the more violent the breakout. Five years of compression means serious energy stored in this structure.
What confirms the breakout? A weekly close above resistance with volume. What kills it? A breakdown below the rising trendline support — that invalidates the entire thesis.
This isn't hopium. It's structure. The chart is teaching you that altcoins have been building a launchpad, not dying. When this breaks, the move will be proportional to the time it took to build.
Watch the levels. Respect the structure. And understand what you're looking at before the market teaches you the hard way.
230
·
--
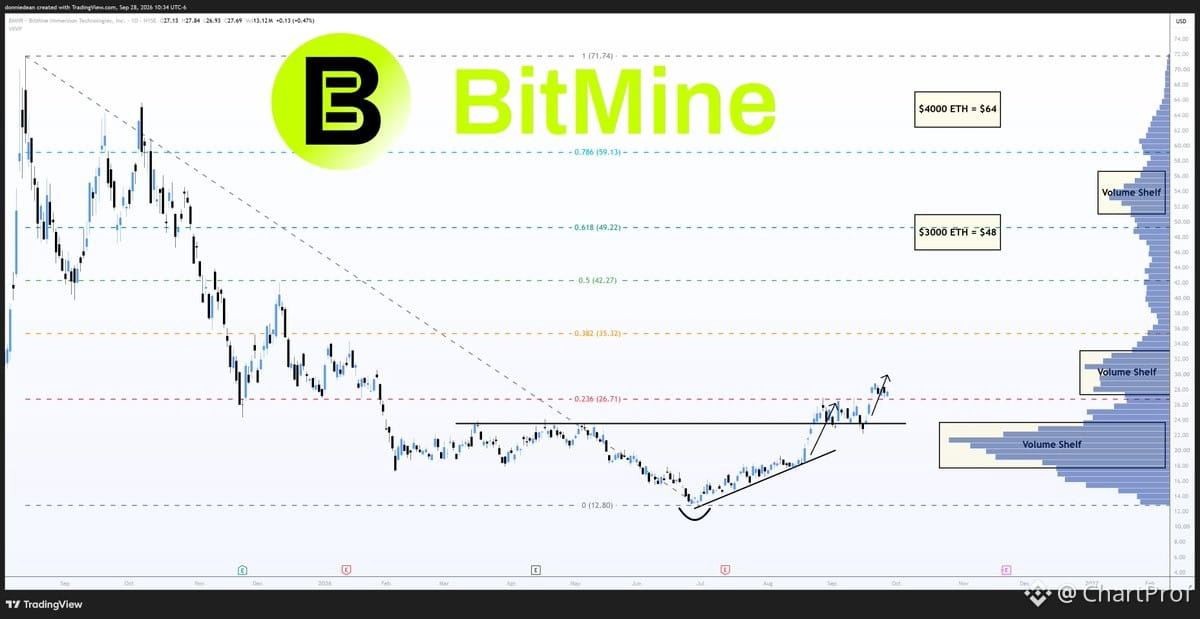
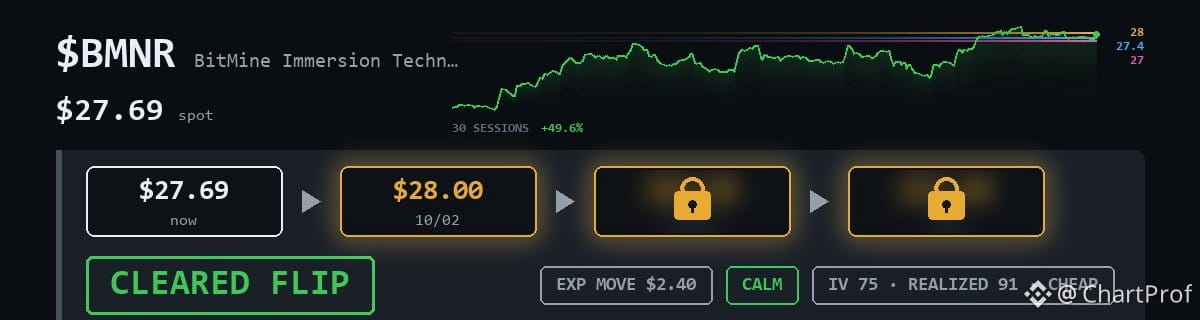
$BMNR BitMine holding clean above base breakout.
Price ran from $27.69 toward $28 — up 49.6% over 30 sessions. Broke above $23.50 base, retested structure, and reclaimed the 0.236 fib at $26.71. That's your confirmation.
$28 is the first target. If it clears that, you're watching for continuation into higher fibs. If it loses $26.71, the breakout structure weakens and you re-assess.
This is textbook base-and-retest. Breakout, pullback to structure, hold, then continuation. The retest is what separates real moves from fakeouts. BMNR did the work — now it's about follow-through above $28 or rejection back into range.
$BMNR BitMine holding clean above base breakout.
Price ran from $27.69 toward $28 — up 49.6% over 30 sessions. Broke above $23.50 base, retested structure, and reclaimed the 0.236 fib at $26.71. That's your confirmation.
$28 is the first target. If it clears that, you're watching for continuation into higher fibs. If it loses $26.71, the breakout structure weakens and you re-assess.
This is textbook base-and-retest. Breakout, pullback to structure, hold, then continuation. The retest is what separates real moves from fakeouts. BMNR did the work — now it's about follow-through above $28 or rejection back into range.
Price ran from $27.69 toward $28 — up 49.6% over 30 sessions. Broke above $23.50 base, retested structure, and reclaimed the 0.236 fib at $26.71. That's your confirmation.
$28 is the first target. If it clears that, you're watching for continuation into higher fibs. If it loses $26.71, the breakout structure weakens and you re-assess.
This is textbook base-and-retest. Breakout, pullback to structure, hold, then continuation. The retest is what separates real moves from fakeouts. BMNR did the work — now it's about follow-through above $28 or rejection back into range.
31
·
--
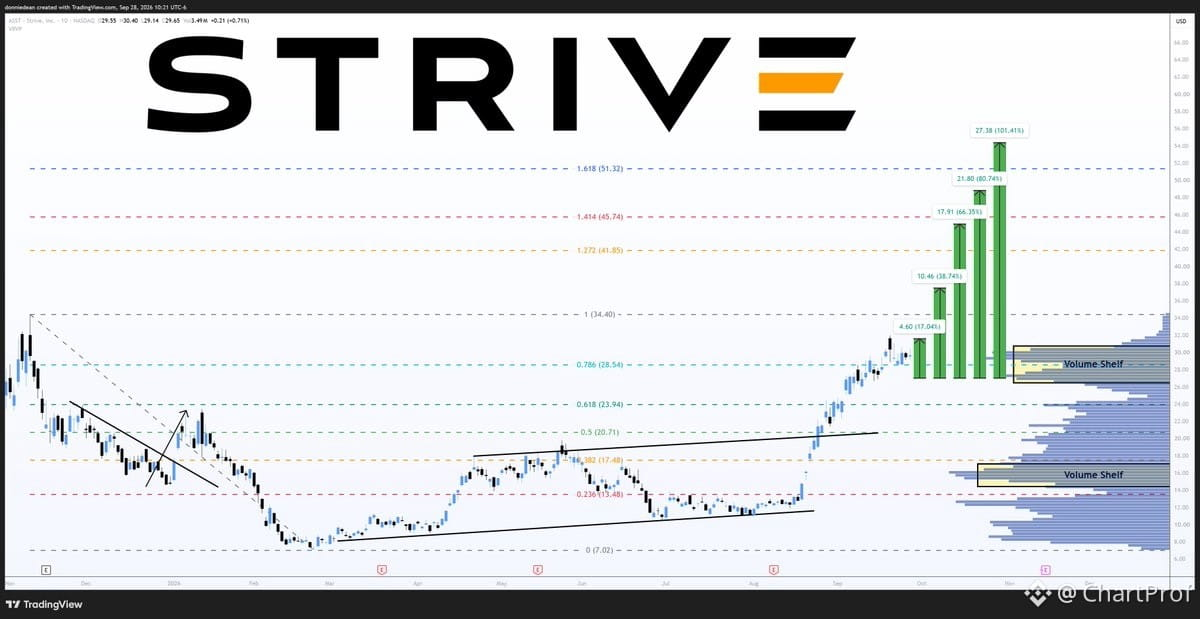
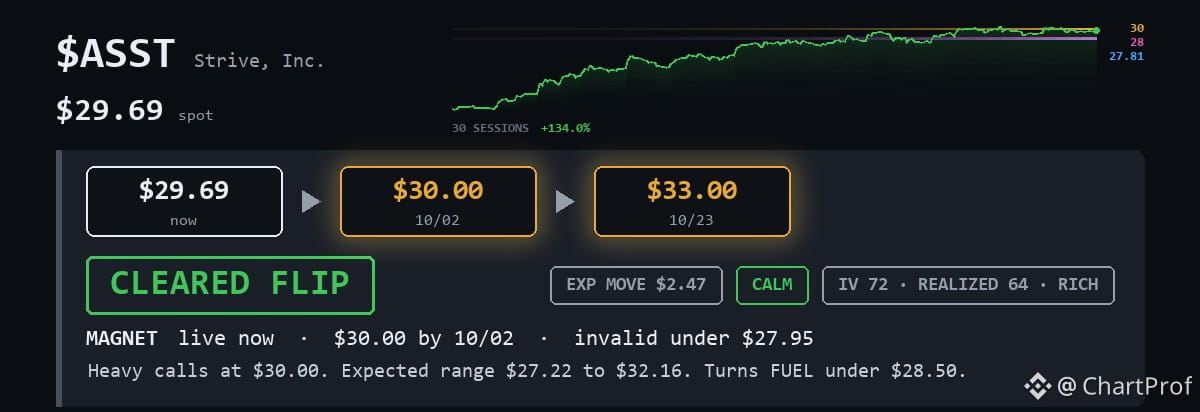
$ASST — Strive's channel breakout is holding.
Price ran from $29.69, now eyeing $30 as the next magnet, then $33.
Up 134% over 30 sessions. Broke out of its rising channel in August and is sitting above the 0.786 fib at $28.54 — that's your structural floor.
Context: Strive has $700M+ in warrants struck at $27, expiring mid-October. Price is above them, so those are out of the way.
$30 is the immediate level. After that, the 1.0 fib at $34.40 — the November high — is your next structural target.
Setup is clean: breakout confirmed, fib holding, warrants cleared. Watch $28.54 as your invalidation. Above $30, you're targeting $33–$34.40.
$ASST — Strive's channel breakout is holding.
Price ran from $29.69, now eyeing $30 as the next magnet, then $33.
Up 134% over 30 sessions. Broke out of its rising channel in August and is sitting above the 0.786 fib at $28.54 — that's your structural floor.
Context: Strive has $700M+ in warrants struck at $27, expiring mid-October. Price is above them, so those are out of the way.
$30 is the immediate level. After that, the 1.0 fib at $34.40 — the November high — is your next structural target.
Setup is clean: breakout confirmed, fib holding, warrants cleared. Watch $28.54 as your invalidation. Above $30, you're targeting $33–$34.40.
Price ran from $29.69, now eyeing $30 as the next magnet, then $33.
Up 134% over 30 sessions. Broke out of its rising channel in August and is sitting above the 0.786 fib at $28.54 — that's your structural floor.
Context: Strive has $700M+ in warrants struck at $27, expiring mid-October. Price is above them, so those are out of the way.
$30 is the immediate level. After that, the 1.0 fib at $34.40 — the November high — is your next structural target.
Setup is clean: breakout confirmed, fib holding, warrants cleared. Watch $28.54 as your invalidation. Above $30, you're targeting $33–$34.40.
57
·
--
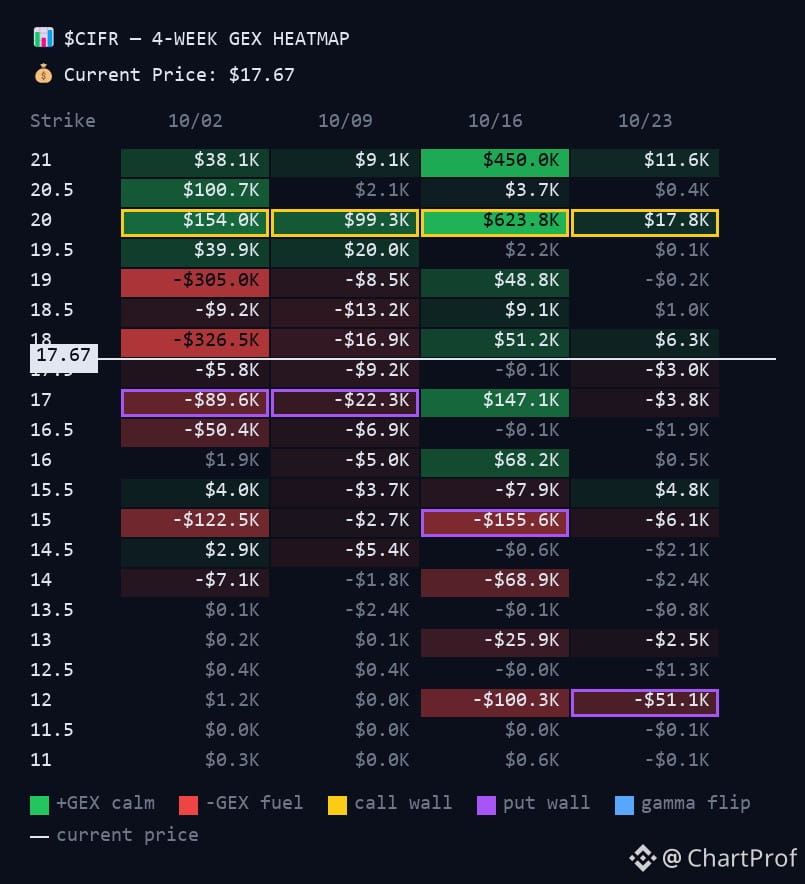
$CIFR slipped under $17 this morning — sitting at $16.86. Not a clean break yet, just a few cents under the floor from Friday's structure.
Here's the map:
$20.00 — ceiling
$17.59 — the flip
$17.00 — the floor
$16.86 — current price
First job: reclaim $17. Below $17.59, you're in FUEL — moves come faster in both directions. Above it, desks step in and cushion the action.
Watch for a bounce back over $17 or a deeper flush if it can't hold. Structure is clear — trade what confirms.
$CIFR slipped under $17 this morning — sitting at $16.86. Not a clean break yet, just a few cents under the floor from Friday's structure.
Here's the map:
$20.00 — ceiling
$17.59 — the flip
$17.00 — the floor
$16.86 — current price
First job: reclaim $17. Below $17.59, you're in FUEL — moves come faster in both directions. Above it, desks step in and cushion the action.
Watch for a bounce back over $17 or a deeper flush if it can't hold. Structure is clear — trade what confirms.
Here's the map:
$20.00 — ceiling
$17.59 — the flip
$17.00 — the floor
$16.86 — current price
First job: reclaim $17. Below $17.59, you're in FUEL — moves come faster in both directions. Above it, desks step in and cushion the action.
Watch for a bounce back over $17 or a deeper flush if it can't hold. Structure is clear — trade what confirms.
143
·
--
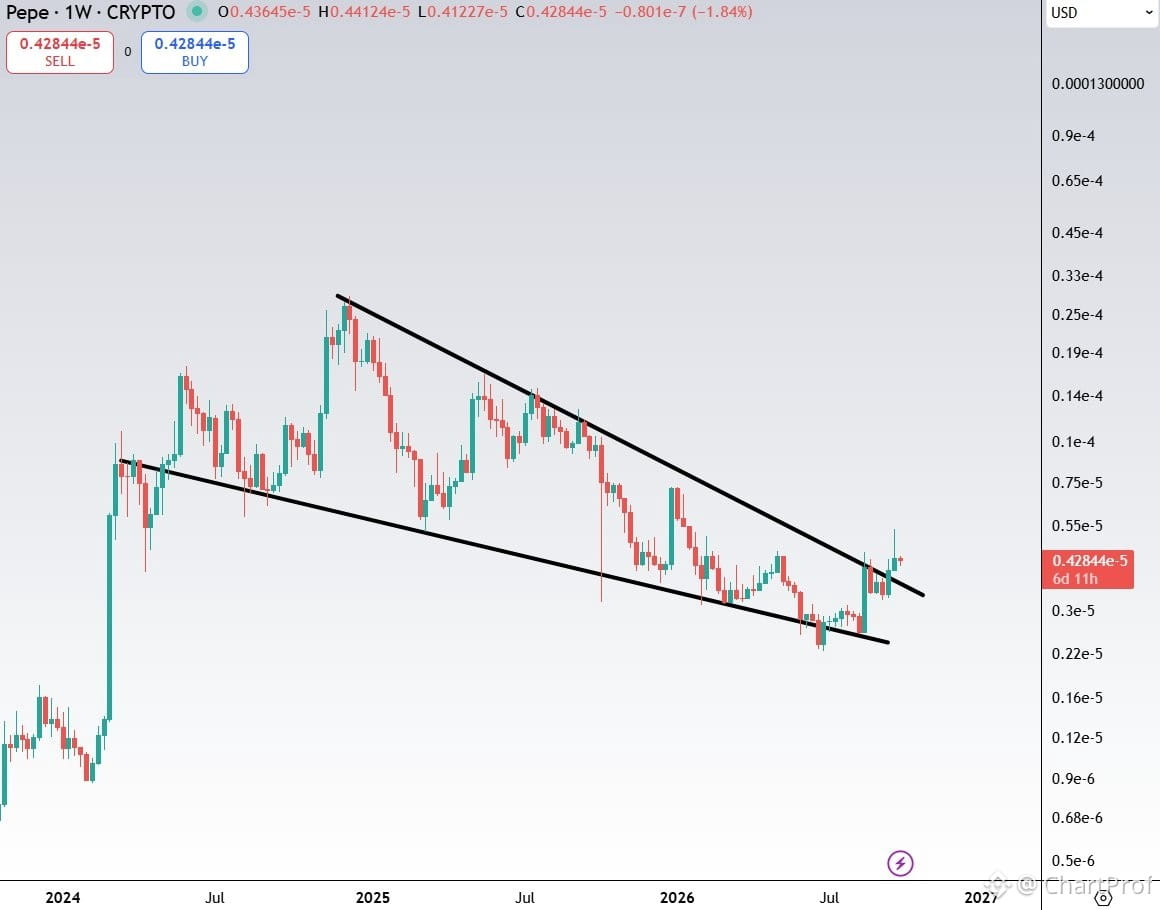
$PEPE just broke out of a 2.5-year falling wedge — textbook bullish structure on the higher timeframe.
Let's break down what that means:
A falling wedge is a compression pattern where price makes lower highs and lower lows, but the range tightens over time. It's typically a continuation or reversal setup depending on context. Here, after 2.5 years of contraction, the breakout suggests accumulation is done and buyers are stepping in with conviction.
What confirms it: Clean break above the upper trendline with volume. If it holds above the wedge resistance on a retest, that's your first confirmation. Watch for the old resistance to flip into support.
What invalidates it: A hard rejection back inside the wedge, especially on volume. If price can't hold above breakout, structure fails and you're back in compression.
This is part of a broader theme — a lot of alts are setting up clean on higher timeframes right now. Wedges, bases, multi-month consolidations all starting to resolve. $PEPE is just one example of what happens when structure meets timing.
Setup is there. Now we watch the follow-through.
$PEPE just broke out of a 2.5-year falling wedge — textbook bullish structure on the higher timeframe.
Let's break down what that means:
A falling wedge is a compression pattern where price makes lower highs and lower lows, but the range tightens over time. It's typically a continuation or reversal setup depending on context. Here, after 2.5 years of contraction, the breakout suggests accumulation is done and buyers are stepping in with conviction.
What confirms it: Clean break above the upper trendline with volume. If it holds above the wedge resistance on a retest, that's your first confirmation. Watch for the old resistance to flip into support.
What invalidates it: A hard rejection back inside the wedge, especially on volume. If price can't hold above breakout, structure fails and you're back in compression.
This is part of a broader theme — a lot of alts are setting up clean on higher timeframes right now. Wedges, bases, multi-month consolidations all starting to resolve. $PEPE is just one example of what happens when structure meets timing.
Setup is there. Now we watch the follow-through.
Let's break down what that means:
A falling wedge is a compression pattern where price makes lower highs and lower lows, but the range tightens over time. It's typically a continuation or reversal setup depending on context. Here, after 2.5 years of contraction, the breakout suggests accumulation is done and buyers are stepping in with conviction.
What confirms it: Clean break above the upper trendline with volume. If it holds above the wedge resistance on a retest, that's your first confirmation. Watch for the old resistance to flip into support.
What invalidates it: A hard rejection back inside the wedge, especially on volume. If price can't hold above breakout, structure fails and you're back in compression.
This is part of a broader theme — a lot of alts are setting up clean on higher timeframes right now. Wedges, bases, multi-month consolidations all starting to resolve. $PEPE is just one example of what happens when structure meets timing.
Setup is there. Now we watch the follow-through.
540
·
--
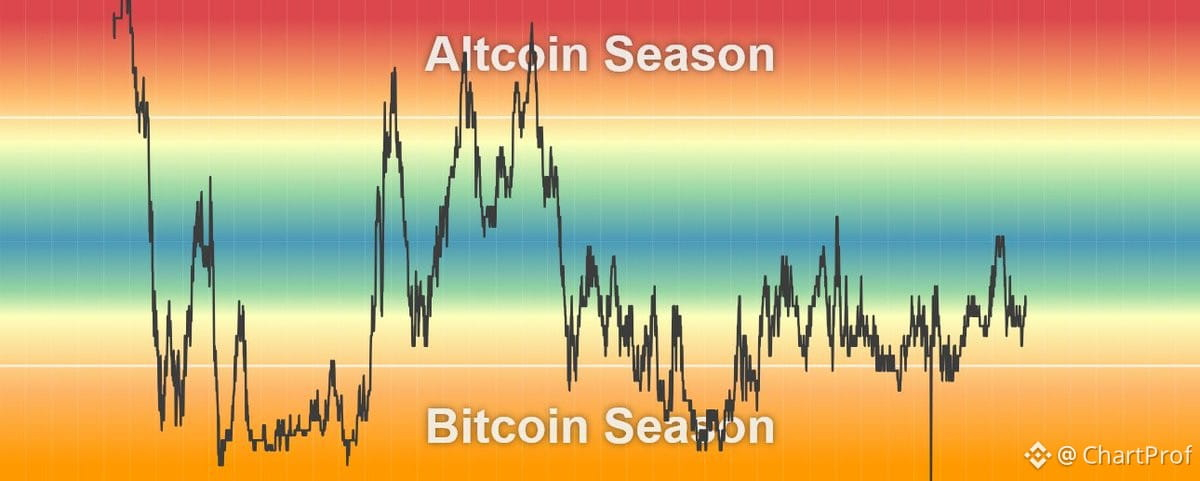
Let's read the Altcoin Season Index like a chart.
Right now we're entering the phase where $BTC climbs but alts start running harder — classic rotation structure. The 2017 playbook: Bitcoin leads, alts follow with leverage.
The Altcoin Season Index measures how many of the top 50 coins outperform $BTC over 90 days. When it's low, Bitcoin dominates. When it rises, alts take over. Right now? Plenty of room left to run higher.
What this means for your setups:
$BTC still needs to hold structure — it's the anchor. But if you're positioned in clean alts with confirmed breakouts, this is the environment where they multiply faster than Bitcoin.
Watch for $BTC consolidation zones. That's when alts rip hardest. If $BTC starts chopping sideways after a leg up, that's your signal to lean into altcoin momentum.
Invalidation: If the index rolls over early or $BTC loses key support, alts get crushed faster than they pumped. Risk management stays tight.
This isn't hype — it's structure. The index confirms what the chart's already showing. Alts are waking up.
Let's read the Altcoin Season Index like a chart.
Right now we're entering the phase where $BTC climbs but alts start running harder — classic rotation structure. The 2017 playbook: Bitcoin leads, alts follow with leverage.
The Altcoin Season Index measures how many of the top 50 coins outperform $BTC over 90 days. When it's low, Bitcoin dominates. When it rises, alts take over. Right now? Plenty of room left to run higher.
What this means for your setups:
$BTC still needs to hold structure — it's the anchor. But if you're positioned in clean alts with confirmed breakouts, this is the environment where they multiply faster than Bitcoin.
Watch for $BTC consolidation zones. That's when alts rip hardest. If $BTC starts chopping sideways after a leg up, that's your signal to lean into altcoin momentum.
Invalidation: If the index rolls over early or $BTC loses key support, alts get crushed faster than they pumped. Risk management stays tight.
This isn't hype — it's structure. The index confirms what the chart's already showing. Alts are waking up.
Right now we're entering the phase where $BTC climbs but alts start running harder — classic rotation structure. The 2017 playbook: Bitcoin leads, alts follow with leverage.
The Altcoin Season Index measures how many of the top 50 coins outperform $BTC over 90 days. When it's low, Bitcoin dominates. When it rises, alts take over. Right now? Plenty of room left to run higher.
What this means for your setups:
$BTC still needs to hold structure — it's the anchor. But if you're positioned in clean alts with confirmed breakouts, this is the environment where they multiply faster than Bitcoin.
Watch for $BTC consolidation zones. That's when alts rip hardest. If $BTC starts chopping sideways after a leg up, that's your signal to lean into altcoin momentum.
Invalidation: If the index rolls over early or $BTC loses key support, alts get crushed faster than they pumped. Risk management stays tight.
This isn't hype — it's structure. The index confirms what the chart's already showing. Alts are waking up.
289
·
--
Alright, let's break down what's happening with altcoins from a structural perspective.
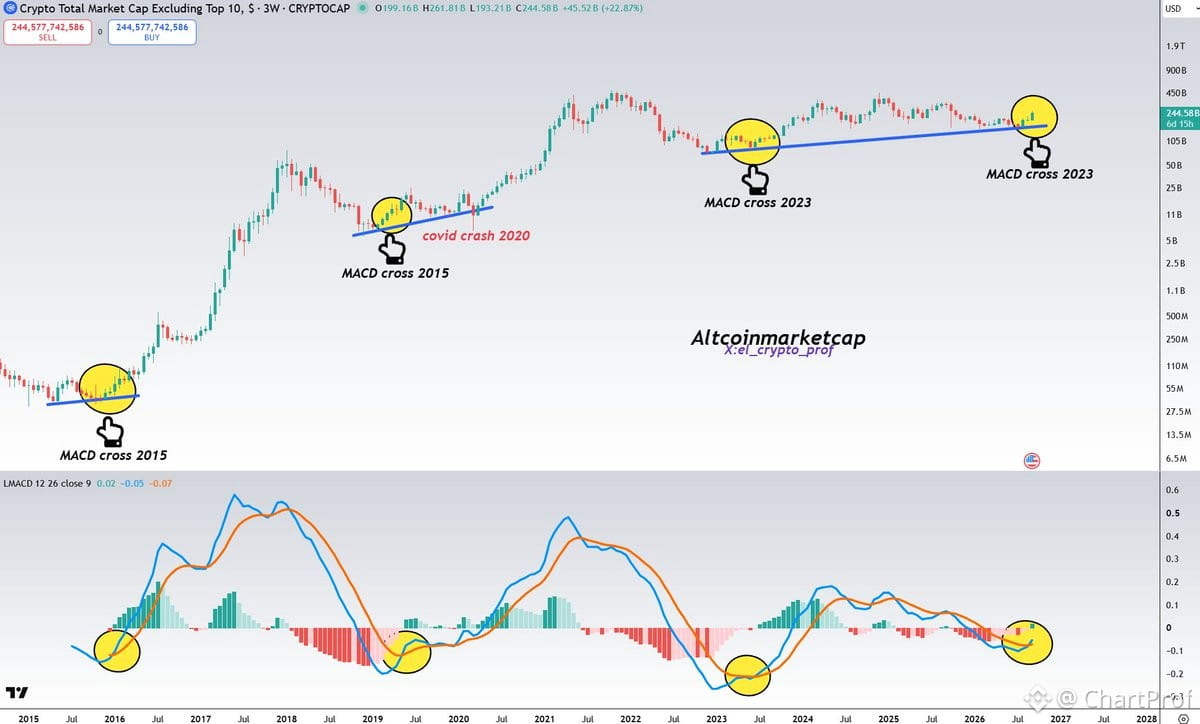
OTHERS just printed a bullish crossover on the 3-week timeframe. This is a macro signal — not a day-trade setup, but a regime shift indicator. Historically, when this crossover confirms, we've seen sustained alt rallies unfold over the following months. Think of it like a slow-moving freight train: once it starts, momentum builds.
What does this mean for positioning?
First, understand the timeframe. A 3W crossover doesn't trigger instant pumps. It tells you the wind direction changed. Alts are shifting from accumulation/chop into expansion mode. Your job now is to identify which alts are leading — clean structure, volume confirmation, relative strength against $BTC.
Second, this is a signal to start building conviction in quality setups, not to ape into everything. Look for alts breaking key resistance zones with volume, holding higher lows, and showing relative strength when $BTC consolidates.
Invalidation? If OTHERS fails to hold this crossover and rolls back under, the signal dies. Simple.
Bottom line: This is your macro green light. Now go find the clean charts within the alt space and position accordingly. Structure first, hype never.
Alright, let's break down what's happening with altcoins from a structural perspective.
OTHERS just printed a bullish crossover on the 3-week timeframe. This is a macro signal — not a day-trade setup, but a regime shift indicator. Historically, when this crossover confirms, we've seen sustained alt rallies unfold over the following months. Think of it like a slow-moving freight train: once it starts, momentum builds.
What does this mean for positioning?
First, understand the timeframe. A 3W crossover doesn't trigger instant pumps. It tells you the wind direction changed. Alts are shifting from accumulation/chop into expansion mode. Your job now is to identify which alts are leading — clean structure, volume confirmation, relative strength against $BTC.
Second, this is a signal to start building conviction in quality setups, not to ape into everything. Look for alts breaking key resistance zones with volume, holding higher lows, and showing relative strength when $BTC consolidates.
Invalidation? If OTHERS fails to hold this crossover and rolls back under, the signal dies. Simple.
Bottom line: This is your macro green light. Now go find the clean charts within the alt space and position accordingly. Structure first, hype never.
OTHERS just printed a bullish crossover on the 3-week timeframe. This is a macro signal — not a day-trade setup, but a regime shift indicator. Historically, when this crossover confirms, we've seen sustained alt rallies unfold over the following months. Think of it like a slow-moving freight train: once it starts, momentum builds.
What does this mean for positioning?
First, understand the timeframe. A 3W crossover doesn't trigger instant pumps. It tells you the wind direction changed. Alts are shifting from accumulation/chop into expansion mode. Your job now is to identify which alts are leading — clean structure, volume confirmation, relative strength against $BTC.
Second, this is a signal to start building conviction in quality setups, not to ape into everything. Look for alts breaking key resistance zones with volume, holding higher lows, and showing relative strength when $BTC consolidates.
Invalidation? If OTHERS fails to hold this crossover and rolls back under, the signal dies. Simple.
Bottom line: This is your macro green light. Now go find the clean charts within the alt space and position accordingly. Structure first, hype never.
155
Войдите, чтобы посмотреть больше материала
Присоединяйтесь к пользователям криптовалют по всему миру на Binance Square
⚡️ Получайте новейшую и полезную информацию о криптоактивах.
💬 Нам доверяет крупнейшая в мире криптобиржа.
👍 Получите достоверные аналитические данные от верифицированных создателей контента.
Эл. почта/номер телефона
В тренде
BinanceKZ
Просмотров: 10,529
65 обсуждают
Как я потерял 180 000 тенге на «менеджере Binance» из WhatsApp — и почему всё равно остался в крипте
phpdead
·Лайков: 6
·Просмотров: 2.3k
EarningsSeason
Просмотров: 223,381
2,026 обсуждают
BitwiseLaunchesFirstSpotNEARETF
Просмотров: 10,303
328 обсуждают