
BOSSMD
424 Публикации

BOSSMD
Market Analysts || Breaking down Charts, trends and narratives
Открытая сделка
Трейдер с регулярными сделками
2.8 г
3 подписок(и/а)
153 подписчиков(а)
867 понравилось
Посты
Портфель
Все
Цитирования
PINNED
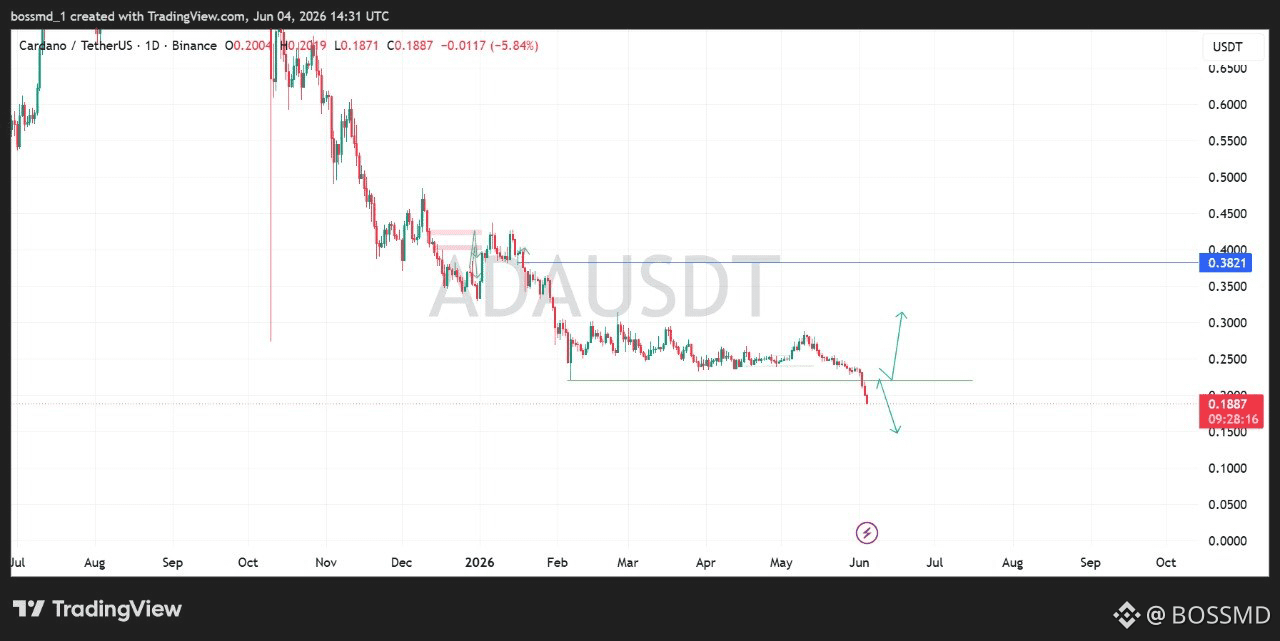
#Cardano is trading at a critical support level after months of sustained downside pressure.
The recent breakdown below the range support shows that sellers still have control, but this is also the type of area where strong reactions can emerge.
The chart suggests two scenarios: a deeper sweep into lower support followed by a recovery, or a quick reclaim of the broken level that traps late sellers and sparks a bounce toward the $0.30–0.38 region.
What catches my attention is that $ADA is approaching a zone where risk-to-reward becomes more attractive. The market often tests patience before a meaningful reversal takes shape.
For now, the key is watching how price reacts around current levels. If buyers step in and reclaim support, this could mark the beginning of a stronger recovery phase.
The recent breakdown below the range support shows that sellers still have control, but this is also the type of area where strong reactions can emerge.
The chart suggests two scenarios: a deeper sweep into lower support followed by a recovery, or a quick reclaim of the broken level that traps late sellers and sparks a bounce toward the $0.30–0.38 region.
What catches my attention is that $ADA is approaching a zone where risk-to-reward becomes more attractive. The market often tests patience before a meaningful reversal takes shape.
For now, the key is watching how price reacts around current levels. If buyers step in and reclaim support, this could mark the beginning of a stronger recovery phase.
PINNED
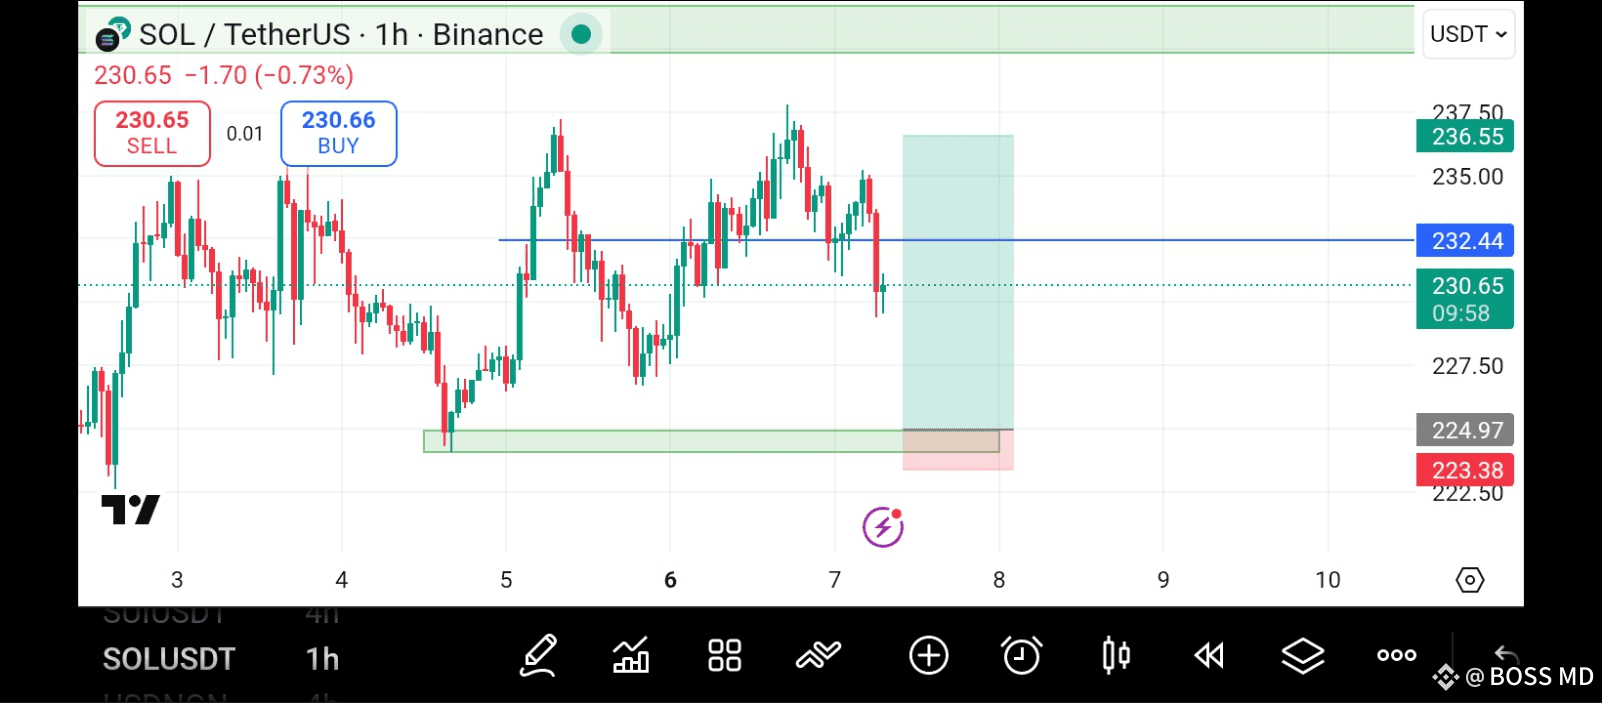
$SOL price is showing a short-term pullback after facing resistance around the $232–$236 zone. Despite the dip, buyers are still active above the $224–$223 support range, where demand has previously held strong.
If bulls defend this level, #sol could aim for another retest of $236 and possibly break higher. But a close below $223 might invite more downside pressure.
SOL remains in a consolidation phase, waiting for a clear breakout direction.
#solana
If bulls defend this level, #sol could aim for another retest of $236 and possibly break higher. But a close below $223 might invite more downside pressure.
SOL remains in a consolidation phase, waiting for a clear breakout direction.
#solana
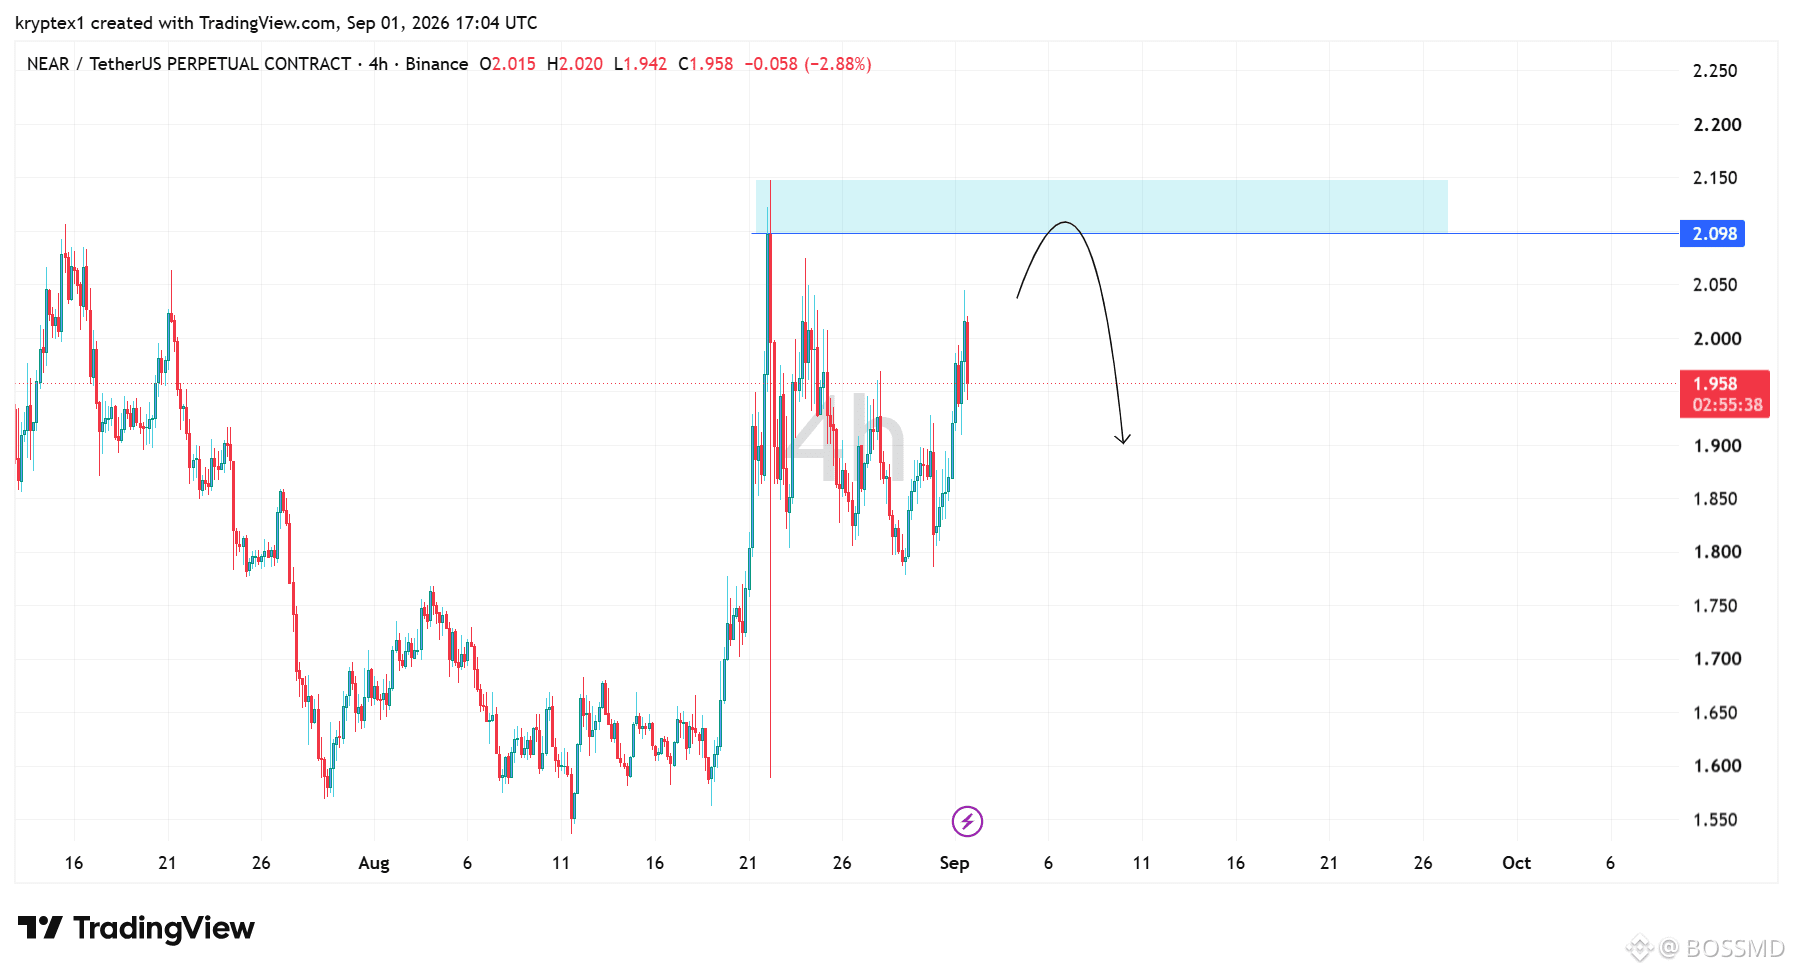
#Near is approaching a major resistance zone around $2.10–$2.15 after recovering strongly from the $1.55–$1.65 region.
The chart shows price repeatedly reacting around this area, so the next move could be decisive.
If $NEAR pushes into $2.10–$2.15 and gets rejected, a pullback toward the $1.90–$1.95 region looks possible.
But if buyers manage to reclaim and hold above the resistance zone, the bearish setup would be invalidated and a stronger continuation could follow.
The chart shows price repeatedly reacting around this area, so the next move could be decisive.
If $NEAR pushes into $2.10–$2.15 and gets rejected, a pullback toward the $1.90–$1.95 region looks possible.
But if buyers manage to reclaim and hold above the resistance zone, the bearish setup would be invalidated and a stronger continuation could follow.
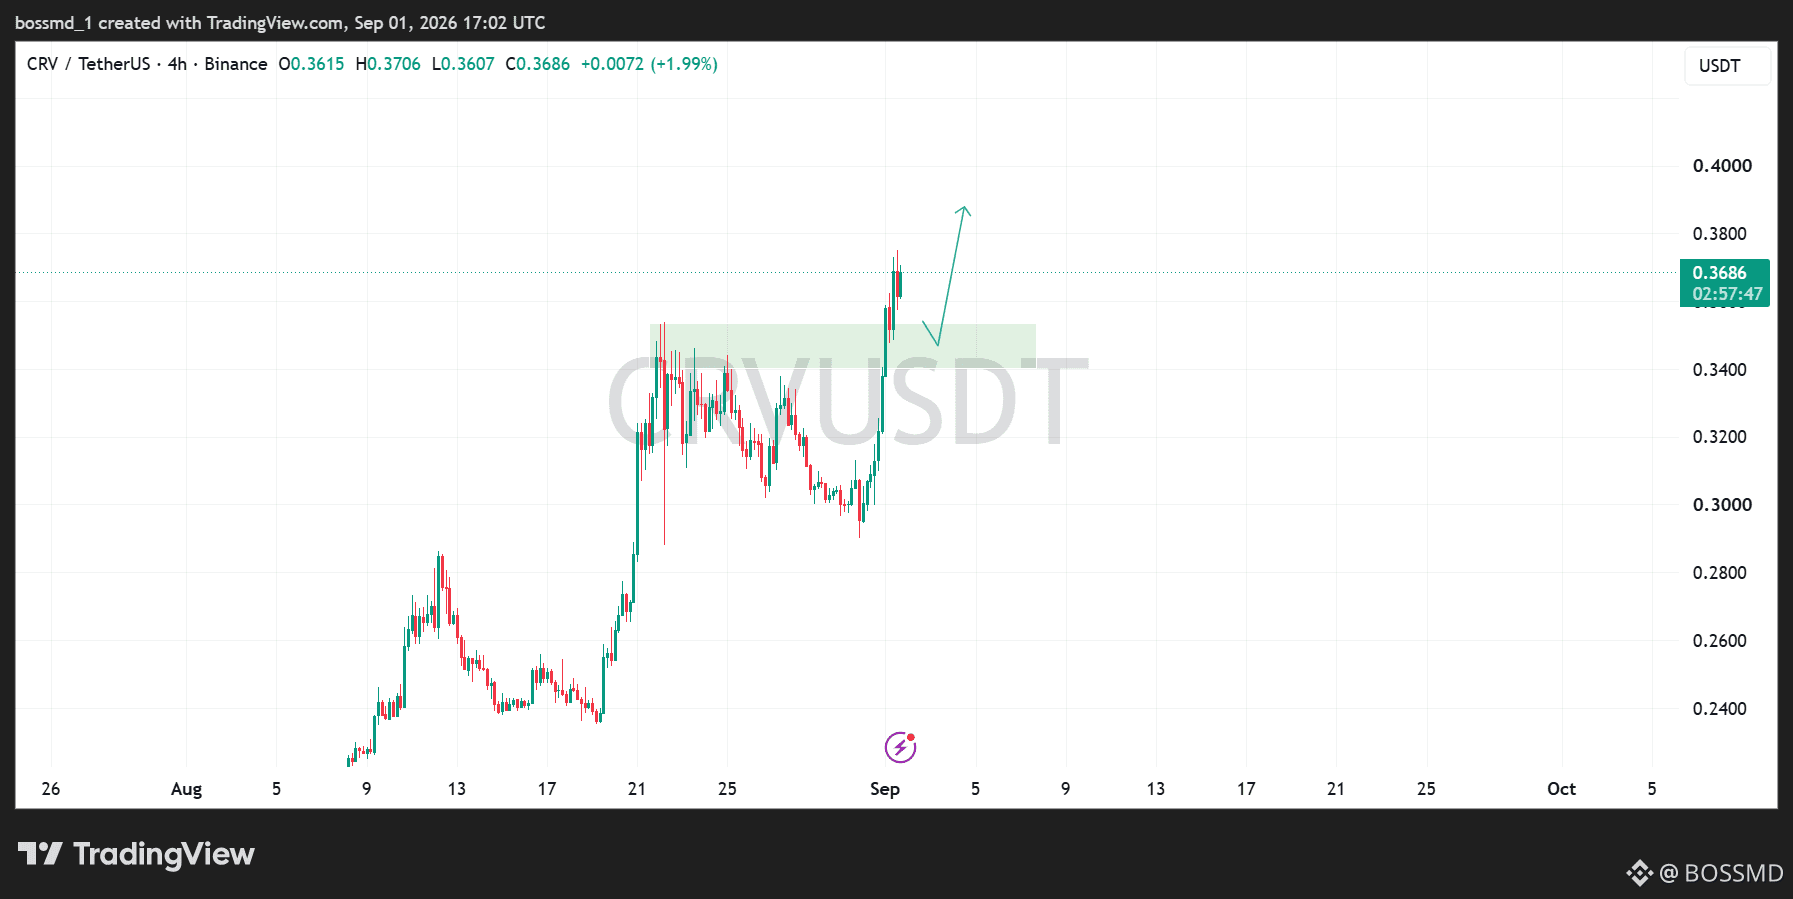
$CRV has broken out of its recent consolidation and pushed toward $0.37, showing strong momentum.
The key area now is the $0.34–$0.35 zone. If price pulls back, holds this area, and turns it into support, the chart suggests a possible continuation toward $0.39–$0.40.
For now, the breakout looks constructive, but the retest is what I’d watch for confirmation. #bullish
The key area now is the $0.34–$0.35 zone. If price pulls back, holds this area, and turns it into support, the chart suggests a possible continuation toward $0.39–$0.40.
For now, the breakout looks constructive, but the retest is what I’d watch for confirmation. #bullish
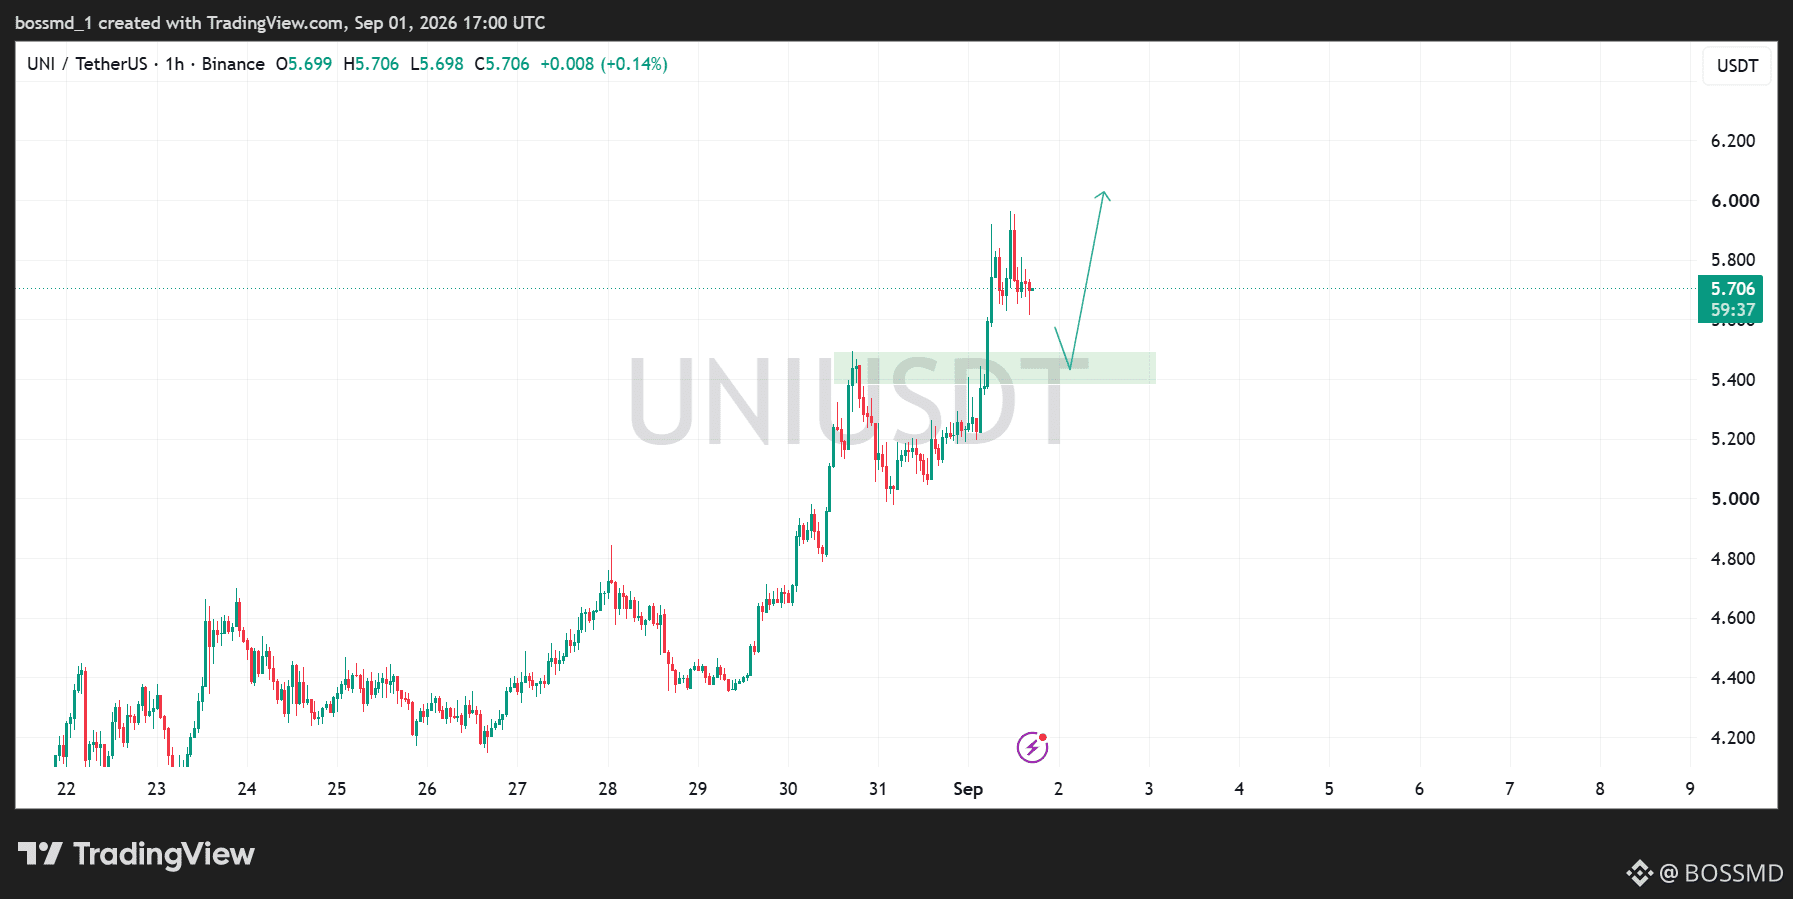
$UNI has been moving nicely on the 1H chart, pushing from around $4.20 to the current $5.70 area.
Right now, I’m watching the $5.40–$5.50 zone as the key support area. If #UNI pulls back into this zone, holds it, and buyers step back in, I’d be looking for a continuation toward $6.00.
The important part is not chasing the current move. Let the price come back to the zone and show strength first.
Right now, I’m watching the $5.40–$5.50 zone as the key support area. If #UNI pulls back into this zone, holds it, and buyers step back in, I’d be looking for a continuation toward $6.00.
The important part is not chasing the current move. Let the price come back to the zone and show strength first.
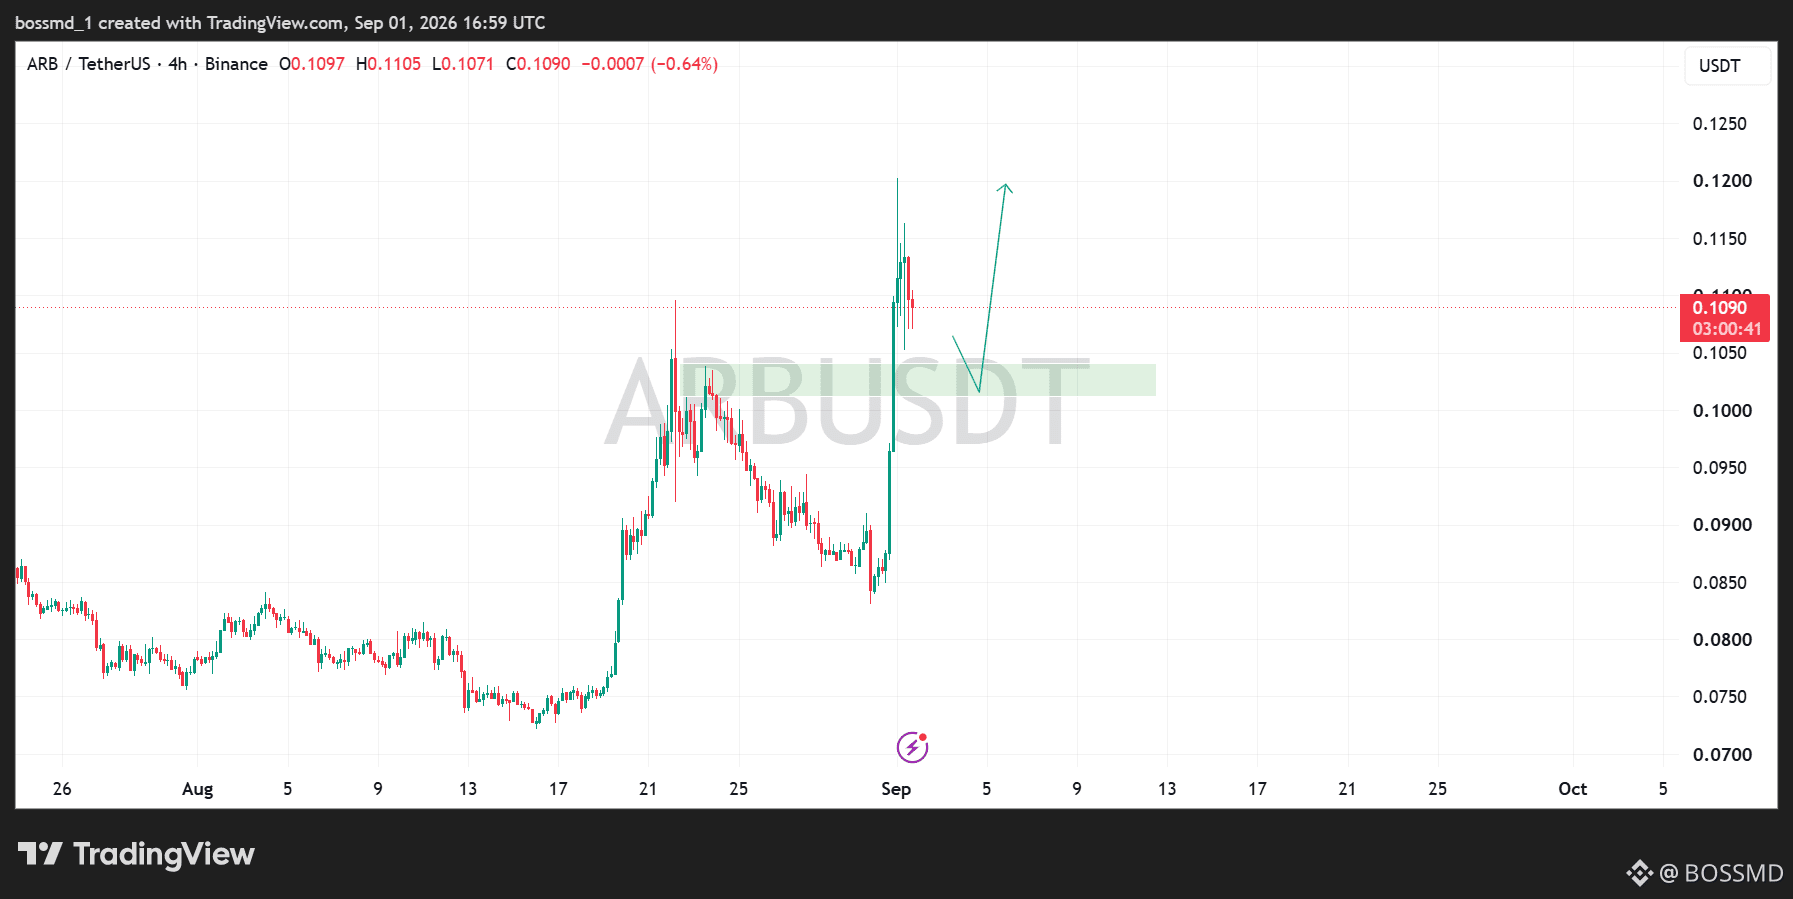
#ARB looking interesting here 👀
$ARB has just made a strong move on the 4H chart, breaking above the previous resistance area around $0.105.
Now I’m watching the $0.102–$0.105 zone as the key area. If price pulls back, holds this zone as support, and buyers step in, the next move could target $0.12.
I wouldn’t chase the pump here. I’d rather watch how ARB reacts at the breakout zone first.
$ARB has just made a strong move on the 4H chart, breaking above the previous resistance area around $0.105.
Now I’m watching the $0.102–$0.105 zone as the key area. If price pulls back, holds this zone as support, and buyers step in, the next move could target $0.12.
I wouldn’t chase the pump here. I’d rather watch how ARB reacts at the breakout zone first.
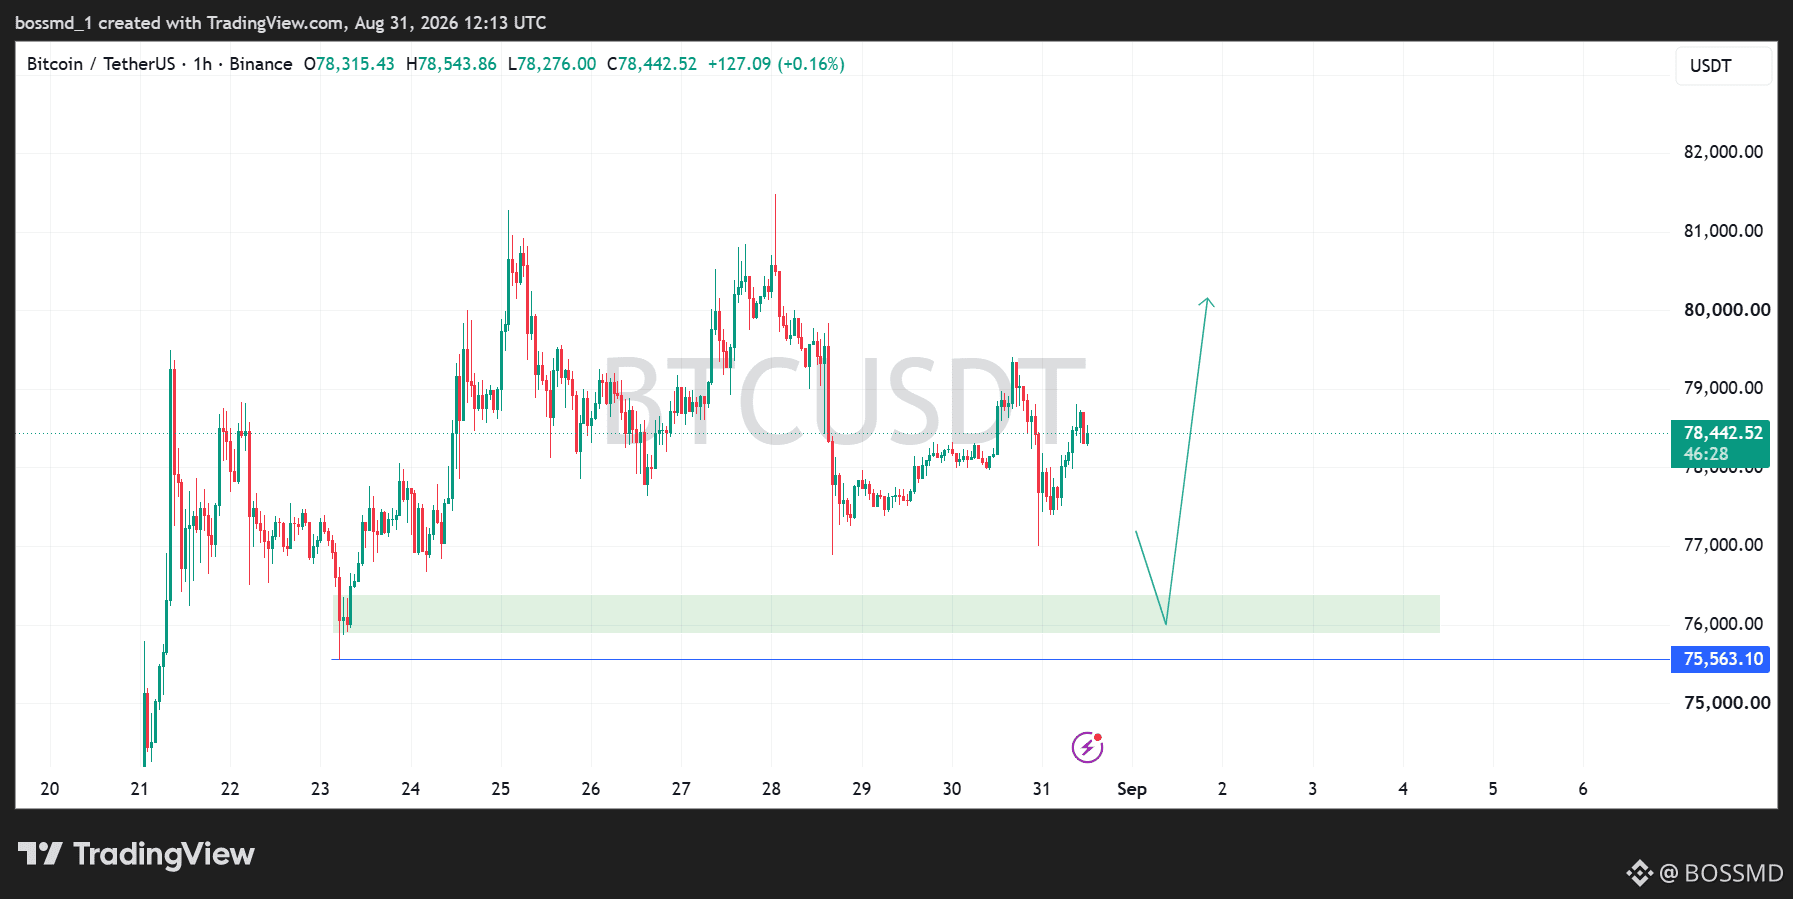
#bitcoin looks ready for another move
$BTC is currently trading around $78,400 on the 1H chart and still moving inside a range.
The key area I’m watching is the $76,000–$76,300 support zone. If price dips into this zone and buyers step in, I’d be looking for a move back toward $80,000+.
The setup is simple: pullback → support holds → bullish continuation.
But if #BTC breaks and holds below the support zone, this idea becomes invalid and I’d stay cautious.
$BTC is currently trading around $78,400 on the 1H chart and still moving inside a range.
The key area I’m watching is the $76,000–$76,300 support zone. If price dips into this zone and buyers step in, I’d be looking for a move back toward $80,000+.
The setup is simple: pullback → support holds → bullish continuation.
But if #BTC breaks and holds below the support zone, this idea becomes invalid and I’d stay cautious.
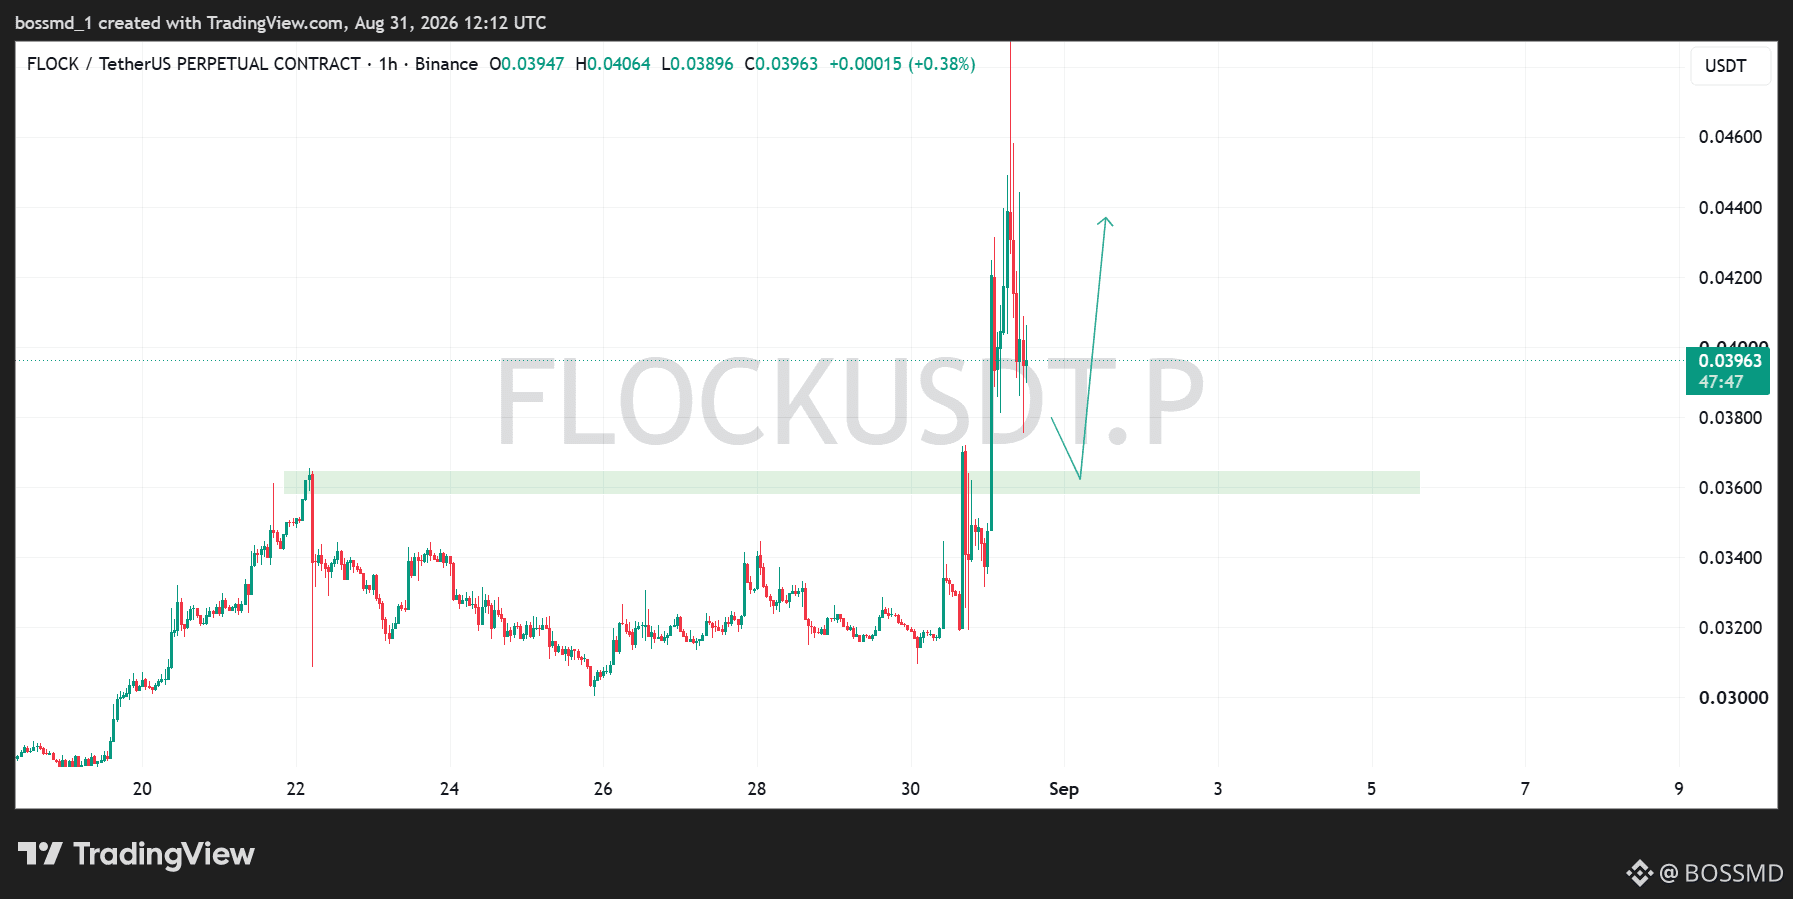
Looking at the 1H chart, $FLOCK has just made a strong breakout from the $0.036 area, pushing as high as the $0.04+ region before pulling back.
Right now, I’m watching the $0.036–$0.037 support zone. This was an important resistance area before the breakout, so a successful retest could turn it into support.
If buyers defend this zone and momentum comes back, the next move I’m watching is toward $0.043–$0.044.
I wouldn’t chase the move after such a sharp pump. The cleaner setup for me would be a pullback into the marked zone, followed by a clear #bullish reaction.
If #Flock loses that support and starts closing below it, I’d be more cautious and wait for a new setup.
Right now, I’m watching the $0.036–$0.037 support zone. This was an important resistance area before the breakout, so a successful retest could turn it into support.
If buyers defend this zone and momentum comes back, the next move I’m watching is toward $0.043–$0.044.
I wouldn’t chase the move after such a sharp pump. The cleaner setup for me would be a pullback into the marked zone, followed by a clear #bullish reaction.
If #Flock loses that support and starts closing below it, I’d be more cautious and wait for a new setup.
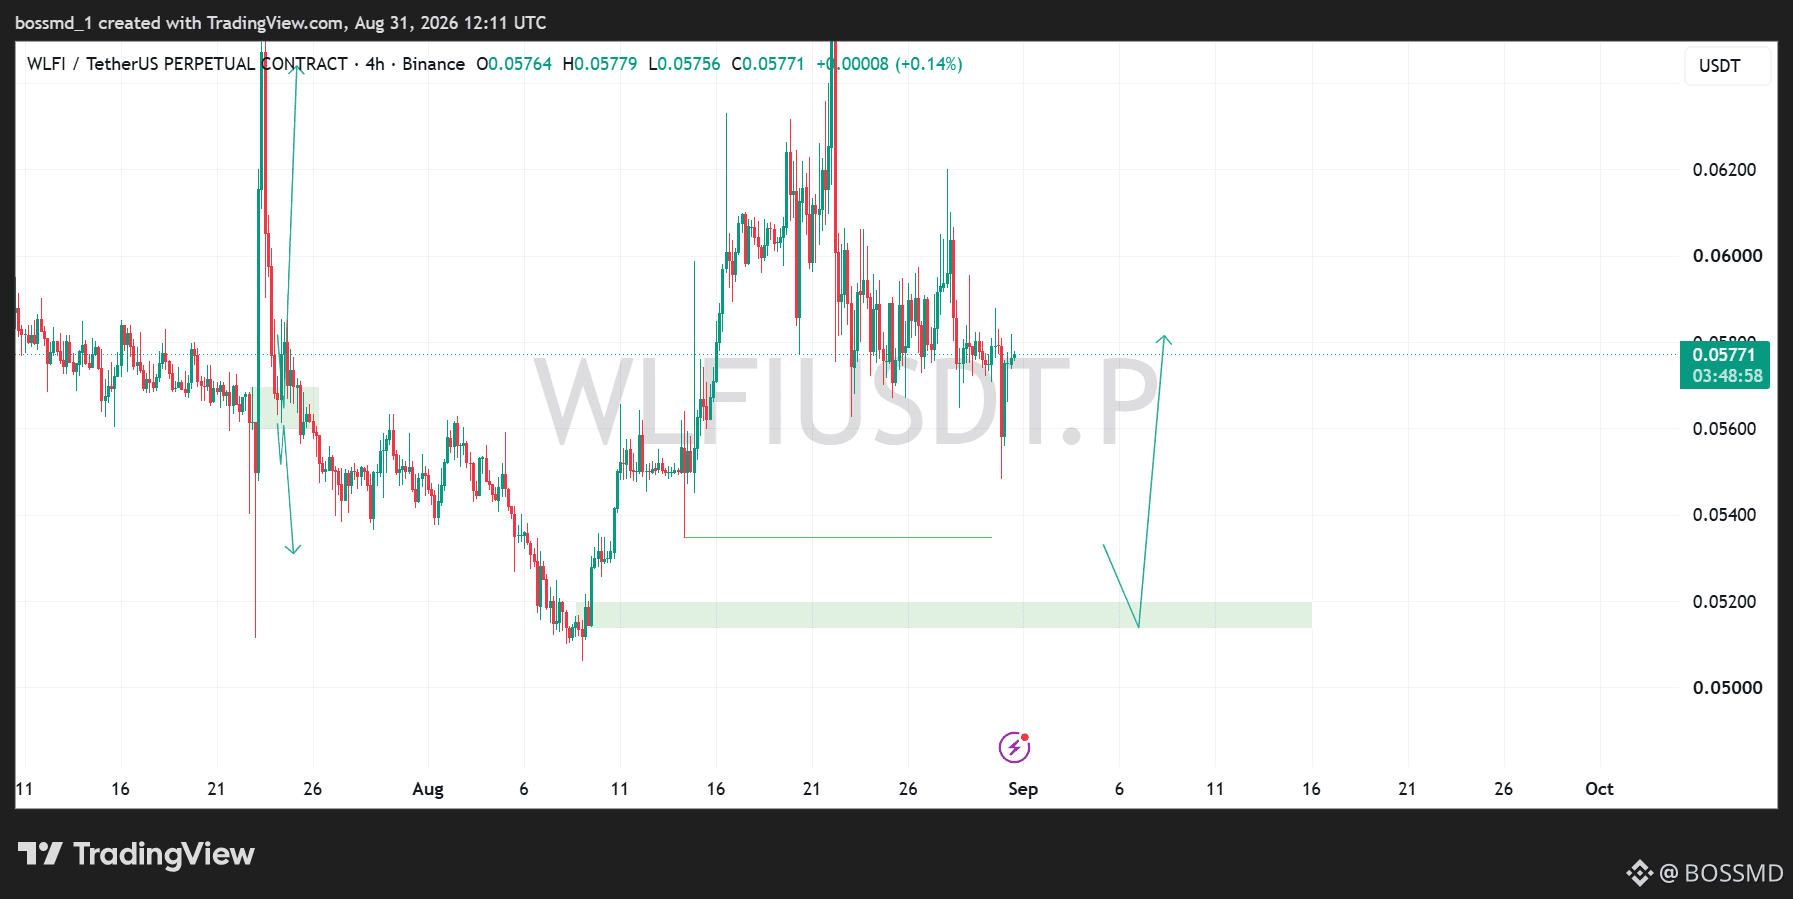
$WLFI is setting up for another interesting move
The 4H chart shows price consolidating after the recent volatility, with buyers still defending the lower structure. The key area I’m watching is around $0.0515–$0.0520, which looks like a strong demand zone.
If #WLFI pulls back into that zone and holds, I’d expect buyers to step back in and push price toward the $0.058–$0.060 area, with a possible continuation higher if momentum strengthens.
For now, the setup remains bullish as long as that support zone holds. Patience here let price come to the level rather than chasing the move.
The 4H chart shows price consolidating after the recent volatility, with buyers still defending the lower structure. The key area I’m watching is around $0.0515–$0.0520, which looks like a strong demand zone.
If #WLFI pulls back into that zone and holds, I’d expect buyers to step back in and push price toward the $0.058–$0.060 area, with a possible continuation higher if momentum strengthens.
For now, the setup remains bullish as long as that support zone holds. Patience here let price come to the level rather than chasing the move.
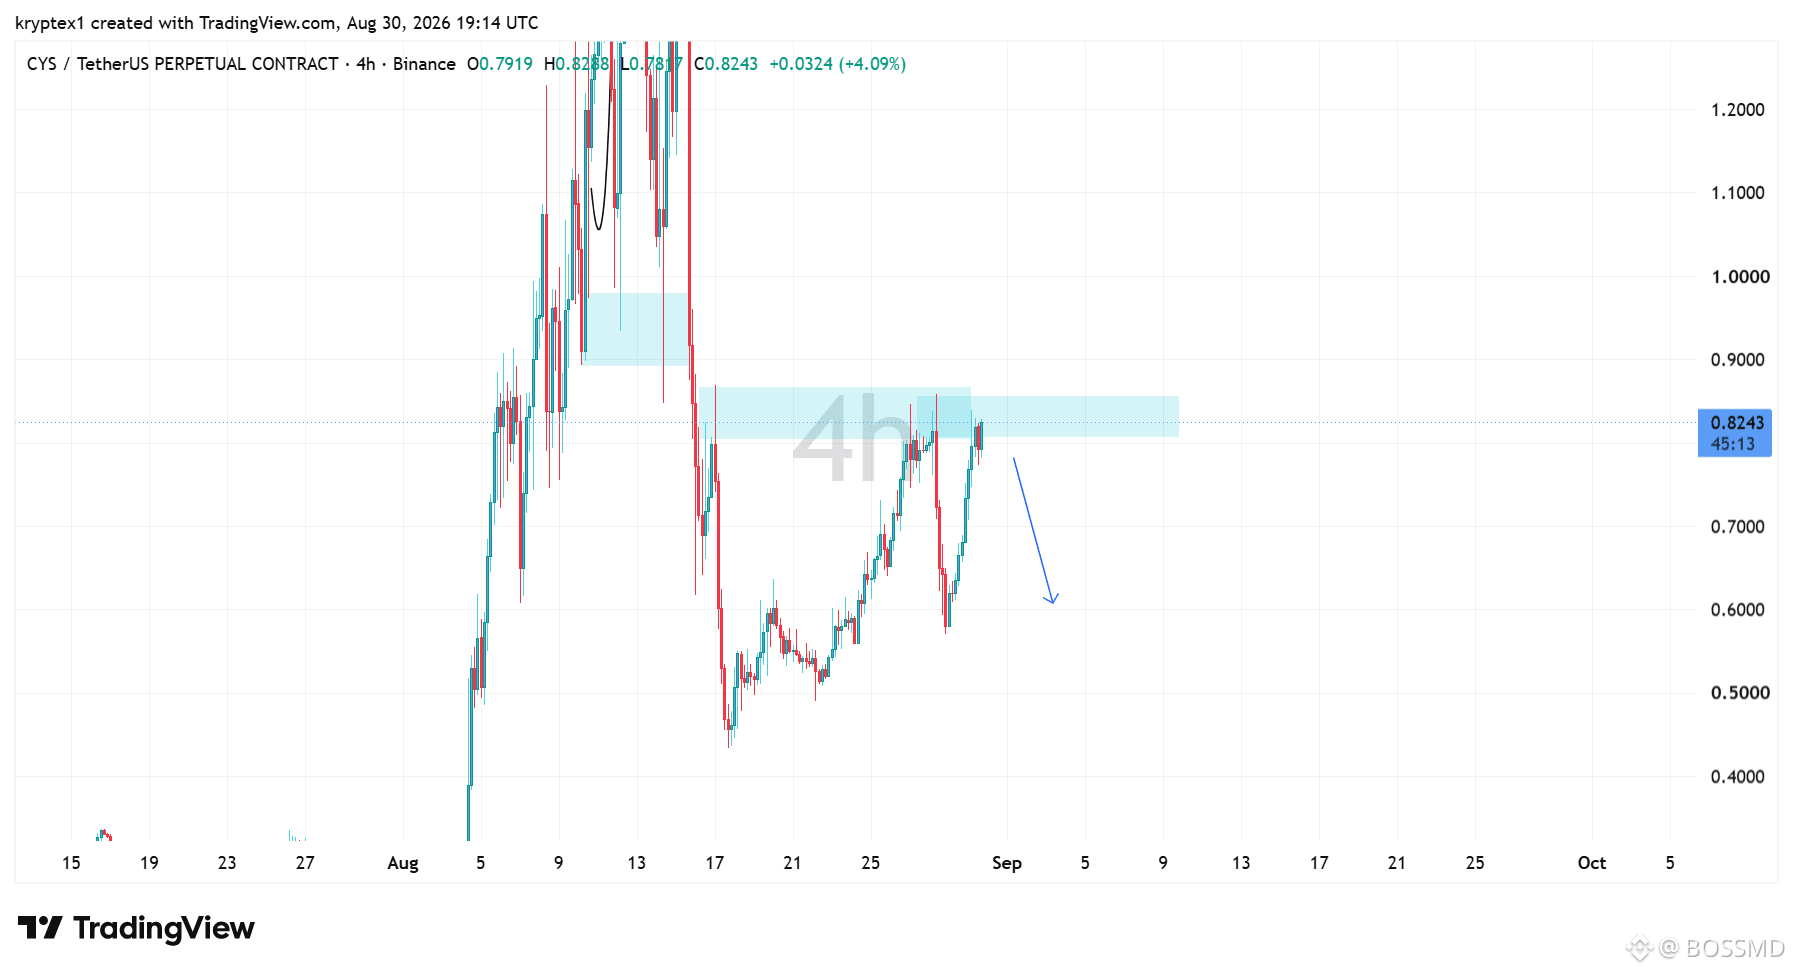
$CYS is currently trading around $0.82 on the 4H chart and has pushed back into a major resistance/supply zone.
Price has made a strong recovery from the lower levels, but this area could be where sellers step in again.
If #Cys gets rejected from the current zone, a pullback toward the lower support could provide the next interesting reaction.
However, a clean breakout and strong 4H close above the supply zone could completely change the setup and open the door for further upside. #bullish
Price has made a strong recovery from the lower levels, but this area could be where sellers step in again.
If #Cys gets rejected from the current zone, a pullback toward the lower support could provide the next interesting reaction.
However, a clean breakout and strong 4H close above the supply zone could completely change the setup and open the door for further upside. #bullish
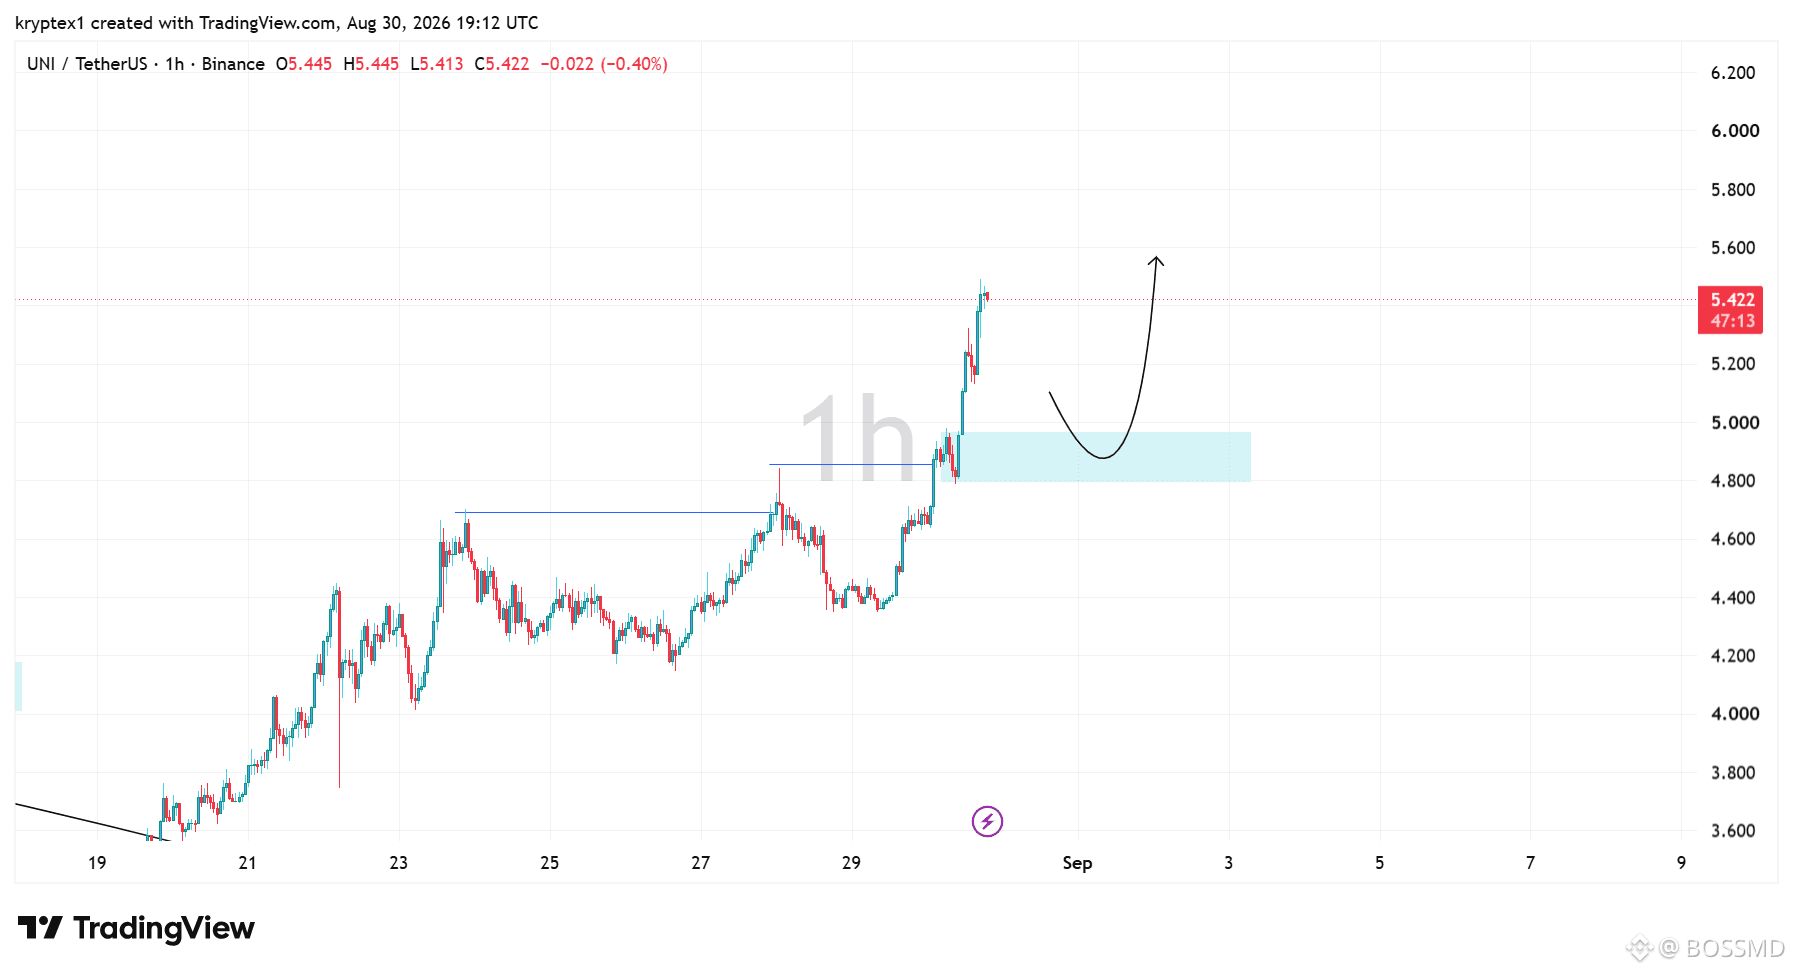
$UNI looking ready for the next leg
#uniswap has just made a strong breakout on the 1H chart, pushing from the previous range around $4.70 to the current $5.42 area.
After this sharp move, I’m watching for a pullback into the $4.85–$5.00 zone. This area could act as a retest/support zone if the breakout is genuine.
If buyers defend the zone, the chart structure points toward a possible continuation toward $5.50–$5.60.
The key is patience: a clean hold above the breakout area would keep the bullish setup alive, while losing the zone could mean the breakout needs more time to develop.
#UNI is definitely one to keep on the radar.
#uniswap has just made a strong breakout on the 1H chart, pushing from the previous range around $4.70 to the current $5.42 area.
After this sharp move, I’m watching for a pullback into the $4.85–$5.00 zone. This area could act as a retest/support zone if the breakout is genuine.
If buyers defend the zone, the chart structure points toward a possible continuation toward $5.50–$5.60.
The key is patience: a clean hold above the breakout area would keep the bullish setup alive, while losing the zone could mean the breakout needs more time to develop.
#UNI is definitely one to keep on the radar.
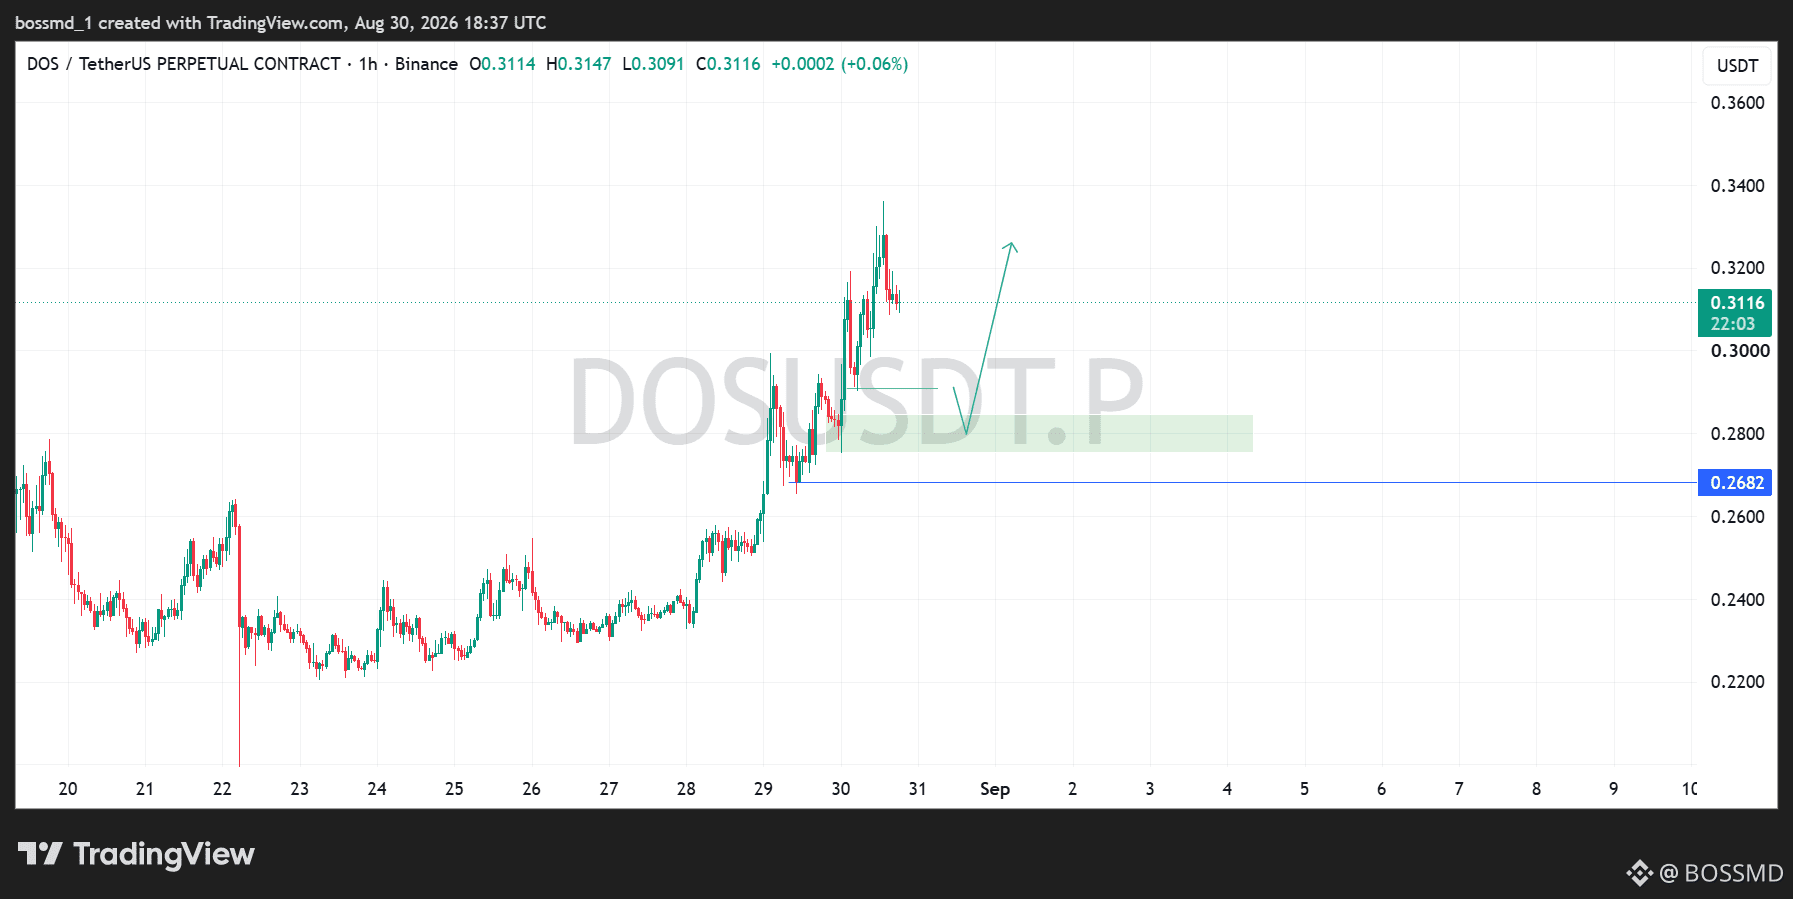
$DOS is showing strong bullish momentum after breaking out of its previous consolidation range.
Price pushed up toward the $0.33 area and is now cooling off, which could lead to a healthy retest.
The key zone to watch is around $0.28–$0.29. If DOS holds this area and buyers step back in, the current structure suggests another push toward $0.32–$0.33 could be possible.
The $0.268 level remains an important support below. A clean break below it would weaken the bullish setup. #bullish
Price pushed up toward the $0.33 area and is now cooling off, which could lead to a healthy retest.
The key zone to watch is around $0.28–$0.29. If DOS holds this area and buyers step back in, the current structure suggests another push toward $0.32–$0.33 could be possible.
The $0.268 level remains an important support below. A clean break below it would weaken the bullish setup. #bullish
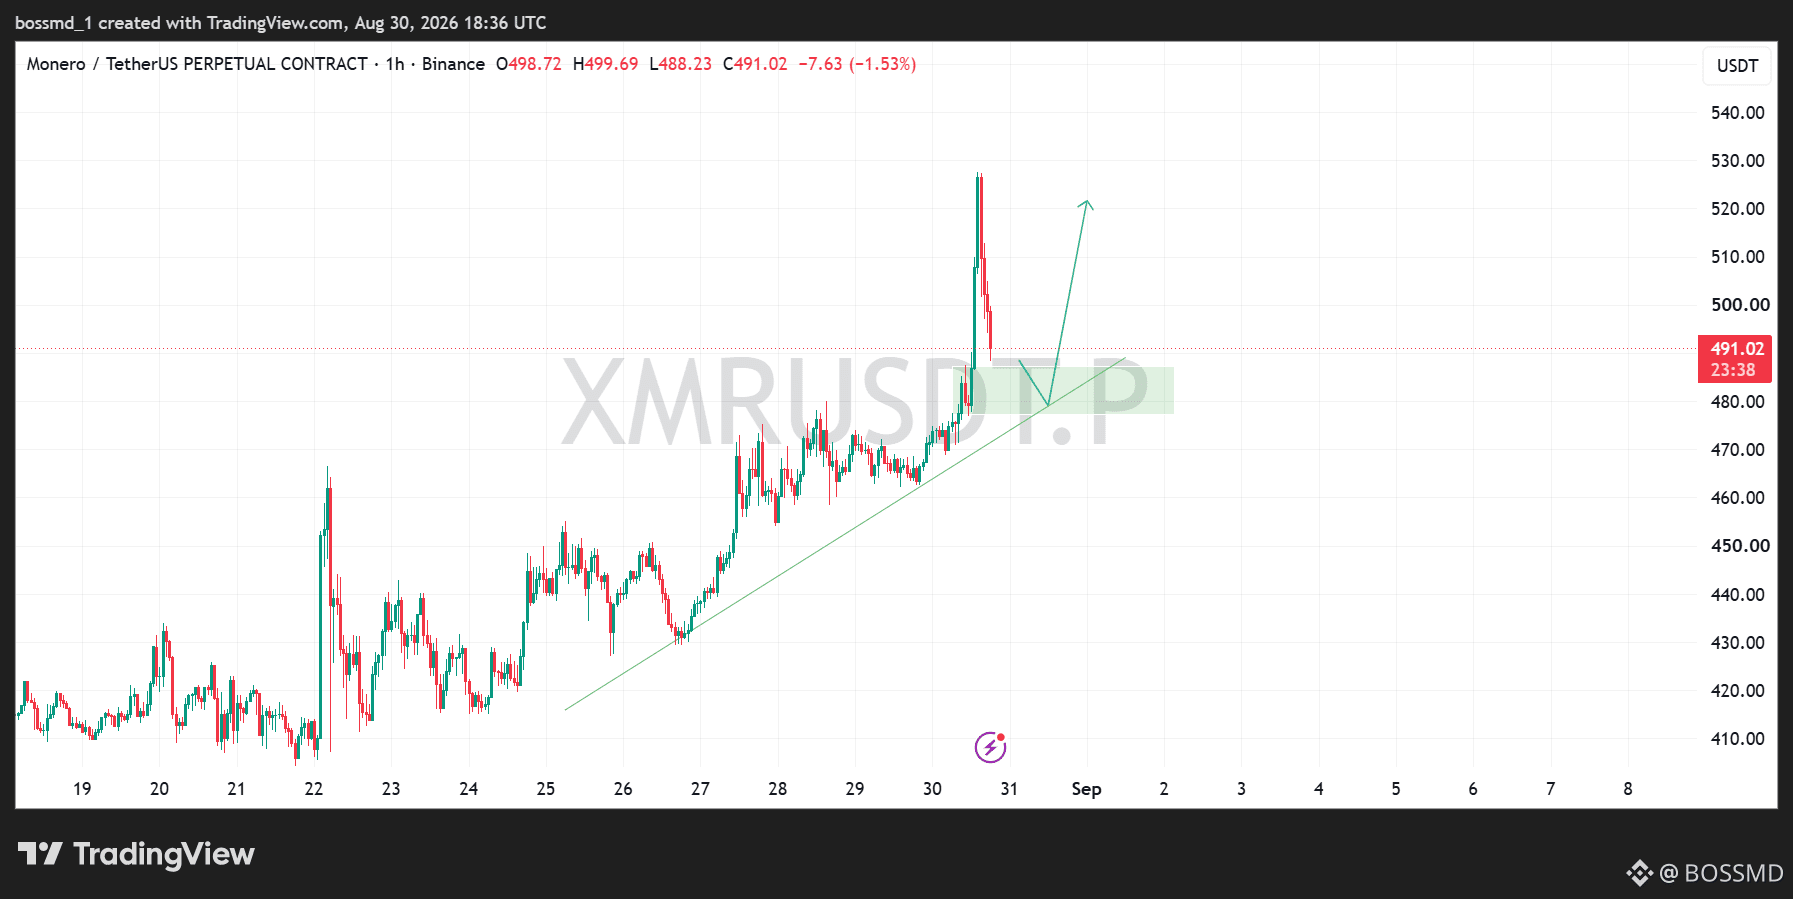
$XMR is showing an interesting setup after the strong breakout toward the $525 area.
The sharp pullback has brought price back into the $480–$490 support zone, which is also sitting around the rising trendline.
If this support holds and buyers step back in, we could see #XMR regain momentum and make another attempt toward $520–$525. The bullish setup remains valid as long as price respects this area.
However, a decisive break below the trendline and support zone could signal a deeper correction.
Watching the reaction around $480–$490 closely.
The sharp pullback has brought price back into the $480–$490 support zone, which is also sitting around the rising trendline.
If this support holds and buyers step back in, we could see #XMR regain momentum and make another attempt toward $520–$525. The bullish setup remains valid as long as price respects this area.
However, a decisive break below the trendline and support zone could signal a deeper correction.
Watching the reaction around $480–$490 closely.
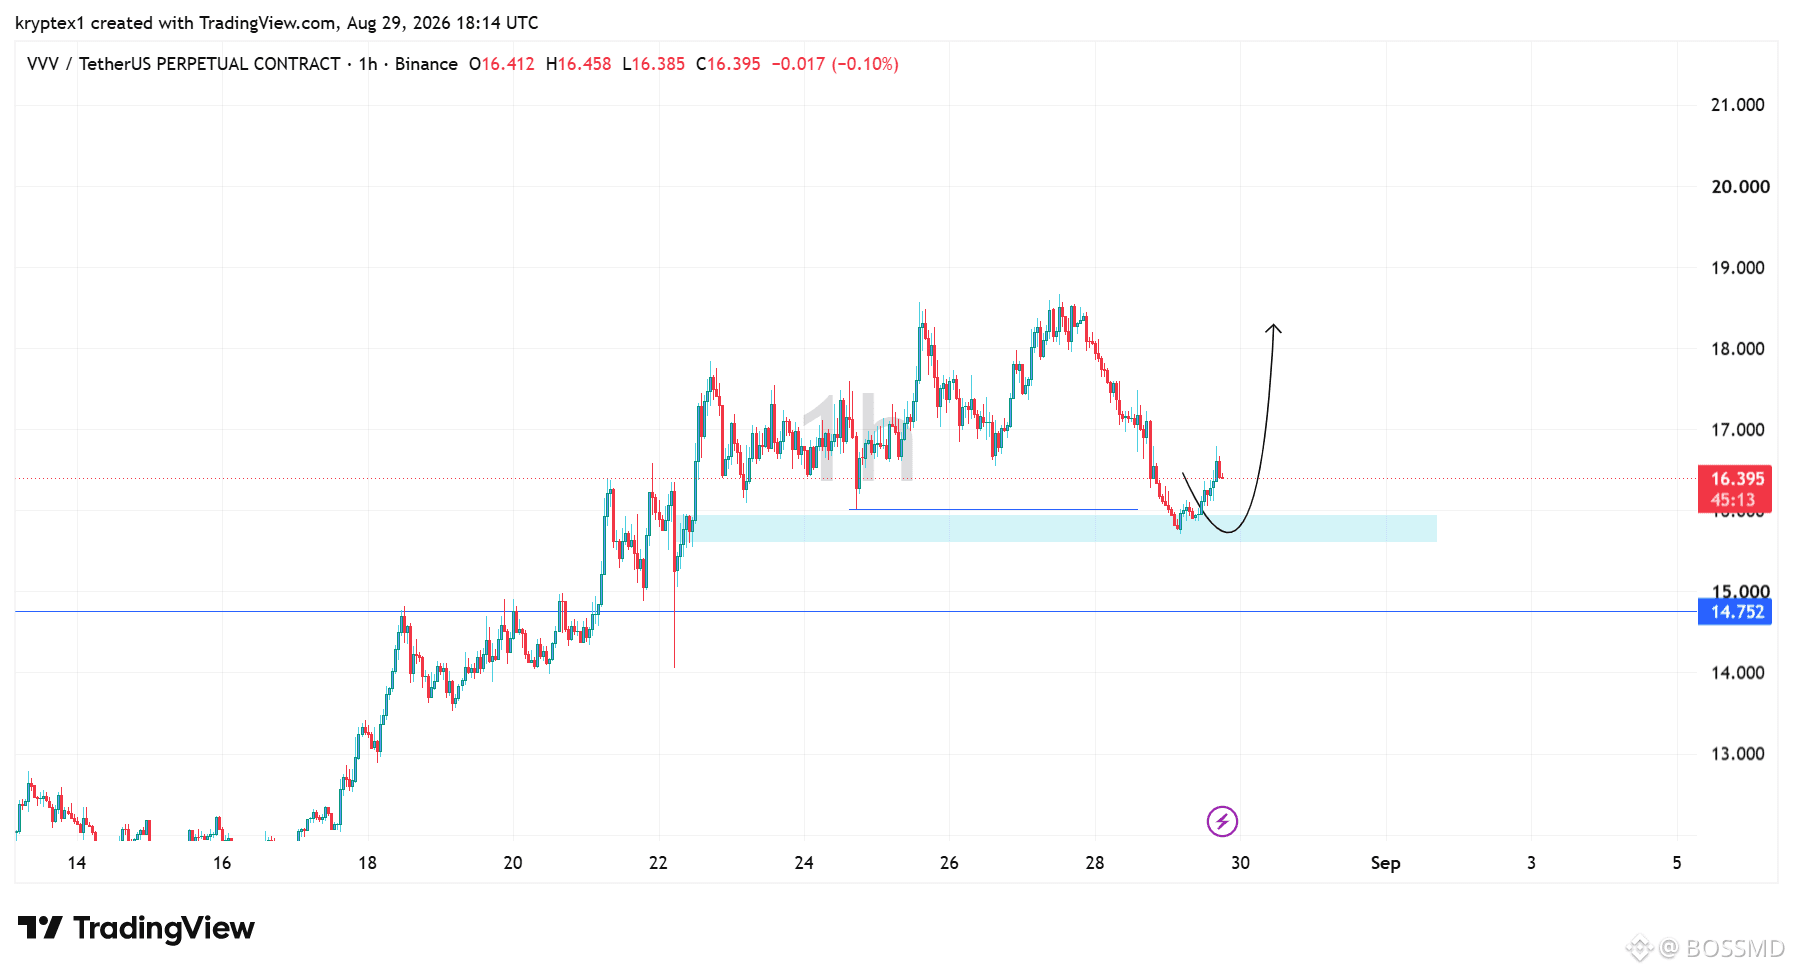
$VVV is following the setup from the previous chart almost perfectly.
Price respected the $15.8–$16.0 support zone and has started pushing back up.
The next area I’m watching is around $18.0–$18.3. If momentum continues, the chart structure still favors a move higher.
So far, the setup is playing out as expected. #Market_Update
Price respected the $15.8–$16.0 support zone and has started pushing back up.
The next area I’m watching is around $18.0–$18.3. If momentum continues, the chart structure still favors a move higher.
So far, the setup is playing out as expected. #Market_Update
BOSSMD
·
--
$VVV is currently around $16.53 on the 1H chart after pulling back from the $18.50+ area.
The important level now is the $15.80–$16.10 support zone. Price is approaching this area after the recent sell-off, so I’m watching for a reaction from buyers.
If this zone holds and #VVV starts building momentum again, the chart could set up for a move back toward $18.00–$18.50.
If support fails, the next major level I’m watching is around $14.75.
The important level now is the $15.80–$16.10 support zone. Price is approaching this area after the recent sell-off, so I’m watching for a reaction from buyers.
If this zone holds and #VVV starts building momentum again, the chart could set up for a move back toward $18.00–$18.50.
If support fails, the next major level I’m watching is around $14.75.
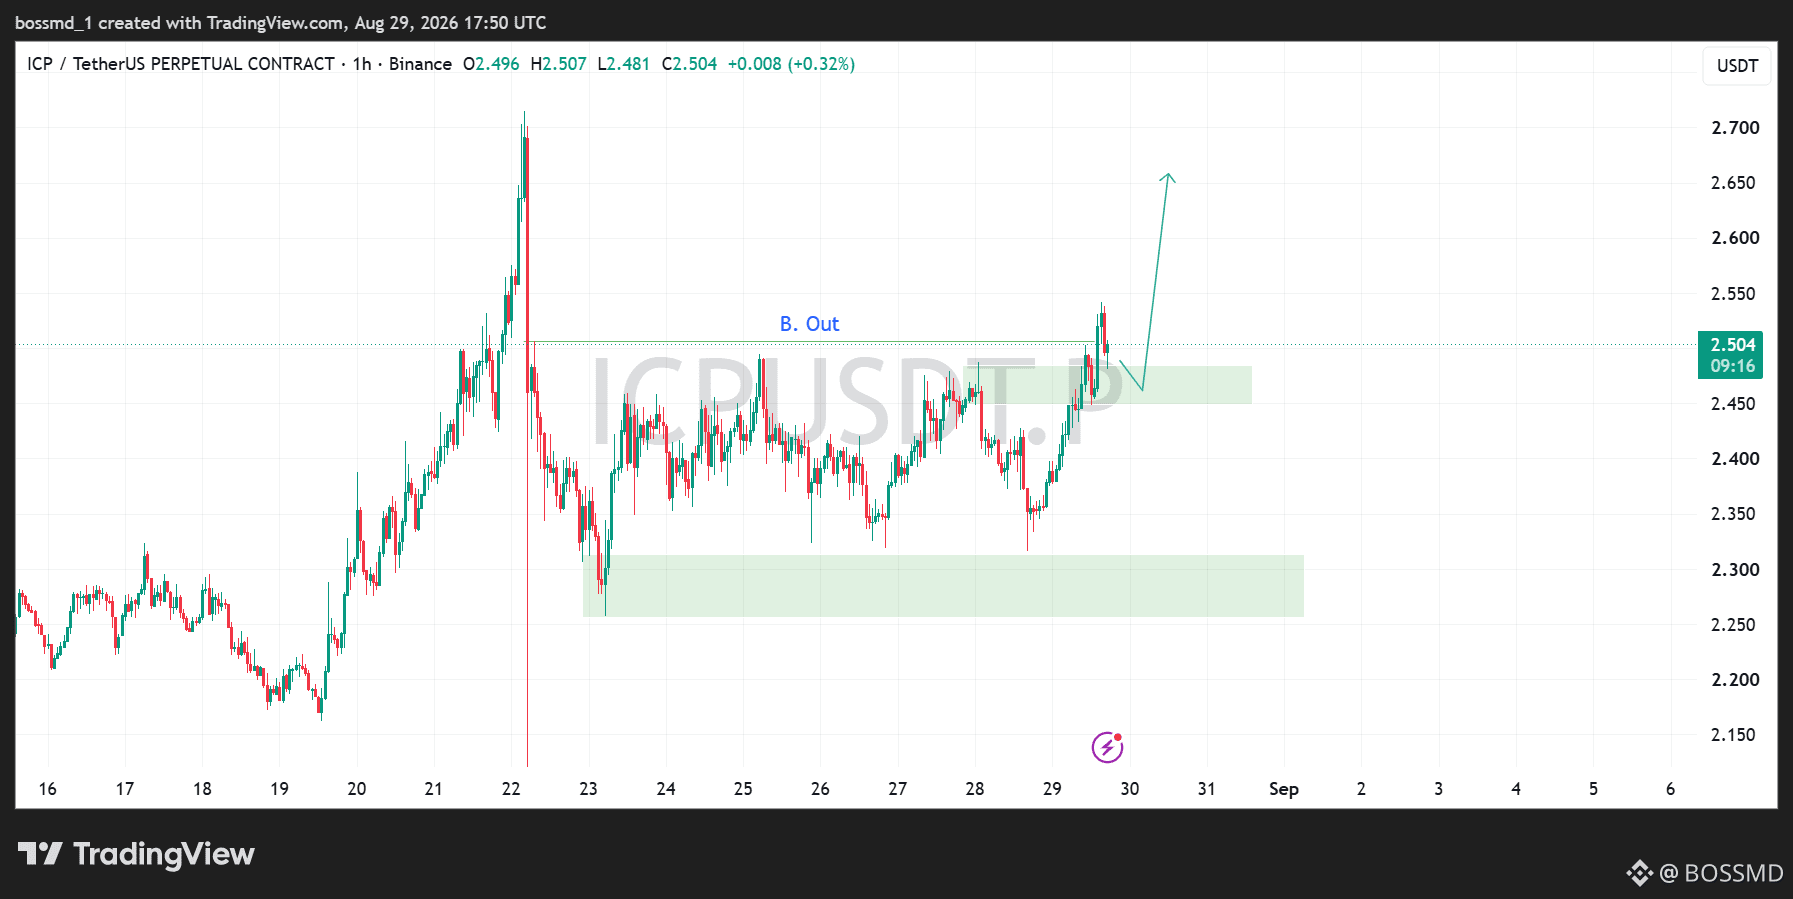
$ICP is showing a bullish structure on the 1H chart after breaking above the $2.50 area.
Price is currently around $2.50, with the highlighted $2.45–$2.48 zone acting as a potential retest/support area.
If bulls defend this zone and maintain the breakout, the chart points toward a possible move to $2.65 next.
~ Key levels:
• Support/retest: $2.45–$2.48
• Breakout area: ~$2.50
• Potential target: $2.65
A clean retest and continuation could make #icp interesting to watch.
Price is currently around $2.50, with the highlighted $2.45–$2.48 zone acting as a potential retest/support area.
If bulls defend this zone and maintain the breakout, the chart points toward a possible move to $2.65 next.
~ Key levels:
• Support/retest: $2.45–$2.48
• Breakout area: ~$2.50
• Potential target: $2.65
A clean retest and continuation could make #icp interesting to watch.
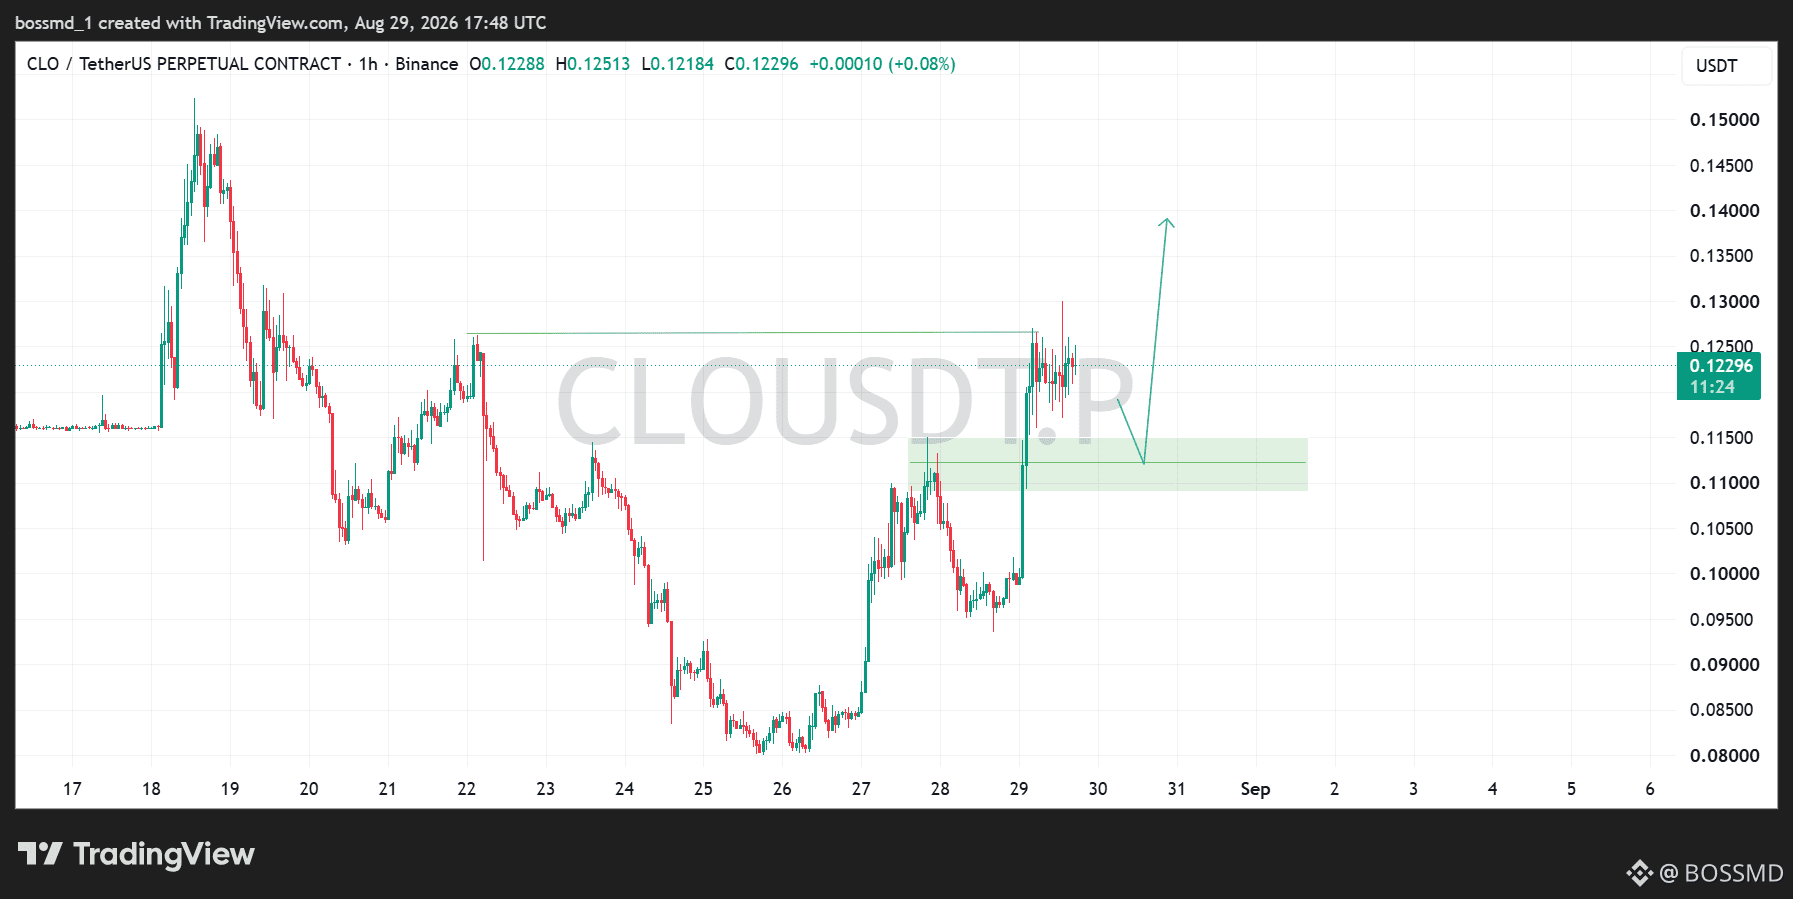
$CLO is showing strong momentum on the 1H chart after breaking above the $0.11–$0.115 support zone.
Price is currently around $0.123, with the next key resistance near $0.125–$0.127.
The chart suggests a possible pullback into the $0.11–$0.115 demand zone before another bullish move. If buyers defend this area and reclaim the recent high, the next upside target could be around $0.14.
#Clo is at an interesting level watch the retest closely.
Price is currently around $0.123, with the next key resistance near $0.125–$0.127.
The chart suggests a possible pullback into the $0.11–$0.115 demand zone before another bullish move. If buyers defend this area and reclaim the recent high, the next upside target could be around $0.14.
#Clo is at an interesting level watch the retest closely.
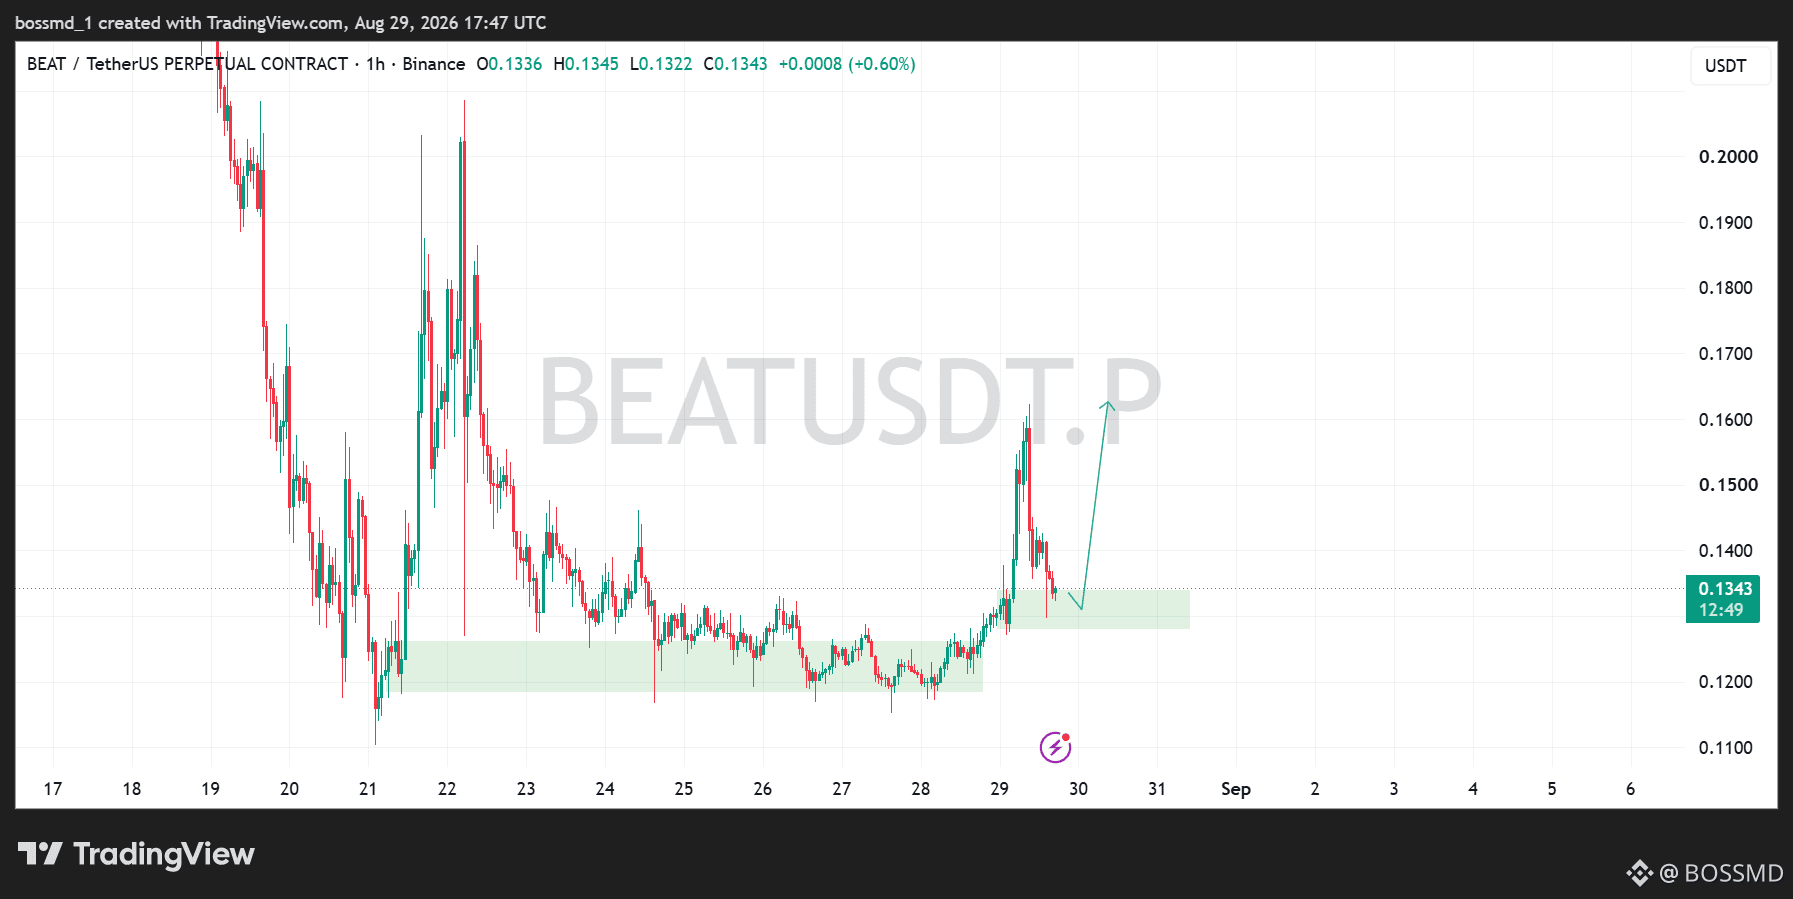
Looking at the 1H chart, $BEAT is currently around $0.1343 after a strong move up and a sharp pullback.
What I’m watching now is the $0.128–$0.134 support zone. Price has already reacted around this area before, so if buyers defend it and we get a clean bullish reaction, I’d expect another attempt toward the $0.15–$0.16 region.
The important part here is patience. I don’t want to chase the pump after that strong move. I’d rather see how price behaves around the marked support and whether buyers step back in.
If #beat loses this zone with strong selling pressure, the bullish setup becomes weaker. But if support holds and momentum returns, that could give the chart another leg higher.
This is just my technical view from the chart, not financial advice. DYOR.
What I’m watching now is the $0.128–$0.134 support zone. Price has already reacted around this area before, so if buyers defend it and we get a clean bullish reaction, I’d expect another attempt toward the $0.15–$0.16 region.
The important part here is patience. I don’t want to chase the pump after that strong move. I’d rather see how price behaves around the marked support and whether buyers step back in.
If #beat loses this zone with strong selling pressure, the bullish setup becomes weaker. But if support holds and momentum returns, that could give the chart another leg higher.
This is just my technical view from the chart, not financial advice. DYOR.
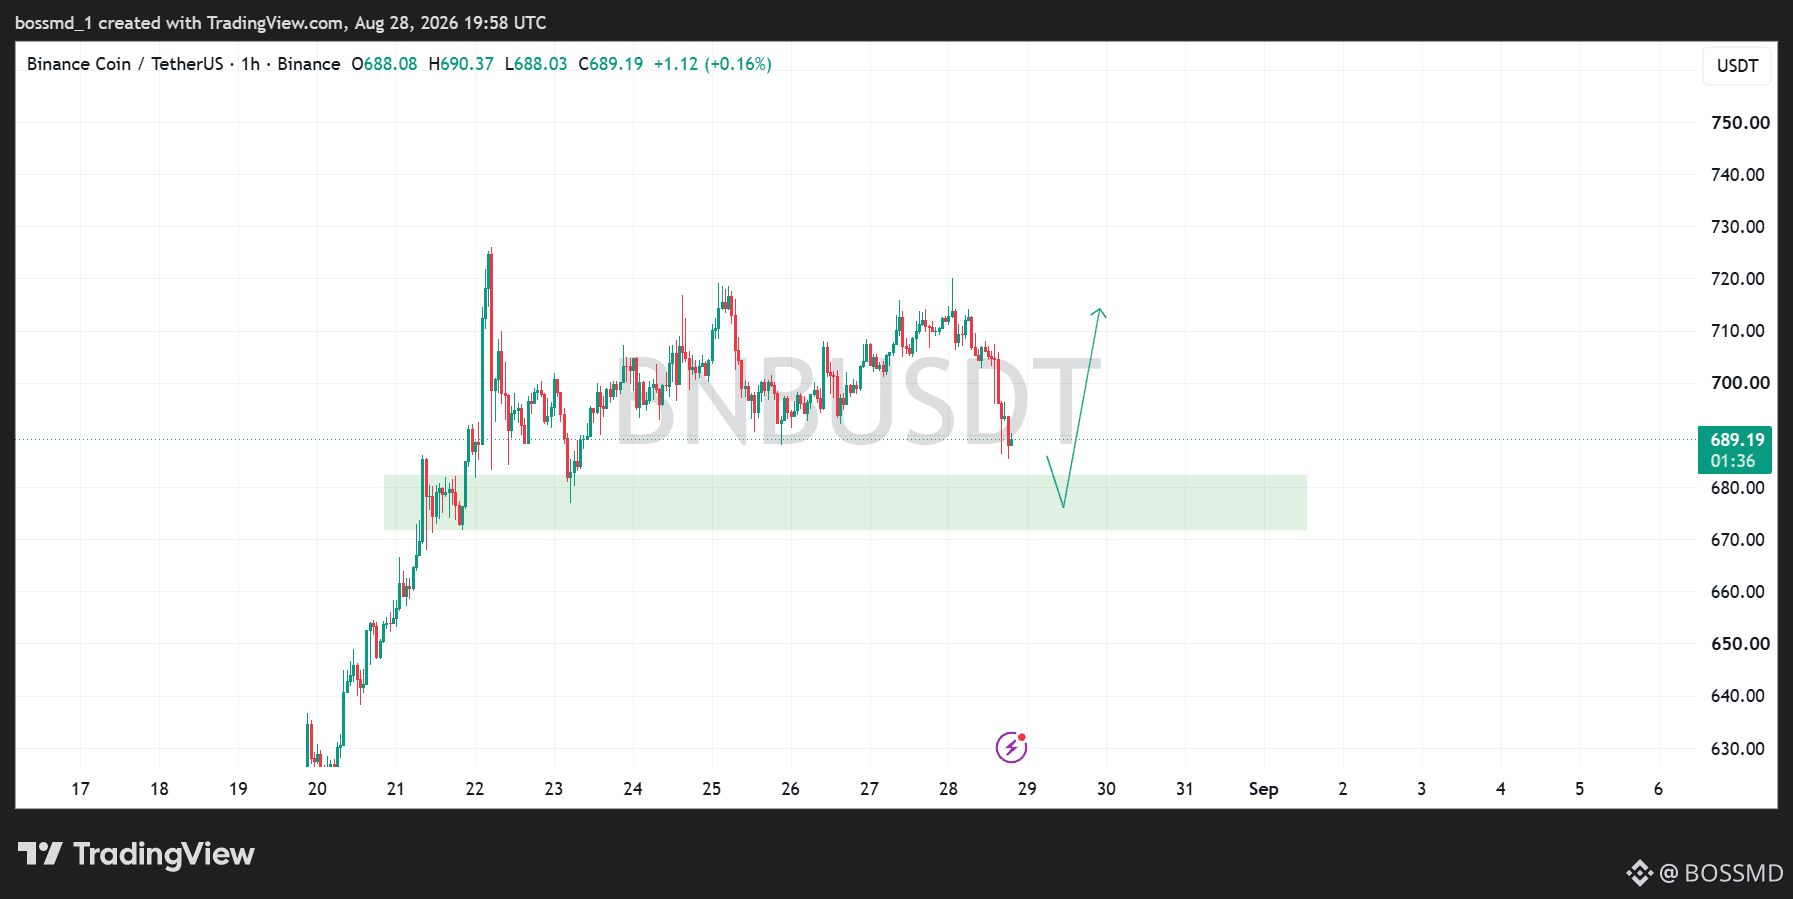
$BNB is currently around $689 after a strong move from the $630 area.
On the 1H chart, price has been consolidating between roughly $680 and $715, and we’re now seeing a pullback toward the lower support zone.
The area I’m watching is $675–$682. If buyers defend this zone and #bnb starts reclaiming momentum, the next move could target $710–$720.
I wouldn’t chase the current price. The reaction around support is what matters most here.
Let the setup confirm before making a move.
On the 1H chart, price has been consolidating between roughly $680 and $715, and we’re now seeing a pullback toward the lower support zone.
The area I’m watching is $675–$682. If buyers defend this zone and #bnb starts reclaiming momentum, the next move could target $710–$720.
I wouldn’t chase the current price. The reaction around support is what matters most here.
Let the setup confirm before making a move.
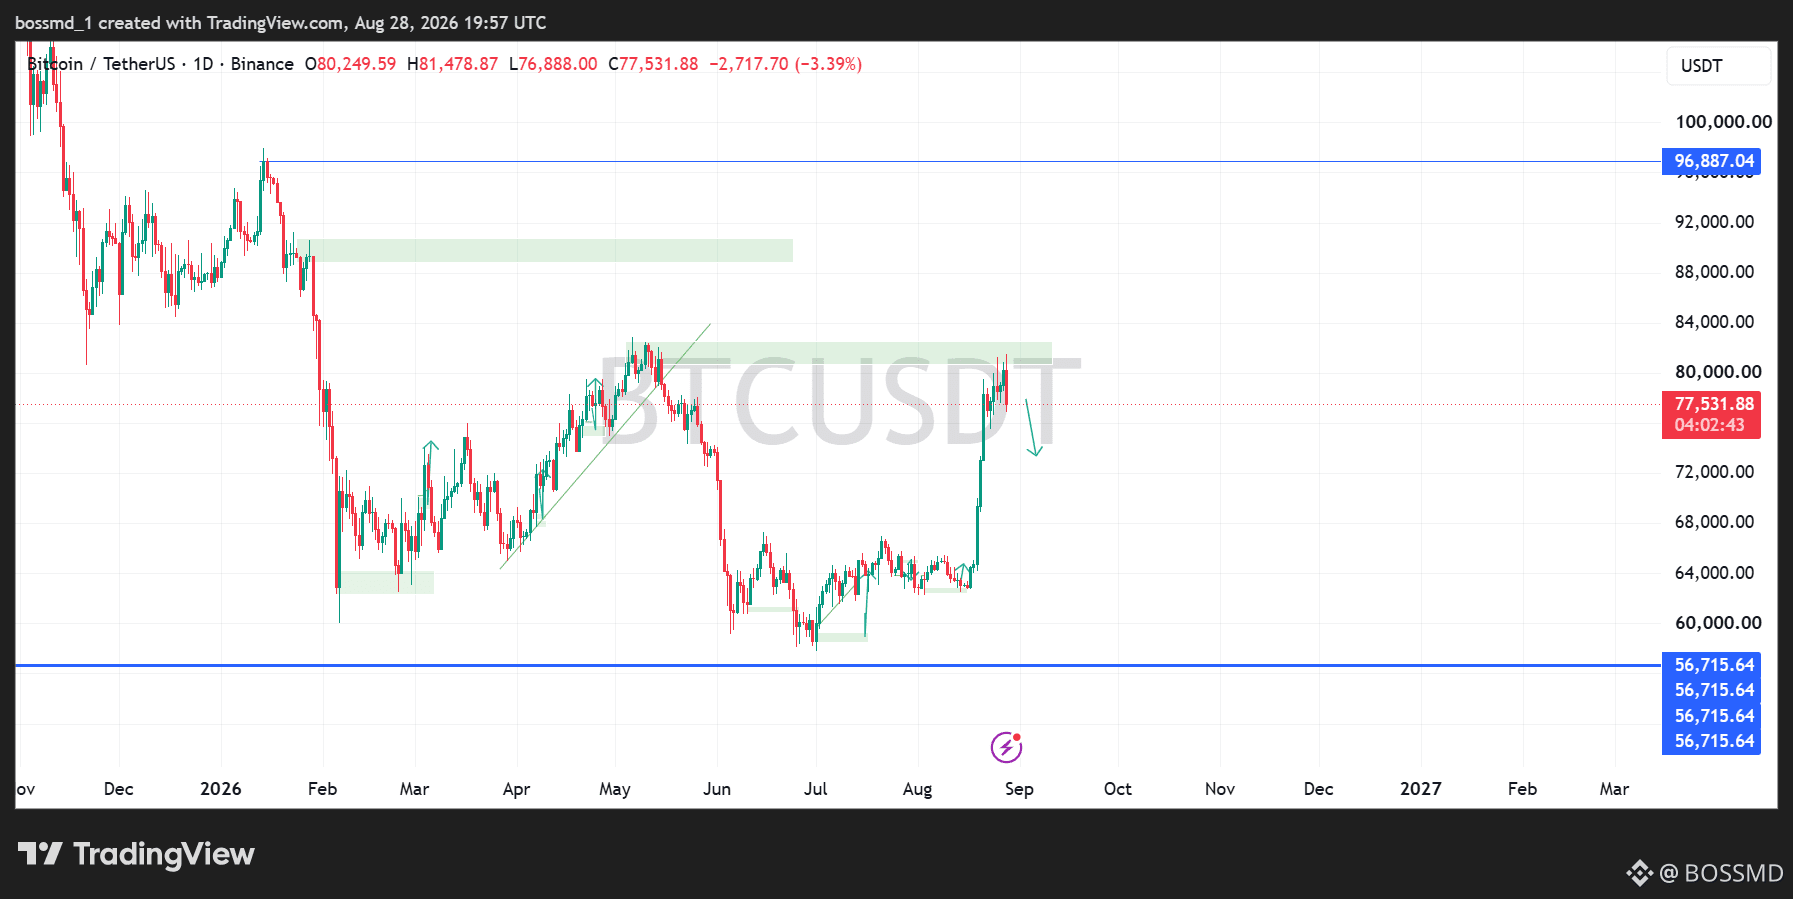
#bitcoin is back around $77,500 after a strong recovery from the $56,700 area.
Looking at the daily chart, the recent move has been impressive, but $BTC is now approaching a major resistance zone around $81,000–$83,000. This is an area where sellers have previously shown up, so I wouldn’t be surprised to see some profit-taking here.
My main scenario is a pullback from this zone toward the $72,000–$74,000 area. If buyers can defend that region, it could give BTC another chance to push higher and eventually challenge $96,800.
The important thing for me is not to chase the current move. I want to see how price reacts around resistance and whether the next pullback creates a higher low.
Looking at the daily chart, the recent move has been impressive, but $BTC is now approaching a major resistance zone around $81,000–$83,000. This is an area where sellers have previously shown up, so I wouldn’t be surprised to see some profit-taking here.
My main scenario is a pullback from this zone toward the $72,000–$74,000 area. If buyers can defend that region, it could give BTC another chance to push higher and eventually challenge $96,800.
The important thing for me is not to chase the current move. I want to see how price reacts around resistance and whether the next pullback creates a higher low.
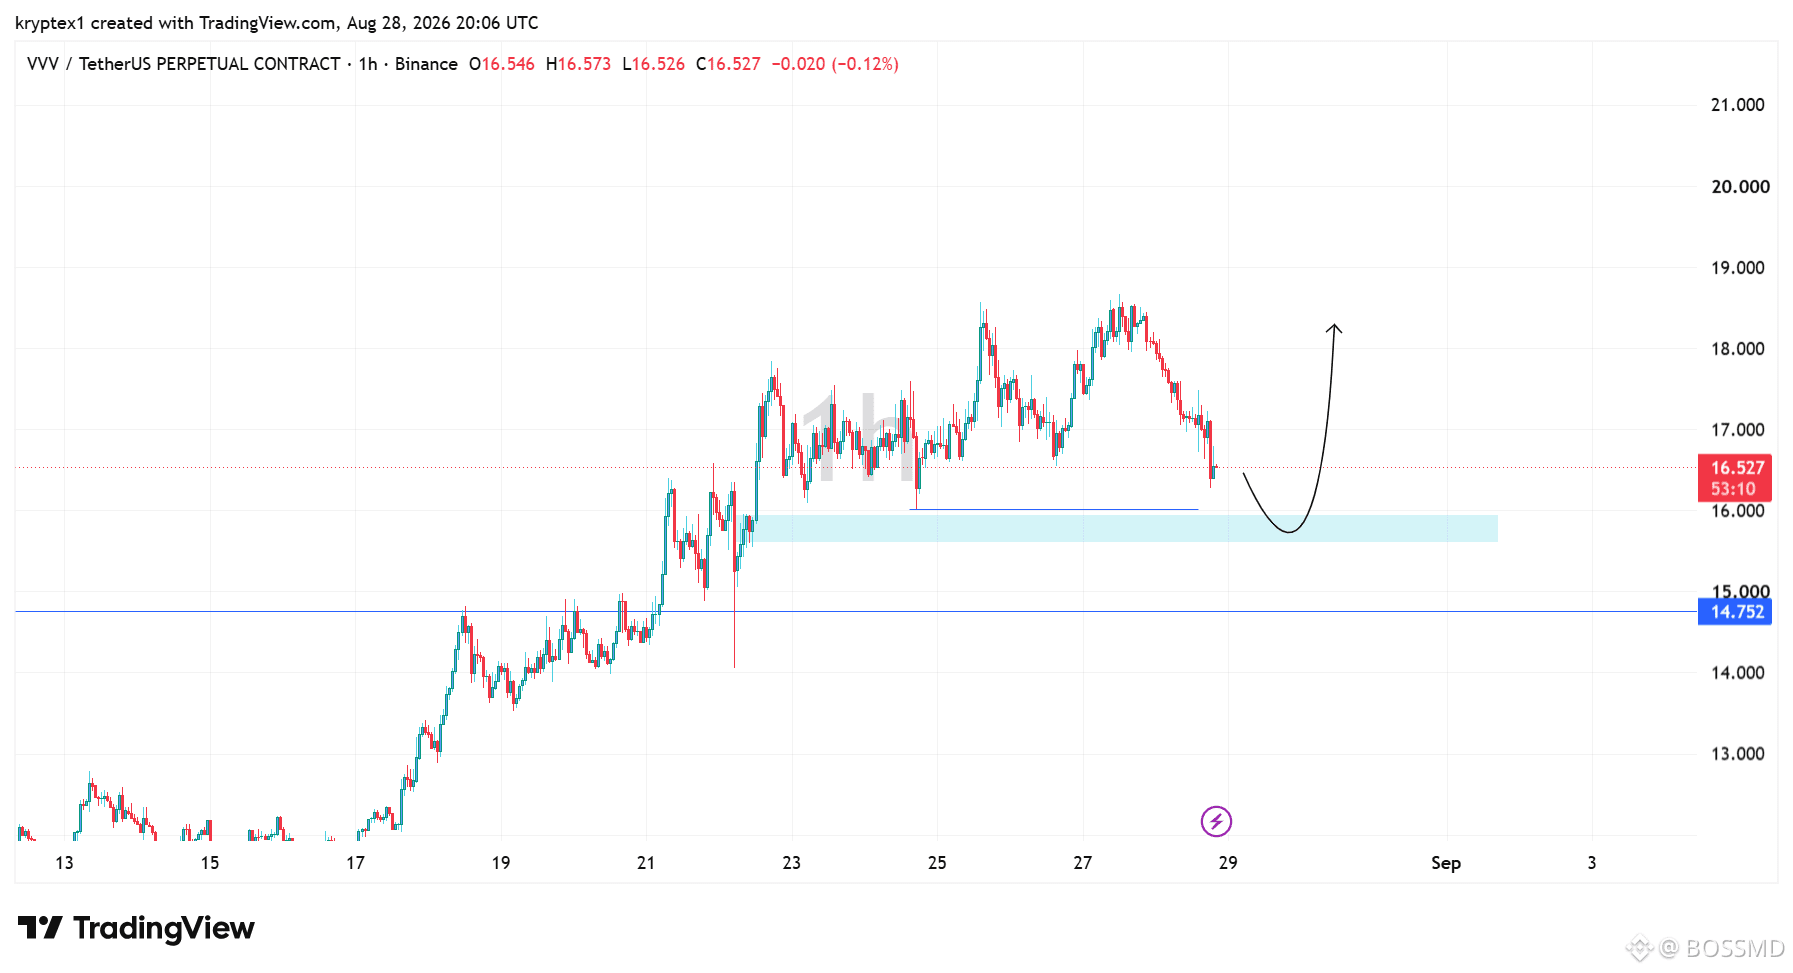
$VVV is currently around $16.53 on the 1H chart after pulling back from the $18.50+ area.
The important level now is the $15.80–$16.10 support zone. Price is approaching this area after the recent sell-off, so I’m watching for a reaction from buyers.
If this zone holds and #VVV starts building momentum again, the chart could set up for a move back toward $18.00–$18.50.
If support fails, the next major level I’m watching is around $14.75.
The important level now is the $15.80–$16.10 support zone. Price is approaching this area after the recent sell-off, so I’m watching for a reaction from buyers.
If this zone holds and #VVV starts building momentum again, the chart could set up for a move back toward $18.00–$18.50.
If support fails, the next major level I’m watching is around $14.75.
Войдите, чтобы посмотреть больше материала