
DragonFlyOfficial
59 Публикации

DragonFlyOfficial
Отправить жалобу
Заблокировать пользователя
🚀 Crypto Trader | Content Creator | 6 Years Experience
Sharing analysis, altcoin research & trading strategies
Helping traders grow with real market insights
57 подписок(и/а)
24 подписчиков(а)
64 понравилось
Посты
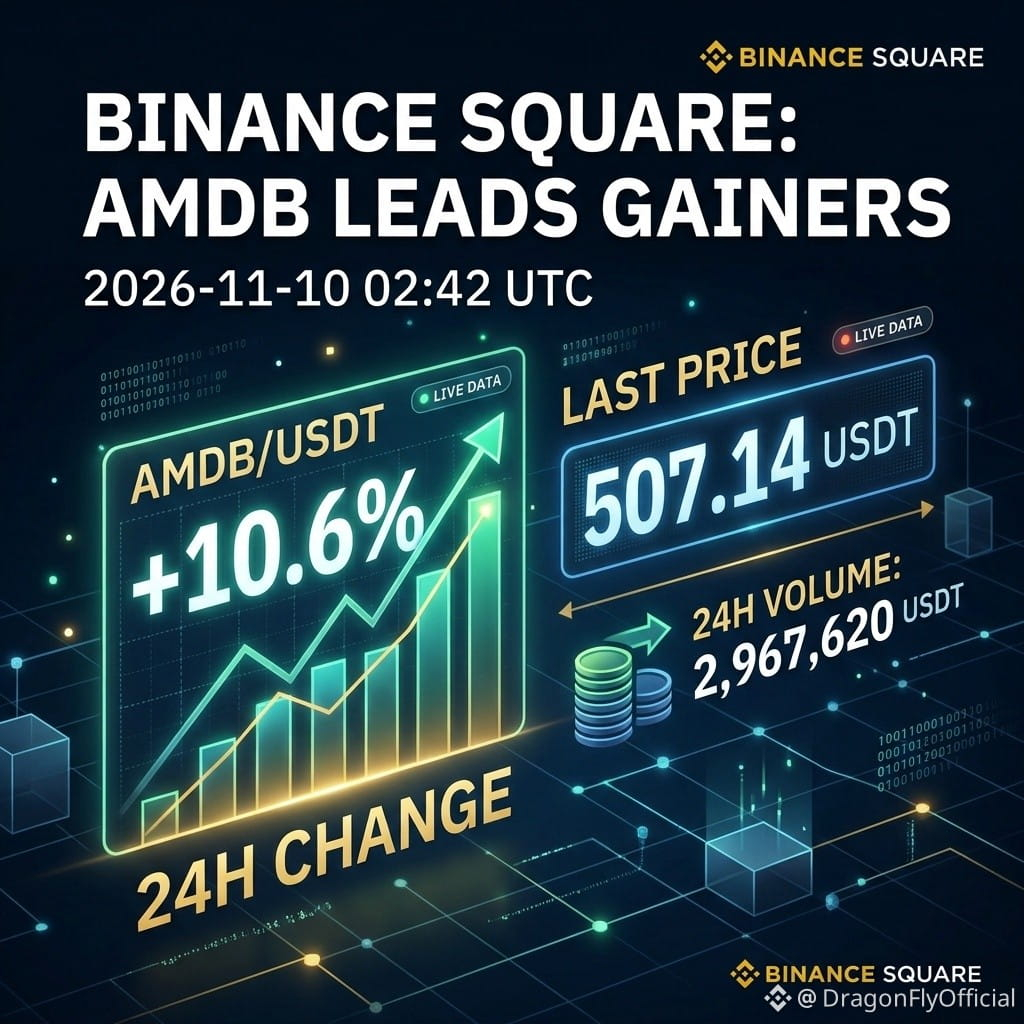
AMDB GAINS 10.6%: IS THE AMD CONNECTION BEHIND TODAY’S MOVE? 📈
🔍 What Started the Story?
AMDB/USDT recorded a last price of 507.14 USDT, gaining 10.6% in 24 hours. Its trading volume reached approximately 2,967,620 USDT. That performance placed AMDB among today's top gainers on Binance Square.
At first glance, it looks like another strong crypto rally. But there is an important detail behind this asset.
💡 What Makes AMDB Different?
AMDB is a tokenized version of Advanced Micro Devices (AMD) bStocks. It provides economic exposure to AMD shares through a blockchain-based asset.
This creates an important connection between two markets: traditional stocks and digital assets.
The possible reasons behind today's rise include stronger demand for AMDB, changing expectations around AMD's business, or increased interest in tokenized stocks. However, the available data does not confirm one specific catalyst.
⚠️ Could the Rally Lose Strength?
A 10.6% increase is impressive, but one day's performance does not guarantee continued growth.
AMDB faces several risks:
Changes in AMD's underlying share value.
Sudden changes in buying and selling pressure.
Limited liquidity and possible price differences between markets.
Additional risks related to tokenized assets and their issuers.
📊 What Should Traders Watch Next?
The key question is whether trading activity can remain strong and whether $AMDB
{spot}(AMDBUSDT)
continues to follow its underlying asset. Volume near 2.97 million USDT shows meaningful activity, but it does not guarantee that buyers will remain in control.
The Dragonfly Official Takeaway
AMDB's 10.6% gain deserves attention, but smart traders look beyond the percentage. Keep positions small, use stop losses, and risk only what you can afford to lose. Crypto trading is risky, and this analysis is not financial advice.
#AMDB #AMD #CryptoMarket #TokenizedStocks #MarketAnalysis
AMDB GAINS 10.6%: IS THE AMD CONNECTION BEHIND TODAY’S MOVE? 📈
🔍 What Started the Story?
AMDB/USDT recorded a last price of 507.14 USDT, gaining 10.6% in 24 hours. Its trading volume reached approximately 2,967,620 USDT. That performance placed AMDB among today's top gainers on Binance Square.
At first glance, it looks like another strong crypto rally. But there is an important detail behind this asset.
💡 What Makes AMDB Different?
AMDB is a tokenized version of Advanced Micro Devices (AMD) bStocks. It provides economic exposure to AMD shares through a blockchain-based asset.
This creates an important connection between two markets: traditional stocks and digital assets.
The possible reasons behind today's rise include stronger demand for AMDB, changing expectations around AMD's business, or increased interest in tokenized stocks. However, the available data does not confirm one specific catalyst.
⚠️ Could the Rally Lose Strength?
A 10.6% increase is impressive, but one day's performance does not guarantee continued growth.
AMDB faces several risks:
Changes in AMD's underlying share value.
Sudden changes in buying and selling pressure.
Limited liquidity and possible price differences between markets.
Additional risks related to tokenized assets and their issuers.
📊 What Should Traders Watch Next?
The key question is whether trading activity can remain strong and whether $AMDB
continues to follow its underlying asset. Volume near 2.97 million USDT shows meaningful activity, but it does not guarantee that buyers will remain in control.
The Dragonfly Official Takeaway
AMDB's 10.6% gain deserves attention, but smart traders look beyond the percentage. Keep positions small, use stop losses, and risk only what you can afford to lose. Crypto trading is risky, and this analysis is not financial advice.
#AMDB #AMD #CryptoMarket #TokenizedStocks #MarketAnalysis
🔍 What Started the Story?
AMDB/USDT recorded a last price of 507.14 USDT, gaining 10.6% in 24 hours. Its trading volume reached approximately 2,967,620 USDT. That performance placed AMDB among today's top gainers on Binance Square.
At first glance, it looks like another strong crypto rally. But there is an important detail behind this asset.
💡 What Makes AMDB Different?
AMDB is a tokenized version of Advanced Micro Devices (AMD) bStocks. It provides economic exposure to AMD shares through a blockchain-based asset.
This creates an important connection between two markets: traditional stocks and digital assets.
The possible reasons behind today's rise include stronger demand for AMDB, changing expectations around AMD's business, or increased interest in tokenized stocks. However, the available data does not confirm one specific catalyst.
⚠️ Could the Rally Lose Strength?
A 10.6% increase is impressive, but one day's performance does not guarantee continued growth.
AMDB faces several risks:
Changes in AMD's underlying share value.
Sudden changes in buying and selling pressure.
Limited liquidity and possible price differences between markets.
Additional risks related to tokenized assets and their issuers.
📊 What Should Traders Watch Next?
The key question is whether trading activity can remain strong and whether $AMDB
continues to follow its underlying asset. Volume near 2.97 million USDT shows meaningful activity, but it does not guarantee that buyers will remain in control.
The Dragonfly Official Takeaway
AMDB's 10.6% gain deserves attention, but smart traders look beyond the percentage. Keep positions small, use stop losses, and risk only what you can afford to lose. Crypto trading is risky, and this analysis is not financial advice.
#AMDB #AMD #CryptoMarket #TokenizedStocks #MarketAnalysis
5
$SIGN
{future}(SIGNUSDT)
RISES 9.4%: DOES EVERY PRICE JUMP MEAN STRONG BUYING?
📚 Myth vs Reality: Green Does Not Always Mean Growth
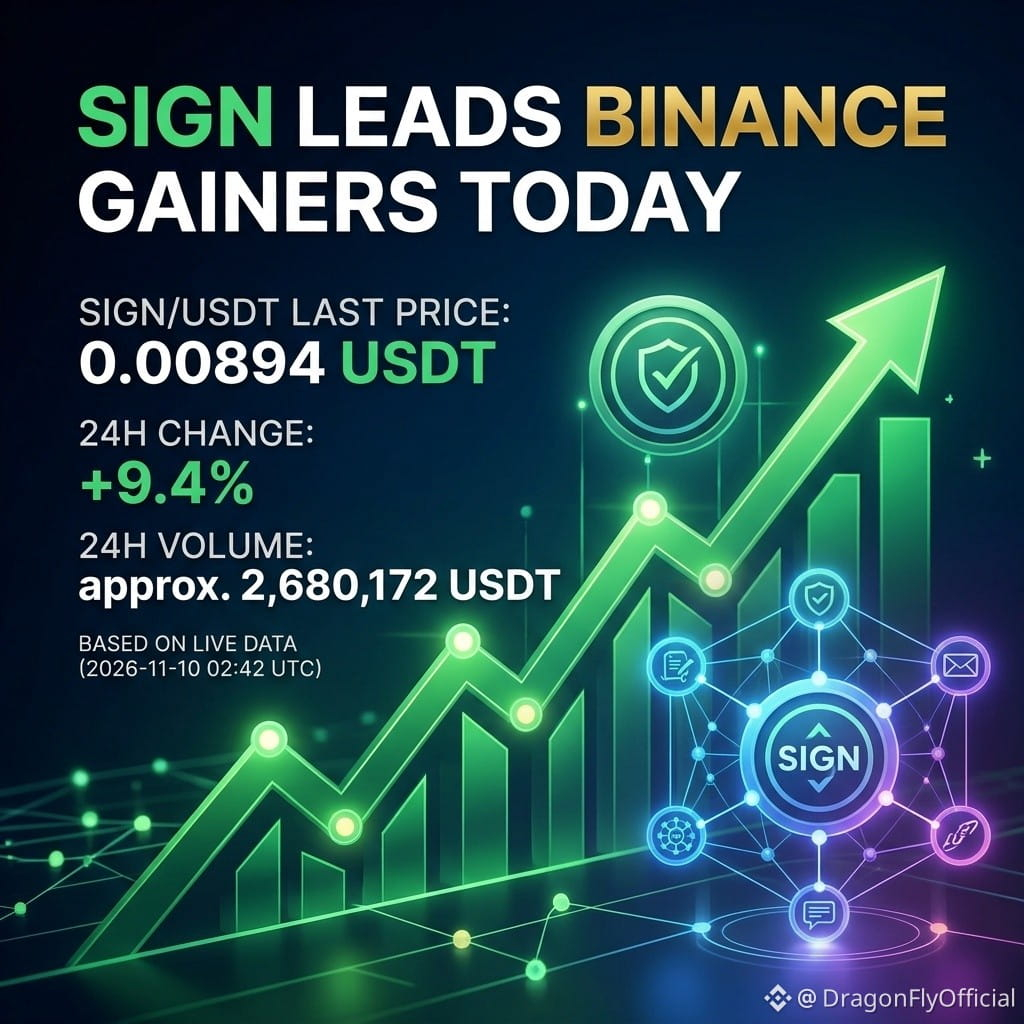
A common myth in crypto is that a coin rising nearly 10% must have strong long-term demand. That is not always true. SIGN/USDT has gained 9.4% in 24 hours, reaching $0.00894. But one positive day does not guarantee a lasting trend.
📈 The Pros: Buyers Are Showing Interest
SIGN recorded approximately $2.68 million in 24-hour trading volume. This shows meaningful trading activity alongside its price increase. Higher volume can indicate growing market attention, although it does not prove that buyers will remain active.
⚠️ The Cons: Momentum Can Reverse
A 9.4% gain can attract short-term traders looking for quick profits. If buying interest weakens or sellers begin taking profits, the price could lose momentum. High trading activity also means that market conditions can change quickly.
🔍 What Is Still Unknown?
The available figures do not confirm the exact reason behind this increase. Without verified evidence of a specific announcement, partnership, or project development driving the move, connecting the rally to a particular event would be speculation.
💡 Final Reminder
Keep positions small, use a stop loss, and risk only what you can afford to lose. Crypto trading involves risk, and this is not financial advice. Stay careful, question the hype, and always think independently.
#SIGN #CryptoMarke t #Altcoins #CryptoAnalysis #TradingRisk
$SIGN
RISES 9.4%: DOES EVERY PRICE JUMP MEAN STRONG BUYING?
📚 Myth vs Reality: Green Does Not Always Mean Growth
A common myth in crypto is that a coin rising nearly 10% must have strong long-term demand. That is not always true. SIGN/USDT has gained 9.4% in 24 hours, reaching $0.00894. But one positive day does not guarantee a lasting trend.
📈 The Pros: Buyers Are Showing Interest
SIGN recorded approximately $2.68 million in 24-hour trading volume. This shows meaningful trading activity alongside its price increase. Higher volume can indicate growing market attention, although it does not prove that buyers will remain active.
⚠️ The Cons: Momentum Can Reverse
A 9.4% gain can attract short-term traders looking for quick profits. If buying interest weakens or sellers begin taking profits, the price could lose momentum. High trading activity also means that market conditions can change quickly.
🔍 What Is Still Unknown?
The available figures do not confirm the exact reason behind this increase. Without verified evidence of a specific announcement, partnership, or project development driving the move, connecting the rally to a particular event would be speculation.
💡 Final Reminder
Keep positions small, use a stop loss, and risk only what you can afford to lose. Crypto trading involves risk, and this is not financial advice. Stay careful, question the hype, and always think independently.
#SIGN #CryptoMarke t #Altcoins #CryptoAnalysis #TradingRisk
RISES 9.4%: DOES EVERY PRICE JUMP MEAN STRONG BUYING?
📚 Myth vs Reality: Green Does Not Always Mean Growth
A common myth in crypto is that a coin rising nearly 10% must have strong long-term demand. That is not always true. SIGN/USDT has gained 9.4% in 24 hours, reaching $0.00894. But one positive day does not guarantee a lasting trend.
📈 The Pros: Buyers Are Showing Interest
SIGN recorded approximately $2.68 million in 24-hour trading volume. This shows meaningful trading activity alongside its price increase. Higher volume can indicate growing market attention, although it does not prove that buyers will remain active.
⚠️ The Cons: Momentum Can Reverse
A 9.4% gain can attract short-term traders looking for quick profits. If buying interest weakens or sellers begin taking profits, the price could lose momentum. High trading activity also means that market conditions can change quickly.
🔍 What Is Still Unknown?
The available figures do not confirm the exact reason behind this increase. Without verified evidence of a specific announcement, partnership, or project development driving the move, connecting the rally to a particular event would be speculation.
💡 Final Reminder
Keep positions small, use a stop loss, and risk only what you can afford to lose. Crypto trading involves risk, and this is not financial advice. Stay careful, question the hype, and always think independently.
#SIGN #CryptoMarke t #Altcoins #CryptoAnalysis #TradingRisk
38
BEB RISES 9.3%: THE SURPRISE BEHIND TODAY’S MARKET MOVE
📈 A Strong Start
$BEB
{spot}(BEBUSDT)
has moved into the spotlight with a 9.3% gain in the last 24 hours. Its BEB/USDT price reached 194.89, while trading volume climbed to approximately 1,965,139 USDT as of November 10, 2026, at 02:42 UTC.
📊 The Interesting Twist
The move looks encouraging, but a green price chart does not tell the whole story. Volume shows how much value has been traded, while price change shows how the market has moved. Together, these figures show meaningful trading activity alongside a positive price move.
🔍 What Could Be Behind It?
Possible factors include increased buyer interest, short-term speculation, fresh market attention, or changing trader expectations. However, the available data does not confirm which factor caused BEB to rise. It would be misleading to present any single explanation as fact.
💡 The Lesson for Traders
Dragonfly Official encourages readers to look beyond the percentage gain. Watch whether trading activity remains strong, whether the price can maintain its progress, and whether new market information supports the move. No verified entry, stop-loss, or profit target is available from the supplied figures, so avoid treating this gain as a trading signal.
Keep positions small, use a suitable stop loss, and risk only what you can afford to lose. Crypto trading is risky, and this is not financial advice.
What to Watch Next: Can BEB maintain its momentum, or will profit-taking change the story?
#BEB
#CryptoMarket #MarketAnalysis #Altcoins #CryptoTrading
BEB RISES 9.3%: THE SURPRISE BEHIND TODAY’S MARKET MOVE
📈 A Strong Start
$BEB
has moved into the spotlight with a 9.3% gain in the last 24 hours. Its BEB/USDT price reached 194.89, while trading volume climbed to approximately 1,965,139 USDT as of November 10, 2026, at 02:42 UTC.
📊 The Interesting Twist
The move looks encouraging, but a green price chart does not tell the whole story. Volume shows how much value has been traded, while price change shows how the market has moved. Together, these figures show meaningful trading activity alongside a positive price move.
🔍 What Could Be Behind It?
Possible factors include increased buyer interest, short-term speculation, fresh market attention, or changing trader expectations. However, the available data does not confirm which factor caused BEB to rise. It would be misleading to present any single explanation as fact.
💡 The Lesson for Traders
Dragonfly Official encourages readers to look beyond the percentage gain. Watch whether trading activity remains strong, whether the price can maintain its progress, and whether new market information supports the move. No verified entry, stop-loss, or profit target is available from the supplied figures, so avoid treating this gain as a trading signal.
Keep positions small, use a suitable stop loss, and risk only what you can afford to lose. Crypto trading is risky, and this is not financial advice.
What to Watch Next: Can BEB maintain its momentum, or will profit-taking change the story?
#BEB
#CryptoMarket #MarketAnalysis #Altcoins #CryptoTrading
📈 A Strong Start
$BEB
has moved into the spotlight with a 9.3% gain in the last 24 hours. Its BEB/USDT price reached 194.89, while trading volume climbed to approximately 1,965,139 USDT as of November 10, 2026, at 02:42 UTC.
📊 The Interesting Twist
The move looks encouraging, but a green price chart does not tell the whole story. Volume shows how much value has been traded, while price change shows how the market has moved. Together, these figures show meaningful trading activity alongside a positive price move.
🔍 What Could Be Behind It?
Possible factors include increased buyer interest, short-term speculation, fresh market attention, or changing trader expectations. However, the available data does not confirm which factor caused BEB to rise. It would be misleading to present any single explanation as fact.
💡 The Lesson for Traders
Dragonfly Official encourages readers to look beyond the percentage gain. Watch whether trading activity remains strong, whether the price can maintain its progress, and whether new market information supports the move. No verified entry, stop-loss, or profit target is available from the supplied figures, so avoid treating this gain as a trading signal.
Keep positions small, use a suitable stop loss, and risk only what you can afford to lose. Crypto trading is risky, and this is not financial advice.
What to Watch Next: Can BEB maintain its momentum, or will profit-taking change the story?
#BEB
#CryptoMarket #MarketAnalysis #Altcoins #CryptoTrading
GRAM GAINS 9.4%: THE BIGGEST MYTH ABOUT A GREEN MARKET MOVE
📊 Myth: A 9.4% Gain Means Strong Market Confidence
Fact: GRAM/USDT is trading at 1.105, up 9.4% over 24 hours, with approximately 12.24 million USDT in trading volume. That is a notable move, but a green percentage alone does not prove that buyers are confident or that the rally will continue.
🔍 Myth: High Volume Guarantees Further Growth
Fact: Trading volume shows how much value has changed hands. GRAM's reported 24-hour volume indicates considerable trading activity. However, volume alone cannot reveal whether buyers or sellers are controlling the market. Rising prices and high volume deserve attention, but they are not guaranteed signs of lasting strength.
💡 What Could Be Behind the Move?
Increased market interest, short-term speculation, fresh demand or broader crypto market sentiment could contribute to the rise. However, there is not enough verified information to identify one specific reason behind GRAM's performance. Treat these as possibilities, not confirmed explanations.
Final Takeaway
Keep positions small, use a stop loss and risk only what you can afford to lose. Crypto trading is risky, and this is not financial advice. A strong market move deserves attention, not blind trust.
This might also interest you.
Easy MCP AI
Ad
Ad options
Publish from your chat
Draft and publish WordPress posts with AI.
Learn more
Learn about ads and personalization
GRAM GAINS 9.4%: THE BIGGEST MYTH ABOUT A GREEN MARKET MOVE
📊 Myth: A 9.4% Gain Means Strong Market Confidence
Fact: GRAM/USDT is trading at 1.105, up 9.4% over 24 hours, with approximately 12.24 million USDT in trading volume. That is a notable move, but a green percentage alone does not prove that buyers are confident or that the rally will continue.
🔍 Myth: High Volume Guarantees Further Growth
Fact: Trading volume shows how much value has changed hands. GRAM's reported 24-hour volume indicates considerable trading activity. However, volume alone cannot reveal whether buyers or sellers are controlling the market. Rising prices and high volume deserve attention, but they are not guaranteed signs of lasting strength.
💡 What Could Be Behind the Move?
Increased market interest, short-term speculation, fresh demand or broader crypto market sentiment could contribute to the rise. However, there is not enough verified information to identify one specific reason behind GRAM's performance. Treat these as possibilities, not confirmed explanations.
Final Takeaway
Keep positions small, use a stop loss and risk only what you can afford to lose. Crypto trading is risky, and this is not financial advice. A strong market move deserves attention, not blind trust.
This might also interest you.
Easy MCP AI
Ad
Ad options
Publish from your chat
Draft and publish WordPress posts with AI.
Learn more
Learn about ads and personalization
📊 Myth: A 9.4% Gain Means Strong Market Confidence
Fact: GRAM/USDT is trading at 1.105, up 9.4% over 24 hours, with approximately 12.24 million USDT in trading volume. That is a notable move, but a green percentage alone does not prove that buyers are confident or that the rally will continue.
🔍 Myth: High Volume Guarantees Further Growth
Fact: Trading volume shows how much value has changed hands. GRAM's reported 24-hour volume indicates considerable trading activity. However, volume alone cannot reveal whether buyers or sellers are controlling the market. Rising prices and high volume deserve attention, but they are not guaranteed signs of lasting strength.
💡 What Could Be Behind the Move?
Increased market interest, short-term speculation, fresh demand or broader crypto market sentiment could contribute to the rise. However, there is not enough verified information to identify one specific reason behind GRAM's performance. Treat these as possibilities, not confirmed explanations.
Final Takeaway
Keep positions small, use a stop loss and risk only what you can afford to lose. Crypto trading is risky, and this is not financial advice. A strong market move deserves attention, not blind trust.
This might also interest you.
Easy MCP AI
Ad
Ad options
Publish from your chat
Draft and publish WordPress posts with AI.
Learn more
Learn about ads and personalization
155
LITEB GAINS 10.7%: WHAT CHANGED, AND CAN THE MOMENTUM LAST?
📊 Before vs Now
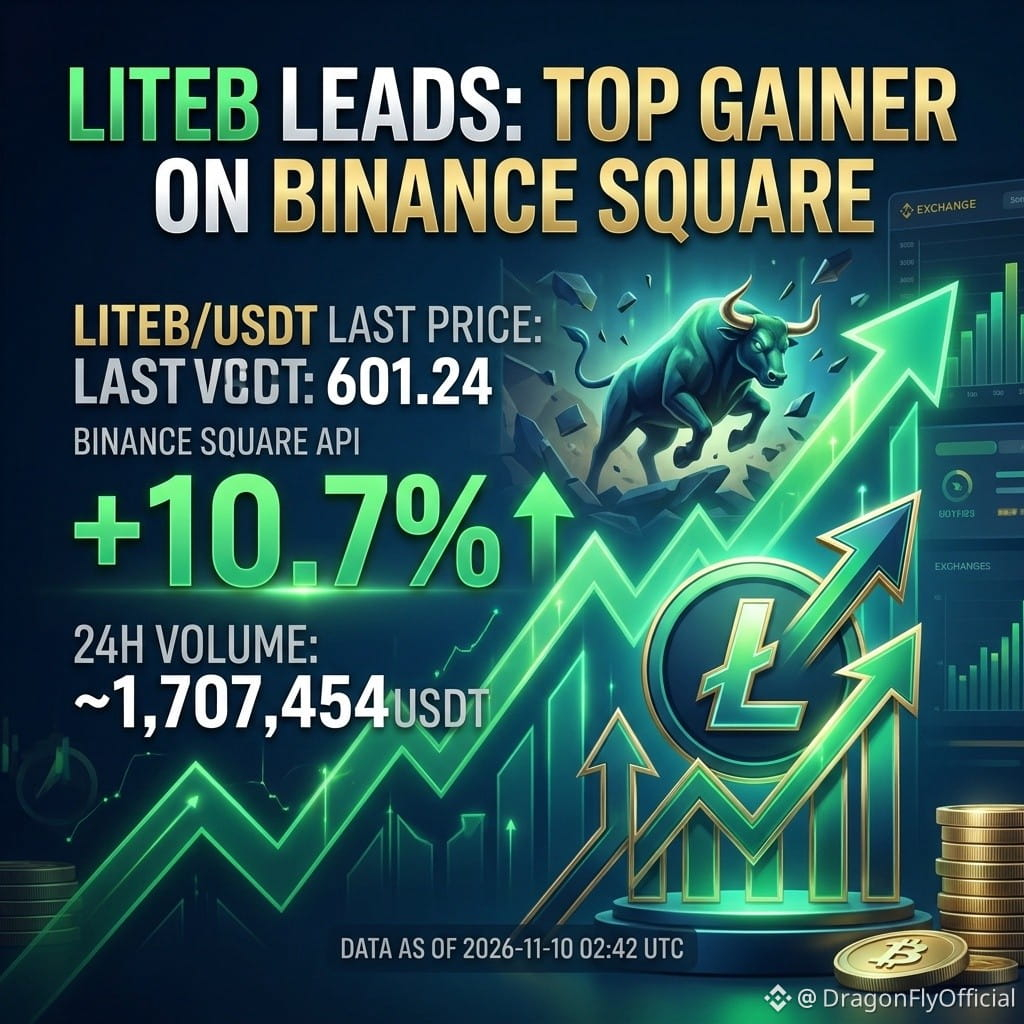
LITEB is attracting attention after a noticeable price increase. Its latest reported 24-hour performance shows a 10.7% gain, with LITEB/USDT trading at 601.24. Its 24-hour trading volume is approximately 1,707,454 USDT. This puts LITEB among today's notable gainers.
📈 The Pros
The strongest positive sign is the combination of price growth and substantial trading activity. A 10.7% increase shows that buyers have been active, while the reported volume indicates meaningful market participation.
Higher volume can make a price move more interesting because it shows that trading activity is taking place alongside the increase. However, it does not guarantee that the rally will continue.
⚠️ The Cons
A rising price does not always mean a strong long-term trend. Some increases happen because of short-term speculation, sudden buying pressure, or limited market liquidity.
There is also insufficient verified information here to identify a specific announcement, partnership, or project development behind LITEB's move. Investors should avoid assuming a positive news event caused the gain.
💡 Final Reminder
Dragonfly Official encourages independent research. Keep positions small, use appropriate stop losses, and never risk money you cannot afford to lose. Crypto trading is risky, and this is not financial advice.
Stay careful, question the hype, and always think independently.
#LITEB #CryptoMarke t #TopGainers #CryptoAnalys #RiskManagement
LITEB GAINS 10.7%: WHAT CHANGED, AND CAN THE MOMENTUM LAST?
📊 Before vs Now
LITEB is attracting attention after a noticeable price increase. Its latest reported 24-hour performance shows a 10.7% gain, with LITEB/USDT trading at 601.24. Its 24-hour trading volume is approximately 1,707,454 USDT. This puts LITEB among today's notable gainers.
📈 The Pros
The strongest positive sign is the combination of price growth and substantial trading activity. A 10.7% increase shows that buyers have been active, while the reported volume indicates meaningful market participation.
Higher volume can make a price move more interesting because it shows that trading activity is taking place alongside the increase. However, it does not guarantee that the rally will continue.
⚠️ The Cons
A rising price does not always mean a strong long-term trend. Some increases happen because of short-term speculation, sudden buying pressure, or limited market liquidity.
There is also insufficient verified information here to identify a specific announcement, partnership, or project development behind LITEB's move. Investors should avoid assuming a positive news event caused the gain.
💡 Final Reminder
Dragonfly Official encourages independent research. Keep positions small, use appropriate stop losses, and never risk money you cannot afford to lose. Crypto trading is risky, and this is not financial advice.
Stay careful, question the hype, and always think independently.
#LITEB #CryptoMarke t #TopGainers #CryptoAnalys #RiskManagement
📊 Before vs Now
LITEB is attracting attention after a noticeable price increase. Its latest reported 24-hour performance shows a 10.7% gain, with LITEB/USDT trading at 601.24. Its 24-hour trading volume is approximately 1,707,454 USDT. This puts LITEB among today's notable gainers.
📈 The Pros
The strongest positive sign is the combination of price growth and substantial trading activity. A 10.7% increase shows that buyers have been active, while the reported volume indicates meaningful market participation.
Higher volume can make a price move more interesting because it shows that trading activity is taking place alongside the increase. However, it does not guarantee that the rally will continue.
⚠️ The Cons
A rising price does not always mean a strong long-term trend. Some increases happen because of short-term speculation, sudden buying pressure, or limited market liquidity.
There is also insufficient verified information here to identify a specific announcement, partnership, or project development behind LITEB's move. Investors should avoid assuming a positive news event caused the gain.
💡 Final Reminder
Dragonfly Official encourages independent research. Keep positions small, use appropriate stop losses, and never risk money you cannot afford to lose. Crypto trading is risky, and this is not financial advice.
Stay careful, question the hype, and always think independently.
#LITEB #CryptoMarke t #TopGainers #CryptoAnalys #RiskManagement
5
BEAMX CLIMBS 10.8%: IS GAMING SECTOR INTEREST RETURNING?
🎮 Start With the Basics
Imagine checking your crypto portfolio and finding BEAMX among the day's strongest performers. The token has attracted fresh market attention, but is this the beginning of stronger momentum or simply a short-term price move?
BEAMX is associated with Beam, a blockchain ecosystem focused on Web3 gaming. Its goal is to support gaming applications, digital assets, and blockchain-based experiences.
📊 The Numbers Behind the Move
As of November 10, 2026, at 02:42 UTC, BEAMX/USDT recorded:
💡 A Beginner's Trading Guide
Before considering a position, check whether trading activity remains strong, monitor broader crypto market conditions, and look for sustained price strength rather than reacting to one daily percentage change.
There is no verified entry price, stop-loss level, or take-profit target established by the available data. Avoid guessing these levels or chasing a sudden rally.
⚠️ The Risks Still Matter
A 10.8% gain does not guarantee another upward move. Profit-taking, changing sentiment, and sudden selling pressure can reverse gains quickly.
Keep positions small, use a suitable stop loss, and risk only what you can afford to lose. Crypto trading is risky, and this is not financial advice.
Dragonfly Official Takeaway: BEAMX has delivered an impressive daily gain, but sustainable strength matters more than a single green candle.
Do you think BEAMX can maintain its momentum?
#BEAMX #beams #CryptoMarke t #altcoinscrash #CryptoTrading
BEAMX CLIMBS 10.8%: IS GAMING SECTOR INTEREST RETURNING?
🎮 Start With the Basics
Imagine checking your crypto portfolio and finding BEAMX among the day's strongest performers. The token has attracted fresh market attention, but is this the beginning of stronger momentum or simply a short-term price move?
BEAMX is associated with Beam, a blockchain ecosystem focused on Web3 gaming. Its goal is to support gaming applications, digital assets, and blockchain-based experiences.
📊 The Numbers Behind the Move
As of November 10, 2026, at 02:42 UTC, BEAMX/USDT recorded:
💡 A Beginner's Trading Guide
Before considering a position, check whether trading activity remains strong, monitor broader crypto market conditions, and look for sustained price strength rather than reacting to one daily percentage change.
There is no verified entry price, stop-loss level, or take-profit target established by the available data. Avoid guessing these levels or chasing a sudden rally.
⚠️ The Risks Still Matter
A 10.8% gain does not guarantee another upward move. Profit-taking, changing sentiment, and sudden selling pressure can reverse gains quickly.
Keep positions small, use a suitable stop loss, and risk only what you can afford to lose. Crypto trading is risky, and this is not financial advice.
Dragonfly Official Takeaway: BEAMX has delivered an impressive daily gain, but sustainable strength matters more than a single green candle.
Do you think BEAMX can maintain its momentum?
#BEAMX #beams #CryptoMarke t #altcoinscrash #CryptoTrading
🎮 Start With the Basics
Imagine checking your crypto portfolio and finding BEAMX among the day's strongest performers. The token has attracted fresh market attention, but is this the beginning of stronger momentum or simply a short-term price move?
BEAMX is associated with Beam, a blockchain ecosystem focused on Web3 gaming. Its goal is to support gaming applications, digital assets, and blockchain-based experiences.
📊 The Numbers Behind the Move
As of November 10, 2026, at 02:42 UTC, BEAMX/USDT recorded:
💡 A Beginner's Trading Guide
Before considering a position, check whether trading activity remains strong, monitor broader crypto market conditions, and look for sustained price strength rather than reacting to one daily percentage change.
There is no verified entry price, stop-loss level, or take-profit target established by the available data. Avoid guessing these levels or chasing a sudden rally.
⚠️ The Risks Still Matter
A 10.8% gain does not guarantee another upward move. Profit-taking, changing sentiment, and sudden selling pressure can reverse gains quickly.
Keep positions small, use a suitable stop loss, and risk only what you can afford to lose. Crypto trading is risky, and this is not financial advice.
Dragonfly Official Takeaway: BEAMX has delivered an impressive daily gain, but sustainable strength matters more than a single green candle.
Do you think BEAMX can maintain its momentum?
#BEAMX #beams #CryptoMarke t #altcoinscrash #CryptoTrading
97
HOT GAINS 13.6%: WHAT IS SUPPORTING THE RALLY, AND WHAT COULD GO WRONG?
🔍 Balanced View: Momentum Needs Confirmation
HOT's 13.6% gain shows positive short-term momentum, but one day's performance cannot establish a lasting recovery. Traders should avoid chasing sudden increases without checking market conditions and their own risk limits.
💡 What to Watch Next
Watch whether trading volume remains strong, whether buyers maintain interest, and whether HOT can sustain its momentum.
Dragonfly Official reminds readers that crypto trading is risky. Keep positions small, use a stop loss where appropriate, and risk only what you can afford to lose. This is not financial advice.
$HOT
HOT GAINS 13.6%: WHAT IS SUPPORTING THE RALLY, AND WHAT COULD GO WRONG?
🔍 Balanced View: Momentum Needs Confirmation
HOT's 13.6% gain shows positive short-term momentum, but one day's performance cannot establish a lasting recovery. Traders should avoid chasing sudden increases without checking market conditions and their own risk limits.
💡 What to Watch Next
Watch whether trading volume remains strong, whether buyers maintain interest, and whether HOT can sustain its momentum.
Dragonfly Official reminds readers that crypto trading is risky. Keep positions small, use a stop loss where appropriate, and risk only what you can afford to lose. This is not financial advice.
$HOT
🔍 Balanced View: Momentum Needs Confirmation
HOT's 13.6% gain shows positive short-term momentum, but one day's performance cannot establish a lasting recovery. Traders should avoid chasing sudden increases without checking market conditions and their own risk limits.
💡 What to Watch Next
Watch whether trading volume remains strong, whether buyers maintain interest, and whether HOT can sustain its momentum.
Dragonfly Official reminds readers that crypto trading is risky. Keep positions small, use a stop loss where appropriate, and risk only what you can afford to lose. This is not financial advice.
$HOT

165
TST RISES 12%: IS BUYING INTEREST BUILDING, OR IS THIS A SHORT-TERM MOVE?
❓ What’s Happening?
TST is attracting market attention after gaining 12.0% in 24 hours. But is this increase the beginning of stronger momentum, or simply a temporary burst of buying activity? The trading figures offer some useful clues.
📊 Market Snapshot
As of November 10, 2026, at 02:42 UTC:
Trading pair: TST/USDT
Last price: $0.01281
24-hour change: +12.0%
24-hour trading volume: Approximately $8,162,403
The combination of a positive price movement and substantial trading activity shows that TST has attracted considerable market participation.
🔍 Possible Reasons
Increased buying interest, renewed attention from traders, speculative activity, or broader market sentiment could contribute to this move. However, the available figures do not confirm which factor is responsible.
A price increase alone cannot prove that long-term demand is growing. Traders should look for continued activity before treating this movement as a lasting trend.
⚖️ The Other Side
Rapid gains can attract short-term traders looking for quick profits. If buying interest weakens or sellers become more active, the price could reverse. High trading volume does not guarantee that the upward movement will continue.
⚠️ Final Reminder
Crypto trading is risky, and this analysis is not financial advice. Stay careful, check the facts, and always think independently before making a trading decision.
#TST #CryptoMarket #TopGainersonBinance r #CryptoAnalysisb #TradingRisk
TST RISES 12%: IS BUYING INTEREST BUILDING, OR IS THIS A SHORT-TERM MOVE?
❓ What’s Happening?
TST is attracting market attention after gaining 12.0% in 24 hours. But is this increase the beginning of stronger momentum, or simply a temporary burst of buying activity? The trading figures offer some useful clues.
📊 Market Snapshot
As of November 10, 2026, at 02:42 UTC:
Trading pair: TST/USDT
Last price: $0.01281
24-hour change: +12.0%
24-hour trading volume: Approximately $8,162,403
The combination of a positive price movement and substantial trading activity shows that TST has attracted considerable market participation.
🔍 Possible Reasons
Increased buying interest, renewed attention from traders, speculative activity, or broader market sentiment could contribute to this move. However, the available figures do not confirm which factor is responsible.
A price increase alone cannot prove that long-term demand is growing. Traders should look for continued activity before treating this movement as a lasting trend.
⚖️ The Other Side
Rapid gains can attract short-term traders looking for quick profits. If buying interest weakens or sellers become more active, the price could reverse. High trading volume does not guarantee that the upward movement will continue.
⚠️ Final Reminder
Crypto trading is risky, and this analysis is not financial advice. Stay careful, check the facts, and always think independently before making a trading decision.
#TST #CryptoMarket #TopGainersonBinance r #CryptoAnalysisb #TradingRisk
❓ What’s Happening?
TST is attracting market attention after gaining 12.0% in 24 hours. But is this increase the beginning of stronger momentum, or simply a temporary burst of buying activity? The trading figures offer some useful clues.
📊 Market Snapshot
As of November 10, 2026, at 02:42 UTC:
Trading pair: TST/USDT
Last price: $0.01281
24-hour change: +12.0%
24-hour trading volume: Approximately $8,162,403
The combination of a positive price movement and substantial trading activity shows that TST has attracted considerable market participation.
🔍 Possible Reasons
Increased buying interest, renewed attention from traders, speculative activity, or broader market sentiment could contribute to this move. However, the available figures do not confirm which factor is responsible.
A price increase alone cannot prove that long-term demand is growing. Traders should look for continued activity before treating this movement as a lasting trend.
⚖️ The Other Side
Rapid gains can attract short-term traders looking for quick profits. If buying interest weakens or sellers become more active, the price could reverse. High trading volume does not guarantee that the upward movement will continue.
⚠️ Final Reminder
Crypto trading is risky, and this analysis is not financial advice. Stay careful, check the facts, and always think independently before making a trading decision.
#TST #CryptoMarket #TopGainersonBinance r #CryptoAnalysisb #TradingRisk

233
WHY IS SOXLB UP 18.3%? THE FACTS BEHIND TODAY’S TOP GAINER
📈 MYTH: JUST ANOTHER CRYPTO PUMP
FACT: A DIFFERENT KIND OF ASSET
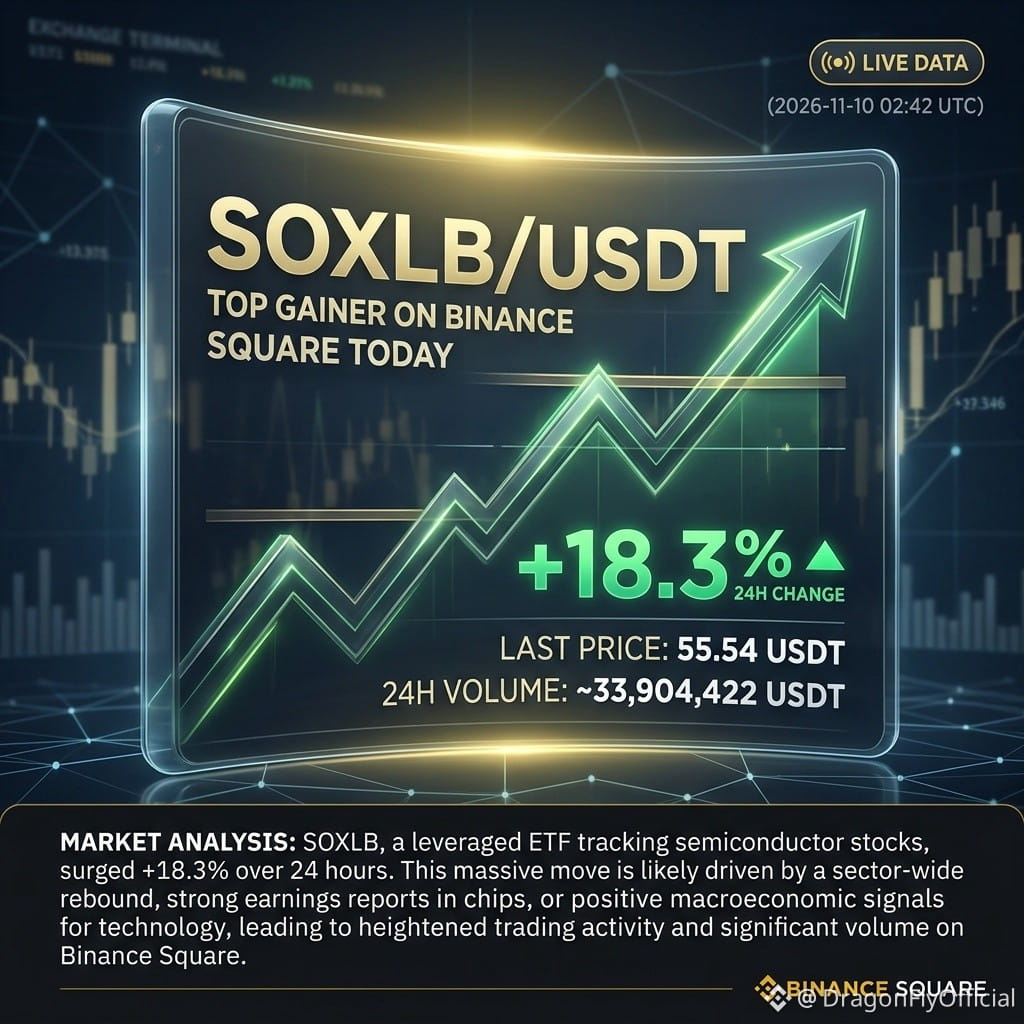
SOXLB is not an ordinary cryptocurrency. It is a tokenized financial asset linked to the Semicon Bull 3X ETF, which provides leveraged exposure to semiconductor stocks. This means its performance is connected to the traditional semiconductor market, not simply crypto market sentiment.
📊 MARKET SNAPSHOT
The latest reported data from November 10, 2026, at 02:42 UTC shows:
Trading pair: SOXLB/USDT
Last price: 55.54 USDT
24-hour gain: +18.3%
24-hour trading volume: Approximately 33,904,422 USDT
This strong price movement and substantial trading activity put SOXLB in the spotlight among today's top gainers.
⚠️ MYTH: 18.3% GROWTH MEANS LOW RISK
FACT: LEVERAGE CAN WORK BOTH WAYS
SOXLB's underlying ETF uses 3X daily leverage. This can amplify gains, but it can also magnify losses. Daily leverage and compounding can produce unexpected results over longer holding periods.
💡 TRADING OUTLOOK
A strong daily gain deserves attention, not blind buying. Watch semiconductor market performance, trading volume, and price stability before making a decision. No reliable entry, stop-loss, or target levels are established by the available data.
Keep positions small, use a suitable stop loss, and risk only what you can afford to lose.
Dragonfly Official takeaway: Big gains attract attention, but understanding leverage and managing risk is what separates informed decisions from speculation.
Crypto trading involves risk. This is not financial advice.
$SOXLB
{spot}(SOXLBUSDT)
WHY IS SOXLB UP 18.3%? THE FACTS BEHIND TODAY’S TOP GAINER
📈 MYTH: JUST ANOTHER CRYPTO PUMP
FACT: A DIFFERENT KIND OF ASSET
SOXLB is not an ordinary cryptocurrency. It is a tokenized financial asset linked to the Semicon Bull 3X ETF, which provides leveraged exposure to semiconductor stocks. This means its performance is connected to the traditional semiconductor market, not simply crypto market sentiment.
📊 MARKET SNAPSHOT
The latest reported data from November 10, 2026, at 02:42 UTC shows:
Trading pair: SOXLB/USDT
Last price: 55.54 USDT
24-hour gain: +18.3%
24-hour trading volume: Approximately 33,904,422 USDT
This strong price movement and substantial trading activity put SOXLB in the spotlight among today's top gainers.
⚠️ MYTH: 18.3% GROWTH MEANS LOW RISK
FACT: LEVERAGE CAN WORK BOTH WAYS
SOXLB's underlying ETF uses 3X daily leverage. This can amplify gains, but it can also magnify losses. Daily leverage and compounding can produce unexpected results over longer holding periods.
💡 TRADING OUTLOOK
A strong daily gain deserves attention, not blind buying. Watch semiconductor market performance, trading volume, and price stability before making a decision. No reliable entry, stop-loss, or target levels are established by the available data.
Keep positions small, use a suitable stop loss, and risk only what you can afford to lose.
Dragonfly Official takeaway: Big gains attract attention, but understanding leverage and managing risk is what separates informed decisions from speculation.
Crypto trading involves risk. This is not financial advice.
$SOXLB
📈 MYTH: JUST ANOTHER CRYPTO PUMP
FACT: A DIFFERENT KIND OF ASSET
SOXLB is not an ordinary cryptocurrency. It is a tokenized financial asset linked to the Semicon Bull 3X ETF, which provides leveraged exposure to semiconductor stocks. This means its performance is connected to the traditional semiconductor market, not simply crypto market sentiment.
📊 MARKET SNAPSHOT
The latest reported data from November 10, 2026, at 02:42 UTC shows:
Trading pair: SOXLB/USDT
Last price: 55.54 USDT
24-hour gain: +18.3%
24-hour trading volume: Approximately 33,904,422 USDT
This strong price movement and substantial trading activity put SOXLB in the spotlight among today's top gainers.
⚠️ MYTH: 18.3% GROWTH MEANS LOW RISK
FACT: LEVERAGE CAN WORK BOTH WAYS
SOXLB's underlying ETF uses 3X daily leverage. This can amplify gains, but it can also magnify losses. Daily leverage and compounding can produce unexpected results over longer holding periods.
💡 TRADING OUTLOOK
A strong daily gain deserves attention, not blind buying. Watch semiconductor market performance, trading volume, and price stability before making a decision. No reliable entry, stop-loss, or target levels are established by the available data.
Keep positions small, use a suitable stop loss, and risk only what you can afford to lose.
Dragonfly Official takeaway: Big gains attract attention, but understanding leverage and managing risk is what separates informed decisions from speculation.
Crypto trading involves risk. This is not financial advice.
$SOXLB
74
INIT SURGES 57.6%: IS THIS A REAL RECOVERY OR A SHORT-TERM BUYING WAVE?
📊 MYTH: A 57% PRICE SURGE MEANS A COIN IS NOW SAFE TO BUY.
Not necessarily. A sharp rally can show strong market interest, but it can also bring greater volatility and sudden reversals. INIT is a good example of why traders should look beyond the percentage gain.
📈 Q: WHAT HAPPENED TO INIT?
As of November 10, 2026, at 02:42 UTC, INIT/USDT recorded:
Last price: 0.19856 USDT
24-hour change: +57.6%
24-hour trading volume: Approximately 13.61 million USDT
This strong performance placed INIT among the day's leading gainers.
🔍 Q: WHY IS THE MOVE IMPORTANT?
The combination of a large price increase and substantial trading activity suggests increased market participation.
However, higher volume does not automatically confirm long-term demand. It can also reflect short-term speculation, momentum trading, and traders reacting to rapid price movements.
💡 Q: WHAT COULD BE DRIVING THE RALLY?
Initia is a blockchain ecosystem, so confidence in its technology, ecosystem activity, and broader market sentiment could influence interest in INIT.
However, the available figures do not confirm one specific reason for this rally. Traders should avoid treating speculation as an established catalyst.
⚠️ Q: WHAT ARE THE BIGGEST RISKS?
After a rapid rally, profit-taking can create sudden selling pressure. Momentum can fade, and volatile prices can lead to unexpected losses. Chasing a rising price without a clear plan can be dangerous.
#INIT #Initia #CryptoMarket #TopGainer #CryptoTrading
INIT SURGES 57.6%: IS THIS A REAL RECOVERY OR A SHORT-TERM BUYING WAVE?
📊 MYTH: A 57% PRICE SURGE MEANS A COIN IS NOW SAFE TO BUY.
Not necessarily. A sharp rally can show strong market interest, but it can also bring greater volatility and sudden reversals. INIT is a good example of why traders should look beyond the percentage gain.
📈 Q: WHAT HAPPENED TO INIT?
As of November 10, 2026, at 02:42 UTC, INIT/USDT recorded:
Last price: 0.19856 USDT
24-hour change: +57.6%
24-hour trading volume: Approximately 13.61 million USDT
This strong performance placed INIT among the day's leading gainers.
🔍 Q: WHY IS THE MOVE IMPORTANT?
The combination of a large price increase and substantial trading activity suggests increased market participation.
However, higher volume does not automatically confirm long-term demand. It can also reflect short-term speculation, momentum trading, and traders reacting to rapid price movements.
💡 Q: WHAT COULD BE DRIVING THE RALLY?
Initia is a blockchain ecosystem, so confidence in its technology, ecosystem activity, and broader market sentiment could influence interest in INIT.
However, the available figures do not confirm one specific reason for this rally. Traders should avoid treating speculation as an established catalyst.
⚠️ Q: WHAT ARE THE BIGGEST RISKS?
After a rapid rally, profit-taking can create sudden selling pressure. Momentum can fade, and volatile prices can lead to unexpected losses. Chasing a rising price without a clear plan can be dangerous.
#INIT #Initia #CryptoMarket #TopGainer #CryptoTrading
📊 MYTH: A 57% PRICE SURGE MEANS A COIN IS NOW SAFE TO BUY.
Not necessarily. A sharp rally can show strong market interest, but it can also bring greater volatility and sudden reversals. INIT is a good example of why traders should look beyond the percentage gain.
📈 Q: WHAT HAPPENED TO INIT?
As of November 10, 2026, at 02:42 UTC, INIT/USDT recorded:
Last price: 0.19856 USDT
24-hour change: +57.6%
24-hour trading volume: Approximately 13.61 million USDT
This strong performance placed INIT among the day's leading gainers.
🔍 Q: WHY IS THE MOVE IMPORTANT?
The combination of a large price increase and substantial trading activity suggests increased market participation.
However, higher volume does not automatically confirm long-term demand. It can also reflect short-term speculation, momentum trading, and traders reacting to rapid price movements.
💡 Q: WHAT COULD BE DRIVING THE RALLY?
Initia is a blockchain ecosystem, so confidence in its technology, ecosystem activity, and broader market sentiment could influence interest in INIT.
However, the available figures do not confirm one specific reason for this rally. Traders should avoid treating speculation as an established catalyst.
⚠️ Q: WHAT ARE THE BIGGEST RISKS?
After a rapid rally, profit-taking can create sudden selling pressure. Momentum can fade, and volatile prices can lead to unexpected losses. Chasing a rising price without a clear plan can be dangerous.
#INIT #Initia #CryptoMarket #TopGainer #CryptoTrading
136
GNS SURGES 34.7%: WHAT IS DRIVING THE SUDDEN BUYING INTEREST?
📈 WHAT HAPPENED TO GNS?
GNS/USDT has recorded a strong 34.7% gain in 24 hours, reaching $0.427. Its 24-hour trading volume has also reached approximately $6.46 million. This makes GNS a coin worth watching as traders look for opportunities in the market.
🔍 WHAT IS GNS?
GNS is the token of Gains Network, a decentralized trading ecosystem. Its main focus is providing on-chain leveraged trading. In simple words, it allows users to trade different markets through blockchain-based technology.
📊 WHY IS THE PRICE RISING?
A 34.7% increase alongside millions of dollars in trading volume suggests strong market activity. Possible factors include increased buying interest, short-term speculation, renewed attention toward the project, or broader market sentiment.
However, the available figures do not confirm which factor caused the rally. Higher volume shows increased trading activity, not necessarily long-term investor demand.
💡 WHAT SHOULD TRADERS WATCH?
Before considering a position, watch whether buying activity continues, whether volume remains strong, and whether the price can maintain its recent gains. Avoid chasing a sudden pump without confirmation. No reliable entry, stop-loss, or take-profit levels can be established from the supplied data alone.
⚠️ THE BIGGER PICTURE
GNS has delivered an impressive daily move, but sharp rallies can reverse quickly. Keep position sizes small, use a suitable stop loss, and risk only what you can afford to lose.
GNS SURGES 34.7%: WHAT IS DRIVING THE SUDDEN BUYING INTEREST?
📈 WHAT HAPPENED TO GNS?
GNS/USDT has recorded a strong 34.7% gain in 24 hours, reaching $0.427. Its 24-hour trading volume has also reached approximately $6.46 million. This makes GNS a coin worth watching as traders look for opportunities in the market.
🔍 WHAT IS GNS?
GNS is the token of Gains Network, a decentralized trading ecosystem. Its main focus is providing on-chain leveraged trading. In simple words, it allows users to trade different markets through blockchain-based technology.
📊 WHY IS THE PRICE RISING?
A 34.7% increase alongside millions of dollars in trading volume suggests strong market activity. Possible factors include increased buying interest, short-term speculation, renewed attention toward the project, or broader market sentiment.
However, the available figures do not confirm which factor caused the rally. Higher volume shows increased trading activity, not necessarily long-term investor demand.
💡 WHAT SHOULD TRADERS WATCH?
Before considering a position, watch whether buying activity continues, whether volume remains strong, and whether the price can maintain its recent gains. Avoid chasing a sudden pump without confirmation. No reliable entry, stop-loss, or take-profit levels can be established from the supplied data alone.
⚠️ THE BIGGER PICTURE
GNS has delivered an impressive daily move, but sharp rallies can reverse quickly. Keep position sizes small, use a suitable stop loss, and risk only what you can afford to lose.
📈 WHAT HAPPENED TO GNS?
GNS/USDT has recorded a strong 34.7% gain in 24 hours, reaching $0.427. Its 24-hour trading volume has also reached approximately $6.46 million. This makes GNS a coin worth watching as traders look for opportunities in the market.
🔍 WHAT IS GNS?
GNS is the token of Gains Network, a decentralized trading ecosystem. Its main focus is providing on-chain leveraged trading. In simple words, it allows users to trade different markets through blockchain-based technology.
📊 WHY IS THE PRICE RISING?
A 34.7% increase alongside millions of dollars in trading volume suggests strong market activity. Possible factors include increased buying interest, short-term speculation, renewed attention toward the project, or broader market sentiment.
However, the available figures do not confirm which factor caused the rally. Higher volume shows increased trading activity, not necessarily long-term investor demand.
💡 WHAT SHOULD TRADERS WATCH?
Before considering a position, watch whether buying activity continues, whether volume remains strong, and whether the price can maintain its recent gains. Avoid chasing a sudden pump without confirmation. No reliable entry, stop-loss, or take-profit levels can be established from the supplied data alone.
⚠️ THE BIGGER PICTURE
GNS has delivered an impressive daily move, but sharp rallies can reverse quickly. Keep position sizes small, use a suitable stop loss, and risk only what you can afford to lose.
27
YOUR ACCOUNT CHANGED. SEND YOUR MESSAGE AGAIN
YOUR ACCOUNT CHANGED. SEND YOUR MESSAGE AGAIN
📊 WHAT JUST HAPPENED?
The crypto market has witnessed another massive liquidation wave, with approximately $1.16 billion in leveraged positions wiped out within 24 hours on November 9.
The sudden market decline caught thousands of traders on the wrong side of the move. More than 167,000 traders were liquidated during this period, showing just how quickly market conditions can turn against leveraged positions.
Long positions took the biggest hit, accounting for approximately $1.04 billion, while short positions represented around $117 million.
🔍 WHY DID THE LOSSES BECOME SO LARGE?
The main problem was excessive leverage combined with falling prices.
A long position is a trade that makes money when prices rise. When traders borrow money or use leverage to increase their position size, even a relatively small price decline can create significant losses.
If their available margin becomes insufficient, exchanges automatically close their positions. These forced closures are called liquidations.
The selling pressure can push prices lower, triggering more liquidations and creating a chain reaction.
Ethereum traders experienced particularly heavy losses, with more than $500 million in liquidations, compared with approximately $309 million for Bitcoin.
⚠️ WHAT DOES THIS MEAN FOR THE MARKET?
The liquidation figures reveal that bullish traders were heavily exposed before the latest decline.
Bitcoin briefly dropped below $74,000, adding pressure to an already nervous market. However, massive liquidations do not automatically mean that a longer-term bear market is beginning.
.
They show that excessive leverage has been removed from the market, but they do not guarantee an immediate recovery.
📈 WHAT COULD HAPPEN NEXT?
The next market direction will depend on whether buyers return with enough strength to support prices.
If selling pressure continues, additional volatility and forced closures remain possible. If buying demand improves, the market could stabilize as weaker leveraged positions have already been removed.
📊 WHAT JUST HAPPENED?
The crypto market has witnessed another massive liquidation wave, with approximately $1.16 billion in leveraged positions wiped out within 24 hours on November 9.
The sudden market decline caught thousands of traders on the wrong side of the move. More than 167,000 traders were liquidated during this period, showing just how quickly market conditions can turn against leveraged positions.
Long positions took the biggest hit, accounting for approximately $1.04 billion, while short positions represented around $117 million.
🔍 WHY DID THE LOSSES BECOME SO LARGE?
The main problem was excessive leverage combined with falling prices.
A long position is a trade that makes money when prices rise. When traders borrow money or use leverage to increase their position size, even a relatively small price decline can create significant losses.
If their available margin becomes insufficient, exchanges automatically close their positions. These forced closures are called liquidations.
The selling pressure can push prices lower, triggering more liquidations and creating a chain reaction.
Ethereum traders experienced particularly heavy losses, with more than $500 million in liquidations, compared with approximately $309 million for Bitcoin.
⚠️ WHAT DOES THIS MEAN FOR THE MARKET?
The liquidation figures reveal that bullish traders were heavily exposed before the latest decline.
Bitcoin briefly dropped below $74,000, adding pressure to an already nervous market. However, massive liquidations do not automatically mean that a longer-term bear market is beginning.
.
They show that excessive leverage has been removed from the market, but they do not guarantee an immediate recovery.
📈 WHAT COULD HAPPEN NEXT?
The next market direction will depend on whether buyers return with enough strength to support prices.
If selling pressure continues, additional volatility and forced closures remain possible. If buying demand improves, the market could stabilize as weaker leveraged positions have already been removed.
The crypto market has witnessed another massive liquidation wave, with approximately $1.16 billion in leveraged positions wiped out within 24 hours on November 9.
The sudden market decline caught thousands of traders on the wrong side of the move. More than 167,000 traders were liquidated during this period, showing just how quickly market conditions can turn against leveraged positions.
Long positions took the biggest hit, accounting for approximately $1.04 billion, while short positions represented around $117 million.
🔍 WHY DID THE LOSSES BECOME SO LARGE?
The main problem was excessive leverage combined with falling prices.
A long position is a trade that makes money when prices rise. When traders borrow money or use leverage to increase their position size, even a relatively small price decline can create significant losses.
If their available margin becomes insufficient, exchanges automatically close their positions. These forced closures are called liquidations.
The selling pressure can push prices lower, triggering more liquidations and creating a chain reaction.
Ethereum traders experienced particularly heavy losses, with more than $500 million in liquidations, compared with approximately $309 million for Bitcoin.
⚠️ WHAT DOES THIS MEAN FOR THE MARKET?
The liquidation figures reveal that bullish traders were heavily exposed before the latest decline.
Bitcoin briefly dropped below $74,000, adding pressure to an already nervous market. However, massive liquidations do not automatically mean that a longer-term bear market is beginning.
.
They show that excessive leverage has been removed from the market, but they do not guarantee an immediate recovery.
📈 WHAT COULD HAPPEN NEXT?
The next market direction will depend on whether buyers return with enough strength to support prices.
If selling pressure continues, additional volatility and forced closures remain possible. If buying demand improves, the market could stabilize as weaker leveraged positions have already been removed.
52
ANTHROPIC FACES AN IPO TEST: WILL IT HOLD ITS VALUATION OR DELAY THE BIG DEBUT?
🏢 A BIG LAUNCH, A BIG QUESTION
Imagine building one of the world's most valuable AI companies. Your technology attracts millions of users, investors are excited, and you are preparing to enter the stock market. But just before the launch, some buyers begin questioning the price.
That is the challenge facing Anthropic, the company behind Claude AI, as it prepares for a major initial public offering (IPO). The planned November listing is attracting attention, but investor confidence is facing a serious test.
📊 THE $1.5 TRILLION QUESTION
Anthropic's potential IPO valuation has been discussed around $1.5 trillion, below earlier expectations of nearly $2 trillion.
However, some prospective investors consider even $1.5 trillion too expensive under current market conditions. Some reportedly want a bigger discount before committing their money.
This creates a difficult choice: maintain ambitious expectations or offer shares at a lower valuation to attract stronger demand.
⚠️ WHY INVESTORS ARE HESITATING
The wider technology market has experienced a sharp selloff, putting pressure on AI-related companies.
Investors are also examining Anthropic's financial position, including its operating costs, quarterly losses and major commitments to computing infrastructure and business partners.
Another important concern is revenue growth. Investors are waiting for October revenue figures to understand whether the company's recent growth slowdown has improved.
💡 THE BIGGER LESSON FOR AI INVESTORS
Anthropic's situation highlights an important difference between business success and stock market valuation.
A company can have powerful technology, strong demand and impressive revenue growth without automatically justifying any price investors are asked to pay.
For the AI industry, this IPO could become an important test of whether investors are still willing to pay enormous premiums for future growth.
ANTHROPIC FACES AN IPO TEST: WILL IT HOLD ITS VALUATION OR DELAY THE BIG DEBUT?
🏢 A BIG LAUNCH, A BIG QUESTION
Imagine building one of the world's most valuable AI companies. Your technology attracts millions of users, investors are excited, and you are preparing to enter the stock market. But just before the launch, some buyers begin questioning the price.
That is the challenge facing Anthropic, the company behind Claude AI, as it prepares for a major initial public offering (IPO). The planned November listing is attracting attention, but investor confidence is facing a serious test.
📊 THE $1.5 TRILLION QUESTION
Anthropic's potential IPO valuation has been discussed around $1.5 trillion, below earlier expectations of nearly $2 trillion.
However, some prospective investors consider even $1.5 trillion too expensive under current market conditions. Some reportedly want a bigger discount before committing their money.
This creates a difficult choice: maintain ambitious expectations or offer shares at a lower valuation to attract stronger demand.
⚠️ WHY INVESTORS ARE HESITATING
The wider technology market has experienced a sharp selloff, putting pressure on AI-related companies.
Investors are also examining Anthropic's financial position, including its operating costs, quarterly losses and major commitments to computing infrastructure and business partners.
Another important concern is revenue growth. Investors are waiting for October revenue figures to understand whether the company's recent growth slowdown has improved.
💡 THE BIGGER LESSON FOR AI INVESTORS
Anthropic's situation highlights an important difference between business success and stock market valuation.
A company can have powerful technology, strong demand and impressive revenue growth without automatically justifying any price investors are asked to pay.
For the AI industry, this IPO could become an important test of whether investors are still willing to pay enormous premiums for future growth.
🏢 A BIG LAUNCH, A BIG QUESTION
Imagine building one of the world's most valuable AI companies. Your technology attracts millions of users, investors are excited, and you are preparing to enter the stock market. But just before the launch, some buyers begin questioning the price.
That is the challenge facing Anthropic, the company behind Claude AI, as it prepares for a major initial public offering (IPO). The planned November listing is attracting attention, but investor confidence is facing a serious test.
📊 THE $1.5 TRILLION QUESTION
Anthropic's potential IPO valuation has been discussed around $1.5 trillion, below earlier expectations of nearly $2 trillion.
However, some prospective investors consider even $1.5 trillion too expensive under current market conditions. Some reportedly want a bigger discount before committing their money.
This creates a difficult choice: maintain ambitious expectations or offer shares at a lower valuation to attract stronger demand.
⚠️ WHY INVESTORS ARE HESITATING
The wider technology market has experienced a sharp selloff, putting pressure on AI-related companies.
Investors are also examining Anthropic's financial position, including its operating costs, quarterly losses and major commitments to computing infrastructure and business partners.
Another important concern is revenue growth. Investors are waiting for October revenue figures to understand whether the company's recent growth slowdown has improved.
💡 THE BIGGER LESSON FOR AI INVESTORS
Anthropic's situation highlights an important difference between business success and stock market valuation.
A company can have powerful technology, strong demand and impressive revenue growth without automatically justifying any price investors are asked to pay.
For the AI industry, this IPO could become an important test of whether investors are still willing to pay enormous premiums for future growth.
136
CPI TESTS DECEMBER RATE OUTLOOK: WILL INFLATION FORCE THE FED TO KEEP RATES HIGHER? 📊
Will the next US inflation report change expectations for December interest rates? Investors are waiting for October's Consumer Price Index (CPI), scheduled for November 10 at 8:30 a.m. ET.
This report matters because inflation remains a major concern for the Federal Reserve. Its results could influence borrowing costs, stock markets, the US dollar, Bitcoin, and the wider crypto market.
📊 INFLATION PRESSURE
September's US CPI increased to 3.7% year over year, compared with 3.4% in August. This shows that inflation pressure has not disappeared.
The Fed aims to bring inflation down to 2%. When prices continue rising too quickly, policymakers may keep interest rates high or increase them to slow spending and demand.
⚖️ DECEMBER DECISION
The Federal Reserve kept its benchmark interest rate at 3.75%–4.00% in October. However, expectations for December have shifted toward another possible increase.
Recent stronger employment data and persistent inflation have strengthened the case for tighter monetary policy. Markets are now paying close attention to whether the next CPI report supports that expectation.
₿ CRYPTO IMPACT
If inflation comes in hotter than exp
ected, investors may anticipate higher interest rates for longer. That could put pressure on riskier investments, including cryptocurrencies.
If inflation cools, market confidence could improve as investors reassess the Fed's future decisions. However, lower inflation does not automatically guarantee a rate cut.
💡 WHAT MATTERS
Dragonfly Official highlights three important factors to watch:
Headline CPI: The overall change in consumer prices.
Core CPI: Inflation excluding food and energy, which helps reveal underlying price pressure.
Market reaction: Bitcoin, the US dollar, bond yields, and stock markets may respond differently depending on the results.
WHAT COMES NEXT?
The October CPI report arrives November 10, followed by the December 9 Fed decision.
CPI TESTS DECEMBER RATE OUTLOOK: WILL INFLATION FORCE THE FED TO KEEP RATES HIGHER? 📊
Will the next US inflation report change expectations for December interest rates? Investors are waiting for October's Consumer Price Index (CPI), scheduled for November 10 at 8:30 a.m. ET.
This report matters because inflation remains a major concern for the Federal Reserve. Its results could influence borrowing costs, stock markets, the US dollar, Bitcoin, and the wider crypto market.
📊 INFLATION PRESSURE
September's US CPI increased to 3.7% year over year, compared with 3.4% in August. This shows that inflation pressure has not disappeared.
The Fed aims to bring inflation down to 2%. When prices continue rising too quickly, policymakers may keep interest rates high or increase them to slow spending and demand.
⚖️ DECEMBER DECISION
The Federal Reserve kept its benchmark interest rate at 3.75%–4.00% in October. However, expectations for December have shifted toward another possible increase.
Recent stronger employment data and persistent inflation have strengthened the case for tighter monetary policy. Markets are now paying close attention to whether the next CPI report supports that expectation.
₿ CRYPTO IMPACT
If inflation comes in hotter than exp
ected, investors may anticipate higher interest rates for longer. That could put pressure on riskier investments, including cryptocurrencies.
If inflation cools, market confidence could improve as investors reassess the Fed's future decisions. However, lower inflation does not automatically guarantee a rate cut.
💡 WHAT MATTERS
Dragonfly Official highlights three important factors to watch:
Headline CPI: The overall change in consumer prices.
Core CPI: Inflation excluding food and energy, which helps reveal underlying price pressure.
Market reaction: Bitcoin, the US dollar, bond yields, and stock markets may respond differently depending on the results.
WHAT COMES NEXT?
The October CPI report arrives November 10, followed by the December 9 Fed decision.
Will the next US inflation report change expectations for December interest rates? Investors are waiting for October's Consumer Price Index (CPI), scheduled for November 10 at 8:30 a.m. ET.
This report matters because inflation remains a major concern for the Federal Reserve. Its results could influence borrowing costs, stock markets, the US dollar, Bitcoin, and the wider crypto market.
📊 INFLATION PRESSURE
September's US CPI increased to 3.7% year over year, compared with 3.4% in August. This shows that inflation pressure has not disappeared.
The Fed aims to bring inflation down to 2%. When prices continue rising too quickly, policymakers may keep interest rates high or increase them to slow spending and demand.
⚖️ DECEMBER DECISION
The Federal Reserve kept its benchmark interest rate at 3.75%–4.00% in October. However, expectations for December have shifted toward another possible increase.
Recent stronger employment data and persistent inflation have strengthened the case for tighter monetary policy. Markets are now paying close attention to whether the next CPI report supports that expectation.
₿ CRYPTO IMPACT
If inflation comes in hotter than exp
ected, investors may anticipate higher interest rates for longer. That could put pressure on riskier investments, including cryptocurrencies.
If inflation cools, market confidence could improve as investors reassess the Fed's future decisions. However, lower inflation does not automatically guarantee a rate cut.
💡 WHAT MATTERS
Dragonfly Official highlights three important factors to watch:
Headline CPI: The overall change in consumer prices.
Core CPI: Inflation excluding food and energy, which helps reveal underlying price pressure.
Market reaction: Bitcoin, the US dollar, bond yields, and stock markets may respond differently depending on the results.
WHAT COMES NEXT?
The October CPI report arrives November 10, followed by the December 9 Fed decision.
44
📊 FROM STRENGTH TO WEAKNESS: WHAT CHANGED?
Bitcoin was trading near $86,500 in early October. Now, after five consecutive weekly losses, it has fallen to approximately $74,800. This represents a decline of around 13.6% in five weeks. The latest weekly loss was approximately 4.5%, making it the steepest decline in the current losing streak.
For beginners, a red weekly candle simply means Bitcoin closed the week below its opening price. Five consecutive red candles show that selling pressure has continued for several weeks.
Several factors are affecting market confidence:
1. ETF Outflows: Investors withdrew approximately $1.28 billion from US spot Bitcoin ETFs during the first week of November, adding pressure to the market.
2. Market Uncertainty: Concerns about economic conditions, interest rates and technology stocks have weakened investor confidence.
3. Forced Liquidations: When leveraged traders cannot maintain their positions, exchanges automatically close them. This can create additional selling pressure and accelerate price drops.
📉 WHY FIVE LOSING WEEKS MATTER
Five consecutive weekly losses are unusual in Bitcoin's history. However, this pattern does not automatically mean another major crash is coming.
Previous losing streaks have produced different outcomes. Sometimes prices continued falling, while other times the market recovered. History offers useful lessons, but it cannot guarantee what happens next.
⚠️ WHAT SHOULD INVESTORS WATCH NOW?
Bitcoin's recent low near $73,500 is an important area to monitor. A sustained recovery above $75,000 could help improve short-term confidence. On the other hand, an
other decline below the recent low could increase selling pressure.
Bitcoin's five-week losing streak is a serious warning about market weakness, but it is not proof that recovery is impossible. Patience, research and discipline matter most when the market tests investors.
Crypto trading involves risk, and investors can lose their capital. Manage position sizes carefully, use stop losses and never risk money you cannot afford to lose
📊 FROM STRENGTH TO WEAKNESS: WHAT CHANGED?
Bitcoin was trading near $86,500 in early October. Now, after five consecutive weekly losses, it has fallen to approximately $74,800. This represents a decline of around 13.6% in five weeks. The latest weekly loss was approximately 4.5%, making it the steepest decline in the current losing streak.
For beginners, a red weekly candle simply means Bitcoin closed the week below its opening price. Five consecutive red candles show that selling pressure has continued for several weeks.
Several factors are affecting market confidence:
1. ETF Outflows: Investors withdrew approximately $1.28 billion from US spot Bitcoin ETFs during the first week of November, adding pressure to the market.
2. Market Uncertainty: Concerns about economic conditions, interest rates and technology stocks have weakened investor confidence.
3. Forced Liquidations: When leveraged traders cannot maintain their positions, exchanges automatically close them. This can create additional selling pressure and accelerate price drops.
📉 WHY FIVE LOSING WEEKS MATTER
Five consecutive weekly losses are unusual in Bitcoin's history. However, this pattern does not automatically mean another major crash is coming.
Previous losing streaks have produced different outcomes. Sometimes prices continued falling, while other times the market recovered. History offers useful lessons, but it cannot guarantee what happens next.
⚠️ WHAT SHOULD INVESTORS WATCH NOW?
Bitcoin's recent low near $73,500 is an important area to monitor. A sustained recovery above $75,000 could help improve short-term confidence. On the other hand, an
other decline below the recent low could increase selling pressure.
Bitcoin's five-week losing streak is a serious warning about market weakness, but it is not proof that recovery is impossible. Patience, research and discipline matter most when the market tests investors.
Crypto trading involves risk, and investors can lose their capital. Manage position sizes carefully, use stop losses and never risk money you cannot afford to lose
Bitcoin was trading near $86,500 in early October. Now, after five consecutive weekly losses, it has fallen to approximately $74,800. This represents a decline of around 13.6% in five weeks. The latest weekly loss was approximately 4.5%, making it the steepest decline in the current losing streak.
For beginners, a red weekly candle simply means Bitcoin closed the week below its opening price. Five consecutive red candles show that selling pressure has continued for several weeks.
Several factors are affecting market confidence:
1. ETF Outflows: Investors withdrew approximately $1.28 billion from US spot Bitcoin ETFs during the first week of November, adding pressure to the market.
2. Market Uncertainty: Concerns about economic conditions, interest rates and technology stocks have weakened investor confidence.
3. Forced Liquidations: When leveraged traders cannot maintain their positions, exchanges automatically close them. This can create additional selling pressure and accelerate price drops.
📉 WHY FIVE LOSING WEEKS MATTER
Five consecutive weekly losses are unusual in Bitcoin's history. However, this pattern does not automatically mean another major crash is coming.
Previous losing streaks have produced different outcomes. Sometimes prices continued falling, while other times the market recovered. History offers useful lessons, but it cannot guarantee what happens next.
⚠️ WHAT SHOULD INVESTORS WATCH NOW?
Bitcoin's recent low near $73,500 is an important area to monitor. A sustained recovery above $75,000 could help improve short-term confidence. On the other hand, an
other decline below the recent low could increase selling pressure.
Bitcoin's five-week losing streak is a serious warning about market weakness, but it is not proof that recovery is impossible. Patience, research and discipline matter most when the market tests investors.
Crypto trading involves risk, and investors can lose their capital. Manage position sizes carefully, use stop losses and never risk money you cannot afford to lose
87
NVIDIA’S CEO UNDER INVESTIGATION: WHAT HUANG’S APOLOGY REALLY MEANS
🔍 MYTH 1: THIS IS ONLY A PERSONAL RELATIONSHIP SCANDAL
Fact: The controversy goes beyond Huang’s private life.
On November 8, 2026, Huang admitted in a message to employees that he had been unfaithful to his wife. He apologized to his family, colleagues, board members, partners, and shareholders, accepting responsibility for his actions.
However, the bigger concern involves reports that a woman connected to his relationship was suspected by US intelligence officials of having links to Chinese intelligence.
These allegations have not been established as proven facts.
⚠️ MYTH 2: NVIDIA IS ALREADY FACING CONFIRMED DATA THEFT
Fact: The investigation is designed to establish what actually happened.
NVIDIA's board has launched an independent investigation led by independent directors with support from outside legal counsel.
The company has stated that it currently has no reason to believe that national security or NVIDIA's confidential information was compromised.
This distinction matters. An investigation does not automatically mean that spying or information theft occurred.
📊 MYTH 3: HUANG HAS BEEN REMOVED AS CEO
Fact: He remains in charge during the investigation.
NVIDIA has indicated that Huang will continue leading the company without interruption. He has also promised to cooperate fully with the investigation and reaffirmed his commitment to protecting the company and supporting US national security.
Nevertheless, the situation raises important questions about executive responsibility, corporate security, and leadership accountability.
This story is a reminder that corporate leadership involves more than business performance. Trust, transparency, personal responsibility, and security matter too.
The real test for NVIDIA will be whether its independent investigation provides clear answers and protects the confidence of employees, customers, and investors.
Do you think NVIDIA can maintain investor confidence while this investigation continues?
NVIDIA’S CEO UNDER INVESTIGATION: WHAT HUANG’S APOLOGY REALLY MEANS
🔍 MYTH 1: THIS IS ONLY A PERSONAL RELATIONSHIP SCANDAL
Fact: The controversy goes beyond Huang’s private life.
On November 8, 2026, Huang admitted in a message to employees that he had been unfaithful to his wife. He apologized to his family, colleagues, board members, partners, and shareholders, accepting responsibility for his actions.
However, the bigger concern involves reports that a woman connected to his relationship was suspected by US intelligence officials of having links to Chinese intelligence.
These allegations have not been established as proven facts.
⚠️ MYTH 2: NVIDIA IS ALREADY FACING CONFIRMED DATA THEFT
Fact: The investigation is designed to establish what actually happened.
NVIDIA's board has launched an independent investigation led by independent directors with support from outside legal counsel.
The company has stated that it currently has no reason to believe that national security or NVIDIA's confidential information was compromised.
This distinction matters. An investigation does not automatically mean that spying or information theft occurred.
📊 MYTH 3: HUANG HAS BEEN REMOVED AS CEO
Fact: He remains in charge during the investigation.
NVIDIA has indicated that Huang will continue leading the company without interruption. He has also promised to cooperate fully with the investigation and reaffirmed his commitment to protecting the company and supporting US national security.
Nevertheless, the situation raises important questions about executive responsibility, corporate security, and leadership accountability.
This story is a reminder that corporate leadership involves more than business performance. Trust, transparency, personal responsibility, and security matter too.
The real test for NVIDIA will be whether its independent investigation provides clear answers and protects the confidence of employees, customers, and investors.
Do you think NVIDIA can maintain investor confidence while this investigation continues?
🔍 MYTH 1: THIS IS ONLY A PERSONAL RELATIONSHIP SCANDAL
Fact: The controversy goes beyond Huang’s private life.
On November 8, 2026, Huang admitted in a message to employees that he had been unfaithful to his wife. He apologized to his family, colleagues, board members, partners, and shareholders, accepting responsibility for his actions.
However, the bigger concern involves reports that a woman connected to his relationship was suspected by US intelligence officials of having links to Chinese intelligence.
These allegations have not been established as proven facts.
⚠️ MYTH 2: NVIDIA IS ALREADY FACING CONFIRMED DATA THEFT
Fact: The investigation is designed to establish what actually happened.
NVIDIA's board has launched an independent investigation led by independent directors with support from outside legal counsel.
The company has stated that it currently has no reason to believe that national security or NVIDIA's confidential information was compromised.
This distinction matters. An investigation does not automatically mean that spying or information theft occurred.
📊 MYTH 3: HUANG HAS BEEN REMOVED AS CEO
Fact: He remains in charge during the investigation.
NVIDIA has indicated that Huang will continue leading the company without interruption. He has also promised to cooperate fully with the investigation and reaffirmed his commitment to protecting the company and supporting US national security.
Nevertheless, the situation raises important questions about executive responsibility, corporate security, and leadership accountability.
This story is a reminder that corporate leadership involves more than business performance. Trust, transparency, personal responsibility, and security matter too.
The real test for NVIDIA will be whether its independent investigation provides clear answers and protects the confidence of employees, customers, and investors.
Do you think NVIDIA can maintain investor confidence while this investigation continues?
292
#BinanceProcesses$4.65BWithdrawals
Binance Processes $4.65 Billion in Withdrawals: A Major Test of User Confidence
Binance has processed approximately $4.65 billion in customer withdrawals within the first nine and a half hours after reopening withdrawal services on November 1. The massive movement of funds comes after a reported $6.3 billion security incident that raised serious concerns across the crypto market.
$3.64 Billion in Net Outflows
During the reporting period, Binance processed:
$4.649 billion in withdrawals.
$1.01 billion in deposits.
Approximately $3.64 billion in net outflows.
The net outflow represents around 2.1% of Binance's reported $171 billion in total assets.
Withdrawals Gradually Stabilize
Binance restored withdrawals in phases, beginning at 06:00 UTC on November 1. By 12:36 UTC, withdrawals had resumed across all 15 networks and assets included in the initial phase, covering major cryptocurrencies such as BTC, ETH, BNB, SOL, XRP, USDT and USDC.
The exchange also reported that withdrawal activity had declined after its initial surge, while deposits remained substantial.
Security and Transparency Matter
Binance says it is replacing affected assets using its own resources and has covered approximately 95% of the impacted amount. The exchange is also preparing an updated Proof of Reserves report to provide users with a fresh view of its asset backing.
What Does This Mean for Crypto?
This situation highlights an important lesson for the entire cryptocurrency industry: security, transparency and access to customer funds are essential for maintaining trust.
Billions of dollars in withdrawals do not automatically mean an exchange is collapsing. However, users will closely monitor withdrawal services, reserve reports and the exchange's recovery progress.
The coming days will be important for Binance as it works to restore confidence and demonstrate the strength of its security systems.
For every crypto exchange, trust is built through transparency, strong security and consistent protection of user assets.
#BinanceProcesses$4.65BWithdrawals
Binance Processes $4.65 Billion in Withdrawals: A Major Test of User Confidence
Binance has processed approximately $4.65 billion in customer withdrawals within the first nine and a half hours after reopening withdrawal services on November 1. The massive movement of funds comes after a reported $6.3 billion security incident that raised serious concerns across the crypto market.
$3.64 Billion in Net Outflows
During the reporting period, Binance processed:
$4.649 billion in withdrawals.
$1.01 billion in deposits.
Approximately $3.64 billion in net outflows.
The net outflow represents around 2.1% of Binance's reported $171 billion in total assets.
Withdrawals Gradually Stabilize
Binance restored withdrawals in phases, beginning at 06:00 UTC on November 1. By 12:36 UTC, withdrawals had resumed across all 15 networks and assets included in the initial phase, covering major cryptocurrencies such as BTC, ETH, BNB, SOL, XRP, USDT and USDC.
The exchange also reported that withdrawal activity had declined after its initial surge, while deposits remained substantial.
Security and Transparency Matter
Binance says it is replacing affected assets using its own resources and has covered approximately 95% of the impacted amount. The exchange is also preparing an updated Proof of Reserves report to provide users with a fresh view of its asset backing.
What Does This Mean for Crypto?
This situation highlights an important lesson for the entire cryptocurrency industry: security, transparency and access to customer funds are essential for maintaining trust.
Billions of dollars in withdrawals do not automatically mean an exchange is collapsing. However, users will closely monitor withdrawal services, reserve reports and the exchange's recovery progress.
The coming days will be important for Binance as it works to restore confidence and demonstrate the strength of its security systems.
For every crypto exchange, trust is built through transparency, strong security and consistent protection of user assets.
Binance Processes $4.65 Billion in Withdrawals: A Major Test of User Confidence
Binance has processed approximately $4.65 billion in customer withdrawals within the first nine and a half hours after reopening withdrawal services on November 1. The massive movement of funds comes after a reported $6.3 billion security incident that raised serious concerns across the crypto market.
$3.64 Billion in Net Outflows
During the reporting period, Binance processed:
$4.649 billion in withdrawals.
$1.01 billion in deposits.
Approximately $3.64 billion in net outflows.
The net outflow represents around 2.1% of Binance's reported $171 billion in total assets.
Withdrawals Gradually Stabilize
Binance restored withdrawals in phases, beginning at 06:00 UTC on November 1. By 12:36 UTC, withdrawals had resumed across all 15 networks and assets included in the initial phase, covering major cryptocurrencies such as BTC, ETH, BNB, SOL, XRP, USDT and USDC.
The exchange also reported that withdrawal activity had declined after its initial surge, while deposits remained substantial.
Security and Transparency Matter
Binance says it is replacing affected assets using its own resources and has covered approximately 95% of the impacted amount. The exchange is also preparing an updated Proof of Reserves report to provide users with a fresh view of its asset backing.
What Does This Mean for Crypto?
This situation highlights an important lesson for the entire cryptocurrency industry: security, transparency and access to customer funds are essential for maintaining trust.
Billions of dollars in withdrawals do not automatically mean an exchange is collapsing. However, users will closely monitor withdrawal services, reserve reports and the exchange's recovery progress.
The coming days will be important for Binance as it works to restore confidence and demonstrate the strength of its security systems.
For every crypto exchange, trust is built through transparency, strong security and consistent protection of user assets.
1
81
$1.5 Billion Liquidated: When Market Confidence Turns Into a Leverage Trap
THE MYTH
Many traders believe that when the crypto market drops sharply, only investors who bought at the wrong time lose money. But the reality is much bigger. A sudden market decline can force thousands of leveraged positions to close automatically, creating even more pressure across the entire market.
That is exactly what happened on October 30, 2026, when approximately $1.53 billion in leveraged crypto positions were liquidated within 24 hours.
THE DAMAGE
The numbers reveal how heavily the market was positioned for higher prices.
Approximately $1.29 billion came from long positions, representing around 83.8% of all liquidations. Long positions are trades that expect cryptocurrency prices to rise.
More than 240,000 traders were affected, showing how quickly market volatility can impact participants across multiple trading platforms.
Bitcoin accounted for approximately $499 million in liquidations, while Ethereum contributed another $358 million. Solana, XRP and Dogecoin also experienced significant forced closures.
THE ADVANTAGE
Although liquidations create serious losses for affected traders, they can also change the market structure.
When excessive leverage disappears, the market may become less crowded with highly risky positions. This can reduce some of the pressure created by traders using borrowed funds.
Another important development was the movement in both directions. After the initial decline, prices started recovering, putting traders who were betting on further falls under pressure.
This demonstrates that liquidation events do not automatically mean the market will continue moving in one direction.
THE BIGGEST RISK
The problem is how leverage works.
Imagine a trader opens a $10,000 position using only $1,000 of their own capital. A relatively small move against that position can create a major loss compared with the original capital.
$1.5 Billion Liquidated: When Market Confidence Turns Into a Leverage Trap
THE MYTH
Many traders believe that when the crypto market drops sharply, only investors who bought at the wrong time lose money. But the reality is much bigger. A sudden market decline can force thousands of leveraged positions to close automatically, creating even more pressure across the entire market.
That is exactly what happened on October 30, 2026, when approximately $1.53 billion in leveraged crypto positions were liquidated within 24 hours.
THE DAMAGE
The numbers reveal how heavily the market was positioned for higher prices.
Approximately $1.29 billion came from long positions, representing around 83.8% of all liquidations. Long positions are trades that expect cryptocurrency prices to rise.
More than 240,000 traders were affected, showing how quickly market volatility can impact participants across multiple trading platforms.
Bitcoin accounted for approximately $499 million in liquidations, while Ethereum contributed another $358 million. Solana, XRP and Dogecoin also experienced significant forced closures.
THE ADVANTAGE
Although liquidations create serious losses for affected traders, they can also change the market structure.
When excessive leverage disappears, the market may become less crowded with highly risky positions. This can reduce some of the pressure created by traders using borrowed funds.
Another important development was the movement in both directions. After the initial decline, prices started recovering, putting traders who were betting on further falls under pressure.
This demonstrates that liquidation events do not automatically mean the market will continue moving in one direction.
THE BIGGEST RISK
The problem is how leverage works.
Imagine a trader opens a $10,000 position using only $1,000 of their own capital. A relatively small move against that position can create a major loss compared with the original capital.
THE MYTH
Many traders believe that when the crypto market drops sharply, only investors who bought at the wrong time lose money. But the reality is much bigger. A sudden market decline can force thousands of leveraged positions to close automatically, creating even more pressure across the entire market.
That is exactly what happened on October 30, 2026, when approximately $1.53 billion in leveraged crypto positions were liquidated within 24 hours.
THE DAMAGE
The numbers reveal how heavily the market was positioned for higher prices.
Approximately $1.29 billion came from long positions, representing around 83.8% of all liquidations. Long positions are trades that expect cryptocurrency prices to rise.
More than 240,000 traders were affected, showing how quickly market volatility can impact participants across multiple trading platforms.
Bitcoin accounted for approximately $499 million in liquidations, while Ethereum contributed another $358 million. Solana, XRP and Dogecoin also experienced significant forced closures.
THE ADVANTAGE
Although liquidations create serious losses for affected traders, they can also change the market structure.
When excessive leverage disappears, the market may become less crowded with highly risky positions. This can reduce some of the pressure created by traders using borrowed funds.
Another important development was the movement in both directions. After the initial decline, prices started recovering, putting traders who were betting on further falls under pressure.
This demonstrates that liquidation events do not automatically mean the market will continue moving in one direction.
THE BIGGEST RISK
The problem is how leverage works.
Imagine a trader opens a $10,000 position using only $1,000 of their own capital. A relatively small move against that position can create a major loss compared with the original capital.

1
142
FedWatch: The Market Is Not Expecting What You Think
MYTH: FedWatch Predicts the Federal Reserve's Next Decision
Many people look at FedWatch and assume it tells them exactly what the Federal Reserve will do at its next meeting. That is not true.
FACT: FedWatch Measures Market Expectations
FedWatch is a tool that estimates the probability of future Federal Reserve interest rate decisions. It uses prices from 30-day federal funds futures contracts to calculate what interest rate traders are expecting.
In simple words, it shows whether market participants think the Fed is more likely to raise rates, cut rates, or keep them unchanged.
But there is one important difference: market expectations are not official Fed decisions.
MYTH: A High Probability Means the Decision Is Guaranteed
Imagine FedWatch shows an 80% probability of an interest rate cut. Does that mean the Fed must cut rates?
Absolutely not.
An 80% probability represents market pricing, not a promise. The remaining possibility still matters, and expectations can change quickly when new economic information becomes available.
A probability of 80% does not mean the Fed has already made its decision.
FACT: Economic Data Can Change Everything
Interest rate expectations are closely connected to the health of the US economy.
There are several important factors that market participants watch:
Inflation: If prices continue rising too quickly, the Fed may keep rates higher or consider further increases.
Employment: A strong labour market can give policymakers more room to maintain tighter monetary policy.
Economic growth: Strong growth can support higher rates, while weakening activity may increase the case for cuts.
Consumer spending: Changes in household spending can provide clues about future inflation and economic demand.
Financial conditions: Borrowing costs, credit availability and broader financial stability also influence policy decisions.
This is why FedWatch probabilities can change after important economic reports, even when the next Fed meeting is still weeks away.
FedWatch: The Market Is Not Expecting What You Think
MYTH: FedWatch Predicts the Federal Reserve's Next Decision
Many people look at FedWatch and assume it tells them exactly what the Federal Reserve will do at its next meeting. That is not true.
FACT: FedWatch Measures Market Expectations
FedWatch is a tool that estimates the probability of future Federal Reserve interest rate decisions. It uses prices from 30-day federal funds futures contracts to calculate what interest rate traders are expecting.
In simple words, it shows whether market participants think the Fed is more likely to raise rates, cut rates, or keep them unchanged.
But there is one important difference: market expectations are not official Fed decisions.
MYTH: A High Probability Means the Decision Is Guaranteed
Imagine FedWatch shows an 80% probability of an interest rate cut. Does that mean the Fed must cut rates?
Absolutely not.
An 80% probability represents market pricing, not a promise. The remaining possibility still matters, and expectations can change quickly when new economic information becomes available.
A probability of 80% does not mean the Fed has already made its decision.
FACT: Economic Data Can Change Everything
Interest rate expectations are closely connected to the health of the US economy.
There are several important factors that market participants watch:
Inflation: If prices continue rising too quickly, the Fed may keep rates higher or consider further increases.
Employment: A strong labour market can give policymakers more room to maintain tighter monetary policy.
Economic growth: Strong growth can support higher rates, while weakening activity may increase the case for cuts.
Consumer spending: Changes in household spending can provide clues about future inflation and economic demand.
Financial conditions: Borrowing costs, credit availability and broader financial stability also influence policy decisions.
This is why FedWatch probabilities can change after important economic reports, even when the next Fed meeting is still weeks away.
MYTH: FedWatch Predicts the Federal Reserve's Next Decision
Many people look at FedWatch and assume it tells them exactly what the Federal Reserve will do at its next meeting. That is not true.
FACT: FedWatch Measures Market Expectations
FedWatch is a tool that estimates the probability of future Federal Reserve interest rate decisions. It uses prices from 30-day federal funds futures contracts to calculate what interest rate traders are expecting.
In simple words, it shows whether market participants think the Fed is more likely to raise rates, cut rates, or keep them unchanged.
But there is one important difference: market expectations are not official Fed decisions.
MYTH: A High Probability Means the Decision Is Guaranteed
Imagine FedWatch shows an 80% probability of an interest rate cut. Does that mean the Fed must cut rates?
Absolutely not.
An 80% probability represents market pricing, not a promise. The remaining possibility still matters, and expectations can change quickly when new economic information becomes available.
A probability of 80% does not mean the Fed has already made its decision.
FACT: Economic Data Can Change Everything
Interest rate expectations are closely connected to the health of the US economy.
There are several important factors that market participants watch:
Inflation: If prices continue rising too quickly, the Fed may keep rates higher or consider further increases.
Employment: A strong labour market can give policymakers more room to maintain tighter monetary policy.
Economic growth: Strong growth can support higher rates, while weakening activity may increase the case for cuts.
Consumer spending: Changes in household spending can provide clues about future inflation and economic demand.
Financial conditions: Borrowing costs, credit availability and broader financial stability also influence policy decisions.
This is why FedWatch probabilities can change after important economic reports, even when the next Fed meeting is still weeks away.
69
Войдите, чтобы посмотреть больше материала
Присоединяйтесь к пользователям криптовалют по всему миру на Binance Square
⚡️ Получайте новейшую и полезную информацию о криптоактивах.
💬 Нам доверяет крупнейшая в мире криптобиржа.
👍 Получите достоверные аналитические данные от верифицированных создателей контента.
Эл. почта/номер телефона
В тренде
CPITestsDecemberRateOutlook
Просмотров: 740,421
3,606 обсуждают
October CPI Seen Up 0.3%, Keeping Fed on Course for December Rate Increase
Binance News
·Лайков: 8
·Просмотров: 10.2k
AnthropicRejectsIPODelayValuationinQuestion
Просмотров: 81,201
758 обсуждают
NvidiaInvestigatesAfterHuang’sAffairApology
Просмотров: 299,360
2,319 обсуждают