Market Structure: Higher Highs, Lower Lows & Trend Changes Explained 📊
Before using indicators, one of the most useful skills in technical analysis is learning to read market structure.
Market structure helps us understand how price is developing over time.
📈 Higher Highs + Higher Lows
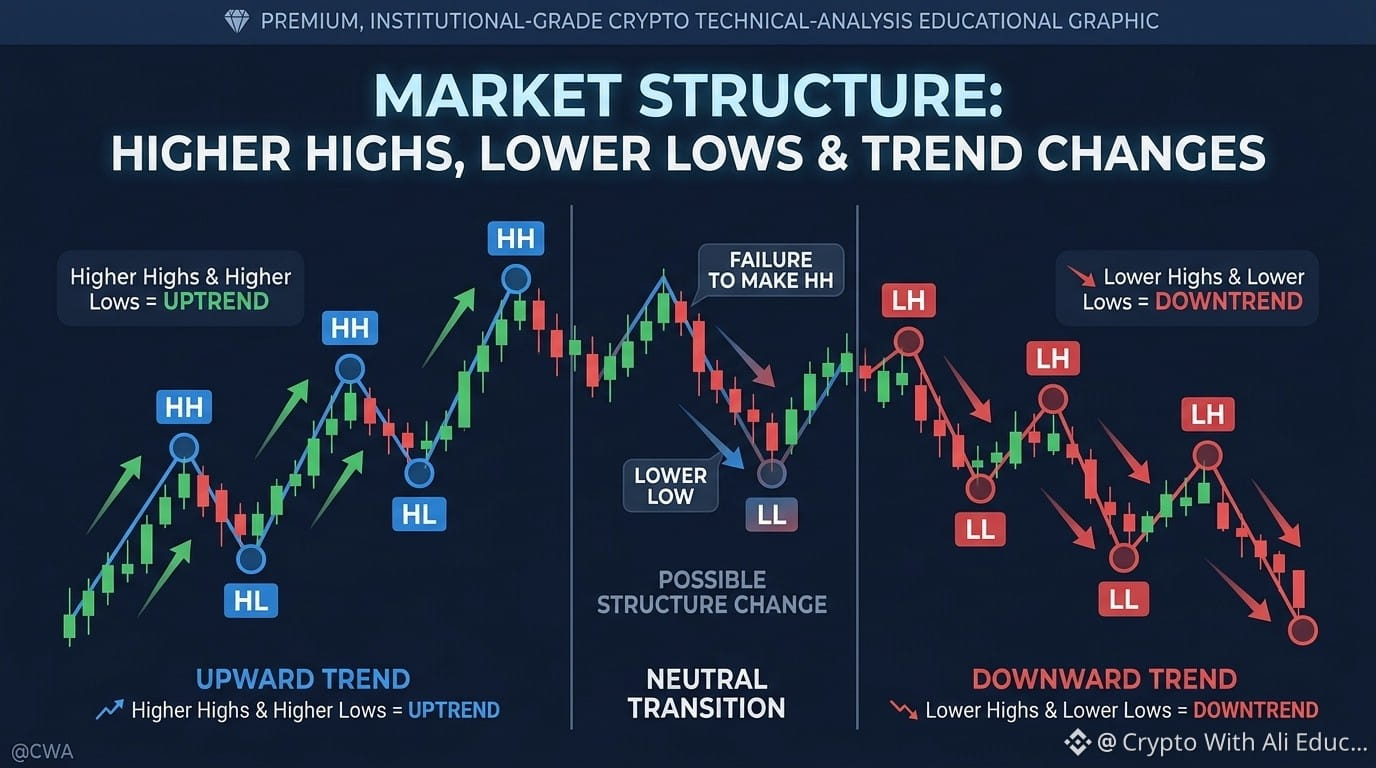
When price consistently creates higher highs and higher lows, it can indicate an upward market structure.
The important point is not one green candle. It is the sequence of price swings.
📉 Lower Highs + Lower Lows
When price creates lower highs and lower lows, it can indicate a downward market structure.
Again, one red candle does not define a trend. The broader sequence matters.
🔄 What About a Trend Change?
A possible trend change becomes more interesting when the existing structure is disrupted.
For example, if a market has been creating lower highs and lower lows, a meaningful break in that sequence may signal that conditions are changing.
But a single breakout does not automatically confirm a new trend.
📊 Where Does Volume Fit?
Volume can provide additional context.
A structural move accompanied by stronger participation may tell us something different from a move occurring on weak volume.
That's why market structure and volume are often better considered together rather than separately.
🧠 Beginner takeaway
Don't focus only on individual candles.
Ask:
What sequence is price creating?
Higher highs?
Higher lows?
Lower highs?
Lower lows?
Understanding that sequence is one of the foundations of technical analysis.
📚 Follow Crypto With Ali for daily market-structure education, technical-analysis concepts, and Web3 insights.
Educational content only. Not financial advice.
Sharing what I learn in crypto every day — follow along
#Marketstructure #TechnicalAnalysis #cryptoeducation #bitcoin #priceaction
Before using indicators, one of the most useful skills in technical analysis is learning to read market structure.
Market structure helps us understand how price is developing over time.
📈 Higher Highs + Higher Lows
When price consistently creates higher highs and higher lows, it can indicate an upward market structure.
The important point is not one green candle. It is the sequence of price swings.
📉 Lower Highs + Lower Lows
When price creates lower highs and lower lows, it can indicate a downward market structure.
Again, one red candle does not define a trend. The broader sequence matters.
🔄 What About a Trend Change?
A possible trend change becomes more interesting when the existing structure is disrupted.
For example, if a market has been creating lower highs and lower lows, a meaningful break in that sequence may signal that conditions are changing.
But a single breakout does not automatically confirm a new trend.
📊 Where Does Volume Fit?
Volume can provide additional context.
A structural move accompanied by stronger participation may tell us something different from a move occurring on weak volume.
That's why market structure and volume are often better considered together rather than separately.
🧠 Beginner takeaway
Don't focus only on individual candles.
Ask:
What sequence is price creating?
Higher highs?
Higher lows?
Lower highs?
Lower lows?
Understanding that sequence is one of the foundations of technical analysis.
📚 Follow Crypto With Ali for daily market-structure education, technical-analysis concepts, and Web3 insights.
Educational content only. Not financial advice.
Sharing what I learn in crypto every day — follow along
#Marketstructure #TechnicalAnalysis #cryptoeducation #bitcoin #priceaction