
#robinhoodchain
robinhoodchain
Просмотров: 74,603
927 обсуждают
Популярные
Новые

·
--
Статья
Leverage, Perpetuals, and Basis: Who Pays for LeverageIf you want to go long stocks with leverage on Robinhood Chain, or stand on the other side and collect what leverage costs, this chapter compares the three ways to lever up on this chain and works out how much the basis trade of "hold the token, short the perpetual" actually earns.
The Same Leverage, at Very Different Prices
Suppose you like Nvidia, have $10,000, and want to hold $20,000 of NVDA exposure at 2x leverage. On Robinhood Chain you have three routes:
Open an NVDA perpetual long on Lighter. Over the last 30 days, longs paid funding at an annualized rate of about 7.3% for this.Post NVDA stock tokens on Morpho, borrow USDG, and buy more. In the market that lends USDG against NVDA, the borrowing rate in early November was about 23.5%.Buy an Arcus fixed-leverage token. Arcus packages perpetual positions as ERC-20 tokens (pTokens), offered in 1x and 3x long and short versions. The cost is the perpetual's funding plus rebalancing drag.
For the same leverage, the second route costs more than three times the first. On AAPL, SPCX, and GOOGL, lending-market rates run between 21% and 29%, while funding on the matching perpetuals runs between 2.5% and 12%.
The reason is not hard to see. Morpho markets that take stock tokens as collateral are all small ($200,000 to $700,000 each), with few lenders and utilization stuck at 85–91%, which pushes the rate curve high. Lighter's perpetual markets have $188 million of open interest and market makers quoting, and the price of leverage is set by supply and demand between longs and shorts.
On this chain, the price of leverage is fragmented. The same exposure costs several times more in one venue than another. That is both a cost trap and an opportunity: a trap for borrowers, and an opportunity for anyone willing to lend dollars in the small markets (the 18–26% deposit rates mentioned in Chapter 4).
The Fundamentals of the Perpetual Market
Lighter runs a separate instance on Robinhood Chain (accounts, balances, and liquidity are not shared with Lighter's main network), and perpetual trades in Robinhood Wallet are routed here. Readings on November 2:
63 perpetual markets, about $616 million in 24-hour volume, and about $188 million in open interest.The top three by volume were the SPY perpetual ($84.9 million), BTC ($75.8 million), and the QQQ perpetual ($67 million).The largest open interest was in SPY (about $36 million) and QQQ (about $26.3 million).Maker and taker fees were both zero.Initial margin: 2% for SPY, QQQ, and BTC (up to 50x); 5% for NVDA, AAPL, and GOOGL (20x); 20% for pre-IPO companies such as ANTHROPIC and OPENAI (5x).Funding is settled every hour, including on weekends.
These numbers say one thing: the most active stock trading on this chain is not in stock tokens but in stock perpetuals. One day of SPY perpetual volume (about $84.9 million) is 3–4 times the combined daily volume of the main SPY spot-token pools (about $23 million). The depth measurements in Chapter 3 point the same way: taking $100,000 of SPY perpetual costs less than 1 basis point.
Funding: Longs Pay Almost Every Hour
Perpetual contracts use funding to pull the contract price toward the spot index. When funding is positive, longs pay shorts; when negative, shorts pay longs. We pulled every hourly funding payment in 15 major markets from June 30 to November 2 (about 3,000 hours per market).
SPY: Full period, annualized: 4.5%; July: 3.5%; August: 3.5%; September: 5.2%; October: 5.7%; Share of hours longs paid: 99%QQQ: Full period, annualized: 5.4%; July: 3.6%; August: 4.7%; September: 5.8%; October: 7.6%; Share of hours longs paid: 99%NVDA: Full period, annualized: 5.8%; July: 3.6%; August: 4.5%; September: 7.8%; October: 7.5%; Share of hours longs paid: 99%GOOGL: Full period, annualized: 6.5%; July: 3.4%; August: 5.2%; September: 4.9%; October: 12.2%; Share of hours longs paid: 99%TSLA: Full period, annualized: 4.9%; July: 4.0%; August: 5.1%; September: 3.5%; October: 7.2%; Share of hours longs paid: 99%AAPL: Full period, annualized: 3.4%; July: 3.4%; August: 4.2%; September: 3.5%; October: 2.7%; Share of hours longs paid: 96%MSFT: Full period, annualized: 3.9%; July: 3.6%; August: 3.7%; September: 3.5%; October: 5.0%; Share of hours longs paid: 100%BTC: Full period, annualized: 8.8%; July: 10.5%; August: 9.1%; September: 8.3%; October: 7.1%; Share of hours longs paid: 94%
Three features stand out:
The floor is about 3.5%. In most markets, funding rarely falls below an annualized 3.5% (0.0004% an hour), which works like a built-in interest-rate floor. This matches Chapter 4's conclusion that the "unsubsidized dollar rate" on this chain is about 3.5–4%.Longs almost never get paid. Longs on stock perpetuals paid in 96–100% of hours. Stock traders on this chain are almost uniformly on the long side.October rose clearly. Funding on QQQ, NVDA, GOOGL, and TSLA rose to 7–12% in October, showing that demand to go long was growing faster than money willing to go short.
Based on early-November open interest and last-30-day rates, longs in the top 15 markets pay shorts about $9 million a year.
The Basis Trade: Standing on the Other Side of Leverage
Since longs keep paying, a natural strategy is to stand with the shorts and collect, while hedging price risk with spot:
Basis trade = hold the stock token (long) + short an equal amount of the perpetual (short)
Price moves cancel out across the two legs, and what you earn is funding. Broken down with the yield equation (Chapter 4):
Funding income (collected by shorts): ~+5.7%Token dividends (multiplier, after ~31% deduction): ~+0.7%Perpetual dividend adjustment: 0 (the perpetual price falls with the index ex-dividend; shorts do not pay dividends)Capital used: Full token value + perpetual margin (keep 10–20%)Round-trip cost: ~20–30 bp (token buy and sell + bridge)
On total capital (100% for the token + 15% margin), the annual return is about (5.7% + 0.7%) ÷ 1.15 ≈ 5.6%. After round-trip costs, a one-year hold yields about 5.3%.
Compared with other dollar yields:
It is 1–1.5 percentage points above Spark Savings (3.8%) and the Steakhouse vault's base interest (about 4.1%).It is below the roughly 7.2% that Robinhood Earn users get.Its return comes entirely from the market (longs' demand for leverage), with no subsidy.
It is one of the few "unsubsidized, above-benchmark" strategies this book has found. The price is that it is far more complex than a deposit, and its risks are more varied:
Risk 1: Funding reverses. Funding is set by the market and can turn negative. SPY funding was only 3.5% in July. If demand to go long fades, the return falls back toward the benchmark; in an extreme case, shorts have to pay.
Risk 2: Weekend mismatch. Perpetuals trade 24/7 and funding settles on weekends as usual, and how the index price is computed on weekends depends on Lighter's rules. Meanwhile stock tokens carry a weekend premium (Chapter 6). If you open or close on a weekend, the two legs may not be priced in step.
Risk 3: Margin and liquidation. The short leg loses money when the underlying rallies hard and needs more margin. The gains on the token leg sit elsewhere on the chain and do not offset automatically. With too little margin, a single big up day can liquidate the short, and the hedge breaks on the spot.
Risk 4: Spot depth. Buying $100,000 of the SPY spot token costs about 29 bp (Chapter 3), and $1 million basically cannot be filled. The ceiling on this strategy's size is set by the depth of the spot token, not the perpetual.
Risk 5: Contract permissions. Stock-token transfers can be paused, and an administrator can burn a holder's position (Chapter 11). In regions where the terms do not allow holding stock tokens, this leg cannot be done at all.
Perpetuals on Pre-IPO Companies
Lighter has two unusual markets: ANTHROPIC and OPENAI perpetuals. Their underlyings are companies that have not gone public; prices come from secondary-market valuations or from the market's own pricing.
The ANTHROPIC perpetual traded about $33 million in 24 hours with about $5.7 million of open interest; the OPENAI perpetual traded about $28.5 million with about $6.6 million of open interest.Initial margin is 20%, for a maximum of 5x leverage.Funding on ANTHROPIC swings far more than on stock perpetuals: as high as 0.21% and as low as −0.34% in a single hour. It was negative for all of July (longs got paid) and rose to an annualized 15.6% in August.
These markets give investors a tool they have never had: a way to take a view on the valuation of leading private companies outside the primary market. Their risks are just as new. The underlying has no public, continuous price, and how the index is set and when it is adjusted depend more on platform rules than with listed stocks. Treat it as a way to express a view on valuation, not as an investment in the company.
Other Forms of Leverage
These are still small, but the names are worth knowing:
Arcus perpetuals: another perpetual venue on the chain, with about $65.7 million in TVL and about $2.67 billion of volume over the last 30 days. Robinhood Wallet connected to Arcus's request-for-quote system in October.Arcus pTokens: fixed-leverage tokens that package a perpetual account as an ERC-20 (1x and 3x, long and short), with funding and rebalancing costs reflected in net asset value. Stock tokens such as SPY and QQQ can be used as margin at 50% LTV.Maturity-dated tokens: such as the pare protocol's pPFE-DEC27 (DefiLlama shows an annualized yield of about 6.95%). They hold only tens of thousands of dollars, and you need to read the contract to judge the mechanism.Morpho lending markets for stock tokens: lenders earn 18–26% a year, in markets of $200,000 to $700,000, where your deposit itself pushes the rate down.
If You Want to Use Leverage on This Chain
To go long with leverage, use perpetuals, not lending markets. For the same exposure, perpetuals cost one-third to one-tenth as much as Morpho's stock-collateral markets, with an order of magnitude more depth.Watch the direction and level of funding. Longs on stock perpetuals pay almost every hour, at 5–12% annualized in October. Over a year, that can eat more than half of the stock's gain.If you want to collect what leverage costs, the basis trade is a candidate, but manage it as a strategy, not as a deposit. Keep ample margin, avoid opening and closing on weekends, and keep size within what the spot token can absorb.Size pre-IPO perpetuals as an expression of a view. There is no public, continuous price to anchor them, and hourly funding can swing within ±0.3%.
Stock traders on this chain are almost all long and willing to keep paying for leverage. Standing on the other side and collecting is one of the few returns on this chain that does not rely on subsidies.
Sources for This Chapter
Lighter Robinhood instance API: orderBookDetails (volume, open interest, fees, and margin ratios for 63 perpetual markets, November 2, 2026); fundings (hourly funding for 15 markets, June 30 to November 2, 2026). The funding rate field is a percentage per hour, verified against the value field (funding amount per unit = price × rate%)Lighter documentation, "Lighter on Robinhood Chain": separate instance, contract address 0x94bA…ff9d, chain IDRobinhood Help Center, "Robinhood Wallet perpetual futures": funding settled hourly and paid peer to peer between longs and shortsMorpho GraphQL API: borrowing rates and size of the markets lending USDG against stock tokens (October 29 / November 2, 2026)Arcus pTokens: Arcus launch post and the ArcusGuide summary (fixed leverage, 1x and 3x, stock tokens as margin at 50% LTV)DefiLlama: Arcus Perps TVL and 30-day volume; pare protocol yield poolsRobinhood Goes Onchain, Chapter 10: Robinhood Wallet connected to the Arcus request-for-quote system on October 1, 2026
—
This is Chapter 8 of 14 from my new book Where the Yield Comes From, serialized one chapter a day. For research only; not investment advice.
Author: Blue Lotus
#DeFi #RobinhoodChain #Stablecoins #RWA
Leverage, Perpetuals, and Basis: Who Pays for Leverage
If you want to go long stocks with leverage on Robinhood Chain, or stand on the other side and collect what leverage costs, this chapter compares the three ways to lever up on this chain and works out how much the basis trade of "hold the token, short the perpetual" actually earns.
The Same Leverage, at Very Different Prices
Suppose you like Nvidia, have $10,000, and want to hold $20,000 of NVDA exposure at 2x leverage. On Robinhood Chain you have three routes:
Open an NVDA perpetual long on Lighter. Over the last 30 days, longs paid funding at an annualized rate of about 7.3% for this.Post NVDA stock tokens on Morpho, borrow USDG, and buy more. In the market that lends USDG against NVDA, the borrowing rate in early November was about 23.5%.Buy an Arcus fixed-leverage token. Arcus packages perpetual positions as ERC-20 tokens (pTokens), offered in 1x and 3x long and short versions. The cost is the perpetual's funding plus rebalancing drag.
For the same leverage, the second route costs more than three times the first. On AAPL, SPCX, and GOOGL, lending-market rates run between 21% and 29%, while funding on the matching perpetuals runs between 2.5% and 12%.
The reason is not hard to see. Morpho markets that take stock tokens as collateral are all small ($200,000 to $700,000 each), with few lenders and utilization stuck at 85–91%, which pushes the rate curve high. Lighter's perpetual markets have $188 million of open interest and market makers quoting, and the price of leverage is set by supply and demand between longs and shorts.
On this chain, the price of leverage is fragmented. The same exposure costs several times more in one venue than another. That is both a cost trap and an opportunity: a trap for borrowers, and an opportunity for anyone willing to lend dollars in the small markets (the 18–26% deposit rates mentioned in Chapter 4).
The Fundamentals of the Perpetual Market
Lighter runs a separate instance on Robinhood Chain (accounts, balances, and liquidity are not shared with Lighter's main network), and perpetual trades in Robinhood Wallet are routed here. Readings on November 2:
63 perpetual markets, about $616 million in 24-hour volume, and about $188 million in open interest.The top three by volume were the SPY perpetual ($84.9 million), BTC ($75.8 million), and the QQQ perpetual ($67 million).The largest open interest was in SPY (about $36 million) and QQQ (about $26.3 million).Maker and taker fees were both zero.Initial margin: 2% for SPY, QQQ, and BTC (up to 50x); 5% for NVDA, AAPL, and GOOGL (20x); 20% for pre-IPO companies such as ANTHROPIC and OPENAI (5x).Funding is settled every hour, including on weekends.
These numbers say one thing: the most active stock trading on this chain is not in stock tokens but in stock perpetuals. One day of SPY perpetual volume (about $84.9 million) is 3–4 times the combined daily volume of the main SPY spot-token pools (about $23 million). The depth measurements in Chapter 3 point the same way: taking $100,000 of SPY perpetual costs less than 1 basis point.
Funding: Longs Pay Almost Every Hour
Perpetual contracts use funding to pull the contract price toward the spot index. When funding is positive, longs pay shorts; when negative, shorts pay longs. We pulled every hourly funding payment in 15 major markets from June 30 to November 2 (about 3,000 hours per market).
SPY: Full period, annualized: 4.5%; July: 3.5%; August: 3.5%; September: 5.2%; October: 5.7%; Share of hours longs paid: 99%QQQ: Full period, annualized: 5.4%; July: 3.6%; August: 4.7%; September: 5.8%; October: 7.6%; Share of hours longs paid: 99%NVDA: Full period, annualized: 5.8%; July: 3.6%; August: 4.5%; September: 7.8%; October: 7.5%; Share of hours longs paid: 99%GOOGL: Full period, annualized: 6.5%; July: 3.4%; August: 5.2%; September: 4.9%; October: 12.2%; Share of hours longs paid: 99%TSLA: Full period, annualized: 4.9%; July: 4.0%; August: 5.1%; September: 3.5%; October: 7.2%; Share of hours longs paid: 99%AAPL: Full period, annualized: 3.4%; July: 3.4%; August: 4.2%; September: 3.5%; October: 2.7%; Share of hours longs paid: 96%MSFT: Full period, annualized: 3.9%; July: 3.6%; August: 3.7%; September: 3.5%; October: 5.0%; Share of hours longs paid: 100%BTC: Full period, annualized: 8.8%; July: 10.5%; August: 9.1%; September: 8.3%; October: 7.1%; Share of hours longs paid: 94%
Three features stand out:
The floor is about 3.5%. In most markets, funding rarely falls below an annualized 3.5% (0.0004% an hour), which works like a built-in interest-rate floor. This matches Chapter 4's conclusion that the "unsubsidized dollar rate" on this chain is about 3.5–4%.Longs almost never get paid. Longs on stock perpetuals paid in 96–100% of hours. Stock traders on this chain are almost uniformly on the long side.October rose clearly. Funding on QQQ, NVDA, GOOGL, and TSLA rose to 7–12% in October, showing that demand to go long was growing faster than money willing to go short.
Based on early-November open interest and last-30-day rates, longs in the top 15 markets pay shorts about $9 million a year.
The Basis Trade: Standing on the Other Side of Leverage
Since longs keep paying, a natural strategy is to stand with the shorts and collect, while hedging price risk with spot:
Basis trade = hold the stock token (long) + short an equal amount of the perpetual (short)
Price moves cancel out across the two legs, and what you earn is funding. Broken down with the yield equation (Chapter 4):
Funding income (collected by shorts): ~+5.7%Token dividends (multiplier, after ~31% deduction): ~+0.7%Perpetual dividend adjustment: 0 (the perpetual price falls with the index ex-dividend; shorts do not pay dividends)Capital used: Full token value + perpetual margin (keep 10–20%)Round-trip cost: ~20–30 bp (token buy and sell + bridge)
On total capital (100% for the token + 15% margin), the annual return is about (5.7% + 0.7%) ÷ 1.15 ≈ 5.6%. After round-trip costs, a one-year hold yields about 5.3%.
Compared with other dollar yields:
It is 1–1.5 percentage points above Spark Savings (3.8%) and the Steakhouse vault's base interest (about 4.1%).It is below the roughly 7.2% that Robinhood Earn users get.Its return comes entirely from the market (longs' demand for leverage), with no subsidy.
It is one of the few "unsubsidized, above-benchmark" strategies this book has found. The price is that it is far more complex than a deposit, and its risks are more varied:
Risk 1: Funding reverses. Funding is set by the market and can turn negative. SPY funding was only 3.5% in July. If demand to go long fades, the return falls back toward the benchmark; in an extreme case, shorts have to pay.
Risk 2: Weekend mismatch. Perpetuals trade 24/7 and funding settles on weekends as usual, and how the index price is computed on weekends depends on Lighter's rules. Meanwhile stock tokens carry a weekend premium (Chapter 6). If you open or close on a weekend, the two legs may not be priced in step.
Risk 3: Margin and liquidation. The short leg loses money when the underlying rallies hard and needs more margin. The gains on the token leg sit elsewhere on the chain and do not offset automatically. With too little margin, a single big up day can liquidate the short, and the hedge breaks on the spot.
Risk 4: Spot depth. Buying $100,000 of the SPY spot token costs about 29 bp (Chapter 3), and $1 million basically cannot be filled. The ceiling on this strategy's size is set by the depth of the spot token, not the perpetual.
Risk 5: Contract permissions. Stock-token transfers can be paused, and an administrator can burn a holder's position (Chapter 11). In regions where the terms do not allow holding stock tokens, this leg cannot be done at all.
Perpetuals on Pre-IPO Companies
Lighter has two unusual markets: ANTHROPIC and OPENAI perpetuals. Their underlyings are companies that have not gone public; prices come from secondary-market valuations or from the market's own pricing.
The ANTHROPIC perpetual traded about $33 million in 24 hours with about $5.7 million of open interest; the OPENAI perpetual traded about $28.5 million with about $6.6 million of open interest.Initial margin is 20%, for a maximum of 5x leverage.Funding on ANTHROPIC swings far more than on stock perpetuals: as high as 0.21% and as low as −0.34% in a single hour. It was negative for all of July (longs got paid) and rose to an annualized 15.6% in August.
These markets give investors a tool they have never had: a way to take a view on the valuation of leading private companies outside the primary market. Their risks are just as new. The underlying has no public, continuous price, and how the index is set and when it is adjusted depend more on platform rules than with listed stocks. Treat it as a way to express a view on valuation, not as an investment in the company.
Other Forms of Leverage
These are still small, but the names are worth knowing:
Arcus perpetuals: another perpetual venue on the chain, with about $65.7 million in TVL and about $2.67 billion of volume over the last 30 days. Robinhood Wallet connected to Arcus's request-for-quote system in October.Arcus pTokens: fixed-leverage tokens that package a perpetual account as an ERC-20 (1x and 3x, long and short), with funding and rebalancing costs reflected in net asset value. Stock tokens such as SPY and QQQ can be used as margin at 50% LTV.Maturity-dated tokens: such as the pare protocol's pPFE-DEC27 (DefiLlama shows an annualized yield of about 6.95%). They hold only tens of thousands of dollars, and you need to read the contract to judge the mechanism.Morpho lending markets for stock tokens: lenders earn 18–26% a year, in markets of $200,000 to $700,000, where your deposit itself pushes the rate down.
If You Want to Use Leverage on This Chain
To go long with leverage, use perpetuals, not lending markets. For the same exposure, perpetuals cost one-third to one-tenth as much as Morpho's stock-collateral markets, with an order of magnitude more depth.Watch the direction and level of funding. Longs on stock perpetuals pay almost every hour, at 5–12% annualized in October. Over a year, that can eat more than half of the stock's gain.If you want to collect what leverage costs, the basis trade is a candidate, but manage it as a strategy, not as a deposit. Keep ample margin, avoid opening and closing on weekends, and keep size within what the spot token can absorb.Size pre-IPO perpetuals as an expression of a view. There is no public, continuous price to anchor them, and hourly funding can swing within ±0.3%.
Stock traders on this chain are almost all long and willing to keep paying for leverage. Standing on the other side and collecting is one of the few returns on this chain that does not rely on subsidies.
Sources for This Chapter
Lighter Robinhood instance API: orderBookDetails (volume, open interest, fees, and margin ratios for 63 perpetual markets, November 2, 2026); fundings (hourly funding for 15 markets, June 30 to November 2, 2026). The funding rate field is a percentage per hour, verified against the value field (funding amount per unit = price × rate%)Lighter documentation, "Lighter on Robinhood Chain": separate instance, contract address 0x94bA…ff9d, chain IDRobinhood Help Center, "Robinhood Wallet perpetual futures": funding settled hourly and paid peer to peer between longs and shortsMorpho GraphQL API: borrowing rates and size of the markets lending USDG against stock tokens (October 29 / November 2, 2026)Arcus pTokens: Arcus launch post and the ArcusGuide summary (fixed leverage, 1x and 3x, stock tokens as margin at 50% LTV)DefiLlama: Arcus Perps TVL and 30-day volume; pare protocol yield poolsRobinhood Goes Onchain, Chapter 10: Robinhood Wallet connected to the Arcus request-for-quote system on October 1, 2026
—
This is Chapter 8 of 14 from my new book Where the Yield Comes From, serialized one chapter a day. For research only; not investment advice.
Author: Blue Lotus
#DeFi #RobinhoodChain #Stablecoins #RWA
The Same Leverage, at Very Different Prices
Suppose you like Nvidia, have $10,000, and want to hold $20,000 of NVDA exposure at 2x leverage. On Robinhood Chain you have three routes:
Open an NVDA perpetual long on Lighter. Over the last 30 days, longs paid funding at an annualized rate of about 7.3% for this.Post NVDA stock tokens on Morpho, borrow USDG, and buy more. In the market that lends USDG against NVDA, the borrowing rate in early November was about 23.5%.Buy an Arcus fixed-leverage token. Arcus packages perpetual positions as ERC-20 tokens (pTokens), offered in 1x and 3x long and short versions. The cost is the perpetual's funding plus rebalancing drag.
For the same leverage, the second route costs more than three times the first. On AAPL, SPCX, and GOOGL, lending-market rates run between 21% and 29%, while funding on the matching perpetuals runs between 2.5% and 12%.
The reason is not hard to see. Morpho markets that take stock tokens as collateral are all small ($200,000 to $700,000 each), with few lenders and utilization stuck at 85–91%, which pushes the rate curve high. Lighter's perpetual markets have $188 million of open interest and market makers quoting, and the price of leverage is set by supply and demand between longs and shorts.
On this chain, the price of leverage is fragmented. The same exposure costs several times more in one venue than another. That is both a cost trap and an opportunity: a trap for borrowers, and an opportunity for anyone willing to lend dollars in the small markets (the 18–26% deposit rates mentioned in Chapter 4).
The Fundamentals of the Perpetual Market
Lighter runs a separate instance on Robinhood Chain (accounts, balances, and liquidity are not shared with Lighter's main network), and perpetual trades in Robinhood Wallet are routed here. Readings on November 2:
63 perpetual markets, about $616 million in 24-hour volume, and about $188 million in open interest.The top three by volume were the SPY perpetual ($84.9 million), BTC ($75.8 million), and the QQQ perpetual ($67 million).The largest open interest was in SPY (about $36 million) and QQQ (about $26.3 million).Maker and taker fees were both zero.Initial margin: 2% for SPY, QQQ, and BTC (up to 50x); 5% for NVDA, AAPL, and GOOGL (20x); 20% for pre-IPO companies such as ANTHROPIC and OPENAI (5x).Funding is settled every hour, including on weekends.
These numbers say one thing: the most active stock trading on this chain is not in stock tokens but in stock perpetuals. One day of SPY perpetual volume (about $84.9 million) is 3–4 times the combined daily volume of the main SPY spot-token pools (about $23 million). The depth measurements in Chapter 3 point the same way: taking $100,000 of SPY perpetual costs less than 1 basis point.
Funding: Longs Pay Almost Every Hour
Perpetual contracts use funding to pull the contract price toward the spot index. When funding is positive, longs pay shorts; when negative, shorts pay longs. We pulled every hourly funding payment in 15 major markets from June 30 to November 2 (about 3,000 hours per market).
SPY: Full period, annualized: 4.5%; July: 3.5%; August: 3.5%; September: 5.2%; October: 5.7%; Share of hours longs paid: 99%QQQ: Full period, annualized: 5.4%; July: 3.6%; August: 4.7%; September: 5.8%; October: 7.6%; Share of hours longs paid: 99%NVDA: Full period, annualized: 5.8%; July: 3.6%; August: 4.5%; September: 7.8%; October: 7.5%; Share of hours longs paid: 99%GOOGL: Full period, annualized: 6.5%; July: 3.4%; August: 5.2%; September: 4.9%; October: 12.2%; Share of hours longs paid: 99%TSLA: Full period, annualized: 4.9%; July: 4.0%; August: 5.1%; September: 3.5%; October: 7.2%; Share of hours longs paid: 99%AAPL: Full period, annualized: 3.4%; July: 3.4%; August: 4.2%; September: 3.5%; October: 2.7%; Share of hours longs paid: 96%MSFT: Full period, annualized: 3.9%; July: 3.6%; August: 3.7%; September: 3.5%; October: 5.0%; Share of hours longs paid: 100%BTC: Full period, annualized: 8.8%; July: 10.5%; August: 9.1%; September: 8.3%; October: 7.1%; Share of hours longs paid: 94%
Three features stand out:
The floor is about 3.5%. In most markets, funding rarely falls below an annualized 3.5% (0.0004% an hour), which works like a built-in interest-rate floor. This matches Chapter 4's conclusion that the "unsubsidized dollar rate" on this chain is about 3.5–4%.Longs almost never get paid. Longs on stock perpetuals paid in 96–100% of hours. Stock traders on this chain are almost uniformly on the long side.October rose clearly. Funding on QQQ, NVDA, GOOGL, and TSLA rose to 7–12% in October, showing that demand to go long was growing faster than money willing to go short.
Based on early-November open interest and last-30-day rates, longs in the top 15 markets pay shorts about $9 million a year.
The Basis Trade: Standing on the Other Side of Leverage
Since longs keep paying, a natural strategy is to stand with the shorts and collect, while hedging price risk with spot:
Basis trade = hold the stock token (long) + short an equal amount of the perpetual (short)
Price moves cancel out across the two legs, and what you earn is funding. Broken down with the yield equation (Chapter 4):
Funding income (collected by shorts): ~+5.7%Token dividends (multiplier, after ~31% deduction): ~+0.7%Perpetual dividend adjustment: 0 (the perpetual price falls with the index ex-dividend; shorts do not pay dividends)Capital used: Full token value + perpetual margin (keep 10–20%)Round-trip cost: ~20–30 bp (token buy and sell + bridge)
On total capital (100% for the token + 15% margin), the annual return is about (5.7% + 0.7%) ÷ 1.15 ≈ 5.6%. After round-trip costs, a one-year hold yields about 5.3%.
Compared with other dollar yields:
It is 1–1.5 percentage points above Spark Savings (3.8%) and the Steakhouse vault's base interest (about 4.1%).It is below the roughly 7.2% that Robinhood Earn users get.Its return comes entirely from the market (longs' demand for leverage), with no subsidy.
It is one of the few "unsubsidized, above-benchmark" strategies this book has found. The price is that it is far more complex than a deposit, and its risks are more varied:
Risk 1: Funding reverses. Funding is set by the market and can turn negative. SPY funding was only 3.5% in July. If demand to go long fades, the return falls back toward the benchmark; in an extreme case, shorts have to pay.
Risk 2: Weekend mismatch. Perpetuals trade 24/7 and funding settles on weekends as usual, and how the index price is computed on weekends depends on Lighter's rules. Meanwhile stock tokens carry a weekend premium (Chapter 6). If you open or close on a weekend, the two legs may not be priced in step.
Risk 3: Margin and liquidation. The short leg loses money when the underlying rallies hard and needs more margin. The gains on the token leg sit elsewhere on the chain and do not offset automatically. With too little margin, a single big up day can liquidate the short, and the hedge breaks on the spot.
Risk 4: Spot depth. Buying $100,000 of the SPY spot token costs about 29 bp (Chapter 3), and $1 million basically cannot be filled. The ceiling on this strategy's size is set by the depth of the spot token, not the perpetual.
Risk 5: Contract permissions. Stock-token transfers can be paused, and an administrator can burn a holder's position (Chapter 11). In regions where the terms do not allow holding stock tokens, this leg cannot be done at all.
Perpetuals on Pre-IPO Companies
Lighter has two unusual markets: ANTHROPIC and OPENAI perpetuals. Their underlyings are companies that have not gone public; prices come from secondary-market valuations or from the market's own pricing.
The ANTHROPIC perpetual traded about $33 million in 24 hours with about $5.7 million of open interest; the OPENAI perpetual traded about $28.5 million with about $6.6 million of open interest.Initial margin is 20%, for a maximum of 5x leverage.Funding on ANTHROPIC swings far more than on stock perpetuals: as high as 0.21% and as low as −0.34% in a single hour. It was negative for all of July (longs got paid) and rose to an annualized 15.6% in August.
These markets give investors a tool they have never had: a way to take a view on the valuation of leading private companies outside the primary market. Their risks are just as new. The underlying has no public, continuous price, and how the index is set and when it is adjusted depend more on platform rules than with listed stocks. Treat it as a way to express a view on valuation, not as an investment in the company.
Other Forms of Leverage
These are still small, but the names are worth knowing:
Arcus perpetuals: another perpetual venue on the chain, with about $65.7 million in TVL and about $2.67 billion of volume over the last 30 days. Robinhood Wallet connected to Arcus's request-for-quote system in October.Arcus pTokens: fixed-leverage tokens that package a perpetual account as an ERC-20 (1x and 3x, long and short), with funding and rebalancing costs reflected in net asset value. Stock tokens such as SPY and QQQ can be used as margin at 50% LTV.Maturity-dated tokens: such as the pare protocol's pPFE-DEC27 (DefiLlama shows an annualized yield of about 6.95%). They hold only tens of thousands of dollars, and you need to read the contract to judge the mechanism.Morpho lending markets for stock tokens: lenders earn 18–26% a year, in markets of $200,000 to $700,000, where your deposit itself pushes the rate down.
If You Want to Use Leverage on This Chain
To go long with leverage, use perpetuals, not lending markets. For the same exposure, perpetuals cost one-third to one-tenth as much as Morpho's stock-collateral markets, with an order of magnitude more depth.Watch the direction and level of funding. Longs on stock perpetuals pay almost every hour, at 5–12% annualized in October. Over a year, that can eat more than half of the stock's gain.If you want to collect what leverage costs, the basis trade is a candidate, but manage it as a strategy, not as a deposit. Keep ample margin, avoid opening and closing on weekends, and keep size within what the spot token can absorb.Size pre-IPO perpetuals as an expression of a view. There is no public, continuous price to anchor them, and hourly funding can swing within ±0.3%.
Stock traders on this chain are almost all long and willing to keep paying for leverage. Standing on the other side and collecting is one of the few returns on this chain that does not rely on subsidies.
Sources for This Chapter
Lighter Robinhood instance API: orderBookDetails (volume, open interest, fees, and margin ratios for 63 perpetual markets, November 2, 2026); fundings (hourly funding for 15 markets, June 30 to November 2, 2026). The funding rate field is a percentage per hour, verified against the value field (funding amount per unit = price × rate%)Lighter documentation, "Lighter on Robinhood Chain": separate instance, contract address 0x94bA…ff9d, chain IDRobinhood Help Center, "Robinhood Wallet perpetual futures": funding settled hourly and paid peer to peer between longs and shortsMorpho GraphQL API: borrowing rates and size of the markets lending USDG against stock tokens (October 29 / November 2, 2026)Arcus pTokens: Arcus launch post and the ArcusGuide summary (fixed leverage, 1x and 3x, stock tokens as margin at 50% LTV)DefiLlama: Arcus Perps TVL and 30-day volume; pare protocol yield poolsRobinhood Goes Onchain, Chapter 10: Robinhood Wallet connected to the Arcus request-for-quote system on October 1, 2026
—
This is Chapter 8 of 14 from my new book Where the Yield Comes From, serialized one chapter a day. For research only; not investment advice.
Author: Blue Lotus
#DeFi #RobinhoodChain #Stablecoins #RWA
607

今天到处在刷"Robinhood Chain TVL破10亿美元、增长飞快",我去DefiLlama拉了一下,标题至少晚了一个月。
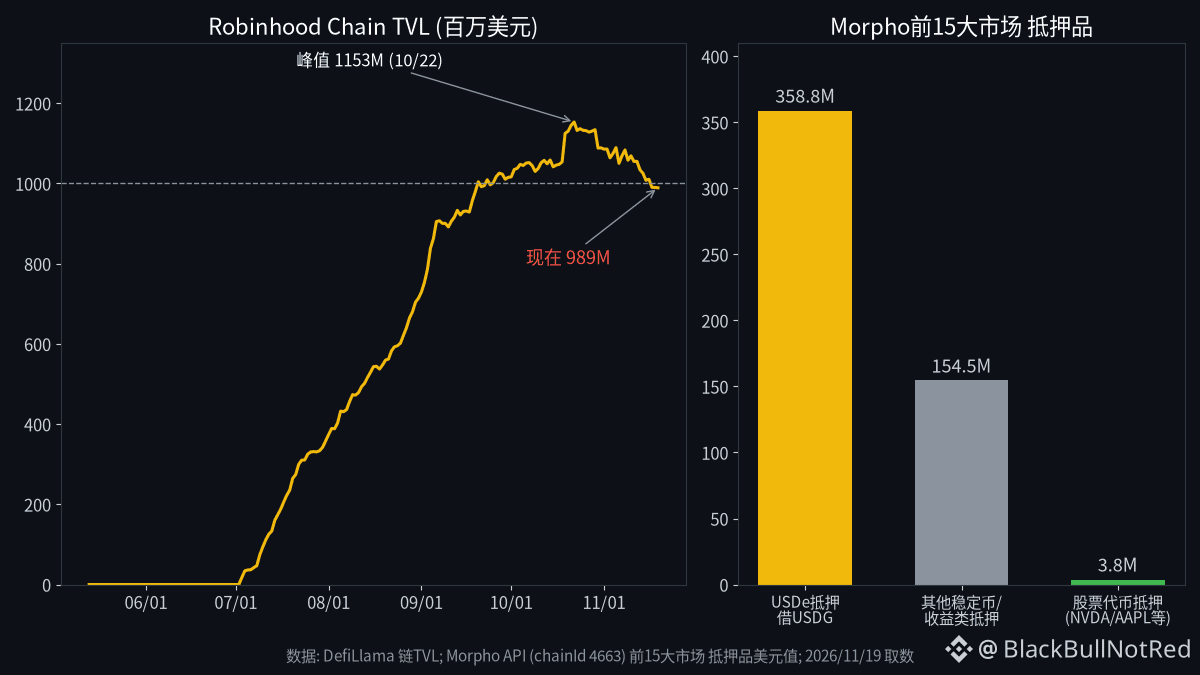
这条链的TVL 10月22日见顶约11.53亿,现在9.89亿,从高点回落大概14%,刚刚又跌回10亿下面。所以准确的说法是"一个月前破过10亿,现在在往下走",不是"刚冲上10亿"。
更值得看的是钱到底在干嘛。9.89亿里,Morpho Blue一家就占了约5.97亿,六成。再用Morpho自己的API看这条链上前15大借贷市场:最大的一个是押USDe借USDG,抵押约3.59亿,借出3.18亿,利用率接近89%。后面几个也基本是押收益型稳定币借USDG。
然后是Robinhood最爱讲的那部分,股票代币。前15大市场里拿NVDA、AAPL、GOOGL、SPY、SPCX这些代币做抵押的,加起来不到400万美元。
也就是说,这条"把美股搬上链"的链,链上借贷的主体是稳定币和稳定币之间的利差生意,跟股票几乎没关系。押USDe借USDG,赚的是USDe收益和USDG借款利率之间那点差,是不是一层层循环加杠杆我这里没法从数据直接确认,但这种结构的钱有个特点:利差一收窄就走,谁补贴高就去谁那。TVL从10月下旬开始掉,和链上的股票业务大概率没啥关系,更像是这批套利资金在撤。
我的看法:TVL这个数对Robinhood Chain几乎说明不了"股票代币有没有人用"。真要判断这条链的故事成不成立,盯股票代币抵押规模和股票永续的真实成交,别盯总TVL。现在这个数是400万,离"颠覆券商"还差得远。
数据:DefiLlama链TVL、Morpho API,11/19取数,只看了前15大市场,长尾小市场没算进去。
#RobinhoodChain #DeFi
今天到处在刷"Robinhood Chain TVL破10亿美元、增长飞快",我去DefiLlama拉了一下,标题至少晚了一个月。
这条链的TVL 10月22日见顶约11.53亿,现在9.89亿,从高点回落大概14%,刚刚又跌回10亿下面。所以准确的说法是"一个月前破过10亿,现在在往下走",不是"刚冲上10亿"。
更值得看的是钱到底在干嘛。9.89亿里,Morpho Blue一家就占了约5.97亿,六成。再用Morpho自己的API看这条链上前15大借贷市场:最大的一个是押USDe借USDG,抵押约3.59亿,借出3.18亿,利用率接近89%。后面几个也基本是押收益型稳定币借USDG。
然后是Robinhood最爱讲的那部分,股票代币。前15大市场里拿NVDA、AAPL、GOOGL、SPY、SPCX这些代币做抵押的,加起来不到400万美元。
也就是说,这条"把美股搬上链"的链,链上借贷的主体是稳定币和稳定币之间的利差生意,跟股票几乎没关系。押USDe借USDG,赚的是USDe收益和USDG借款利率之间那点差,是不是一层层循环加杠杆我这里没法从数据直接确认,但这种结构的钱有个特点:利差一收窄就走,谁补贴高就去谁那。TVL从10月下旬开始掉,和链上的股票业务大概率没啥关系,更像是这批套利资金在撤。
我的看法:TVL这个数对Robinhood Chain几乎说明不了"股票代币有没有人用"。真要判断这条链的故事成不成立,盯股票代币抵押规模和股票永续的真实成交,别盯总TVL。现在这个数是400万,离"颠覆券商"还差得远。
数据:DefiLlama链TVL、Morpho API,11/19取数,只看了前15大市场,长尾小市场没算进去。
#RobinhoodChain #DeFi
这条链的TVL 10月22日见顶约11.53亿,现在9.89亿,从高点回落大概14%,刚刚又跌回10亿下面。所以准确的说法是"一个月前破过10亿,现在在往下走",不是"刚冲上10亿"。
更值得看的是钱到底在干嘛。9.89亿里,Morpho Blue一家就占了约5.97亿,六成。再用Morpho自己的API看这条链上前15大借贷市场:最大的一个是押USDe借USDG,抵押约3.59亿,借出3.18亿,利用率接近89%。后面几个也基本是押收益型稳定币借USDG。
然后是Robinhood最爱讲的那部分,股票代币。前15大市场里拿NVDA、AAPL、GOOGL、SPY、SPCX这些代币做抵押的,加起来不到400万美元。
也就是说,这条"把美股搬上链"的链,链上借贷的主体是稳定币和稳定币之间的利差生意,跟股票几乎没关系。押USDe借USDG,赚的是USDe收益和USDG借款利率之间那点差,是不是一层层循环加杠杆我这里没法从数据直接确认,但这种结构的钱有个特点:利差一收窄就走,谁补贴高就去谁那。TVL从10月下旬开始掉,和链上的股票业务大概率没啥关系,更像是这批套利资金在撤。
我的看法:TVL这个数对Robinhood Chain几乎说明不了"股票代币有没有人用"。真要判断这条链的故事成不成立,盯股票代币抵押规模和股票永续的真实成交,别盯总TVL。现在这个数是400万,离"颠覆券商"还差得远。
数据:DefiLlama链TVL、Morpho API,11/19取数,只看了前15大市场,长尾小市场没算进去。
#RobinhoodChain #DeFi
7
·
--
Статья
Market Making and LPs: Stock-Against-Stock PoolsIf you are thinking about providing liquidity for stock tokens on Robinhood Chain, this chapter answers three questions. Can fees cover the losses from market making? What is different about pools that pair one stock against another? And how much money is there to be made in this business each year?
A Business Worth About $1.2 Million
Start with the most important number in the conclusions.
We took the five most liquid pools for the SPY token and estimated their annual fees by multiplying the average daily volume over the last 30 days by each pool's fee rate:
SPY / WETH (0.05%): TVL: $1.88 million; Average daily volume, last 30 days: $3.29 million; Estimated annual fees: ~$600,000SPY / USDG (0.05%): TVL: $1.08 million; Average daily volume, last 30 days: $1.29 million; Estimated annual fees: ~$235,000SPY / NVDA (0.025%): TVL: $1.55 million; Average daily volume, last 30 days: $1.68 million; Estimated annual fees: ~$150,000QQQ / SPY (0.02%): TVL: $1.43 million; Average daily volume, last 30 days: $1.37 million; Estimated annual fees: ~$100,000GOOGL / SPY (0.025%): TVL: $810,000; Average daily volume, last 30 days: $860,000; Estimated annual fees: ~$80,000
Together, the five pools generate about $1.2 million in fees a year. The other stock-token pools on this chain are smaller. In other words, at early-November volumes, making markets in stock tokens across the entire chain earns roughly a little over a million dollars a year in fees.
That number sets the ceiling for the LP business. Fees are a fixed-size pie, divided by TVL. The more money you put in, the bigger your share, but the lower the return on each dollar. Add $1 million to the SPY/USDG 0.05% pool and its TVL doubles; its annualized fee yield falls from about 22% to about 11%.
Market making in stock tokens is a capacity problem first and a yield problem second.
Fees vs. Market-Making Losses
Textbooks call the loss from market making "impermanent loss." A more precise measure is LVR (loss-versus-rebalancing). The price in a pool lags the outside price, and every time arbitrageurs pull it back, they take a little from the LPs. For a full-range AMM, annualized LVR is approximately the square of the annualized volatility of the ratio between the two assets' prices, divided by 8:
LVR ≈ σ² / 8
The formula makes one point: market-making losses depend on the relative volatility between the two assets, not on the volatility of either asset alone.
Using daily bars for the underlying stocks since July 2026, we calculated the relative volatility of the two assets in each pool and compared it with each pool's annualized fee yield (estimated on a full-range basis at current TVL):
SPY / USDG (0.05%): Relative volatility (annualized): 11.0%; LVR (annualized): 0.15%; Annualized fees: 21.8%; Merkl reward (UNI): —QQQ / SPY (0.02%): Relative volatility (annualized): 10.9%; LVR (annualized): 0.15%; Annualized fees: 7.0%; Merkl reward (UNI): ~5.9%SPY / NVDA (0.025%): Relative volatility (annualized): 31.3%; LVR (annualized): 1.22%; Annualized fees: 9.9%; Merkl reward (UNI): ~17.9%GOOGL / SPY (0.025%): Relative volatility (annualized): 35.3%; LVR (annualized): 1.56%; Annualized fees: 9.7%; Merkl reward (UNI): ~20.9%SPY / WETH (0.05%): Relative volatility (annualized): 44.9%; LVR (annualized): 2.52%; Annualized fees: 32.0%; Merkl reward (UNI): —
On this basis, fees in all five pools are well above LVR. That is the opposite of many onchain pools: in the major pools on Ethereum mainnet, fees and LVR are often close to each other, leaving LPs with thin net returns.
Why do the stock pools on this chain look so good? There are three reasons, two of which call for caution:
The pools are small, and volume is large relative to TVL. Daily volume in the SPY/USDG 0.05% pool exceeds its TVL. This is a real opportunity, but it holds only for the first money in (see the capacity problem above).Part of the volume is arbitrage. Arbitrage trades are themselves the source of LVR. The fees they pay compensate LPs, but they also mean that "high volume" is not all random retail trading.Full range is an assumption. Most of these pools are Uniswap V3 and V4 concentrated-liquidity pools. Concentrating liquidity in a narrow range multiplies fees and LVR by similar factors. Once the price leaves your range, your position turns into a single asset and stops earning fees. Actual returns depend on how the range is managed, not on this table.
Stock Against Stock: A Pool You Will Not Find Elsewhere
This chain has a kind of pool rarely seen on other chains: both sides are stocks. In August, Uniswap opened a set of V4 pools for stock tokens, all with SPY on the other side (SPY against TSLA, AMZN, META, PLTR, AMD, MU, TSM, COST, RDDT, QQQ, and more), and paid UNI rewards through Merkl.
The economics of these pools are completely different from ordinary pools:
You carry no dollar risk, only relative risk. In an SPY/USDG pool, if SPY falls 10%, your position falls with it (plus impermanent loss). In a QQQ/SPY pool, if both fall 10%, your position falls 10%, but impermanent loss is almost zero because their price ratio has not changed.It is a "market-neutral beta position" plus fees. Your total exposure is roughly 50% SPY and 50% QQQ, and impermanent loss depends on how far QQQ deviates from SPY (annualized relative volatility of about 11%).The higher the correlation, the more it resembles a deposit; the lower, the more it resembles market making. The relative volatility of QQQ/SPY is about the same as the volatility of SPY against the dollar (both about 11%), while NVDA/SPY and GOOGL/SPY have relative volatility of 31–35% and LVR eight to ten times higher.
Who is it for? People who already intend to hold a basket of U.S. stocks for the long term. If you already want to hold SPY and QQQ, putting them into a QQQ/SPY pool means collecting about 7% in fees and about 6% in UNI rewards while you hold them. The only extra risks are fluctuations in their price ratio and contract risk.
Weekends: Where Both the LP's Returns and Risks Live
LPs in stock-token pools face something no other asset has: the pool keeps trading while the U.S. market is closed.
Chapter 6 found that weekend onchain prices are on average 10–38 bp above the shares, and closely correlated with the direction of Monday's gap. For LPs in stock/USDG pools:
The good side: on weekends there are more buyers than sellers, and LPs sell stock tokens at a premium inside the pool. That premium is LP income.The bad side: at Monday's open, the shares jump to a new level, and arbitrageurs pull the pool price over in one move. The 95th percentile of weekend deviation runs from 83 bp (SPY) to 321 bp (MU), and LPs ultimately absorb these large deviations.Stock-against-stock pools are much less affected: both sides stop being priced externally over the weekend and jump together on Monday, so the price ratio changes only modestly.
If You Are Thinking About Making Markets in Stock Tokens
Work out capacity before yield. Multiply the pool's last-30-day volume by its fee rate to get annual fees, then divide by "current TVL + your money." That is the yield you can actually get. Stock market making across the whole chain earns about $1.2 million a year in fees, and large amounts of new money will only dilute it.Prefer highly correlated stock-against-stock pools. Pools like QQQ/SPY have LVR of only 0.15% and suit people who already want to hold a basket of U.S. stocks long term. NVDA/SPY and GOOGL/SPY have LVR eight to ten times higher and look more like market making than holding.Set ranges with weekends in mind. A concentrated-liquidity range should cover at least one weekend gap (about ±1% for SPY, ±3–5% for individual stocks), or every Monday may knock you out of range.Remember that contract risk applies to the whole pool. If any stock token is paused, every pool containing it freezes, and the asset on the other side is locked along with it (Chapter 11, Scenario 2).
Making markets in stock tokens is a small, refined business: fees really are higher than losses, but the whole pie is only about a million dollars a year, and whoever arrives first eats the most.
Sources for This Chapter
GeckoTerminal: daily bars (in-pool price and dollar volume) and current TVL for the top six SPY-token pools (November 2, 2026); average daily volume over the last 30 days calculated from each pool's daily dollar volumeYahoo Finance: daily bars for SPY, QQQ, NVDA, GOOGL, and ETH-USD (July 1 to November 2, 2026), used to calculate the annualized volatility of each pair's price ratio (stocks annualized on 252 trading days)Merkl v4: annualized UNI rewards on Uniswap V4 stock pools (November 2, 2026)Merkl's July–August 2026 review: Uniswap opening V4 pools for stock tokens with SPY on the other side, with UNI rewardsMethod: annualized fees = average daily volume over the last 30 days × fee rate × 365 ÷ current TVL (full-range assumption); LVR ≈ σ² ÷ 8. One dynamic-fee SPY/USDG pool without a stated fee rate is excluded
—
This is Chapter 7 of 14 from my new book Where the Yield Comes From, serialized one chapter a day. For research only; not investment advice.
Author: Blue Lotus
#DeFi #RobinhoodChain #Stablecoins #RWA
Market Making and LPs: Stock-Against-Stock Pools
If you are thinking about providing liquidity for stock tokens on Robinhood Chain, this chapter answers three questions. Can fees cover the losses from market making? What is different about pools that pair one stock against another? And how much money is there to be made in this business each year?
A Business Worth About $1.2 Million
Start with the most important number in the conclusions.
We took the five most liquid pools for the SPY token and estimated their annual fees by multiplying the average daily volume over the last 30 days by each pool's fee rate:
SPY / WETH (0.05%): TVL: $1.88 million; Average daily volume, last 30 days: $3.29 million; Estimated annual fees: ~$600,000SPY / USDG (0.05%): TVL: $1.08 million; Average daily volume, last 30 days: $1.29 million; Estimated annual fees: ~$235,000SPY / NVDA (0.025%): TVL: $1.55 million; Average daily volume, last 30 days: $1.68 million; Estimated annual fees: ~$150,000QQQ / SPY (0.02%): TVL: $1.43 million; Average daily volume, last 30 days: $1.37 million; Estimated annual fees: ~$100,000GOOGL / SPY (0.025%): TVL: $810,000; Average daily volume, last 30 days: $860,000; Estimated annual fees: ~$80,000
Together, the five pools generate about $1.2 million in fees a year. The other stock-token pools on this chain are smaller. In other words, at early-November volumes, making markets in stock tokens across the entire chain earns roughly a little over a million dollars a year in fees.
That number sets the ceiling for the LP business. Fees are a fixed-size pie, divided by TVL. The more money you put in, the bigger your share, but the lower the return on each dollar. Add $1 million to the SPY/USDG 0.05% pool and its TVL doubles; its annualized fee yield falls from about 22% to about 11%.
Market making in stock tokens is a capacity problem first and a yield problem second.
Fees vs. Market-Making Losses
Textbooks call the loss from market making "impermanent loss." A more precise measure is LVR (loss-versus-rebalancing). The price in a pool lags the outside price, and every time arbitrageurs pull it back, they take a little from the LPs. For a full-range AMM, annualized LVR is approximately the square of the annualized volatility of the ratio between the two assets' prices, divided by 8:
LVR ≈ σ² / 8
The formula makes one point: market-making losses depend on the relative volatility between the two assets, not on the volatility of either asset alone.
Using daily bars for the underlying stocks since July 2026, we calculated the relative volatility of the two assets in each pool and compared it with each pool's annualized fee yield (estimated on a full-range basis at current TVL):
SPY / USDG (0.05%): Relative volatility (annualized): 11.0%; LVR (annualized): 0.15%; Annualized fees: 21.8%; Merkl reward (UNI): —QQQ / SPY (0.02%): Relative volatility (annualized): 10.9%; LVR (annualized): 0.15%; Annualized fees: 7.0%; Merkl reward (UNI): ~5.9%SPY / NVDA (0.025%): Relative volatility (annualized): 31.3%; LVR (annualized): 1.22%; Annualized fees: 9.9%; Merkl reward (UNI): ~17.9%GOOGL / SPY (0.025%): Relative volatility (annualized): 35.3%; LVR (annualized): 1.56%; Annualized fees: 9.7%; Merkl reward (UNI): ~20.9%SPY / WETH (0.05%): Relative volatility (annualized): 44.9%; LVR (annualized): 2.52%; Annualized fees: 32.0%; Merkl reward (UNI): —
On this basis, fees in all five pools are well above LVR. That is the opposite of many onchain pools: in the major pools on Ethereum mainnet, fees and LVR are often close to each other, leaving LPs with thin net returns.
Why do the stock pools on this chain look so good? There are three reasons, two of which call for caution:
The pools are small, and volume is large relative to TVL. Daily volume in the SPY/USDG 0.05% pool exceeds its TVL. This is a real opportunity, but it holds only for the first money in (see the capacity problem above).Part of the volume is arbitrage. Arbitrage trades are themselves the source of LVR. The fees they pay compensate LPs, but they also mean that "high volume" is not all random retail trading.Full range is an assumption. Most of these pools are Uniswap V3 and V4 concentrated-liquidity pools. Concentrating liquidity in a narrow range multiplies fees and LVR by similar factors. Once the price leaves your range, your position turns into a single asset and stops earning fees. Actual returns depend on how the range is managed, not on this table.
Stock Against Stock: A Pool You Will Not Find Elsewhere
This chain has a kind of pool rarely seen on other chains: both sides are stocks. In August, Uniswap opened a set of V4 pools for stock tokens, all with SPY on the other side (SPY against TSLA, AMZN, META, PLTR, AMD, MU, TSM, COST, RDDT, QQQ, and more), and paid UNI rewards through Merkl.
The economics of these pools are completely different from ordinary pools:
You carry no dollar risk, only relative risk. In an SPY/USDG pool, if SPY falls 10%, your position falls with it (plus impermanent loss). In a QQQ/SPY pool, if both fall 10%, your position falls 10%, but impermanent loss is almost zero because their price ratio has not changed.It is a "market-neutral beta position" plus fees. Your total exposure is roughly 50% SPY and 50% QQQ, and impermanent loss depends on how far QQQ deviates from SPY (annualized relative volatility of about 11%).The higher the correlation, the more it resembles a deposit; the lower, the more it resembles market making. The relative volatility of QQQ/SPY is about the same as the volatility of SPY against the dollar (both about 11%), while NVDA/SPY and GOOGL/SPY have relative volatility of 31–35% and LVR eight to ten times higher.
Who is it for? People who already intend to hold a basket of U.S. stocks for the long term. If you already want to hold SPY and QQQ, putting them into a QQQ/SPY pool means collecting about 7% in fees and about 6% in UNI rewards while you hold them. The only extra risks are fluctuations in their price ratio and contract risk.
Weekends: Where Both the LP's Returns and Risks Live
LPs in stock-token pools face something no other asset has: the pool keeps trading while the U.S. market is closed.
Chapter 6 found that weekend onchain prices are on average 10–38 bp above the shares, and closely correlated with the direction of Monday's gap. For LPs in stock/USDG pools:
The good side: on weekends there are more buyers than sellers, and LPs sell stock tokens at a premium inside the pool. That premium is LP income.The bad side: at Monday's open, the shares jump to a new level, and arbitrageurs pull the pool price over in one move. The 95th percentile of weekend deviation runs from 83 bp (SPY) to 321 bp (MU), and LPs ultimately absorb these large deviations.Stock-against-stock pools are much less affected: both sides stop being priced externally over the weekend and jump together on Monday, so the price ratio changes only modestly.
If You Are Thinking About Making Markets in Stock Tokens
Work out capacity before yield. Multiply the pool's last-30-day volume by its fee rate to get annual fees, then divide by "current TVL + your money." That is the yield you can actually get. Stock market making across the whole chain earns about $1.2 million a year in fees, and large amounts of new money will only dilute it.Prefer highly correlated stock-against-stock pools. Pools like QQQ/SPY have LVR of only 0.15% and suit people who already want to hold a basket of U.S. stocks long term. NVDA/SPY and GOOGL/SPY have LVR eight to ten times higher and look more like market making than holding.Set ranges with weekends in mind. A concentrated-liquidity range should cover at least one weekend gap (about ±1% for SPY, ±3–5% for individual stocks), or every Monday may knock you out of range.Remember that contract risk applies to the whole pool. If any stock token is paused, every pool containing it freezes, and the asset on the other side is locked along with it (Chapter 11, Scenario 2).
Making markets in stock tokens is a small, refined business: fees really are higher than losses, but the whole pie is only about a million dollars a year, and whoever arrives first eats the most.
Sources for This Chapter
GeckoTerminal: daily bars (in-pool price and dollar volume) and current TVL for the top six SPY-token pools (November 2, 2026); average daily volume over the last 30 days calculated from each pool's daily dollar volumeYahoo Finance: daily bars for SPY, QQQ, NVDA, GOOGL, and ETH-USD (July 1 to November 2, 2026), used to calculate the annualized volatility of each pair's price ratio (stocks annualized on 252 trading days)Merkl v4: annualized UNI rewards on Uniswap V4 stock pools (November 2, 2026)Merkl's July–August 2026 review: Uniswap opening V4 pools for stock tokens with SPY on the other side, with UNI rewardsMethod: annualized fees = average daily volume over the last 30 days × fee rate × 365 ÷ current TVL (full-range assumption); LVR ≈ σ² ÷ 8. One dynamic-fee SPY/USDG pool without a stated fee rate is excluded
—
This is Chapter 7 of 14 from my new book Where the Yield Comes From, serialized one chapter a day. For research only; not investment advice.
Author: Blue Lotus
#DeFi #RobinhoodChain #Stablecoins #RWA
A Business Worth About $1.2 Million
Start with the most important number in the conclusions.
We took the five most liquid pools for the SPY token and estimated their annual fees by multiplying the average daily volume over the last 30 days by each pool's fee rate:
SPY / WETH (0.05%): TVL: $1.88 million; Average daily volume, last 30 days: $3.29 million; Estimated annual fees: ~$600,000SPY / USDG (0.05%): TVL: $1.08 million; Average daily volume, last 30 days: $1.29 million; Estimated annual fees: ~$235,000SPY / NVDA (0.025%): TVL: $1.55 million; Average daily volume, last 30 days: $1.68 million; Estimated annual fees: ~$150,000QQQ / SPY (0.02%): TVL: $1.43 million; Average daily volume, last 30 days: $1.37 million; Estimated annual fees: ~$100,000GOOGL / SPY (0.025%): TVL: $810,000; Average daily volume, last 30 days: $860,000; Estimated annual fees: ~$80,000
Together, the five pools generate about $1.2 million in fees a year. The other stock-token pools on this chain are smaller. In other words, at early-November volumes, making markets in stock tokens across the entire chain earns roughly a little over a million dollars a year in fees.
That number sets the ceiling for the LP business. Fees are a fixed-size pie, divided by TVL. The more money you put in, the bigger your share, but the lower the return on each dollar. Add $1 million to the SPY/USDG 0.05% pool and its TVL doubles; its annualized fee yield falls from about 22% to about 11%.
Market making in stock tokens is a capacity problem first and a yield problem second.
Fees vs. Market-Making Losses
Textbooks call the loss from market making "impermanent loss." A more precise measure is LVR (loss-versus-rebalancing). The price in a pool lags the outside price, and every time arbitrageurs pull it back, they take a little from the LPs. For a full-range AMM, annualized LVR is approximately the square of the annualized volatility of the ratio between the two assets' prices, divided by 8:
LVR ≈ σ² / 8
The formula makes one point: market-making losses depend on the relative volatility between the two assets, not on the volatility of either asset alone.
Using daily bars for the underlying stocks since July 2026, we calculated the relative volatility of the two assets in each pool and compared it with each pool's annualized fee yield (estimated on a full-range basis at current TVL):
SPY / USDG (0.05%): Relative volatility (annualized): 11.0%; LVR (annualized): 0.15%; Annualized fees: 21.8%; Merkl reward (UNI): —QQQ / SPY (0.02%): Relative volatility (annualized): 10.9%; LVR (annualized): 0.15%; Annualized fees: 7.0%; Merkl reward (UNI): ~5.9%SPY / NVDA (0.025%): Relative volatility (annualized): 31.3%; LVR (annualized): 1.22%; Annualized fees: 9.9%; Merkl reward (UNI): ~17.9%GOOGL / SPY (0.025%): Relative volatility (annualized): 35.3%; LVR (annualized): 1.56%; Annualized fees: 9.7%; Merkl reward (UNI): ~20.9%SPY / WETH (0.05%): Relative volatility (annualized): 44.9%; LVR (annualized): 2.52%; Annualized fees: 32.0%; Merkl reward (UNI): —
On this basis, fees in all five pools are well above LVR. That is the opposite of many onchain pools: in the major pools on Ethereum mainnet, fees and LVR are often close to each other, leaving LPs with thin net returns.
Why do the stock pools on this chain look so good? There are three reasons, two of which call for caution:
The pools are small, and volume is large relative to TVL. Daily volume in the SPY/USDG 0.05% pool exceeds its TVL. This is a real opportunity, but it holds only for the first money in (see the capacity problem above).Part of the volume is arbitrage. Arbitrage trades are themselves the source of LVR. The fees they pay compensate LPs, but they also mean that "high volume" is not all random retail trading.Full range is an assumption. Most of these pools are Uniswap V3 and V4 concentrated-liquidity pools. Concentrating liquidity in a narrow range multiplies fees and LVR by similar factors. Once the price leaves your range, your position turns into a single asset and stops earning fees. Actual returns depend on how the range is managed, not on this table.
Stock Against Stock: A Pool You Will Not Find Elsewhere
This chain has a kind of pool rarely seen on other chains: both sides are stocks. In August, Uniswap opened a set of V4 pools for stock tokens, all with SPY on the other side (SPY against TSLA, AMZN, META, PLTR, AMD, MU, TSM, COST, RDDT, QQQ, and more), and paid UNI rewards through Merkl.
The economics of these pools are completely different from ordinary pools:
You carry no dollar risk, only relative risk. In an SPY/USDG pool, if SPY falls 10%, your position falls with it (plus impermanent loss). In a QQQ/SPY pool, if both fall 10%, your position falls 10%, but impermanent loss is almost zero because their price ratio has not changed.It is a "market-neutral beta position" plus fees. Your total exposure is roughly 50% SPY and 50% QQQ, and impermanent loss depends on how far QQQ deviates from SPY (annualized relative volatility of about 11%).The higher the correlation, the more it resembles a deposit; the lower, the more it resembles market making. The relative volatility of QQQ/SPY is about the same as the volatility of SPY against the dollar (both about 11%), while NVDA/SPY and GOOGL/SPY have relative volatility of 31–35% and LVR eight to ten times higher.
Who is it for? People who already intend to hold a basket of U.S. stocks for the long term. If you already want to hold SPY and QQQ, putting them into a QQQ/SPY pool means collecting about 7% in fees and about 6% in UNI rewards while you hold them. The only extra risks are fluctuations in their price ratio and contract risk.
Weekends: Where Both the LP's Returns and Risks Live
LPs in stock-token pools face something no other asset has: the pool keeps trading while the U.S. market is closed.
Chapter 6 found that weekend onchain prices are on average 10–38 bp above the shares, and closely correlated with the direction of Monday's gap. For LPs in stock/USDG pools:
The good side: on weekends there are more buyers than sellers, and LPs sell stock tokens at a premium inside the pool. That premium is LP income.The bad side: at Monday's open, the shares jump to a new level, and arbitrageurs pull the pool price over in one move. The 95th percentile of weekend deviation runs from 83 bp (SPY) to 321 bp (MU), and LPs ultimately absorb these large deviations.Stock-against-stock pools are much less affected: both sides stop being priced externally over the weekend and jump together on Monday, so the price ratio changes only modestly.
If You Are Thinking About Making Markets in Stock Tokens
Work out capacity before yield. Multiply the pool's last-30-day volume by its fee rate to get annual fees, then divide by "current TVL + your money." That is the yield you can actually get. Stock market making across the whole chain earns about $1.2 million a year in fees, and large amounts of new money will only dilute it.Prefer highly correlated stock-against-stock pools. Pools like QQQ/SPY have LVR of only 0.15% and suit people who already want to hold a basket of U.S. stocks long term. NVDA/SPY and GOOGL/SPY have LVR eight to ten times higher and look more like market making than holding.Set ranges with weekends in mind. A concentrated-liquidity range should cover at least one weekend gap (about ±1% for SPY, ±3–5% for individual stocks), or every Monday may knock you out of range.Remember that contract risk applies to the whole pool. If any stock token is paused, every pool containing it freezes, and the asset on the other side is locked along with it (Chapter 11, Scenario 2).
Making markets in stock tokens is a small, refined business: fees really are higher than losses, but the whole pie is only about a million dollars a year, and whoever arrives first eats the most.
Sources for This Chapter
GeckoTerminal: daily bars (in-pool price and dollar volume) and current TVL for the top six SPY-token pools (November 2, 2026); average daily volume over the last 30 days calculated from each pool's daily dollar volumeYahoo Finance: daily bars for SPY, QQQ, NVDA, GOOGL, and ETH-USD (July 1 to November 2, 2026), used to calculate the annualized volatility of each pair's price ratio (stocks annualized on 252 trading days)Merkl v4: annualized UNI rewards on Uniswap V4 stock pools (November 2, 2026)Merkl's July–August 2026 review: Uniswap opening V4 pools for stock tokens with SPY on the other side, with UNI rewardsMethod: annualized fees = average daily volume over the last 30 days × fee rate × 365 ÷ current TVL (full-range assumption); LVR ≈ σ² ÷ 8. One dynamic-fee SPY/USDG pool without a stated fee rate is excluded
—
This is Chapter 7 of 14 from my new book Where the Yield Comes From, serialized one chapter a day. For research only; not investment advice.
Author: Blue Lotus
#DeFi #RobinhoodChain #Stablecoins #RWA
1
244
·
--
Статья
Calibrate the Ruler First: Stock-Token Premiums and Weekend Price DiscoveryIf you hold or plan to hold stock tokens, this chapter answers three questions. Is the price you pay fair? Where did the dividends go? And does the onchain price on weekends carry any information?
A Conclusion We Almost Got Wrong
The most natural first step in studying stock tokens is to put the onchain price next to the price of the underlying shares. We compared GeckoTerminal's hourly candles (the SPY/USDG pool) with Yahoo Finance's 60-minute SPY bars (including pre-market and after-hours), and the first result was clear: the SPY token was almost always more expensive than the shares, with the median holding steady at about +20 basis points from mid-September. It was more expensive during trading hours, at night, and on weekends, by roughly the same amount.
That makes for a neat conclusion: there is a persistent onchain premium, and buying stock tokens costs an extra 0.2%.
The conclusion is wrong. The ruler was wrong.
How Many Shares Is One Token?
Robinhood's stock-token contracts include a function called uiMultiplier(). It returns a multiplier: how many underlying shares one token represents.
At launch, every token's multiplier was 1.0. Since then, whenever the underlying stock pays a dividend, Robinhood does not pay cash to token holders. Instead it raises the multiplier, reinvesting the dividend. We used the RPC to read the current multiplier and every change event for seven major tokens:
SPY: Current multiplier: 1.001718; Effective date: 2026-09-18; Dividend: $1.889; Dividend ÷ share price: 24.79 bp; Multiplier increase ÷ dividend yield: 0.693QQQ: Current multiplier: 1.000701; Effective date: 2026-09-22; Dividend: $0.751; Dividend ÷ share price: 10.11 bp; Multiplier increase ÷ dividend yield: 0.693NVDA: Current multiplier: 1.000775; Effective date: 2026-09-10; Dividend: $0.25; Dividend ÷ share price: 11.18 bp; Multiplier increase ÷ dividend yield: 0.694META: Current multiplier: 1.000541; Effective date: 2026-09-21; Dividend: $0.525; Dividend ÷ share price: 7.85 bp; Multiplier increase ÷ dividend yield: 0.689MU: Current multiplier: 1.000183; Effective date: Twice: Jul. 24, Oct. 14; Dividend: $0.15 each; Dividend ÷ share price: 1.57 bp (October); Multiplier increase ÷ dividend yield: 0.690GOOGL: Current multiplier: 1.000194; Effective date: 2026-09-15; Dividend: $0.22; Dividend ÷ share price: —; Multiplier increase ÷ dividend yield: —TSLA: Current multiplier: 1.0; Effective date: None; Dividend: No dividend; Dividend ÷ share price: —; Multiplier increase ÷ dividend yield: —
So after September 18, one SPY token represents 1.001718 SPY shares. Multiply the share price by this multiplier before comparing, and most of the "persistent premium" disappears (Figure 2-3).
The last column was an unexpected bonus. For all five tokens, the multiplier increase is almost exactly 0.69 times the dividend yield. In other words, about 31% of the dividend is deducted before it is reinvested. The most plausible explanation is the 30% U.S. withholding tax on dividends paid to non-U.S. persons (the stock-token offering documents mention withholding tax and Section 871(m)), plus about 1% in processing costs.
For long-term holders, this is a real cost:
SPY's annual dividend yield is about 1.0%. Token holders actually receive about 0.69%, about 0.31 percentage points less every year.An investor who opens an account in a country with a tax treaty (15% withholding) and holds SPY directly loses only about 0.15 percentage points a year.Stocks that pay no dividend (TSLA) are unaffected; high-dividend stocks are affected the most.
Stock-token dividends do not vanish. They are cut by about 30% and then quietly turned into more shares.
After Calibration: Tight in Trading Hours, a Premium Only on Weekends
After correcting for the multiplier, we recomputed all the hourly data for seven tokens from launch to November 2 (1,600 to 2,800 hours per token, excluding hours with less than $500 of volume) and grouped the data into three periods:
Trading hours: hours when U.S. shares have quotes, including pre-market and after-hours;Weekday nights: from the U.S. close to the next day's pre-market;Weekends: from the end of Friday after-hours to the start of Monday pre-market.
SPY (USDG 0.3%): Trading hours: +6.0 bp; Weekday nights: +11.0 bp; Weekends: +11.8 bp; Weekend P95: 83 bpQQQ (USDG 0.05%): Trading hours: +4.0 bp; Weekday nights: +5.9 bp; Weekends: +13.3 bp; Weekend P95: 88 bpNVDA (USDG 0.05%): Trading hours: +4.0 bp; Weekday nights: +12.7 bp; Weekends: +27.1 bp; Weekend P95: 258 bpGOOGL (USDG 0.05%): Trading hours: +4.2 bp; Weekday nights: +12.6 bp; Weekends: +9.8 bp; Weekend P95: 143 bpMETA (USDG 0.3%): Trading hours: +2.8 bp; Weekday nights: +1.7 bp; Weekends: −1.0 bp; Weekend P95: 147 bpTSLA (USDG 0.3%): Trading hours: +14.0 bp; Weekday nights: +22.3 bp; Weekends: +37.5 bp; Weekend P95: 150 bpMU (USDG 0.3%): Trading hours: +13.3 bp; Weekday nights: +35.3 bp; Weekends: +25.3 bp; Weekend P95: 321 bp
(Values are median deviations of the token price from the shares, after multiplier correction. P95 is the 95th percentile of the absolute deviation.)
Three conclusions:
1. Spreads during trading hours are tight. When U.S. shares are quoted, the main tokens deviate by a median of only 3–6 bp, a fraction of the pool fee. This shows that arbitrageurs are watching: when the shares can trade, token prices are pulled in close. TSLA and MU are slightly wider (about 13–14 bp); their main pools charge 0.3%, which raises the bar for arbitrage.
2. There is a real premium while the market is closed. After correction, the weekend premium actually comes into view: about 27 bp for NVDA, about 38 bp for TSLA, about 25 bp for MU, and about 12–13 bp for SPY and QQQ. META is the exception, with a median weekend deviation near zero.
3. The tails are wide. The 95th percentile of weekend deviation is about 83 bp for SPY and more than 250 bp for NVDA and MU. In other words, in one of every twenty weekend hours, the price deviates by more than that.
Why is there a weekend premium? The most direct explanation is one-sided demand. When U.S. markets are closed, anyone who wants to buy can only buy onchain, and few market makers can hedge (the shares cannot trade, so hedging can only be done with perpetuals or by waiting until Monday). Market makers carry a whole weekend of price risk and naturally demand compensation. The premium is the price of weekend liquidity.
Do Weekend Prices Carry Information?
If weekend onchain prices are only noise, the premium is a pure cost. If they contain information, they are a signal.
We ran a test. For each weekend, we calculated the token's move from the last Friday quote of the shares to early Monday (about 3 hours before pre-market trading in the shares begins), and compared it with the gap between Friday's close and the first pre-market quote of the shares on Monday.
TSLA: Weekends: 16; Correlation: 0.88; Same direction: 94%QQQ: Weekends: 9; Correlation: 0.98; Same direction: 78%META: Weekends: 14; Correlation: 0.87; Same direction: 71%GOOGL: Weekends: 14; Correlation: 0.81; Same direction: 79%MU: Weekends: 13; Correlation: 0.81; Same direction: 69%SPY: Weekends: 15; Correlation: 0.64; Same direction: 73%NVDA: Weekends: 14; Correlation: 0.46; Same direction: 71%
Weekend onchain prices carry a great deal of information about Monday's open. TSLA is the clearest case: in 15 of 16 weekends, the direction of the token's weekend move matched the direction of the Monday gap.
Two limits need to be stated. First, the samples cover only 9 to 16 weekends, so the confidence intervals around the correlations are wide, especially for QQQ, with only 9. Second, the test shows that "weekend prices reflect weekend news," not that "weekend prices let you make money on Monday." By the time you can trade the shares in Monday's pre-market, the gap has already happened. Its usefulness lies elsewhere (see below).
What This Means for Holders
Putting the three findings together:
Spread when buying in trading hours: Stock tokens: ~3–6 bp (main tokens); Shares held at a broker: ~0–1 bpPremium when buying on weekends: Stock tokens: ~10–38 bp, wider tails; Shares held at a broker: Cannot tradePool or order-book cost: Stock tokens: 5–30 bp (pool fee), limited depth; Shares held at a broker: Almost zeroDividends: Stock tokens: Reinvested via multiplier after ~31% deduction; Shares held at a broker: Withheld per tax treaty, paid in cashTrading hours: Stock tokens: 24/7; Shares held at a broker: Market hours (some overnight sessions)Composability: Stock tokens: Can be collateral, go in pools, be hedged; Shares held at a broker: Generally not
Stock tokens are not cheaper stocks. They are more flexible stocks. The extra cost buys 24/7 trading, self-custody, and composability. Whether that is worth it depends on whether you use them.
If You Trade or Hold Stock Tokens
Always apply the multiplier first. Calibrate every price comparison and every "premium" judgment with uiMultiplier(). The contracts are public; reading one takes a single RPC call.Do not buy on weekends unless you have to. Weekend purchases cost an extra 10–38 bp on average. If you are simply building a position, wait for U.S. trading hours.Selling on weekends may actually work in your favor. The premium benefits sellers. If you hold tokens and want to trim on a weekend, the onchain premium is your gain.Treat weekend prices as intelligence, not a trading opportunity. If you will adjust positions in a brokerage account on Monday, the weekend move in the token is a more timely and more quantitative guide than the headlines.For high-dividend stocks, consider other ways to hold them first. A 31% haircut on dividends matters little for something like SPY, which yields about 1%. For stocks yielding 3–4%, it costs more than a percentage point a year.
Calibrate the ruler before reading the marks: the "persistent premium" on stock tokens is an illusion created by the dividend multiplier. The real premium is on weekends, and it is the price of 24/7 liquidity.
Sources for This Chapter
Stock-token contracts (Robinhood Chain RPC): current uiMultiplier() values and all UIMultiplierUpdated(uint256,uint256,uint256) events (November 2, 2026); contract function list (smarts source search: updateMultiplier, pause, adminBurn, pauseOracle)GeckoTerminal: hourly candles for each of the seven tokens' main USDG pools (from pool creation to November 2, 2026)Yahoo Finance: 60-minute bars (including pre-market and after-hours) and dividend records for the seven underlying stocks (May to November 2026)Dividend handling and withholding tax: descriptions in stock-token materials of the multiplier mechanism, withholding tax, and Section 871(m) (as relayed by insights4.vc, datawallet, and others)Method: hourly closes aligned to the most recent quote for the shares in the same hour; hours with less than $500 of volume excluded; points with an absolute deviation above 1,500 bp treated as bad data and excluded; weekends identified as gaps of more than 40 hours between the last Friday quote and the first Monday quote
—
This is Chapter 6 of 14 from my new book Where the Yield Comes From, serialized one chapter a day. For research only; not investment advice.
Author: Blue Lotus
#DeFi #RobinhoodChain #Stablecoins #RWA
Calibrate the Ruler First: Stock-Token Premiums and Weekend Price Discovery
If you hold or plan to hold stock tokens, this chapter answers three questions. Is the price you pay fair? Where did the dividends go? And does the onchain price on weekends carry any information?
A Conclusion We Almost Got Wrong
The most natural first step in studying stock tokens is to put the onchain price next to the price of the underlying shares. We compared GeckoTerminal's hourly candles (the SPY/USDG pool) with Yahoo Finance's 60-minute SPY bars (including pre-market and after-hours), and the first result was clear: the SPY token was almost always more expensive than the shares, with the median holding steady at about +20 basis points from mid-September. It was more expensive during trading hours, at night, and on weekends, by roughly the same amount.
That makes for a neat conclusion: there is a persistent onchain premium, and buying stock tokens costs an extra 0.2%.
The conclusion is wrong. The ruler was wrong.
How Many Shares Is One Token?
Robinhood's stock-token contracts include a function called uiMultiplier(). It returns a multiplier: how many underlying shares one token represents.
At launch, every token's multiplier was 1.0. Since then, whenever the underlying stock pays a dividend, Robinhood does not pay cash to token holders. Instead it raises the multiplier, reinvesting the dividend. We used the RPC to read the current multiplier and every change event for seven major tokens:
SPY: Current multiplier: 1.001718; Effective date: 2026-09-18; Dividend: $1.889; Dividend ÷ share price: 24.79 bp; Multiplier increase ÷ dividend yield: 0.693QQQ: Current multiplier: 1.000701; Effective date: 2026-09-22; Dividend: $0.751; Dividend ÷ share price: 10.11 bp; Multiplier increase ÷ dividend yield: 0.693NVDA: Current multiplier: 1.000775; Effective date: 2026-09-10; Dividend: $0.25; Dividend ÷ share price: 11.18 bp; Multiplier increase ÷ dividend yield: 0.694META: Current multiplier: 1.000541; Effective date: 2026-09-21; Dividend: $0.525; Dividend ÷ share price: 7.85 bp; Multiplier increase ÷ dividend yield: 0.689MU: Current multiplier: 1.000183; Effective date: Twice: Jul. 24, Oct. 14; Dividend: $0.15 each; Dividend ÷ share price: 1.57 bp (October); Multiplier increase ÷ dividend yield: 0.690GOOGL: Current multiplier: 1.000194; Effective date: 2026-09-15; Dividend: $0.22; Dividend ÷ share price: —; Multiplier increase ÷ dividend yield: —TSLA: Current multiplier: 1.0; Effective date: None; Dividend: No dividend; Dividend ÷ share price: —; Multiplier increase ÷ dividend yield: —
So after September 18, one SPY token represents 1.001718 SPY shares. Multiply the share price by this multiplier before comparing, and most of the "persistent premium" disappears (Figure 2-3).
The last column was an unexpected bonus. For all five tokens, the multiplier increase is almost exactly 0.69 times the dividend yield. In other words, about 31% of the dividend is deducted before it is reinvested. The most plausible explanation is the 30% U.S. withholding tax on dividends paid to non-U.S. persons (the stock-token offering documents mention withholding tax and Section 871(m)), plus about 1% in processing costs.
For long-term holders, this is a real cost:
SPY's annual dividend yield is about 1.0%. Token holders actually receive about 0.69%, about 0.31 percentage points less every year.An investor who opens an account in a country with a tax treaty (15% withholding) and holds SPY directly loses only about 0.15 percentage points a year.Stocks that pay no dividend (TSLA) are unaffected; high-dividend stocks are affected the most.
Stock-token dividends do not vanish. They are cut by about 30% and then quietly turned into more shares.
After Calibration: Tight in Trading Hours, a Premium Only on Weekends
After correcting for the multiplier, we recomputed all the hourly data for seven tokens from launch to November 2 (1,600 to 2,800 hours per token, excluding hours with less than $500 of volume) and grouped the data into three periods:
Trading hours: hours when U.S. shares have quotes, including pre-market and after-hours;Weekday nights: from the U.S. close to the next day's pre-market;Weekends: from the end of Friday after-hours to the start of Monday pre-market.
SPY (USDG 0.3%): Trading hours: +6.0 bp; Weekday nights: +11.0 bp; Weekends: +11.8 bp; Weekend P95: 83 bpQQQ (USDG 0.05%): Trading hours: +4.0 bp; Weekday nights: +5.9 bp; Weekends: +13.3 bp; Weekend P95: 88 bpNVDA (USDG 0.05%): Trading hours: +4.0 bp; Weekday nights: +12.7 bp; Weekends: +27.1 bp; Weekend P95: 258 bpGOOGL (USDG 0.05%): Trading hours: +4.2 bp; Weekday nights: +12.6 bp; Weekends: +9.8 bp; Weekend P95: 143 bpMETA (USDG 0.3%): Trading hours: +2.8 bp; Weekday nights: +1.7 bp; Weekends: −1.0 bp; Weekend P95: 147 bpTSLA (USDG 0.3%): Trading hours: +14.0 bp; Weekday nights: +22.3 bp; Weekends: +37.5 bp; Weekend P95: 150 bpMU (USDG 0.3%): Trading hours: +13.3 bp; Weekday nights: +35.3 bp; Weekends: +25.3 bp; Weekend P95: 321 bp
(Values are median deviations of the token price from the shares, after multiplier correction. P95 is the 95th percentile of the absolute deviation.)
Three conclusions:
1. Spreads during trading hours are tight. When U.S. shares are quoted, the main tokens deviate by a median of only 3–6 bp, a fraction of the pool fee. This shows that arbitrageurs are watching: when the shares can trade, token prices are pulled in close. TSLA and MU are slightly wider (about 13–14 bp); their main pools charge 0.3%, which raises the bar for arbitrage.
2. There is a real premium while the market is closed. After correction, the weekend premium actually comes into view: about 27 bp for NVDA, about 38 bp for TSLA, about 25 bp for MU, and about 12–13 bp for SPY and QQQ. META is the exception, with a median weekend deviation near zero.
3. The tails are wide. The 95th percentile of weekend deviation is about 83 bp for SPY and more than 250 bp for NVDA and MU. In other words, in one of every twenty weekend hours, the price deviates by more than that.
Why is there a weekend premium? The most direct explanation is one-sided demand. When U.S. markets are closed, anyone who wants to buy can only buy onchain, and few market makers can hedge (the shares cannot trade, so hedging can only be done with perpetuals or by waiting until Monday). Market makers carry a whole weekend of price risk and naturally demand compensation. The premium is the price of weekend liquidity.
Do Weekend Prices Carry Information?
If weekend onchain prices are only noise, the premium is a pure cost. If they contain information, they are a signal.
We ran a test. For each weekend, we calculated the token's move from the last Friday quote of the shares to early Monday (about 3 hours before pre-market trading in the shares begins), and compared it with the gap between Friday's close and the first pre-market quote of the shares on Monday.
TSLA: Weekends: 16; Correlation: 0.88; Same direction: 94%QQQ: Weekends: 9; Correlation: 0.98; Same direction: 78%META: Weekends: 14; Correlation: 0.87; Same direction: 71%GOOGL: Weekends: 14; Correlation: 0.81; Same direction: 79%MU: Weekends: 13; Correlation: 0.81; Same direction: 69%SPY: Weekends: 15; Correlation: 0.64; Same direction: 73%NVDA: Weekends: 14; Correlation: 0.46; Same direction: 71%
Weekend onchain prices carry a great deal of information about Monday's open. TSLA is the clearest case: in 15 of 16 weekends, the direction of the token's weekend move matched the direction of the Monday gap.
Two limits need to be stated. First, the samples cover only 9 to 16 weekends, so the confidence intervals around the correlations are wide, especially for QQQ, with only 9. Second, the test shows that "weekend prices reflect weekend news," not that "weekend prices let you make money on Monday." By the time you can trade the shares in Monday's pre-market, the gap has already happened. Its usefulness lies elsewhere (see below).
What This Means for Holders
Putting the three findings together:
Spread when buying in trading hours: Stock tokens: ~3–6 bp (main tokens); Shares held at a broker: ~0–1 bpPremium when buying on weekends: Stock tokens: ~10–38 bp, wider tails; Shares held at a broker: Cannot tradePool or order-book cost: Stock tokens: 5–30 bp (pool fee), limited depth; Shares held at a broker: Almost zeroDividends: Stock tokens: Reinvested via multiplier after ~31% deduction; Shares held at a broker: Withheld per tax treaty, paid in cashTrading hours: Stock tokens: 24/7; Shares held at a broker: Market hours (some overnight sessions)Composability: Stock tokens: Can be collateral, go in pools, be hedged; Shares held at a broker: Generally not
Stock tokens are not cheaper stocks. They are more flexible stocks. The extra cost buys 24/7 trading, self-custody, and composability. Whether that is worth it depends on whether you use them.
If You Trade or Hold Stock Tokens
Always apply the multiplier first. Calibrate every price comparison and every "premium" judgment with uiMultiplier(). The contracts are public; reading one takes a single RPC call.Do not buy on weekends unless you have to. Weekend purchases cost an extra 10–38 bp on average. If you are simply building a position, wait for U.S. trading hours.Selling on weekends may actually work in your favor. The premium benefits sellers. If you hold tokens and want to trim on a weekend, the onchain premium is your gain.Treat weekend prices as intelligence, not a trading opportunity. If you will adjust positions in a brokerage account on Monday, the weekend move in the token is a more timely and more quantitative guide than the headlines.For high-dividend stocks, consider other ways to hold them first. A 31% haircut on dividends matters little for something like SPY, which yields about 1%. For stocks yielding 3–4%, it costs more than a percentage point a year.
Calibrate the ruler before reading the marks: the "persistent premium" on stock tokens is an illusion created by the dividend multiplier. The real premium is on weekends, and it is the price of 24/7 liquidity.
Sources for This Chapter
Stock-token contracts (Robinhood Chain RPC): current uiMultiplier() values and all UIMultiplierUpdated(uint256,uint256,uint256) events (November 2, 2026); contract function list (smarts source search: updateMultiplier, pause, adminBurn, pauseOracle)GeckoTerminal: hourly candles for each of the seven tokens' main USDG pools (from pool creation to November 2, 2026)Yahoo Finance: 60-minute bars (including pre-market and after-hours) and dividend records for the seven underlying stocks (May to November 2026)Dividend handling and withholding tax: descriptions in stock-token materials of the multiplier mechanism, withholding tax, and Section 871(m) (as relayed by insights4.vc, datawallet, and others)Method: hourly closes aligned to the most recent quote for the shares in the same hour; hours with less than $500 of volume excluded; points with an absolute deviation above 1,500 bp treated as bad data and excluded; weekends identified as gaps of more than 40 hours between the last Friday quote and the first Monday quote
—
This is Chapter 6 of 14 from my new book Where the Yield Comes From, serialized one chapter a day. For research only; not investment advice.
Author: Blue Lotus
#DeFi #RobinhoodChain #Stablecoins #RWA
A Conclusion We Almost Got Wrong
The most natural first step in studying stock tokens is to put the onchain price next to the price of the underlying shares. We compared GeckoTerminal's hourly candles (the SPY/USDG pool) with Yahoo Finance's 60-minute SPY bars (including pre-market and after-hours), and the first result was clear: the SPY token was almost always more expensive than the shares, with the median holding steady at about +20 basis points from mid-September. It was more expensive during trading hours, at night, and on weekends, by roughly the same amount.
That makes for a neat conclusion: there is a persistent onchain premium, and buying stock tokens costs an extra 0.2%.
The conclusion is wrong. The ruler was wrong.
How Many Shares Is One Token?
Robinhood's stock-token contracts include a function called uiMultiplier(). It returns a multiplier: how many underlying shares one token represents.
At launch, every token's multiplier was 1.0. Since then, whenever the underlying stock pays a dividend, Robinhood does not pay cash to token holders. Instead it raises the multiplier, reinvesting the dividend. We used the RPC to read the current multiplier and every change event for seven major tokens:
SPY: Current multiplier: 1.001718; Effective date: 2026-09-18; Dividend: $1.889; Dividend ÷ share price: 24.79 bp; Multiplier increase ÷ dividend yield: 0.693QQQ: Current multiplier: 1.000701; Effective date: 2026-09-22; Dividend: $0.751; Dividend ÷ share price: 10.11 bp; Multiplier increase ÷ dividend yield: 0.693NVDA: Current multiplier: 1.000775; Effective date: 2026-09-10; Dividend: $0.25; Dividend ÷ share price: 11.18 bp; Multiplier increase ÷ dividend yield: 0.694META: Current multiplier: 1.000541; Effective date: 2026-09-21; Dividend: $0.525; Dividend ÷ share price: 7.85 bp; Multiplier increase ÷ dividend yield: 0.689MU: Current multiplier: 1.000183; Effective date: Twice: Jul. 24, Oct. 14; Dividend: $0.15 each; Dividend ÷ share price: 1.57 bp (October); Multiplier increase ÷ dividend yield: 0.690GOOGL: Current multiplier: 1.000194; Effective date: 2026-09-15; Dividend: $0.22; Dividend ÷ share price: —; Multiplier increase ÷ dividend yield: —TSLA: Current multiplier: 1.0; Effective date: None; Dividend: No dividend; Dividend ÷ share price: —; Multiplier increase ÷ dividend yield: —
So after September 18, one SPY token represents 1.001718 SPY shares. Multiply the share price by this multiplier before comparing, and most of the "persistent premium" disappears (Figure 2-3).
The last column was an unexpected bonus. For all five tokens, the multiplier increase is almost exactly 0.69 times the dividend yield. In other words, about 31% of the dividend is deducted before it is reinvested. The most plausible explanation is the 30% U.S. withholding tax on dividends paid to non-U.S. persons (the stock-token offering documents mention withholding tax and Section 871(m)), plus about 1% in processing costs.
For long-term holders, this is a real cost:
SPY's annual dividend yield is about 1.0%. Token holders actually receive about 0.69%, about 0.31 percentage points less every year.An investor who opens an account in a country with a tax treaty (15% withholding) and holds SPY directly loses only about 0.15 percentage points a year.Stocks that pay no dividend (TSLA) are unaffected; high-dividend stocks are affected the most.
Stock-token dividends do not vanish. They are cut by about 30% and then quietly turned into more shares.
After Calibration: Tight in Trading Hours, a Premium Only on Weekends
After correcting for the multiplier, we recomputed all the hourly data for seven tokens from launch to November 2 (1,600 to 2,800 hours per token, excluding hours with less than $500 of volume) and grouped the data into three periods:
Trading hours: hours when U.S. shares have quotes, including pre-market and after-hours;Weekday nights: from the U.S. close to the next day's pre-market;Weekends: from the end of Friday after-hours to the start of Monday pre-market.
SPY (USDG 0.3%): Trading hours: +6.0 bp; Weekday nights: +11.0 bp; Weekends: +11.8 bp; Weekend P95: 83 bpQQQ (USDG 0.05%): Trading hours: +4.0 bp; Weekday nights: +5.9 bp; Weekends: +13.3 bp; Weekend P95: 88 bpNVDA (USDG 0.05%): Trading hours: +4.0 bp; Weekday nights: +12.7 bp; Weekends: +27.1 bp; Weekend P95: 258 bpGOOGL (USDG 0.05%): Trading hours: +4.2 bp; Weekday nights: +12.6 bp; Weekends: +9.8 bp; Weekend P95: 143 bpMETA (USDG 0.3%): Trading hours: +2.8 bp; Weekday nights: +1.7 bp; Weekends: −1.0 bp; Weekend P95: 147 bpTSLA (USDG 0.3%): Trading hours: +14.0 bp; Weekday nights: +22.3 bp; Weekends: +37.5 bp; Weekend P95: 150 bpMU (USDG 0.3%): Trading hours: +13.3 bp; Weekday nights: +35.3 bp; Weekends: +25.3 bp; Weekend P95: 321 bp
(Values are median deviations of the token price from the shares, after multiplier correction. P95 is the 95th percentile of the absolute deviation.)
Three conclusions:
1. Spreads during trading hours are tight. When U.S. shares are quoted, the main tokens deviate by a median of only 3–6 bp, a fraction of the pool fee. This shows that arbitrageurs are watching: when the shares can trade, token prices are pulled in close. TSLA and MU are slightly wider (about 13–14 bp); their main pools charge 0.3%, which raises the bar for arbitrage.
2. There is a real premium while the market is closed. After correction, the weekend premium actually comes into view: about 27 bp for NVDA, about 38 bp for TSLA, about 25 bp for MU, and about 12–13 bp for SPY and QQQ. META is the exception, with a median weekend deviation near zero.
3. The tails are wide. The 95th percentile of weekend deviation is about 83 bp for SPY and more than 250 bp for NVDA and MU. In other words, in one of every twenty weekend hours, the price deviates by more than that.
Why is there a weekend premium? The most direct explanation is one-sided demand. When U.S. markets are closed, anyone who wants to buy can only buy onchain, and few market makers can hedge (the shares cannot trade, so hedging can only be done with perpetuals or by waiting until Monday). Market makers carry a whole weekend of price risk and naturally demand compensation. The premium is the price of weekend liquidity.
Do Weekend Prices Carry Information?
If weekend onchain prices are only noise, the premium is a pure cost. If they contain information, they are a signal.
We ran a test. For each weekend, we calculated the token's move from the last Friday quote of the shares to early Monday (about 3 hours before pre-market trading in the shares begins), and compared it with the gap between Friday's close and the first pre-market quote of the shares on Monday.
TSLA: Weekends: 16; Correlation: 0.88; Same direction: 94%QQQ: Weekends: 9; Correlation: 0.98; Same direction: 78%META: Weekends: 14; Correlation: 0.87; Same direction: 71%GOOGL: Weekends: 14; Correlation: 0.81; Same direction: 79%MU: Weekends: 13; Correlation: 0.81; Same direction: 69%SPY: Weekends: 15; Correlation: 0.64; Same direction: 73%NVDA: Weekends: 14; Correlation: 0.46; Same direction: 71%
Weekend onchain prices carry a great deal of information about Monday's open. TSLA is the clearest case: in 15 of 16 weekends, the direction of the token's weekend move matched the direction of the Monday gap.
Two limits need to be stated. First, the samples cover only 9 to 16 weekends, so the confidence intervals around the correlations are wide, especially for QQQ, with only 9. Second, the test shows that "weekend prices reflect weekend news," not that "weekend prices let you make money on Monday." By the time you can trade the shares in Monday's pre-market, the gap has already happened. Its usefulness lies elsewhere (see below).
What This Means for Holders
Putting the three findings together:
Spread when buying in trading hours: Stock tokens: ~3–6 bp (main tokens); Shares held at a broker: ~0–1 bpPremium when buying on weekends: Stock tokens: ~10–38 bp, wider tails; Shares held at a broker: Cannot tradePool or order-book cost: Stock tokens: 5–30 bp (pool fee), limited depth; Shares held at a broker: Almost zeroDividends: Stock tokens: Reinvested via multiplier after ~31% deduction; Shares held at a broker: Withheld per tax treaty, paid in cashTrading hours: Stock tokens: 24/7; Shares held at a broker: Market hours (some overnight sessions)Composability: Stock tokens: Can be collateral, go in pools, be hedged; Shares held at a broker: Generally not
Stock tokens are not cheaper stocks. They are more flexible stocks. The extra cost buys 24/7 trading, self-custody, and composability. Whether that is worth it depends on whether you use them.
If You Trade or Hold Stock Tokens
Always apply the multiplier first. Calibrate every price comparison and every "premium" judgment with uiMultiplier(). The contracts are public; reading one takes a single RPC call.Do not buy on weekends unless you have to. Weekend purchases cost an extra 10–38 bp on average. If you are simply building a position, wait for U.S. trading hours.Selling on weekends may actually work in your favor. The premium benefits sellers. If you hold tokens and want to trim on a weekend, the onchain premium is your gain.Treat weekend prices as intelligence, not a trading opportunity. If you will adjust positions in a brokerage account on Monday, the weekend move in the token is a more timely and more quantitative guide than the headlines.For high-dividend stocks, consider other ways to hold them first. A 31% haircut on dividends matters little for something like SPY, which yields about 1%. For stocks yielding 3–4%, it costs more than a percentage point a year.
Calibrate the ruler before reading the marks: the "persistent premium" on stock tokens is an illusion created by the dividend multiplier. The real premium is on weekends, and it is the price of 24/7 liquidity.
Sources for This Chapter
Stock-token contracts (Robinhood Chain RPC): current uiMultiplier() values and all UIMultiplierUpdated(uint256,uint256,uint256) events (November 2, 2026); contract function list (smarts source search: updateMultiplier, pause, adminBurn, pauseOracle)GeckoTerminal: hourly candles for each of the seven tokens' main USDG pools (from pool creation to November 2, 2026)Yahoo Finance: 60-minute bars (including pre-market and after-hours) and dividend records for the seven underlying stocks (May to November 2026)Dividend handling and withholding tax: descriptions in stock-token materials of the multiplier mechanism, withholding tax, and Section 871(m) (as relayed by insights4.vc, datawallet, and others)Method: hourly closes aligned to the most recent quote for the shares in the same hour; hours with less than $500 of volume excluded; points with an absolute deviation above 1,500 bp treated as bad data and excluded; weekends identified as gaps of more than 40 hours between the last Friday quote and the first Monday quote
—
This is Chapter 6 of 14 from my new book Where the Yield Comes From, serialized one chapter a day. For research only; not investment advice.
Author: Blue Lotus
#DeFi #RobinhoodChain #Stablecoins #RWA
192
·
--
Статья
The Yield Equation: Every Return Has a PayerIf you are comparing yields onchain, this chapter gives you a tool for taking them apart: any return can be broken into six sources, and each has a specific payer. Find the payer and you know how long the return will last.
60% of the 6.56% Is a Gift
At the end of October 2026, DefiLlama was tracking 60 pools with positive yields on Robinhood Chain, holding about $970 million in total. Weighted by TVL, the average annual yield was 6.56%.
That is higher than U.S. Treasuries and higher than most bank savings accounts. But it comes with a catch: 60.1% of it is rewards, meaning subsidies paid on top by a project, a platform, or an issuer. In 35 of the 60 pools, more than half the yield came from rewards. Among the 52 small pools under $1 million, the median yield was 64%, almost all of it rewards.
Merkl is the main incentive-distribution platform on this chain. On November 2 it had 30 active campaigns on the chain, paying out about $100,000 in rewards a day.
Subsidies are not bad in themselves. A new chain needs them to bootstrap liquidity, just as a new shopping mall offers incentives to attract tenants. The problem is that investors often treat the subsidy as the return itself and forget to ask: who is paying for it, and until when?
The Yield Equation
Any onchain return can be broken into six parts:
Return = price exposure + trading fees + lending spread + basis and price gaps + subsidies + risk premium
Price exposure: Payer: Future buyers (and the asset's fundamentals); Durability: Depends on the asset; Example on this chain: Holding stock tokens or launchpad tokensTrading fees: Payer: Traders; Durability: Moves with volume; Example on this chain: Fee income for DEX LPsLending spread: Payer: Borrowers; Durability: Moves with borrowing demand; Example on this chain: Morpho deposit interest, Spark savingsBasis and price gaps: Payer: People willing to pay for leverage or time; Durability: Moves with market sentiment; Example on this chain: Perpetual funding, weekend premiumsSubsidies: Payer: Projects, platforms, issuers; Durability: Has an expiry date; Example on this chain: Merkl rewards, Robinhood Earn's extra 3%Risk premium: Payer: You (for carrying a risk others will not); Durability: Lasts until the risk materializes; Example on this chain: Credit spreads on yield-bearing dollars, high yields in small pools
The most important column is the third. The first four terms come from the market: as long as people trade, borrow, and lever up, someone pays. They fluctuate, but they do not stop on a schedule. The fifth term, subsidies, has an expiry date. The sixth, the risk premium, looks like a return, but it is really you being paid to bear a loss that has not happened yet.
Applying the Equation: Robinhood Earn's 7%
Robinhood Earn advertises a yield of about 7% to U.S. users. On November 2, DefiLlama read the Steakhouse USDG vault behind it at 7.17%: 4.06% base interest and 3.10% rewards.
The 3.10% reward is easy to classify. It comes from a "[Robinhood Users Only]" campaign on Merkl with a budget of $115 million, valid until July 1, 2027. The payer is Robinhood itself, distributing through Merkl. It is a subsidy.
The 4.06% base interest looks like a lending spread: the vault lends USDG to borrowers on Morpho, and the borrowers pay interest. But push one step further. Where does the borrowers' money come from?
The vault's funds sit in four markets, separated by collateral:
USDe (Ethena): Borrowed: ~$311 million; What borrowers do with the money: Buy more USDe and post it again (looping); Borrowers' source of income: The ~5% reward Ethena pays on collateral in this marketsyrupUSDG (Maple): Borrowed: ~$92 million; What borrowers do with the money: Looping; Borrowers' source of income: Interest from Maple's institutional lendingmGLO (Midas): Borrowed: ~$45 million; What borrowers do with the money: Looping; Borrowers' source of income: Fund returnsspUSDG (Spark): Borrowed: ~$10 million; What borrowers do with the money: Looping; Borrowers' source of income: Spark's savings rate
The USDe on this chain is not the yield-bearing version, so as collateral it earns nothing on its own. Borrowers in the USDe market are willing to pay about 4.4% to borrow USDG because Ethena pays an extra reward of about 5% on collateral in this market. (It is a Merkl campaign whose funding address renews it every week, without a break since July 2.) The borrowers pass most of that reward on to lenders in the form of interest.
In other words, about two-thirds of Earn's base interest is also a subsidy when traced to its source. The payer has simply changed from Robinhood to Ethena.
As a rough calculation weighted by amounts borrowed, the 7.17% breaks down into:
Robinhood's subsidy: 3.10%, or 43%;Ethena's subsidy (passed through by borrowers): about 2.7%, or about 37%;Genuine borrowing demand (credit and fund returns behind the Maple, Midas, and Spark collateral): about 1.4%, or about 19%.
Chapter 5 draws this whole chain out in full. For now, remember the equation's conclusion: a number that looks like lending interest may be two layers of subsidy stacked on top of each other.
Applying It to Other Products
The same method applied to the main yield products on the chain (readings from early November):
Spark Savings USDG: 3.8%. The yield comes from Spark's savings rate, backed by asset returns in the Sky ecosystem. There are no Merkl rewards. It is a lending spread, and one of the few numbers on this chain you can use directly as an "unsubsidized benchmark."
Midas's USDC yield product: 7.48% (6.46% 30-day average). The yield comes from the fund's portfolio. There is no subsidy, but there is a risk premium: you carry the fund's investment risk and redemption terms, not the risk of a lending protocol.
Mellow rUSDG: about 9.65%. About $1 million in size. Its yield is more than 5 percentage points above the benchmark. Read the strategy carefully before judging it; under the equation, it belongs in the "risk premium, to be confirmed" category.
Morpho markets with stock tokens as collateral: deposit rates of 18–26%. Markets that lend USDG against NVDA, GOOGL, AAPL, and SPCX are each between $200,000 and $700,000 in size, with utilization of 85–91%. The high rates come from real borrowing demand (people willing to pay 21–29% to borrow dollars and hold stock tokens on leverage), but the markets are tiny, and a single deposit of yours is enough to push the rate down. These are lending spread + risk premium.
Uniswap V4 stock-pair pools (SPY/NVDA, SPY/TSLA, and others): 6–76% headline. Rewards are paid in UNI through Merkl, a few hundred dollars per pool per day. These are trading fees + subsidies, and the fee part can only be worked out by replaying volume (Chapter 7).
Triple-digit yields in small pools: about 404% on Ekubo ETH/USDG, about 173% on Alandale's TSLA/USDG. They hold only tens of thousands of dollars, and 100% of the yield is rewards. These are subsidies, and the smallest kind, the easiest for a single person to dilute.
Lighter perpetual funding: longs pay 3.4–7.6% annualized. Shorts collect it. This is basis, and the payers are traders willing to pay for leveraged long exposure to stocks (Chapter 8).
Three Corollaries
Corollary 1: the subsidy rate is inversely proportional to size. The higher a pool's headline yield, the smaller it is and the larger the share of subsidy. This is no coincidence. The total subsidy is fixed (a few hundred dollars a day), so the smaller the pool, the more subsidy each dollar receives. The moment you enter, you are diluting it yourself.
Corollary 2: the true unsubsidized benchmark on this chain is 3.5–4%. Spark's 3.8%, the Steakhouse vault's roughly 4% after stripping out Robinhood's reward (part of which is still Ethena's indirect subsidy), and the lower bound of Lighter funding at about 3.5% (see Chapter 8): these independent numbers all fall in the same range. Anything above it is either subsidy or risk premium.
Corollary 3: every subsidy eventually tapers; the only question is how fast. Chapter 10 measures the "subsidy half-life": how quickly money and yields fall back once rewards are cut.
If You Are Comparing Yields
Break every yield into the six terms of the equation. Anything you cannot break down, treat as subsidy or risk premium for now.Use 3.5–4% as the baseline. For every percentage point above the baseline, you should be able to say who is paying for it.Put subsidy end dates on your calendar. The start and end dates of every Merkl campaign are public; the budget behind Robinhood Earn is valid until July 1, 2027.Treat high yields in small pools as a one-off bonus. They do not scale up with your money; your money dilutes them.
There is no free yield onchain, only payers you have not found yet. Find them and you will know when the yield ends.
Sources for This Chapter
DefiLlama yields API (apy, apyBase, apyReward, and tvlUsd for every yield pool on Robinhood Chain, October 29, 2026; daily history for the Steakhouse vault, Spark, and Midas through November 2, 2026)Merkl v4 API (opportunities and campaigns: campaign names, funding addresses, budgets, start and end dates; total rewards for the day, November 2, 2026)Morpho GraphQL API (amounts borrowed and rates in the four stablecoin looping markets, November 2, 2026)Lighter Robinhood instance fundings (hourly funding, June 30 to November 2, 2026)
—
This is Chapter 4 of 14 from my new book Where the Yield Comes From, serialized one chapter a day. For research only; not investment advice.
Author: Blue Lotus
#DeFi #RobinhoodChain #Stablecoins #RWA
The Yield Equation: Every Return Has a Payer
If you are comparing yields onchain, this chapter gives you a tool for taking them apart: any return can be broken into six sources, and each has a specific payer. Find the payer and you know how long the return will last.
60% of the 6.56% Is a Gift
At the end of October 2026, DefiLlama was tracking 60 pools with positive yields on Robinhood Chain, holding about $970 million in total. Weighted by TVL, the average annual yield was 6.56%.
That is higher than U.S. Treasuries and higher than most bank savings accounts. But it comes with a catch: 60.1% of it is rewards, meaning subsidies paid on top by a project, a platform, or an issuer. In 35 of the 60 pools, more than half the yield came from rewards. Among the 52 small pools under $1 million, the median yield was 64%, almost all of it rewards.
Merkl is the main incentive-distribution platform on this chain. On November 2 it had 30 active campaigns on the chain, paying out about $100,000 in rewards a day.
Subsidies are not bad in themselves. A new chain needs them to bootstrap liquidity, just as a new shopping mall offers incentives to attract tenants. The problem is that investors often treat the subsidy as the return itself and forget to ask: who is paying for it, and until when?
The Yield Equation
Any onchain return can be broken into six parts:
Return = price exposure + trading fees + lending spread + basis and price gaps + subsidies + risk premium
Price exposure: Payer: Future buyers (and the asset's fundamentals); Durability: Depends on the asset; Example on this chain: Holding stock tokens or launchpad tokensTrading fees: Payer: Traders; Durability: Moves with volume; Example on this chain: Fee income for DEX LPsLending spread: Payer: Borrowers; Durability: Moves with borrowing demand; Example on this chain: Morpho deposit interest, Spark savingsBasis and price gaps: Payer: People willing to pay for leverage or time; Durability: Moves with market sentiment; Example on this chain: Perpetual funding, weekend premiumsSubsidies: Payer: Projects, platforms, issuers; Durability: Has an expiry date; Example on this chain: Merkl rewards, Robinhood Earn's extra 3%Risk premium: Payer: You (for carrying a risk others will not); Durability: Lasts until the risk materializes; Example on this chain: Credit spreads on yield-bearing dollars, high yields in small pools
The most important column is the third. The first four terms come from the market: as long as people trade, borrow, and lever up, someone pays. They fluctuate, but they do not stop on a schedule. The fifth term, subsidies, has an expiry date. The sixth, the risk premium, looks like a return, but it is really you being paid to bear a loss that has not happened yet.
Applying the Equation: Robinhood Earn's 7%
Robinhood Earn advertises a yield of about 7% to U.S. users. On November 2, DefiLlama read the Steakhouse USDG vault behind it at 7.17%: 4.06% base interest and 3.10% rewards.
The 3.10% reward is easy to classify. It comes from a "[Robinhood Users Only]" campaign on Merkl with a budget of $115 million, valid until July 1, 2027. The payer is Robinhood itself, distributing through Merkl. It is a subsidy.
The 4.06% base interest looks like a lending spread: the vault lends USDG to borrowers on Morpho, and the borrowers pay interest. But push one step further. Where does the borrowers' money come from?
The vault's funds sit in four markets, separated by collateral:
USDe (Ethena): Borrowed: ~$311 million; What borrowers do with the money: Buy more USDe and post it again (looping); Borrowers' source of income: The ~5% reward Ethena pays on collateral in this marketsyrupUSDG (Maple): Borrowed: ~$92 million; What borrowers do with the money: Looping; Borrowers' source of income: Interest from Maple's institutional lendingmGLO (Midas): Borrowed: ~$45 million; What borrowers do with the money: Looping; Borrowers' source of income: Fund returnsspUSDG (Spark): Borrowed: ~$10 million; What borrowers do with the money: Looping; Borrowers' source of income: Spark's savings rate
The USDe on this chain is not the yield-bearing version, so as collateral it earns nothing on its own. Borrowers in the USDe market are willing to pay about 4.4% to borrow USDG because Ethena pays an extra reward of about 5% on collateral in this market. (It is a Merkl campaign whose funding address renews it every week, without a break since July 2.) The borrowers pass most of that reward on to lenders in the form of interest.
In other words, about two-thirds of Earn's base interest is also a subsidy when traced to its source. The payer has simply changed from Robinhood to Ethena.
As a rough calculation weighted by amounts borrowed, the 7.17% breaks down into:
Robinhood's subsidy: 3.10%, or 43%;Ethena's subsidy (passed through by borrowers): about 2.7%, or about 37%;Genuine borrowing demand (credit and fund returns behind the Maple, Midas, and Spark collateral): about 1.4%, or about 19%.
Chapter 5 draws this whole chain out in full. For now, remember the equation's conclusion: a number that looks like lending interest may be two layers of subsidy stacked on top of each other.
Applying It to Other Products
The same method applied to the main yield products on the chain (readings from early November):
Spark Savings USDG: 3.8%. The yield comes from Spark's savings rate, backed by asset returns in the Sky ecosystem. There are no Merkl rewards. It is a lending spread, and one of the few numbers on this chain you can use directly as an "unsubsidized benchmark."
Midas's USDC yield product: 7.48% (6.46% 30-day average). The yield comes from the fund's portfolio. There is no subsidy, but there is a risk premium: you carry the fund's investment risk and redemption terms, not the risk of a lending protocol.
Mellow rUSDG: about 9.65%. About $1 million in size. Its yield is more than 5 percentage points above the benchmark. Read the strategy carefully before judging it; under the equation, it belongs in the "risk premium, to be confirmed" category.
Morpho markets with stock tokens as collateral: deposit rates of 18–26%. Markets that lend USDG against NVDA, GOOGL, AAPL, and SPCX are each between $200,000 and $700,000 in size, with utilization of 85–91%. The high rates come from real borrowing demand (people willing to pay 21–29% to borrow dollars and hold stock tokens on leverage), but the markets are tiny, and a single deposit of yours is enough to push the rate down. These are lending spread + risk premium.
Uniswap V4 stock-pair pools (SPY/NVDA, SPY/TSLA, and others): 6–76% headline. Rewards are paid in UNI through Merkl, a few hundred dollars per pool per day. These are trading fees + subsidies, and the fee part can only be worked out by replaying volume (Chapter 7).
Triple-digit yields in small pools: about 404% on Ekubo ETH/USDG, about 173% on Alandale's TSLA/USDG. They hold only tens of thousands of dollars, and 100% of the yield is rewards. These are subsidies, and the smallest kind, the easiest for a single person to dilute.
Lighter perpetual funding: longs pay 3.4–7.6% annualized. Shorts collect it. This is basis, and the payers are traders willing to pay for leveraged long exposure to stocks (Chapter 8).
Three Corollaries
Corollary 1: the subsidy rate is inversely proportional to size. The higher a pool's headline yield, the smaller it is and the larger the share of subsidy. This is no coincidence. The total subsidy is fixed (a few hundred dollars a day), so the smaller the pool, the more subsidy each dollar receives. The moment you enter, you are diluting it yourself.
Corollary 2: the true unsubsidized benchmark on this chain is 3.5–4%. Spark's 3.8%, the Steakhouse vault's roughly 4% after stripping out Robinhood's reward (part of which is still Ethena's indirect subsidy), and the lower bound of Lighter funding at about 3.5% (see Chapter 8): these independent numbers all fall in the same range. Anything above it is either subsidy or risk premium.
Corollary 3: every subsidy eventually tapers; the only question is how fast. Chapter 10 measures the "subsidy half-life": how quickly money and yields fall back once rewards are cut.
If You Are Comparing Yields
Break every yield into the six terms of the equation. Anything you cannot break down, treat as subsidy or risk premium for now.Use 3.5–4% as the baseline. For every percentage point above the baseline, you should be able to say who is paying for it.Put subsidy end dates on your calendar. The start and end dates of every Merkl campaign are public; the budget behind Robinhood Earn is valid until July 1, 2027.Treat high yields in small pools as a one-off bonus. They do not scale up with your money; your money dilutes them.
There is no free yield onchain, only payers you have not found yet. Find them and you will know when the yield ends.
Sources for This Chapter
DefiLlama yields API (apy, apyBase, apyReward, and tvlUsd for every yield pool on Robinhood Chain, October 29, 2026; daily history for the Steakhouse vault, Spark, and Midas through November 2, 2026)Merkl v4 API (opportunities and campaigns: campaign names, funding addresses, budgets, start and end dates; total rewards for the day, November 2, 2026)Morpho GraphQL API (amounts borrowed and rates in the four stablecoin looping markets, November 2, 2026)Lighter Robinhood instance fundings (hourly funding, June 30 to November 2, 2026)
—
This is Chapter 4 of 14 from my new book Where the Yield Comes From, serialized one chapter a day. For research only; not investment advice.
Author: Blue Lotus
#DeFi #RobinhoodChain #Stablecoins #RWA
60% of the 6.56% Is a Gift
At the end of October 2026, DefiLlama was tracking 60 pools with positive yields on Robinhood Chain, holding about $970 million in total. Weighted by TVL, the average annual yield was 6.56%.
That is higher than U.S. Treasuries and higher than most bank savings accounts. But it comes with a catch: 60.1% of it is rewards, meaning subsidies paid on top by a project, a platform, or an issuer. In 35 of the 60 pools, more than half the yield came from rewards. Among the 52 small pools under $1 million, the median yield was 64%, almost all of it rewards.
Merkl is the main incentive-distribution platform on this chain. On November 2 it had 30 active campaigns on the chain, paying out about $100,000 in rewards a day.
Subsidies are not bad in themselves. A new chain needs them to bootstrap liquidity, just as a new shopping mall offers incentives to attract tenants. The problem is that investors often treat the subsidy as the return itself and forget to ask: who is paying for it, and until when?
The Yield Equation
Any onchain return can be broken into six parts:
Return = price exposure + trading fees + lending spread + basis and price gaps + subsidies + risk premium
Price exposure: Payer: Future buyers (and the asset's fundamentals); Durability: Depends on the asset; Example on this chain: Holding stock tokens or launchpad tokensTrading fees: Payer: Traders; Durability: Moves with volume; Example on this chain: Fee income for DEX LPsLending spread: Payer: Borrowers; Durability: Moves with borrowing demand; Example on this chain: Morpho deposit interest, Spark savingsBasis and price gaps: Payer: People willing to pay for leverage or time; Durability: Moves with market sentiment; Example on this chain: Perpetual funding, weekend premiumsSubsidies: Payer: Projects, platforms, issuers; Durability: Has an expiry date; Example on this chain: Merkl rewards, Robinhood Earn's extra 3%Risk premium: Payer: You (for carrying a risk others will not); Durability: Lasts until the risk materializes; Example on this chain: Credit spreads on yield-bearing dollars, high yields in small pools
The most important column is the third. The first four terms come from the market: as long as people trade, borrow, and lever up, someone pays. They fluctuate, but they do not stop on a schedule. The fifth term, subsidies, has an expiry date. The sixth, the risk premium, looks like a return, but it is really you being paid to bear a loss that has not happened yet.
Applying the Equation: Robinhood Earn's 7%
Robinhood Earn advertises a yield of about 7% to U.S. users. On November 2, DefiLlama read the Steakhouse USDG vault behind it at 7.17%: 4.06% base interest and 3.10% rewards.
The 3.10% reward is easy to classify. It comes from a "[Robinhood Users Only]" campaign on Merkl with a budget of $115 million, valid until July 1, 2027. The payer is Robinhood itself, distributing through Merkl. It is a subsidy.
The 4.06% base interest looks like a lending spread: the vault lends USDG to borrowers on Morpho, and the borrowers pay interest. But push one step further. Where does the borrowers' money come from?
The vault's funds sit in four markets, separated by collateral:
USDe (Ethena): Borrowed: ~$311 million; What borrowers do with the money: Buy more USDe and post it again (looping); Borrowers' source of income: The ~5% reward Ethena pays on collateral in this marketsyrupUSDG (Maple): Borrowed: ~$92 million; What borrowers do with the money: Looping; Borrowers' source of income: Interest from Maple's institutional lendingmGLO (Midas): Borrowed: ~$45 million; What borrowers do with the money: Looping; Borrowers' source of income: Fund returnsspUSDG (Spark): Borrowed: ~$10 million; What borrowers do with the money: Looping; Borrowers' source of income: Spark's savings rate
The USDe on this chain is not the yield-bearing version, so as collateral it earns nothing on its own. Borrowers in the USDe market are willing to pay about 4.4% to borrow USDG because Ethena pays an extra reward of about 5% on collateral in this market. (It is a Merkl campaign whose funding address renews it every week, without a break since July 2.) The borrowers pass most of that reward on to lenders in the form of interest.
In other words, about two-thirds of Earn's base interest is also a subsidy when traced to its source. The payer has simply changed from Robinhood to Ethena.
As a rough calculation weighted by amounts borrowed, the 7.17% breaks down into:
Robinhood's subsidy: 3.10%, or 43%;Ethena's subsidy (passed through by borrowers): about 2.7%, or about 37%;Genuine borrowing demand (credit and fund returns behind the Maple, Midas, and Spark collateral): about 1.4%, or about 19%.
Chapter 5 draws this whole chain out in full. For now, remember the equation's conclusion: a number that looks like lending interest may be two layers of subsidy stacked on top of each other.
Applying It to Other Products
The same method applied to the main yield products on the chain (readings from early November):
Spark Savings USDG: 3.8%. The yield comes from Spark's savings rate, backed by asset returns in the Sky ecosystem. There are no Merkl rewards. It is a lending spread, and one of the few numbers on this chain you can use directly as an "unsubsidized benchmark."
Midas's USDC yield product: 7.48% (6.46% 30-day average). The yield comes from the fund's portfolio. There is no subsidy, but there is a risk premium: you carry the fund's investment risk and redemption terms, not the risk of a lending protocol.
Mellow rUSDG: about 9.65%. About $1 million in size. Its yield is more than 5 percentage points above the benchmark. Read the strategy carefully before judging it; under the equation, it belongs in the "risk premium, to be confirmed" category.
Morpho markets with stock tokens as collateral: deposit rates of 18–26%. Markets that lend USDG against NVDA, GOOGL, AAPL, and SPCX are each between $200,000 and $700,000 in size, with utilization of 85–91%. The high rates come from real borrowing demand (people willing to pay 21–29% to borrow dollars and hold stock tokens on leverage), but the markets are tiny, and a single deposit of yours is enough to push the rate down. These are lending spread + risk premium.
Uniswap V4 stock-pair pools (SPY/NVDA, SPY/TSLA, and others): 6–76% headline. Rewards are paid in UNI through Merkl, a few hundred dollars per pool per day. These are trading fees + subsidies, and the fee part can only be worked out by replaying volume (Chapter 7).
Triple-digit yields in small pools: about 404% on Ekubo ETH/USDG, about 173% on Alandale's TSLA/USDG. They hold only tens of thousands of dollars, and 100% of the yield is rewards. These are subsidies, and the smallest kind, the easiest for a single person to dilute.
Lighter perpetual funding: longs pay 3.4–7.6% annualized. Shorts collect it. This is basis, and the payers are traders willing to pay for leveraged long exposure to stocks (Chapter 8).
Three Corollaries
Corollary 1: the subsidy rate is inversely proportional to size. The higher a pool's headline yield, the smaller it is and the larger the share of subsidy. This is no coincidence. The total subsidy is fixed (a few hundred dollars a day), so the smaller the pool, the more subsidy each dollar receives. The moment you enter, you are diluting it yourself.
Corollary 2: the true unsubsidized benchmark on this chain is 3.5–4%. Spark's 3.8%, the Steakhouse vault's roughly 4% after stripping out Robinhood's reward (part of which is still Ethena's indirect subsidy), and the lower bound of Lighter funding at about 3.5% (see Chapter 8): these independent numbers all fall in the same range. Anything above it is either subsidy or risk premium.
Corollary 3: every subsidy eventually tapers; the only question is how fast. Chapter 10 measures the "subsidy half-life": how quickly money and yields fall back once rewards are cut.
If You Are Comparing Yields
Break every yield into the six terms of the equation. Anything you cannot break down, treat as subsidy or risk premium for now.Use 3.5–4% as the baseline. For every percentage point above the baseline, you should be able to say who is paying for it.Put subsidy end dates on your calendar. The start and end dates of every Merkl campaign are public; the budget behind Robinhood Earn is valid until July 1, 2027.Treat high yields in small pools as a one-off bonus. They do not scale up with your money; your money dilutes them.
There is no free yield onchain, only payers you have not found yet. Find them and you will know when the yield ends.
Sources for This Chapter
DefiLlama yields API (apy, apyBase, apyReward, and tvlUsd for every yield pool on Robinhood Chain, October 29, 2026; daily history for the Steakhouse vault, Spark, and Midas through November 2, 2026)Merkl v4 API (opportunities and campaigns: campaign names, funding addresses, budgets, start and end dates; total rewards for the day, November 2, 2026)Morpho GraphQL API (amounts borrowed and rates in the four stablecoin looping markets, November 2, 2026)Lighter Robinhood instance fundings (hourly funding, June 30 to November 2, 2026)
—
This is Chapter 4 of 14 from my new book Where the Yield Comes From, serialized one chapter a day. For research only; not investment advice.
Author: Blue Lotus
#DeFi #RobinhoodChain #Stablecoins #RWA
211
·
--
Статья
Round-Trip Costs and Access: What It Costs to Move Money Onchain and BackIf you are comparing "buying stocks at a broker," "holding dollars in the Robinhood app," and "running your own strategy onchain," this chapter works out two things: the full cost of moving money onchain and back off again, and which assets your region actually lets you touch.
Gas Is Not the Expensive Part
When people think about onchain costs, their first thought is gas. On Robinhood Chain, it is the last thing to worry about.
On November 2, the chain's base fee was about 0.02 gwei. An ordinary swap uses about 200,000 gas; with ETH at about $2,270, that comes to less than one cent. On top of that, swaps inside Robinhood Wallet are gas-free until December 31, 2026 (the waiver was originally due to expire on September 29 and was extended).
The real costs hide in three other places: bridging, slippage, and spreads. They are charged in proportion to the amount, so the more money you move and the more often you move it, the bigger the difference.
Leg One: Getting Onchain
There are three ways to get money onto Robinhood Chain:
Inside the Robinhood app. Eligible U.S. users buy USDG in the app and deposit it into Earn. The funds go into a self-custody wallet built into the app. Users barely notice this path.Robinhood Wallet. In supported countries and regions, users can transfer crypto assets into Wallet and then swap onchain.Bridges. Stablecoins are bridged over from Ethereum, Base, Arbitrum, and other chains.
The cost of the third path can be measured precisely. Using Relay's public quote API, we requested quotes for four amounts on November 2:
Base USDC → USDG onchain: $1,000: ~6 bp; $10,000: ~6 bp; $100,000: ~6 bp; $1 million: Quote refused; Arrival time: ~1 secondEthereum USDC → USDG onchain: $1,000: ~6 bp; $10,000: ~6 bp; $100,000: ~6 bp; $1 million: Quote refused; Arrival time: ~1–24 secondsArbitrum USDC → USDG onchain: $1,000: ~6 bp; $10,000: ~6 bp; $100,000: ~6 bp; $1 million: Quote refused; Arrival time: ~1 secondUSDG onchain → Base USDC: $1,000: ~6 bp; $10,000: ~6 bp; $100,000: ~6 bp; $1 million: ~10 bp; Arrival time: ~2 seconds
(bp means basis points; 1 bp = 0.01%. Cost = 1 − (amount received ÷ amount paid), including a relay fee of about 2.2 bp and the price loss on the USDC/USDG swap.)
Two details stand out:
Deposits are capped. Relay refuses to quote any single deposit above $500,000, so large amounts must be split or sent through another channel. In the withdrawal direction, $1 million can be quoted, at a cost of about 10 bp.Bridges do not touch stock tokens. Requests to swap USDG for SPY, NVDA, or TSLA all came back "unsupported currency." Stock tokens can only be traded on the chain's DEXs, the Lighter order book, or the Arcus request-for-quote system.
Leg Two: Swapping Into the Asset You Want
If what you want is USDG itself, to deposit in Earn or lend out, the trip ends once you are onchain. If you want stock tokens or a perpetual position, you pay a cost again.
There are three places on this chain to buy stock exposure, and their depth differs enormously. On November 2 we read the Lighter order books and calculated the average cost, relative to the best price, of taking liquidity in one go up to a given amount:
Lighter SPY perpetual: $10,000: 0.4 bp; $100,000: 0.7 bp; $1 million: 12.4 bp; Bid-ask spread: 0.9 bpLighter QQQ perpetual: $10,000: 0.5 bp; $100,000: 0.9 bp; $1 million: 17.5 bp; Bid-ask spread: 1.4 bpLighter NVDA perpetual: $10,000: 1.1 bp; $100,000: 2.1 bp; $1 million: 25.6 bp; Bid-ask spread: 1.0 bpLighter SPY spot: $10,000: 1.9 bp; $100,000: 29.1 bp; $1 million: Cannot fill; Bid-ask spread: 0.8 bpLighter NVDA spot: $10,000: 0; $100,000: 14.2 bp; $1 million: Cannot fill; Bid-ask spread: 6.3 bpLighter AAPL spot: $10,000: 0.8 bp; $100,000: 530 bp; $1 million: Cannot fill; Bid-ask spread: 10.0 bp
Perpetual order books are more than an order of magnitude deeper than spot tokens. Taking $100,000 of SPY perpetual costs less than 1 basis point. The same amount of the SPY spot token costs about 29 basis points, and $100,000 of the AAPL spot token pushes the price up by more than 5%. On top of that, Lighter charges no fees on either side on this chain (maker and taker fees are zero across all 63 perpetual markets).
DEX pools are thinner still. In the main stock-token pools tracked by GeckoTerminal (SPY, NVDA, TSLA, QQQ, and GOOGL against USDG), the median of the last 300 trades ranged from $107 to $735, and the largest trade was about $12,000. These pools charge fees from 0.05% to 0.3%, so buying also costs one pool fee (5–30 bp) up front.
The conclusion: on this chain, retail-sized amounts (a few thousand dollars) can trade anywhere. Stock exposure of a few hundred thousand dollars or more can be absorbed almost only by the perpetual order books.
Leg Three: The Price Gap, or Are You Paying Fair Value?
Stock tokens carry one more hidden cost: the price you trade at may itself deviate from the underlying stock. Chapter 6 analyzes this in detail; here are just the conclusions (medians, after correcting for the token multiplier):
During U.S. trading hours, the main stock tokens deviate from the shares by only 3–6 bp (about 13–14 bp for TSLA and MU).On weekends, tokens are on average 10–38 bp more expensive, and at certain hours more than 100 bp.
In other words, if you buy on the weekend and sell on Monday, you are very likely paying for the privilege of trading on weekends. Conversely, if you must rebalance on a weekend, that premium is the price you pay for 24/7 liquidity.
Adding Up the Three Legs: A Round-Trip Cost Table
Add the three legs together, getting onchain, swapping, and getting off, and you have the cost of one full round trip. The table below assumes $10,000, bridged in and out yourself. (It excludes conversions inside the app, which may carry their own fees; go by what the app shows.)
Deposit USDG for interest: On: 6 bp; Swap (buy + sell): 0; Price gap: 0; Off: 6 bp; Round trip: ~12 bpBuy SPY spot token (DEX, trading hours): On: 6 bp; Swap (buy + sell): ~60 bp (0.3% pool, twice); Price gap: ~6 bp; Off: 6 bp; Round trip: ~80 bpBuy SPY spot token (Lighter order book): On: 6 bp; Swap (buy + sell): ~4 bp; Price gap: ~6 bp; Off: 6 bp; Round trip: ~20 bpSPY perpetual (Lighter): On: 6 bp; Swap (buy + sell): ~1 bp; Price gap: 0; Off: 6 bp; Round trip: ~13 bp + funding
Divide a strategy's round-trip cost by its annual yield and you get the break-even period: how long you must hold before the return covers the cost of getting in and out.
Depositing USDG for interest: base interest of about 4%, a 12 bp round trip, break-even in about 11 days. For a Robinhood user earning 7%, about 6 days.Going long SPY with a perpetual: there is no interest income; instead you pay funding (an annualized 4.5–5.7%, Chapter 8), so the longer you hold, the more it costs.Buying a spot token on a DEX: a round trip of about 80 bp, roughly one month of SPY's average gain (assuming a long-run annual return of about 10%).
Rule: for any strategy yielding less than 5% a year, think of the holding period in months at least. Any route with a round-trip cost above 50 bp suits only holding periods of a quarter or longer.
Access: No One Gets Everything
Costs can be calculated. Access cannot be negotiated. Robinhood's onchain products are carved up by region, and the pieces barely overlap:
Robinhood Earn (interest on USDG): U.S. users: Yes (except New York and Texas); International users outside the EU and UK: No; Notes: The 3% "Robinhood users only" reward is paid only through EarnStock tokens: U.S. users: No; International users outside the EU and UK: Yes (about 120 countries); Notes: The 10-Q lists the U.S., Canada, the UK, Switzerland, and others as restrictedPerpetuals in Wallet (Lighter): U.S. users: Planned; International users outside the EU and UK: Available in some regions; Notes: 10-Q: eligible users in selected jurisdictionsGoing onchain yourself (wallet + bridge): U.S. users: No restriction at the contract level; International users outside the EU and UK: No restriction at the contract level; Notes: But the stock-token terms still bar U.S. persons from holding them
Some consequences:
U.S. investors get the subsidy but cannot touch stock tokens. They are the only beneficiaries of Earn's 3% reward, but under the terms they cannot hold onchain stock tokens.International investors can touch stock tokens but do not get the subsidy. Depositing into the same Steakhouse vault on their own, they get only the base interest of about 4%.The contracts do not check nationality; the terms do. The stock-token contracts have no address whitelist, but Robinhood holds the power to pause them and to burn holdings as administrator (Chapter 11). For holders in regions the terms do not permit, the risk is not technical but legal and a matter of contract permissions.
Access is not a compliance footnote. It directly changes the return table: in the same vault, people in different regions earn yields 3 percentage points apart.
If You Are Planning Your Own Entries and Exits
Check access before you calculate returns. An asset your region cannot hold is irrelevant to you, however high its yield. A subsidy you can get is your most certain excess return.Move large amounts through order books, not pools. For stock exposure above $100,000, use Lighter perpetuals or the order book. Split any single deposit above $500,000 in advance.Avoid rebalancing on weekends. Unless weekend liquidity is exactly what you came for, buying and selling stock tokens during U.S. trading hours saves you 10–30 bp of premium.Screen strategies by break-even period. Divide round-trip cost by annual yield to get the number of days you must hold. A strategy works only if that is shorter than your planned holding period.
On this chain, gas is almost free. The real cost is how you move: where you come in, where you swap, and when you leave.
Sources for This Chapter
Robinhood Chain RPC eth_feeHistory (base fee, November 2, 2026)Relay quote API api.relay.link/quote (7 routes × 4 amounts, November 2, 2026)Lighter Robinhood instance orderBookOrders and orderBookDetails (order-book depth and fees, November 2, 2026)GeckoTerminal pool trade records (last 300 trades, November 2, 2026)Robinhood Form 10-Q (October 28, 2026): restricted regions for stock tokens; availability of stock tokens and perpetuals in WalletRobinhood Earn product terms and third-party summaries (NerdWallet, July 29, 2026; Upshift): Earn is open only to eligible U.S. users, excluding New York and TexasWallet gas waiver extended to December 31, 2026: CoinDesk (as relayed by crypto.news)
—
This is Chapter 3 of 14 from my new book Where the Yield Comes From, serialized one chapter a day. For research only; not investment advice.
Author: Blue Lotus
#DeFi #RobinhoodChain #Stablecoins #RWA
Round-Trip Costs and Access: What It Costs to Move Money Onchain and Back
If you are comparing "buying stocks at a broker," "holding dollars in the Robinhood app," and "running your own strategy onchain," this chapter works out two things: the full cost of moving money onchain and back off again, and which assets your region actually lets you touch.
Gas Is Not the Expensive Part
When people think about onchain costs, their first thought is gas. On Robinhood Chain, it is the last thing to worry about.
On November 2, the chain's base fee was about 0.02 gwei. An ordinary swap uses about 200,000 gas; with ETH at about $2,270, that comes to less than one cent. On top of that, swaps inside Robinhood Wallet are gas-free until December 31, 2026 (the waiver was originally due to expire on September 29 and was extended).
The real costs hide in three other places: bridging, slippage, and spreads. They are charged in proportion to the amount, so the more money you move and the more often you move it, the bigger the difference.
Leg One: Getting Onchain
There are three ways to get money onto Robinhood Chain:
Inside the Robinhood app. Eligible U.S. users buy USDG in the app and deposit it into Earn. The funds go into a self-custody wallet built into the app. Users barely notice this path.Robinhood Wallet. In supported countries and regions, users can transfer crypto assets into Wallet and then swap onchain.Bridges. Stablecoins are bridged over from Ethereum, Base, Arbitrum, and other chains.
The cost of the third path can be measured precisely. Using Relay's public quote API, we requested quotes for four amounts on November 2:
Base USDC → USDG onchain: $1,000: ~6 bp; $10,000: ~6 bp; $100,000: ~6 bp; $1 million: Quote refused; Arrival time: ~1 secondEthereum USDC → USDG onchain: $1,000: ~6 bp; $10,000: ~6 bp; $100,000: ~6 bp; $1 million: Quote refused; Arrival time: ~1–24 secondsArbitrum USDC → USDG onchain: $1,000: ~6 bp; $10,000: ~6 bp; $100,000: ~6 bp; $1 million: Quote refused; Arrival time: ~1 secondUSDG onchain → Base USDC: $1,000: ~6 bp; $10,000: ~6 bp; $100,000: ~6 bp; $1 million: ~10 bp; Arrival time: ~2 seconds
(bp means basis points; 1 bp = 0.01%. Cost = 1 − (amount received ÷ amount paid), including a relay fee of about 2.2 bp and the price loss on the USDC/USDG swap.)
Two details stand out:
Deposits are capped. Relay refuses to quote any single deposit above $500,000, so large amounts must be split or sent through another channel. In the withdrawal direction, $1 million can be quoted, at a cost of about 10 bp.Bridges do not touch stock tokens. Requests to swap USDG for SPY, NVDA, or TSLA all came back "unsupported currency." Stock tokens can only be traded on the chain's DEXs, the Lighter order book, or the Arcus request-for-quote system.
Leg Two: Swapping Into the Asset You Want
If what you want is USDG itself, to deposit in Earn or lend out, the trip ends once you are onchain. If you want stock tokens or a perpetual position, you pay a cost again.
There are three places on this chain to buy stock exposure, and their depth differs enormously. On November 2 we read the Lighter order books and calculated the average cost, relative to the best price, of taking liquidity in one go up to a given amount:
Lighter SPY perpetual: $10,000: 0.4 bp; $100,000: 0.7 bp; $1 million: 12.4 bp; Bid-ask spread: 0.9 bpLighter QQQ perpetual: $10,000: 0.5 bp; $100,000: 0.9 bp; $1 million: 17.5 bp; Bid-ask spread: 1.4 bpLighter NVDA perpetual: $10,000: 1.1 bp; $100,000: 2.1 bp; $1 million: 25.6 bp; Bid-ask spread: 1.0 bpLighter SPY spot: $10,000: 1.9 bp; $100,000: 29.1 bp; $1 million: Cannot fill; Bid-ask spread: 0.8 bpLighter NVDA spot: $10,000: 0; $100,000: 14.2 bp; $1 million: Cannot fill; Bid-ask spread: 6.3 bpLighter AAPL spot: $10,000: 0.8 bp; $100,000: 530 bp; $1 million: Cannot fill; Bid-ask spread: 10.0 bp
Perpetual order books are more than an order of magnitude deeper than spot tokens. Taking $100,000 of SPY perpetual costs less than 1 basis point. The same amount of the SPY spot token costs about 29 basis points, and $100,000 of the AAPL spot token pushes the price up by more than 5%. On top of that, Lighter charges no fees on either side on this chain (maker and taker fees are zero across all 63 perpetual markets).
DEX pools are thinner still. In the main stock-token pools tracked by GeckoTerminal (SPY, NVDA, TSLA, QQQ, and GOOGL against USDG), the median of the last 300 trades ranged from $107 to $735, and the largest trade was about $12,000. These pools charge fees from 0.05% to 0.3%, so buying also costs one pool fee (5–30 bp) up front.
The conclusion: on this chain, retail-sized amounts (a few thousand dollars) can trade anywhere. Stock exposure of a few hundred thousand dollars or more can be absorbed almost only by the perpetual order books.
Leg Three: The Price Gap, or Are You Paying Fair Value?
Stock tokens carry one more hidden cost: the price you trade at may itself deviate from the underlying stock. Chapter 6 analyzes this in detail; here are just the conclusions (medians, after correcting for the token multiplier):
During U.S. trading hours, the main stock tokens deviate from the shares by only 3–6 bp (about 13–14 bp for TSLA and MU).On weekends, tokens are on average 10–38 bp more expensive, and at certain hours more than 100 bp.
In other words, if you buy on the weekend and sell on Monday, you are very likely paying for the privilege of trading on weekends. Conversely, if you must rebalance on a weekend, that premium is the price you pay for 24/7 liquidity.
Adding Up the Three Legs: A Round-Trip Cost Table
Add the three legs together, getting onchain, swapping, and getting off, and you have the cost of one full round trip. The table below assumes $10,000, bridged in and out yourself. (It excludes conversions inside the app, which may carry their own fees; go by what the app shows.)
Deposit USDG for interest: On: 6 bp; Swap (buy + sell): 0; Price gap: 0; Off: 6 bp; Round trip: ~12 bpBuy SPY spot token (DEX, trading hours): On: 6 bp; Swap (buy + sell): ~60 bp (0.3% pool, twice); Price gap: ~6 bp; Off: 6 bp; Round trip: ~80 bpBuy SPY spot token (Lighter order book): On: 6 bp; Swap (buy + sell): ~4 bp; Price gap: ~6 bp; Off: 6 bp; Round trip: ~20 bpSPY perpetual (Lighter): On: 6 bp; Swap (buy + sell): ~1 bp; Price gap: 0; Off: 6 bp; Round trip: ~13 bp + funding
Divide a strategy's round-trip cost by its annual yield and you get the break-even period: how long you must hold before the return covers the cost of getting in and out.
Depositing USDG for interest: base interest of about 4%, a 12 bp round trip, break-even in about 11 days. For a Robinhood user earning 7%, about 6 days.Going long SPY with a perpetual: there is no interest income; instead you pay funding (an annualized 4.5–5.7%, Chapter 8), so the longer you hold, the more it costs.Buying a spot token on a DEX: a round trip of about 80 bp, roughly one month of SPY's average gain (assuming a long-run annual return of about 10%).
Rule: for any strategy yielding less than 5% a year, think of the holding period in months at least. Any route with a round-trip cost above 50 bp suits only holding periods of a quarter or longer.
Access: No One Gets Everything
Costs can be calculated. Access cannot be negotiated. Robinhood's onchain products are carved up by region, and the pieces barely overlap:
Robinhood Earn (interest on USDG): U.S. users: Yes (except New York and Texas); International users outside the EU and UK: No; Notes: The 3% "Robinhood users only" reward is paid only through EarnStock tokens: U.S. users: No; International users outside the EU and UK: Yes (about 120 countries); Notes: The 10-Q lists the U.S., Canada, the UK, Switzerland, and others as restrictedPerpetuals in Wallet (Lighter): U.S. users: Planned; International users outside the EU and UK: Available in some regions; Notes: 10-Q: eligible users in selected jurisdictionsGoing onchain yourself (wallet + bridge): U.S. users: No restriction at the contract level; International users outside the EU and UK: No restriction at the contract level; Notes: But the stock-token terms still bar U.S. persons from holding them
Some consequences:
U.S. investors get the subsidy but cannot touch stock tokens. They are the only beneficiaries of Earn's 3% reward, but under the terms they cannot hold onchain stock tokens.International investors can touch stock tokens but do not get the subsidy. Depositing into the same Steakhouse vault on their own, they get only the base interest of about 4%.The contracts do not check nationality; the terms do. The stock-token contracts have no address whitelist, but Robinhood holds the power to pause them and to burn holdings as administrator (Chapter 11). For holders in regions the terms do not permit, the risk is not technical but legal and a matter of contract permissions.
Access is not a compliance footnote. It directly changes the return table: in the same vault, people in different regions earn yields 3 percentage points apart.
If You Are Planning Your Own Entries and Exits
Check access before you calculate returns. An asset your region cannot hold is irrelevant to you, however high its yield. A subsidy you can get is your most certain excess return.Move large amounts through order books, not pools. For stock exposure above $100,000, use Lighter perpetuals or the order book. Split any single deposit above $500,000 in advance.Avoid rebalancing on weekends. Unless weekend liquidity is exactly what you came for, buying and selling stock tokens during U.S. trading hours saves you 10–30 bp of premium.Screen strategies by break-even period. Divide round-trip cost by annual yield to get the number of days you must hold. A strategy works only if that is shorter than your planned holding period.
On this chain, gas is almost free. The real cost is how you move: where you come in, where you swap, and when you leave.
Sources for This Chapter
Robinhood Chain RPC eth_feeHistory (base fee, November 2, 2026)Relay quote API api.relay.link/quote (7 routes × 4 amounts, November 2, 2026)Lighter Robinhood instance orderBookOrders and orderBookDetails (order-book depth and fees, November 2, 2026)GeckoTerminal pool trade records (last 300 trades, November 2, 2026)Robinhood Form 10-Q (October 28, 2026): restricted regions for stock tokens; availability of stock tokens and perpetuals in WalletRobinhood Earn product terms and third-party summaries (NerdWallet, July 29, 2026; Upshift): Earn is open only to eligible U.S. users, excluding New York and TexasWallet gas waiver extended to December 31, 2026: CoinDesk (as relayed by crypto.news)
—
This is Chapter 3 of 14 from my new book Where the Yield Comes From, serialized one chapter a day. For research only; not investment advice.
Author: Blue Lotus
#DeFi #RobinhoodChain #Stablecoins #RWA
Gas Is Not the Expensive Part
When people think about onchain costs, their first thought is gas. On Robinhood Chain, it is the last thing to worry about.
On November 2, the chain's base fee was about 0.02 gwei. An ordinary swap uses about 200,000 gas; with ETH at about $2,270, that comes to less than one cent. On top of that, swaps inside Robinhood Wallet are gas-free until December 31, 2026 (the waiver was originally due to expire on September 29 and was extended).
The real costs hide in three other places: bridging, slippage, and spreads. They are charged in proportion to the amount, so the more money you move and the more often you move it, the bigger the difference.
Leg One: Getting Onchain
There are three ways to get money onto Robinhood Chain:
Inside the Robinhood app. Eligible U.S. users buy USDG in the app and deposit it into Earn. The funds go into a self-custody wallet built into the app. Users barely notice this path.Robinhood Wallet. In supported countries and regions, users can transfer crypto assets into Wallet and then swap onchain.Bridges. Stablecoins are bridged over from Ethereum, Base, Arbitrum, and other chains.
The cost of the third path can be measured precisely. Using Relay's public quote API, we requested quotes for four amounts on November 2:
Base USDC → USDG onchain: $1,000: ~6 bp; $10,000: ~6 bp; $100,000: ~6 bp; $1 million: Quote refused; Arrival time: ~1 secondEthereum USDC → USDG onchain: $1,000: ~6 bp; $10,000: ~6 bp; $100,000: ~6 bp; $1 million: Quote refused; Arrival time: ~1–24 secondsArbitrum USDC → USDG onchain: $1,000: ~6 bp; $10,000: ~6 bp; $100,000: ~6 bp; $1 million: Quote refused; Arrival time: ~1 secondUSDG onchain → Base USDC: $1,000: ~6 bp; $10,000: ~6 bp; $100,000: ~6 bp; $1 million: ~10 bp; Arrival time: ~2 seconds
(bp means basis points; 1 bp = 0.01%. Cost = 1 − (amount received ÷ amount paid), including a relay fee of about 2.2 bp and the price loss on the USDC/USDG swap.)
Two details stand out:
Deposits are capped. Relay refuses to quote any single deposit above $500,000, so large amounts must be split or sent through another channel. In the withdrawal direction, $1 million can be quoted, at a cost of about 10 bp.Bridges do not touch stock tokens. Requests to swap USDG for SPY, NVDA, or TSLA all came back "unsupported currency." Stock tokens can only be traded on the chain's DEXs, the Lighter order book, or the Arcus request-for-quote system.
Leg Two: Swapping Into the Asset You Want
If what you want is USDG itself, to deposit in Earn or lend out, the trip ends once you are onchain. If you want stock tokens or a perpetual position, you pay a cost again.
There are three places on this chain to buy stock exposure, and their depth differs enormously. On November 2 we read the Lighter order books and calculated the average cost, relative to the best price, of taking liquidity in one go up to a given amount:
Lighter SPY perpetual: $10,000: 0.4 bp; $100,000: 0.7 bp; $1 million: 12.4 bp; Bid-ask spread: 0.9 bpLighter QQQ perpetual: $10,000: 0.5 bp; $100,000: 0.9 bp; $1 million: 17.5 bp; Bid-ask spread: 1.4 bpLighter NVDA perpetual: $10,000: 1.1 bp; $100,000: 2.1 bp; $1 million: 25.6 bp; Bid-ask spread: 1.0 bpLighter SPY spot: $10,000: 1.9 bp; $100,000: 29.1 bp; $1 million: Cannot fill; Bid-ask spread: 0.8 bpLighter NVDA spot: $10,000: 0; $100,000: 14.2 bp; $1 million: Cannot fill; Bid-ask spread: 6.3 bpLighter AAPL spot: $10,000: 0.8 bp; $100,000: 530 bp; $1 million: Cannot fill; Bid-ask spread: 10.0 bp
Perpetual order books are more than an order of magnitude deeper than spot tokens. Taking $100,000 of SPY perpetual costs less than 1 basis point. The same amount of the SPY spot token costs about 29 basis points, and $100,000 of the AAPL spot token pushes the price up by more than 5%. On top of that, Lighter charges no fees on either side on this chain (maker and taker fees are zero across all 63 perpetual markets).
DEX pools are thinner still. In the main stock-token pools tracked by GeckoTerminal (SPY, NVDA, TSLA, QQQ, and GOOGL against USDG), the median of the last 300 trades ranged from $107 to $735, and the largest trade was about $12,000. These pools charge fees from 0.05% to 0.3%, so buying also costs one pool fee (5–30 bp) up front.
The conclusion: on this chain, retail-sized amounts (a few thousand dollars) can trade anywhere. Stock exposure of a few hundred thousand dollars or more can be absorbed almost only by the perpetual order books.
Leg Three: The Price Gap, or Are You Paying Fair Value?
Stock tokens carry one more hidden cost: the price you trade at may itself deviate from the underlying stock. Chapter 6 analyzes this in detail; here are just the conclusions (medians, after correcting for the token multiplier):
During U.S. trading hours, the main stock tokens deviate from the shares by only 3–6 bp (about 13–14 bp for TSLA and MU).On weekends, tokens are on average 10–38 bp more expensive, and at certain hours more than 100 bp.
In other words, if you buy on the weekend and sell on Monday, you are very likely paying for the privilege of trading on weekends. Conversely, if you must rebalance on a weekend, that premium is the price you pay for 24/7 liquidity.
Adding Up the Three Legs: A Round-Trip Cost Table
Add the three legs together, getting onchain, swapping, and getting off, and you have the cost of one full round trip. The table below assumes $10,000, bridged in and out yourself. (It excludes conversions inside the app, which may carry their own fees; go by what the app shows.)
Deposit USDG for interest: On: 6 bp; Swap (buy + sell): 0; Price gap: 0; Off: 6 bp; Round trip: ~12 bpBuy SPY spot token (DEX, trading hours): On: 6 bp; Swap (buy + sell): ~60 bp (0.3% pool, twice); Price gap: ~6 bp; Off: 6 bp; Round trip: ~80 bpBuy SPY spot token (Lighter order book): On: 6 bp; Swap (buy + sell): ~4 bp; Price gap: ~6 bp; Off: 6 bp; Round trip: ~20 bpSPY perpetual (Lighter): On: 6 bp; Swap (buy + sell): ~1 bp; Price gap: 0; Off: 6 bp; Round trip: ~13 bp + funding
Divide a strategy's round-trip cost by its annual yield and you get the break-even period: how long you must hold before the return covers the cost of getting in and out.
Depositing USDG for interest: base interest of about 4%, a 12 bp round trip, break-even in about 11 days. For a Robinhood user earning 7%, about 6 days.Going long SPY with a perpetual: there is no interest income; instead you pay funding (an annualized 4.5–5.7%, Chapter 8), so the longer you hold, the more it costs.Buying a spot token on a DEX: a round trip of about 80 bp, roughly one month of SPY's average gain (assuming a long-run annual return of about 10%).
Rule: for any strategy yielding less than 5% a year, think of the holding period in months at least. Any route with a round-trip cost above 50 bp suits only holding periods of a quarter or longer.
Access: No One Gets Everything
Costs can be calculated. Access cannot be negotiated. Robinhood's onchain products are carved up by region, and the pieces barely overlap:
Robinhood Earn (interest on USDG): U.S. users: Yes (except New York and Texas); International users outside the EU and UK: No; Notes: The 3% "Robinhood users only" reward is paid only through EarnStock tokens: U.S. users: No; International users outside the EU and UK: Yes (about 120 countries); Notes: The 10-Q lists the U.S., Canada, the UK, Switzerland, and others as restrictedPerpetuals in Wallet (Lighter): U.S. users: Planned; International users outside the EU and UK: Available in some regions; Notes: 10-Q: eligible users in selected jurisdictionsGoing onchain yourself (wallet + bridge): U.S. users: No restriction at the contract level; International users outside the EU and UK: No restriction at the contract level; Notes: But the stock-token terms still bar U.S. persons from holding them
Some consequences:
U.S. investors get the subsidy but cannot touch stock tokens. They are the only beneficiaries of Earn's 3% reward, but under the terms they cannot hold onchain stock tokens.International investors can touch stock tokens but do not get the subsidy. Depositing into the same Steakhouse vault on their own, they get only the base interest of about 4%.The contracts do not check nationality; the terms do. The stock-token contracts have no address whitelist, but Robinhood holds the power to pause them and to burn holdings as administrator (Chapter 11). For holders in regions the terms do not permit, the risk is not technical but legal and a matter of contract permissions.
Access is not a compliance footnote. It directly changes the return table: in the same vault, people in different regions earn yields 3 percentage points apart.
If You Are Planning Your Own Entries and Exits
Check access before you calculate returns. An asset your region cannot hold is irrelevant to you, however high its yield. A subsidy you can get is your most certain excess return.Move large amounts through order books, not pools. For stock exposure above $100,000, use Lighter perpetuals or the order book. Split any single deposit above $500,000 in advance.Avoid rebalancing on weekends. Unless weekend liquidity is exactly what you came for, buying and selling stock tokens during U.S. trading hours saves you 10–30 bp of premium.Screen strategies by break-even period. Divide round-trip cost by annual yield to get the number of days you must hold. A strategy works only if that is shorter than your planned holding period.
On this chain, gas is almost free. The real cost is how you move: where you come in, where you swap, and when you leave.
Sources for This Chapter
Robinhood Chain RPC eth_feeHistory (base fee, November 2, 2026)Relay quote API api.relay.link/quote (7 routes × 4 amounts, November 2, 2026)Lighter Robinhood instance orderBookOrders and orderBookDetails (order-book depth and fees, November 2, 2026)GeckoTerminal pool trade records (last 300 trades, November 2, 2026)Robinhood Form 10-Q (October 28, 2026): restricted regions for stock tokens; availability of stock tokens and perpetuals in WalletRobinhood Earn product terms and third-party summaries (NerdWallet, July 29, 2026; Upshift): Earn is open only to eligible U.S. users, excluding New York and TexasWallet gas waiver extended to December 31, 2026: CoinDesk (as relayed by crypto.news)
—
This is Chapter 3 of 14 from my new book Where the Yield Comes From, serialized one chapter a day. For research only; not investment advice.
Author: Blue Lotus
#DeFi #RobinhoodChain #Stablecoins #RWA
308
·
--

Статья
The Investor's Dashboard: Five Places Where the Data LiesIf you are used to glancing at DefiLlama, DexScreener, or a project's front end and deciding on the spot, this chapter lists the five easiest places to misread Robinhood Chain and gives you five queries for pulling the data yourself.
One Quarter, Three Numbers
What was DEX volume on Robinhood Chain in its first full quarter, the third quarter of 2026?
On DefiLlama's chain-level count, July 1 through September 30 totaled about $90.67 billion.Robinhood's results materials said "more than $80 billion."On the earnings call, the CEO said "more than $100 billion so far," counting from launch to the day of the call.
Onchain fees tell the same story. DefiLlama recorded about $46.17 million in chain-operator fees for the third quarter. The company spoke of "more than $50 million in onchain fees." The net revenue attributed to Robinhood Chain in the financial statements was $26 million; the CFO explained that gross revenue was about $50 million and net about $25 million.
None of these numbers is wrong. They differ in time window (the quarter, or up to the day of the call), scope (all DEXs, or only the identifiable ones), and accounting basis (gross, or net of data-publication costs). What investors need to watch for is comparing a number on one basis with a number on another.
One more pair of numbers is even more telling: chain-operator fees were $46.17 million in the third quarter, but only about $1.55 million for the whole of October. The revenue in the quarterly report came mostly from the trading peak in the first weeks of September.
Here are the five most common ways to misread this chain.
Misreading 1: Double Counting
In DefiLlama's protocol list, Morpho Blue holds about $608 million on this chain and Steakhouse Financial about $541 million. Together that is more than $1.1 billion, more than the TVL of the entire chain.
The reason is that both numbers describe the same money. Steakhouse curates the vault, and all the USDG it manages sits in Morpho's lending markets. DefiLlama lists curators as their own category (Risk Curators), so adding up by category counts the money twice.
The same problem arises between stablecoins and lending: the USDe and USDG in Morpho markets are also counted as stablecoins on the chain. That is why Figure 1-1 in Chapter 1 carries the note "categories overlap and should not be added up."
Rule: when comparing size, use only chain-level TVL or a single protocol's figure. Do not add categories together.
Misreading 2: The Price Is Not the Onchain Price
DefiLlama provides prices for stock tokens. Pull its quotes for the SPY token from Friday, October 23, 2026, to Monday, October 26, and you will find only 7 distinct prices across 72 hours. The quote sat on a single number all weekend.
The reason is that this price is a reference price taken from the underlying stock. When the U.S. market is closed, it does not move. Over the same weekend, trades in the onchain SPY/USDG pool kept changing price.
On weekdays the difference barely matters. On weekends it is everything. The "price discovery while markets are closed" that Chapter 6 studies happens exactly during those dozens of hours when the reference price stands still. If you use the reference price to assess weekend risk in stock tokens, you will conclude that nothing moves on weekends. Onchain traders see something else.
Rule: for the onchain price of a stock token, use trade prices from DEX pools or order books, not aggregator quotes.
Misreading 3: One Token Is Not One Share
Compare the onchain price of the SPY token directly with SPY shares and you will find that the token is almost always slightly more expensive: from mid-September on, the median sits steadily around +20 basis points. It is easy to read this as an "onchain premium."
The real reason is written in the token contract. Robinhood's stock tokens do not pay cash dividends. Instead, after a dividend they raise a multiplier (uiMultiplier). The SPY token's multiplier was raised from 1.0 to 1.001718 on September 17, 2026, which means one token now represents 1.001718 shares. Multiply the share price by the multiplier and most of the "premium" disappears.
Chapter 6 redoes the entire price-gap analysis with this correction. For now, remember one thing: before you compare, make sure both sides are in the same unit.
Misreading 4: Half the APY Belongs to Someone Else
DefiLlama shows a yield of about 7% for the Steakhouse USDG vault. Broken down, the base interest is about 4.06% and the rewards about 3.10%. The rewards come from an incentive campaign on Merkl called "[Robinhood Users Only]," and they are paid only to users who deposit through Robinhood. If you deposit into the same vault directly from another wallet, you get only the base interest.
The opposite misreading exists too. DefiLlama shows a 0% yield for the syrupUSDG and mGLO markets on Morpho. That is because it measures the collateral side, and collateral earns no interest inside Morpho. But these two collateral assets are appreciating on their own. The borrowers' return is hidden in the collateral price, not in this table.
Rule: for any APY, ask three things. Which part is rewards? Who gets the rewards? When do the rewards stop?
Misreading 5: A Quote Is Not a Fill
Bridges and aggregators give attractive quotes. Testing Relay's public quote API: converting $100,000 of USDC on Base into USDG on this chain cost about 6 basis points and arrived in one second. But the same API flatly refused to quote $1 million, citing a "maximum fill amount of $500,000." It also refused to quote stock tokens.
Stock-token liquidity onchain is thinner still. In the main stock-token pools tracked by GeckoTerminal, the median of the last 300 trades was only $100 to $700, and the largest was about $12,000. The TVL a pool displays is one thing. How far your next $100,000 order will push the price is another (Chapter 3).
Rule: to judge whether you can get in and out, use real order-book depth and trade records, not a pool's TVL.
Five Queries for Pulling the Data Yourself
Most of the numbers in this book can be recomputed from public APIs. The five below cover what investors need most often. (The full scripts are in Appendix B.)
1. Chain and protocol DefiLlama
2. The real structure of a lending market: Morpho GraphQL
It tells you who is borrowing, how much, and how far each position is from liquidation. The concentration data in Chapters 5 and 12 come from here.
3. Where subsidies come from and when they end: Merkl
The funding address, reward token, budget, and start and end dates of every incentive are public.
4. Onchain prices for stock tokens: GeckoTerminal hourly candles
Use Yahoo Finance's 60-minute bars (including pre-market and after-hours) as the reference price, then multiply by the token's multiplier.
5. The real state of a contract: RPC and smarts
eth_call -> uiMultiplier() (stock-token multiplier) eth_getLogs -> UIMultiplierUpdated (history of multiplier changes) smarts get_admin_risk (whether the contract is upgradeable, mintable, pausable)
Robinhood Chain's public RPC does not keep all historical state, and a single eth_getLogs call cannot span more than 10 million blocks. The API of the Blockscout block explorer sits behind Cloudflare protection and blocks scripted access, so look things up in a browser.
If You Are Building Your Own Dashboard
Fix the basis before reading the number. Next to every number, write its time window, scope, and source. It is the cheapest way to tell research from rumor.Check three kinds of data every week: size (chain TVL, stablecoins), price (DEX trade prices, not reference prices), and subsidies (budgets and end dates of Merkl campaigns). A subsidy's end date deserves a place on your calendar more than the yield itself.When you see an "anomaly," suspect the ruler first. For several of the "startling findings" in this book, the first step was to check units, basis, and data source, and half of them vanished at that step.
Data does not lie on its own; we pick up the wrong ruler. Calibrate the ruler first, then read the marks.
Sources for This Chapter
DefiLlama: overview/dexs and summary/fees/robinhood-chain (quarterly and October totals, November 2, 2026); protocols API (Morpho Blue and Steakhouse Financial TVL, October 29, 2026); coins chart (hourly SPY token quotes, October 23–26, 2026)Robinhood Q3 2026 earnings press release, results presentation (onchain net revenue of $26 million), and earnings call (gross revenue of about $50 million, net about $25 million)uiMultiplier() and UIMultiplierUpdated events on token contract 0x117c…4c0c (Robinhood Chain RPC)Merkl v4 API: the "[Robinhood Users Only] Supply to Steakhouse USDG V2 vault" campaignRelay quote API api.relay.link/quote (November 2, 2026)GeckoTerminal: the last 300 trades in each pool (November 2, 2026)
—
This is Chapter 2 of 14 from my new book Where the Yield Comes From, serialized one chapter a day. For research only; not investment advice.
Author: Blue Lotus
#DeFi #RobinhoodChain #Stablecoins #RWA
The Investor's Dashboard: Five Places Where the Data Lies
If you are used to glancing at DefiLlama, DexScreener, or a project's front end and deciding on the spot, this chapter lists the five easiest places to misread Robinhood Chain and gives you five queries for pulling the data yourself.
One Quarter, Three Numbers
What was DEX volume on Robinhood Chain in its first full quarter, the third quarter of 2026?
On DefiLlama's chain-level count, July 1 through September 30 totaled about $90.67 billion.Robinhood's results materials said "more than $80 billion."On the earnings call, the CEO said "more than $100 billion so far," counting from launch to the day of the call.
Onchain fees tell the same story. DefiLlama recorded about $46.17 million in chain-operator fees for the third quarter. The company spoke of "more than $50 million in onchain fees." The net revenue attributed to Robinhood Chain in the financial statements was $26 million; the CFO explained that gross revenue was about $50 million and net about $25 million.
None of these numbers is wrong. They differ in time window (the quarter, or up to the day of the call), scope (all DEXs, or only the identifiable ones), and accounting basis (gross, or net of data-publication costs). What investors need to watch for is comparing a number on one basis with a number on another.
One more pair of numbers is even more telling: chain-operator fees were $46.17 million in the third quarter, but only about $1.55 million for the whole of October. The revenue in the quarterly report came mostly from the trading peak in the first weeks of September.
Here are the five most common ways to misread this chain.
Misreading 1: Double Counting
In DefiLlama's protocol list, Morpho Blue holds about $608 million on this chain and Steakhouse Financial about $541 million. Together that is more than $1.1 billion, more than the TVL of the entire chain.
The reason is that both numbers describe the same money. Steakhouse curates the vault, and all the USDG it manages sits in Morpho's lending markets. DefiLlama lists curators as their own category (Risk Curators), so adding up by category counts the money twice.
The same problem arises between stablecoins and lending: the USDe and USDG in Morpho markets are also counted as stablecoins on the chain. That is why Figure 1-1 in Chapter 1 carries the note "categories overlap and should not be added up."
Rule: when comparing size, use only chain-level TVL or a single protocol's figure. Do not add categories together.
Misreading 2: The Price Is Not the Onchain Price
DefiLlama provides prices for stock tokens. Pull its quotes for the SPY token from Friday, October 23, 2026, to Monday, October 26, and you will find only 7 distinct prices across 72 hours. The quote sat on a single number all weekend.
The reason is that this price is a reference price taken from the underlying stock. When the U.S. market is closed, it does not move. Over the same weekend, trades in the onchain SPY/USDG pool kept changing price.
On weekdays the difference barely matters. On weekends it is everything. The "price discovery while markets are closed" that Chapter 6 studies happens exactly during those dozens of hours when the reference price stands still. If you use the reference price to assess weekend risk in stock tokens, you will conclude that nothing moves on weekends. Onchain traders see something else.
Rule: for the onchain price of a stock token, use trade prices from DEX pools or order books, not aggregator quotes.
Misreading 3: One Token Is Not One Share
Compare the onchain price of the SPY token directly with SPY shares and you will find that the token is almost always slightly more expensive: from mid-September on, the median sits steadily around +20 basis points. It is easy to read this as an "onchain premium."
The real reason is written in the token contract. Robinhood's stock tokens do not pay cash dividends. Instead, after a dividend they raise a multiplier (uiMultiplier). The SPY token's multiplier was raised from 1.0 to 1.001718 on September 17, 2026, which means one token now represents 1.001718 shares. Multiply the share price by the multiplier and most of the "premium" disappears.
Chapter 6 redoes the entire price-gap analysis with this correction. For now, remember one thing: before you compare, make sure both sides are in the same unit.
Misreading 4: Half the APY Belongs to Someone Else
DefiLlama shows a yield of about 7% for the Steakhouse USDG vault. Broken down, the base interest is about 4.06% and the rewards about 3.10%. The rewards come from an incentive campaign on Merkl called "[Robinhood Users Only]," and they are paid only to users who deposit through Robinhood. If you deposit into the same vault directly from another wallet, you get only the base interest.
The opposite misreading exists too. DefiLlama shows a 0% yield for the syrupUSDG and mGLO markets on Morpho. That is because it measures the collateral side, and collateral earns no interest inside Morpho. But these two collateral assets are appreciating on their own. The borrowers' return is hidden in the collateral price, not in this table.
Rule: for any APY, ask three things. Which part is rewards? Who gets the rewards? When do the rewards stop?
Misreading 5: A Quote Is Not a Fill
Bridges and aggregators give attractive quotes. Testing Relay's public quote API: converting $100,000 of USDC on Base into USDG on this chain cost about 6 basis points and arrived in one second. But the same API flatly refused to quote $1 million, citing a "maximum fill amount of $500,000." It also refused to quote stock tokens.
Stock-token liquidity onchain is thinner still. In the main stock-token pools tracked by GeckoTerminal, the median of the last 300 trades was only $100 to $700, and the largest was about $12,000. The TVL a pool displays is one thing. How far your next $100,000 order will push the price is another (Chapter 3).
Rule: to judge whether you can get in and out, use real order-book depth and trade records, not a pool's TVL.
Five Queries for Pulling the Data Yourself
Most of the numbers in this book can be recomputed from public APIs. The five below cover what investors need most often. (The full scripts are in Appendix B.)
1. Chain and protocol DefiLlama
2. The real structure of a lending market: Morpho GraphQL
It tells you who is borrowing, how much, and how far each position is from liquidation. The concentration data in Chapters 5 and 12 come from here.
3. Where subsidies come from and when they end: Merkl
The funding address, reward token, budget, and start and end dates of every incentive are public.
4. Onchain prices for stock tokens: GeckoTerminal hourly candles
Use Yahoo Finance's 60-minute bars (including pre-market and after-hours) as the reference price, then multiply by the token's multiplier.
5. The real state of a contract: RPC and smarts
eth_call -> uiMultiplier() (stock-token multiplier) eth_getLogs -> UIMultiplierUpdated (history of multiplier changes) smarts get_admin_risk (whether the contract is upgradeable, mintable, pausable)
Robinhood Chain's public RPC does not keep all historical state, and a single eth_getLogs call cannot span more than 10 million blocks. The API of the Blockscout block explorer sits behind Cloudflare protection and blocks scripted access, so look things up in a browser.
If You Are Building Your Own Dashboard
Fix the basis before reading the number. Next to every number, write its time window, scope, and source. It is the cheapest way to tell research from rumor.Check three kinds of data every week: size (chain TVL, stablecoins), price (DEX trade prices, not reference prices), and subsidies (budgets and end dates of Merkl campaigns). A subsidy's end date deserves a place on your calendar more than the yield itself.When you see an "anomaly," suspect the ruler first. For several of the "startling findings" in this book, the first step was to check units, basis, and data source, and half of them vanished at that step.
Data does not lie on its own; we pick up the wrong ruler. Calibrate the ruler first, then read the marks.
Sources for This Chapter
DefiLlama: overview/dexs and summary/fees/robinhood-chain (quarterly and October totals, November 2, 2026); protocols API (Morpho Blue and Steakhouse Financial TVL, October 29, 2026); coins chart (hourly SPY token quotes, October 23–26, 2026)Robinhood Q3 2026 earnings press release, results presentation (onchain net revenue of $26 million), and earnings call (gross revenue of about $50 million, net about $25 million)uiMultiplier() and UIMultiplierUpdated events on token contract 0x117c…4c0c (Robinhood Chain RPC)Merkl v4 API: the "[Robinhood Users Only] Supply to Steakhouse USDG V2 vault" campaignRelay quote API api.relay.link/quote (November 2, 2026)GeckoTerminal: the last 300 trades in each pool (November 2, 2026)
—
This is Chapter 2 of 14 from my new book Where the Yield Comes From, serialized one chapter a day. For research only; not investment advice.
Author: Blue Lotus
#DeFi #RobinhoodChain #Stablecoins #RWA
One Quarter, Three Numbers
What was DEX volume on Robinhood Chain in its first full quarter, the third quarter of 2026?
On DefiLlama's chain-level count, July 1 through September 30 totaled about $90.67 billion.Robinhood's results materials said "more than $80 billion."On the earnings call, the CEO said "more than $100 billion so far," counting from launch to the day of the call.
Onchain fees tell the same story. DefiLlama recorded about $46.17 million in chain-operator fees for the third quarter. The company spoke of "more than $50 million in onchain fees." The net revenue attributed to Robinhood Chain in the financial statements was $26 million; the CFO explained that gross revenue was about $50 million and net about $25 million.
None of these numbers is wrong. They differ in time window (the quarter, or up to the day of the call), scope (all DEXs, or only the identifiable ones), and accounting basis (gross, or net of data-publication costs). What investors need to watch for is comparing a number on one basis with a number on another.
One more pair of numbers is even more telling: chain-operator fees were $46.17 million in the third quarter, but only about $1.55 million for the whole of October. The revenue in the quarterly report came mostly from the trading peak in the first weeks of September.
Here are the five most common ways to misread this chain.
Misreading 1: Double Counting
In DefiLlama's protocol list, Morpho Blue holds about $608 million on this chain and Steakhouse Financial about $541 million. Together that is more than $1.1 billion, more than the TVL of the entire chain.
The reason is that both numbers describe the same money. Steakhouse curates the vault, and all the USDG it manages sits in Morpho's lending markets. DefiLlama lists curators as their own category (Risk Curators), so adding up by category counts the money twice.
The same problem arises between stablecoins and lending: the USDe and USDG in Morpho markets are also counted as stablecoins on the chain. That is why Figure 1-1 in Chapter 1 carries the note "categories overlap and should not be added up."
Rule: when comparing size, use only chain-level TVL or a single protocol's figure. Do not add categories together.
Misreading 2: The Price Is Not the Onchain Price
DefiLlama provides prices for stock tokens. Pull its quotes for the SPY token from Friday, October 23, 2026, to Monday, October 26, and you will find only 7 distinct prices across 72 hours. The quote sat on a single number all weekend.
The reason is that this price is a reference price taken from the underlying stock. When the U.S. market is closed, it does not move. Over the same weekend, trades in the onchain SPY/USDG pool kept changing price.
On weekdays the difference barely matters. On weekends it is everything. The "price discovery while markets are closed" that Chapter 6 studies happens exactly during those dozens of hours when the reference price stands still. If you use the reference price to assess weekend risk in stock tokens, you will conclude that nothing moves on weekends. Onchain traders see something else.
Rule: for the onchain price of a stock token, use trade prices from DEX pools or order books, not aggregator quotes.
Misreading 3: One Token Is Not One Share
Compare the onchain price of the SPY token directly with SPY shares and you will find that the token is almost always slightly more expensive: from mid-September on, the median sits steadily around +20 basis points. It is easy to read this as an "onchain premium."
The real reason is written in the token contract. Robinhood's stock tokens do not pay cash dividends. Instead, after a dividend they raise a multiplier (uiMultiplier). The SPY token's multiplier was raised from 1.0 to 1.001718 on September 17, 2026, which means one token now represents 1.001718 shares. Multiply the share price by the multiplier and most of the "premium" disappears.
Chapter 6 redoes the entire price-gap analysis with this correction. For now, remember one thing: before you compare, make sure both sides are in the same unit.
Misreading 4: Half the APY Belongs to Someone Else
DefiLlama shows a yield of about 7% for the Steakhouse USDG vault. Broken down, the base interest is about 4.06% and the rewards about 3.10%. The rewards come from an incentive campaign on Merkl called "[Robinhood Users Only]," and they are paid only to users who deposit through Robinhood. If you deposit into the same vault directly from another wallet, you get only the base interest.
The opposite misreading exists too. DefiLlama shows a 0% yield for the syrupUSDG and mGLO markets on Morpho. That is because it measures the collateral side, and collateral earns no interest inside Morpho. But these two collateral assets are appreciating on their own. The borrowers' return is hidden in the collateral price, not in this table.
Rule: for any APY, ask three things. Which part is rewards? Who gets the rewards? When do the rewards stop?
Misreading 5: A Quote Is Not a Fill
Bridges and aggregators give attractive quotes. Testing Relay's public quote API: converting $100,000 of USDC on Base into USDG on this chain cost about 6 basis points and arrived in one second. But the same API flatly refused to quote $1 million, citing a "maximum fill amount of $500,000." It also refused to quote stock tokens.
Stock-token liquidity onchain is thinner still. In the main stock-token pools tracked by GeckoTerminal, the median of the last 300 trades was only $100 to $700, and the largest was about $12,000. The TVL a pool displays is one thing. How far your next $100,000 order will push the price is another (Chapter 3).
Rule: to judge whether you can get in and out, use real order-book depth and trade records, not a pool's TVL.
Five Queries for Pulling the Data Yourself
Most of the numbers in this book can be recomputed from public APIs. The five below cover what investors need most often. (The full scripts are in Appendix B.)
1. Chain and protocol DefiLlama
2. The real structure of a lending market: Morpho GraphQL
It tells you who is borrowing, how much, and how far each position is from liquidation. The concentration data in Chapters 5 and 12 come from here.
3. Where subsidies come from and when they end: Merkl
The funding address, reward token, budget, and start and end dates of every incentive are public.
4. Onchain prices for stock tokens: GeckoTerminal hourly candles
Use Yahoo Finance's 60-minute bars (including pre-market and after-hours) as the reference price, then multiply by the token's multiplier.
5. The real state of a contract: RPC and smarts
eth_call -> uiMultiplier() (stock-token multiplier) eth_getLogs -> UIMultiplierUpdated (history of multiplier changes) smarts get_admin_risk (whether the contract is upgradeable, mintable, pausable)
Robinhood Chain's public RPC does not keep all historical state, and a single eth_getLogs call cannot span more than 10 million blocks. The API of the Blockscout block explorer sits behind Cloudflare protection and blocks scripted access, so look things up in a browser.
If You Are Building Your Own Dashboard
Fix the basis before reading the number. Next to every number, write its time window, scope, and source. It is the cheapest way to tell research from rumor.Check three kinds of data every week: size (chain TVL, stablecoins), price (DEX trade prices, not reference prices), and subsidies (budgets and end dates of Merkl campaigns). A subsidy's end date deserves a place on your calendar more than the yield itself.When you see an "anomaly," suspect the ruler first. For several of the "startling findings" in this book, the first step was to check units, basis, and data source, and half of them vanished at that step.
Data does not lie on its own; we pick up the wrong ruler. Calibrate the ruler first, then read the marks.
Sources for This Chapter
DefiLlama: overview/dexs and summary/fees/robinhood-chain (quarterly and October totals, November 2, 2026); protocols API (Morpho Blue and Steakhouse Financial TVL, October 29, 2026); coins chart (hourly SPY token quotes, October 23–26, 2026)Robinhood Q3 2026 earnings press release, results presentation (onchain net revenue of $26 million), and earnings call (gross revenue of about $50 million, net about $25 million)uiMultiplier() and UIMultiplierUpdated events on token contract 0x117c…4c0c (Robinhood Chain RPC)Merkl v4 API: the "[Robinhood Users Only] Supply to Steakhouse USDG V2 vault" campaignRelay quote API api.relay.link/quote (November 2, 2026)GeckoTerminal: the last 300 trades in each pool (November 2, 2026)
—
This is Chapter 2 of 14 from my new book Where the Yield Comes From, serialized one chapter a day. For research only; not investment advice.
Author: Blue Lotus
#DeFi #RobinhoodChain #Stablecoins #RWA
160
·
--
Статья
What You Can Hold Onchain: An Asset MapIf you are about to put money on Robinhood Chain, this chapter answers the most basic question first: what can you actually hold on the chain, where is the money really sitting, and for each kind of asset, where does the return come from, what are the risks, and how fast can you get out?
The Money Is Not Where You Think It Is
Mention Robinhood Chain and most people think of stock tokens: a U.S. broker putting Apple, Nvidia, and the S&P 500 onchain so that anyone, in any country, can trade them around the clock.
The chain's own ledger paints a different picture. On November 2, 2026, the chain's total value locked (TVL) was about $1.083 billion, and stablecoins on the chain totaled about $1.045 billion. Within those numbers, the single largest use was stablecoin lending. Lending markets on Morpho held about $620 million, of which about $520 million came from one vault. Robinhood disclosed in its 10-Q that, as of September 30, the fair value of all the public stock tokens it had issued was only $185 million.
In other words, this chain is famous for stock tokens, but most of its money is dollars, not stocks.
That comparison sets the focus of this book. What an investor can do on this chain falls roughly into eight categories. We first lay them out on one map, then explain what kind of money each one earns.
Eight Asset Classes
1. Stablecoins: USDG and USDe
Stablecoins on the chain total about $1.045 billion, and two of them account for nearly all of it:
USDG (Global Dollar, issued by Paxos), about $661 million, is the chain's settlement dollar. Swaps in Robinhood Wallet, margin for Lighter perpetuals, and the main trading pairs for stock tokens are all priced in it.USDe (Ethena's synthetic dollar), about $358 million, has almost only one use on this chain: about $352 million is posted as collateral in Morpho's USDe/USDG market, 98% of all USDe on the chain.
Stablecoins pay no interest on their own. USDG holders do not receive Paxos's reserve income, which is shared with partner institutions through the Global Dollar Network rather than with onchain holders. The USDe on this chain is not the yield-bearing sUSDe either. Every dollar of return from holding stablecoins comes only after you lend them out, post them as collateral, or put them into a pool.
2. Lending Receipts and Vault Shares
Deposit USDG into a lending market and you receive a receipt: shares in a Morpho vault (such as steakUSDG), Spark's spUSDG, or a LayerBank deposit token. The share price rises with interest, and on redemption you get back more USDG.
This is the largest asset class on the chain. The USDG vault curated by Steakhouse (steakUSDG), at about $522 million, is the vault behind Robinhood Earn and the bulk of Morpho on this chain. Where its yield comes from is the subject of Chapter 5.
3. Yield-Bearing Dollars: syrupUSDG, spUSDG, mGLO
Another group of dollar assets carries its own yield, because real lending or investment sits behind it:
syrupUSDG (Maple): funds are lent to institutions against overcollateralized loans, and the interest goes to holders.spUSDG (Spark): the USDG version of Spark's savings product, currently yielding about 3.8%.mGLO (Midas Fasanara Global Open): a fund-share token issued by Midas, with an onchain supply of about 52.7 million tokens.
What they share is that their yield does not depend on subsidies, but they carry credit or fund risk. They are also collateral for looped borrowing on Morpho, which comes up again and again in Chapter 5.
4. Stock Tokens
There are about 200 of them, by Robinhood's own count, worth $185 million in total at fair value on September 30. Legally, they are debt instruments issued by Robinhood's European entity that track the economic performance of a stock and carry no voting rights. (The legal structure is covered in Chapter 8 of Robinhood Goes Onchain and is not repeated here.)
For investors, stock tokens differ from shares held at a broker in three economic ways:
They trade 24/7. When U.S. markets are closed, they keep being priced onchain.Dividends are reinvested. Stock tokens do not pay cash. Instead, a multiplier is raised, so each token slowly comes to represent more shares. (Chapter 6 uses this to solve a price-gap puzzle.)They are composable. They can go into AMM pools, serve as lending collateral, and be hedged with perpetual contracts.
Their risks come from the same features. When the market is closed, only onchain traders are discovering the price. The contracts can be paused, and an administrator can burn holdings (Chapter 11).
5. LP Shares
Put two assets into a DEX pool to make a market and you receive LP shares. DEX TVL on the chain is about $350 million, mostly on Uniswap V4 and V3.
This chain has a kind of pool rarely seen elsewhere: stock against stock. In Uniswap pools such as SPY/NVDA, SPY/QQQ, and SPY/GOOGL, both sides are stock tokens, and the LP's risk is the relative price of two stocks rather than exposure to the dollar. Chapter 7 takes these pools apart.
6. Perpetuals and Leverage
Perpetuals on the chain have about $183 million of TVL. Lighter runs a separate instance on this chain. On November 2 it showed 63 perpetual markets, $616 million of 24-hour volume, and about $188 million of open interest. The most-traded market was not bitcoin but the SPY perpetual ($84.9 million in 24 hours), followed by the QQQ perpetual ($67 million). On its Q3 earnings call, Robinhood said onchain perpetual volume had exceeded $1 billion a day in recent weeks.
Investors can use perpetuals in two ways: to add leverage directly, or to pair them with spot tokens in a basis trade (Chapter 8).
7. Ecosystem and Launchpad Tokens
Launchpad platform tokens, meme coins, and protocol governance tokens. Their prices are the most volatile and their return distributions the most extreme (Chapter 9). The business model of the launchpad sector is covered in the companion book The Coin Factory. This book treats these tokens only as a high-volatility asset class and discusses position sizing.
8. The Beginnings of Fixed Income and Prediction Markets
These are still very small, but the names are worth knowing: Pendle (about $340,000), Arcus's pTokens (about $400,000), maturity-dated tokens on stock tokens (such as pSPY-DEC27 and pPFE-DEC27), and the Meridian prediction market (about $1.03 million). They are the first rate and event products built on stock tokens (Chapter 8).
One Map: What Each Asset Class Earns
Put the eight classes side by side and a clear dividing line appears:
Stablecoins: Source of return: None (must be lent or posted); Main risks: Issuer, depeg; Exit speed: SecondsLending receipts and vaults: Source of return: Borrowing interest + subsidies; Main risks: Borrower default, oracle, bad debt; Exit speed: Depends on utilizationYield-bearing dollars: Source of return: Credit interest, fund returns; Main risks: Credit, redemption delays; Exit speed: Days to weeksStock tokens: Source of return: Price moves + dividends (multiplier); Main risks: Stock price, gaps across market closures, contract permissions; Exit speed: Seconds during market hours, limited depthLP shares: Source of return: Trading fees + subsidies; Main risks: Impermanent loss, being arbitraged while markets are closed; Exit speed: SecondsPerpetuals: Source of return: Directional gains or funding; Main risks: Liquidation, funding reversal; Exit speed: SecondsLaunchpad tokens: Source of return: Price; Main risks: Going to zero, liquidity drying up; Exit speed: You may not get outFixed income and prediction markets: Source of return: Yield to maturity, event outcomes; Main risks: Liquidity, counterparty; Exit speed: At maturity, or slowly
The left-hand column decides whose money you are earning. The right-hand column decides whether you can get out when something goes wrong. Together, those two columns are the two questions every later chapter answers.
The Size Changes, the Structure Does Not
Mainnet launched on July 1. TVL was about $125 million in mid-July, passed $1 billion in mid-September, peaked at about $1.153 billion on October 21, and then eased to $1.083 billion on November 2. The stablecoin supply rose from about $240 million in early July to about $1.09 billion in mid-September and has moved sideways between $1.05 billion and $1.10 billion since.
DEX volume followed a different path. After peaking in early September at a weekly average of about $2.7 billion a day, it fell back to $700–800 million a day by late October.
The two curves say one thing: trading enthusiasm fades, but money that has been parked does not necessarily leave. After September, trading and fees cooled noticeably, yet almost none of the dollars on the chain left. Most of the billion dollars that stayed is earning interest. To understand this chain, you first have to understand where that interest comes from.
If You Are About to Put Money Here
Decide which kind of return you want. Price returns (stock tokens, launchpad tokens), interest (lending, yield-bearing dollars), fees (LP positions), and funding (basis trades) carry completely different risks. Do not evaluate them together just because they live on the same chain.Size is information. An asset class worth only a few hundred thousand dollars usually means your trades will move the price. One worth hundreds of millions usually means someone is subsidizing it or there is real demand. Chapter 4 shows you how to tell the two apart.Remember that stablecoins pay no interest. Every dollar of onchain dollar yield comes from handing your dollars to someone else to use. Whoever you hand them to is your risk.
This chain is best known for stocks, but holds mostly dollars; its most visible activity is trading, but its most stable is interest.
Sources for This Chapter
DefiLlama: chain-level TVL (historicalChainTvl, November 2, 2026), stablecoin totals and breakdown by coin (stablecoins API, November 2, 2026), protocol and category TVL (protocols API, October 29, 2026), DEX volume (overview/dexs)Robinhood Form 10-Q (filed October 28, 2026, for the period ended September 30, 2026): fair value of public stock-token liabilities of $185 millionRobinhood Q3 2026 earnings call: remarks on onchain perpetual volumeMorpho GraphQL API: collateral and borrowing in the USDe/USDG market (November 2, 2026)Lighter Robinhood instance API: number of perpetual markets, 24-hour volume, open interest (November 2, 2026)smarts: mGLO supply (block 26,328,375)
—
This is Chapter 1 of 14 from my new book Where the Yield Comes From, serialized one chapter a day. For research only; not investment advice.
Author: Blue Lotus
#DeFi #RobinhoodChain #Stablecoins #RWA
What You Can Hold Onchain: An Asset Map
If you are about to put money on Robinhood Chain, this chapter answers the most basic question first: what can you actually hold on the chain, where is the money really sitting, and for each kind of asset, where does the return come from, what are the risks, and how fast can you get out?
The Money Is Not Where You Think It Is
Mention Robinhood Chain and most people think of stock tokens: a U.S. broker putting Apple, Nvidia, and the S&P 500 onchain so that anyone, in any country, can trade them around the clock.
The chain's own ledger paints a different picture. On November 2, 2026, the chain's total value locked (TVL) was about $1.083 billion, and stablecoins on the chain totaled about $1.045 billion. Within those numbers, the single largest use was stablecoin lending. Lending markets on Morpho held about $620 million, of which about $520 million came from one vault. Robinhood disclosed in its 10-Q that, as of September 30, the fair value of all the public stock tokens it had issued was only $185 million.
In other words, this chain is famous for stock tokens, but most of its money is dollars, not stocks.
That comparison sets the focus of this book. What an investor can do on this chain falls roughly into eight categories. We first lay them out on one map, then explain what kind of money each one earns.
Eight Asset Classes
1. Stablecoins: USDG and USDe
Stablecoins on the chain total about $1.045 billion, and two of them account for nearly all of it:
USDG (Global Dollar, issued by Paxos), about $661 million, is the chain's settlement dollar. Swaps in Robinhood Wallet, margin for Lighter perpetuals, and the main trading pairs for stock tokens are all priced in it.USDe (Ethena's synthetic dollar), about $358 million, has almost only one use on this chain: about $352 million is posted as collateral in Morpho's USDe/USDG market, 98% of all USDe on the chain.
Stablecoins pay no interest on their own. USDG holders do not receive Paxos's reserve income, which is shared with partner institutions through the Global Dollar Network rather than with onchain holders. The USDe on this chain is not the yield-bearing sUSDe either. Every dollar of return from holding stablecoins comes only after you lend them out, post them as collateral, or put them into a pool.
2. Lending Receipts and Vault Shares
Deposit USDG into a lending market and you receive a receipt: shares in a Morpho vault (such as steakUSDG), Spark's spUSDG, or a LayerBank deposit token. The share price rises with interest, and on redemption you get back more USDG.
This is the largest asset class on the chain. The USDG vault curated by Steakhouse (steakUSDG), at about $522 million, is the vault behind Robinhood Earn and the bulk of Morpho on this chain. Where its yield comes from is the subject of Chapter 5.
3. Yield-Bearing Dollars: syrupUSDG, spUSDG, mGLO
Another group of dollar assets carries its own yield, because real lending or investment sits behind it:
syrupUSDG (Maple): funds are lent to institutions against overcollateralized loans, and the interest goes to holders.spUSDG (Spark): the USDG version of Spark's savings product, currently yielding about 3.8%.mGLO (Midas Fasanara Global Open): a fund-share token issued by Midas, with an onchain supply of about 52.7 million tokens.
What they share is that their yield does not depend on subsidies, but they carry credit or fund risk. They are also collateral for looped borrowing on Morpho, which comes up again and again in Chapter 5.
4. Stock Tokens
There are about 200 of them, by Robinhood's own count, worth $185 million in total at fair value on September 30. Legally, they are debt instruments issued by Robinhood's European entity that track the economic performance of a stock and carry no voting rights. (The legal structure is covered in Chapter 8 of Robinhood Goes Onchain and is not repeated here.)
For investors, stock tokens differ from shares held at a broker in three economic ways:
They trade 24/7. When U.S. markets are closed, they keep being priced onchain.Dividends are reinvested. Stock tokens do not pay cash. Instead, a multiplier is raised, so each token slowly comes to represent more shares. (Chapter 6 uses this to solve a price-gap puzzle.)They are composable. They can go into AMM pools, serve as lending collateral, and be hedged with perpetual contracts.
Their risks come from the same features. When the market is closed, only onchain traders are discovering the price. The contracts can be paused, and an administrator can burn holdings (Chapter 11).
5. LP Shares
Put two assets into a DEX pool to make a market and you receive LP shares. DEX TVL on the chain is about $350 million, mostly on Uniswap V4 and V3.
This chain has a kind of pool rarely seen elsewhere: stock against stock. In Uniswap pools such as SPY/NVDA, SPY/QQQ, and SPY/GOOGL, both sides are stock tokens, and the LP's risk is the relative price of two stocks rather than exposure to the dollar. Chapter 7 takes these pools apart.
6. Perpetuals and Leverage
Perpetuals on the chain have about $183 million of TVL. Lighter runs a separate instance on this chain. On November 2 it showed 63 perpetual markets, $616 million of 24-hour volume, and about $188 million of open interest. The most-traded market was not bitcoin but the SPY perpetual ($84.9 million in 24 hours), followed by the QQQ perpetual ($67 million). On its Q3 earnings call, Robinhood said onchain perpetual volume had exceeded $1 billion a day in recent weeks.
Investors can use perpetuals in two ways: to add leverage directly, or to pair them with spot tokens in a basis trade (Chapter 8).
7. Ecosystem and Launchpad Tokens
Launchpad platform tokens, meme coins, and protocol governance tokens. Their prices are the most volatile and their return distributions the most extreme (Chapter 9). The business model of the launchpad sector is covered in the companion book The Coin Factory. This book treats these tokens only as a high-volatility asset class and discusses position sizing.
8. The Beginnings of Fixed Income and Prediction Markets
These are still very small, but the names are worth knowing: Pendle (about $340,000), Arcus's pTokens (about $400,000), maturity-dated tokens on stock tokens (such as pSPY-DEC27 and pPFE-DEC27), and the Meridian prediction market (about $1.03 million). They are the first rate and event products built on stock tokens (Chapter 8).
One Map: What Each Asset Class Earns
Put the eight classes side by side and a clear dividing line appears:
Stablecoins: Source of return: None (must be lent or posted); Main risks: Issuer, depeg; Exit speed: SecondsLending receipts and vaults: Source of return: Borrowing interest + subsidies; Main risks: Borrower default, oracle, bad debt; Exit speed: Depends on utilizationYield-bearing dollars: Source of return: Credit interest, fund returns; Main risks: Credit, redemption delays; Exit speed: Days to weeksStock tokens: Source of return: Price moves + dividends (multiplier); Main risks: Stock price, gaps across market closures, contract permissions; Exit speed: Seconds during market hours, limited depthLP shares: Source of return: Trading fees + subsidies; Main risks: Impermanent loss, being arbitraged while markets are closed; Exit speed: SecondsPerpetuals: Source of return: Directional gains or funding; Main risks: Liquidation, funding reversal; Exit speed: SecondsLaunchpad tokens: Source of return: Price; Main risks: Going to zero, liquidity drying up; Exit speed: You may not get outFixed income and prediction markets: Source of return: Yield to maturity, event outcomes; Main risks: Liquidity, counterparty; Exit speed: At maturity, or slowly
The left-hand column decides whose money you are earning. The right-hand column decides whether you can get out when something goes wrong. Together, those two columns are the two questions every later chapter answers.
The Size Changes, the Structure Does Not
Mainnet launched on July 1. TVL was about $125 million in mid-July, passed $1 billion in mid-September, peaked at about $1.153 billion on October 21, and then eased to $1.083 billion on November 2. The stablecoin supply rose from about $240 million in early July to about $1.09 billion in mid-September and has moved sideways between $1.05 billion and $1.10 billion since.
DEX volume followed a different path. After peaking in early September at a weekly average of about $2.7 billion a day, it fell back to $700–800 million a day by late October.
The two curves say one thing: trading enthusiasm fades, but money that has been parked does not necessarily leave. After September, trading and fees cooled noticeably, yet almost none of the dollars on the chain left. Most of the billion dollars that stayed is earning interest. To understand this chain, you first have to understand where that interest comes from.
If You Are About to Put Money Here
Decide which kind of return you want. Price returns (stock tokens, launchpad tokens), interest (lending, yield-bearing dollars), fees (LP positions), and funding (basis trades) carry completely different risks. Do not evaluate them together just because they live on the same chain.Size is information. An asset class worth only a few hundred thousand dollars usually means your trades will move the price. One worth hundreds of millions usually means someone is subsidizing it or there is real demand. Chapter 4 shows you how to tell the two apart.Remember that stablecoins pay no interest. Every dollar of onchain dollar yield comes from handing your dollars to someone else to use. Whoever you hand them to is your risk.
This chain is best known for stocks, but holds mostly dollars; its most visible activity is trading, but its most stable is interest.
Sources for This Chapter
DefiLlama: chain-level TVL (historicalChainTvl, November 2, 2026), stablecoin totals and breakdown by coin (stablecoins API, November 2, 2026), protocol and category TVL (protocols API, October 29, 2026), DEX volume (overview/dexs)Robinhood Form 10-Q (filed October 28, 2026, for the period ended September 30, 2026): fair value of public stock-token liabilities of $185 millionRobinhood Q3 2026 earnings call: remarks on onchain perpetual volumeMorpho GraphQL API: collateral and borrowing in the USDe/USDG market (November 2, 2026)Lighter Robinhood instance API: number of perpetual markets, 24-hour volume, open interest (November 2, 2026)smarts: mGLO supply (block 26,328,375)
—
This is Chapter 1 of 14 from my new book Where the Yield Comes From, serialized one chapter a day. For research only; not investment advice.
Author: Blue Lotus
#DeFi #RobinhoodChain #Stablecoins #RWA
The Money Is Not Where You Think It Is
Mention Robinhood Chain and most people think of stock tokens: a U.S. broker putting Apple, Nvidia, and the S&P 500 onchain so that anyone, in any country, can trade them around the clock.
The chain's own ledger paints a different picture. On November 2, 2026, the chain's total value locked (TVL) was about $1.083 billion, and stablecoins on the chain totaled about $1.045 billion. Within those numbers, the single largest use was stablecoin lending. Lending markets on Morpho held about $620 million, of which about $520 million came from one vault. Robinhood disclosed in its 10-Q that, as of September 30, the fair value of all the public stock tokens it had issued was only $185 million.
In other words, this chain is famous for stock tokens, but most of its money is dollars, not stocks.
That comparison sets the focus of this book. What an investor can do on this chain falls roughly into eight categories. We first lay them out on one map, then explain what kind of money each one earns.
Eight Asset Classes
1. Stablecoins: USDG and USDe
Stablecoins on the chain total about $1.045 billion, and two of them account for nearly all of it:
USDG (Global Dollar, issued by Paxos), about $661 million, is the chain's settlement dollar. Swaps in Robinhood Wallet, margin for Lighter perpetuals, and the main trading pairs for stock tokens are all priced in it.USDe (Ethena's synthetic dollar), about $358 million, has almost only one use on this chain: about $352 million is posted as collateral in Morpho's USDe/USDG market, 98% of all USDe on the chain.
Stablecoins pay no interest on their own. USDG holders do not receive Paxos's reserve income, which is shared with partner institutions through the Global Dollar Network rather than with onchain holders. The USDe on this chain is not the yield-bearing sUSDe either. Every dollar of return from holding stablecoins comes only after you lend them out, post them as collateral, or put them into a pool.
2. Lending Receipts and Vault Shares
Deposit USDG into a lending market and you receive a receipt: shares in a Morpho vault (such as steakUSDG), Spark's spUSDG, or a LayerBank deposit token. The share price rises with interest, and on redemption you get back more USDG.
This is the largest asset class on the chain. The USDG vault curated by Steakhouse (steakUSDG), at about $522 million, is the vault behind Robinhood Earn and the bulk of Morpho on this chain. Where its yield comes from is the subject of Chapter 5.
3. Yield-Bearing Dollars: syrupUSDG, spUSDG, mGLO
Another group of dollar assets carries its own yield, because real lending or investment sits behind it:
syrupUSDG (Maple): funds are lent to institutions against overcollateralized loans, and the interest goes to holders.spUSDG (Spark): the USDG version of Spark's savings product, currently yielding about 3.8%.mGLO (Midas Fasanara Global Open): a fund-share token issued by Midas, with an onchain supply of about 52.7 million tokens.
What they share is that their yield does not depend on subsidies, but they carry credit or fund risk. They are also collateral for looped borrowing on Morpho, which comes up again and again in Chapter 5.
4. Stock Tokens
There are about 200 of them, by Robinhood's own count, worth $185 million in total at fair value on September 30. Legally, they are debt instruments issued by Robinhood's European entity that track the economic performance of a stock and carry no voting rights. (The legal structure is covered in Chapter 8 of Robinhood Goes Onchain and is not repeated here.)
For investors, stock tokens differ from shares held at a broker in three economic ways:
They trade 24/7. When U.S. markets are closed, they keep being priced onchain.Dividends are reinvested. Stock tokens do not pay cash. Instead, a multiplier is raised, so each token slowly comes to represent more shares. (Chapter 6 uses this to solve a price-gap puzzle.)They are composable. They can go into AMM pools, serve as lending collateral, and be hedged with perpetual contracts.
Their risks come from the same features. When the market is closed, only onchain traders are discovering the price. The contracts can be paused, and an administrator can burn holdings (Chapter 11).
5. LP Shares
Put two assets into a DEX pool to make a market and you receive LP shares. DEX TVL on the chain is about $350 million, mostly on Uniswap V4 and V3.
This chain has a kind of pool rarely seen elsewhere: stock against stock. In Uniswap pools such as SPY/NVDA, SPY/QQQ, and SPY/GOOGL, both sides are stock tokens, and the LP's risk is the relative price of two stocks rather than exposure to the dollar. Chapter 7 takes these pools apart.
6. Perpetuals and Leverage
Perpetuals on the chain have about $183 million of TVL. Lighter runs a separate instance on this chain. On November 2 it showed 63 perpetual markets, $616 million of 24-hour volume, and about $188 million of open interest. The most-traded market was not bitcoin but the SPY perpetual ($84.9 million in 24 hours), followed by the QQQ perpetual ($67 million). On its Q3 earnings call, Robinhood said onchain perpetual volume had exceeded $1 billion a day in recent weeks.
Investors can use perpetuals in two ways: to add leverage directly, or to pair them with spot tokens in a basis trade (Chapter 8).
7. Ecosystem and Launchpad Tokens
Launchpad platform tokens, meme coins, and protocol governance tokens. Their prices are the most volatile and their return distributions the most extreme (Chapter 9). The business model of the launchpad sector is covered in the companion book The Coin Factory. This book treats these tokens only as a high-volatility asset class and discusses position sizing.
8. The Beginnings of Fixed Income and Prediction Markets
These are still very small, but the names are worth knowing: Pendle (about $340,000), Arcus's pTokens (about $400,000), maturity-dated tokens on stock tokens (such as pSPY-DEC27 and pPFE-DEC27), and the Meridian prediction market (about $1.03 million). They are the first rate and event products built on stock tokens (Chapter 8).
One Map: What Each Asset Class Earns
Put the eight classes side by side and a clear dividing line appears:
Stablecoins: Source of return: None (must be lent or posted); Main risks: Issuer, depeg; Exit speed: SecondsLending receipts and vaults: Source of return: Borrowing interest + subsidies; Main risks: Borrower default, oracle, bad debt; Exit speed: Depends on utilizationYield-bearing dollars: Source of return: Credit interest, fund returns; Main risks: Credit, redemption delays; Exit speed: Days to weeksStock tokens: Source of return: Price moves + dividends (multiplier); Main risks: Stock price, gaps across market closures, contract permissions; Exit speed: Seconds during market hours, limited depthLP shares: Source of return: Trading fees + subsidies; Main risks: Impermanent loss, being arbitraged while markets are closed; Exit speed: SecondsPerpetuals: Source of return: Directional gains or funding; Main risks: Liquidation, funding reversal; Exit speed: SecondsLaunchpad tokens: Source of return: Price; Main risks: Going to zero, liquidity drying up; Exit speed: You may not get outFixed income and prediction markets: Source of return: Yield to maturity, event outcomes; Main risks: Liquidity, counterparty; Exit speed: At maturity, or slowly
The left-hand column decides whose money you are earning. The right-hand column decides whether you can get out when something goes wrong. Together, those two columns are the two questions every later chapter answers.
The Size Changes, the Structure Does Not
Mainnet launched on July 1. TVL was about $125 million in mid-July, passed $1 billion in mid-September, peaked at about $1.153 billion on October 21, and then eased to $1.083 billion on November 2. The stablecoin supply rose from about $240 million in early July to about $1.09 billion in mid-September and has moved sideways between $1.05 billion and $1.10 billion since.
DEX volume followed a different path. After peaking in early September at a weekly average of about $2.7 billion a day, it fell back to $700–800 million a day by late October.
The two curves say one thing: trading enthusiasm fades, but money that has been parked does not necessarily leave. After September, trading and fees cooled noticeably, yet almost none of the dollars on the chain left. Most of the billion dollars that stayed is earning interest. To understand this chain, you first have to understand where that interest comes from.
If You Are About to Put Money Here
Decide which kind of return you want. Price returns (stock tokens, launchpad tokens), interest (lending, yield-bearing dollars), fees (LP positions), and funding (basis trades) carry completely different risks. Do not evaluate them together just because they live on the same chain.Size is information. An asset class worth only a few hundred thousand dollars usually means your trades will move the price. One worth hundreds of millions usually means someone is subsidizing it or there is real demand. Chapter 4 shows you how to tell the two apart.Remember that stablecoins pay no interest. Every dollar of onchain dollar yield comes from handing your dollars to someone else to use. Whoever you hand them to is your risk.
This chain is best known for stocks, but holds mostly dollars; its most visible activity is trading, but its most stable is interest.
Sources for This Chapter
DefiLlama: chain-level TVL (historicalChainTvl, November 2, 2026), stablecoin totals and breakdown by coin (stablecoins API, November 2, 2026), protocol and category TVL (protocols API, October 29, 2026), DEX volume (overview/dexs)Robinhood Form 10-Q (filed October 28, 2026, for the period ended September 30, 2026): fair value of public stock-token liabilities of $185 millionRobinhood Q3 2026 earnings call: remarks on onchain perpetual volumeMorpho GraphQL API: collateral and borrowing in the USDe/USDG market (November 2, 2026)Lighter Robinhood instance API: number of perpetual markets, 24-hour volume, open interest (November 2, 2026)smarts: mGLO supply (block 26,328,375)
—
This is Chapter 1 of 14 from my new book Where the Yield Comes From, serialized one chapter a day. For research only; not investment advice.
Author: Blue Lotus
#DeFi #RobinhoodChain #Stablecoins #RWA
452
Robinhood Chain的数据,现在网上传的版本能差出好几百倍,喊“Robinhood季”的人自己都没对过账。
X上同一天出的两篇热门总结,一篇写日成交84.2万美元,另一篇写24小时DEX成交4.1亿美元。前几天社区里还有人转“DEX量1200亿”。这几个数,你随便挑一个都能编出一套故事。
我去DefiLlama查了一下:TVL约10.8亿美元,24小时DEX成交约3.1亿,近30天合计约217.7亿。也就是说,84.2万那个说法差了几百倍,根本不能用。
更值得看的是走势。10月14日单日最高11.29亿,11月5日Tenev喊“trenches are calling”那几天冲到9.79亿,11月7日直接掉到3.01亿,是这30天里最低的一天。周末本来就会缩量,这点我承认,可之前两个周末都没跌破3.5亿。
TVL十亿出头,一天DEX成交却能做到好几亿,这钱主要是在meme和NFT之间来回倒,不是什么代币化股票的真需求。券商自己的链,赚的就是你的换手。
数据都能查,懒得查的就只能接别人的故事。
#RobinhoodChain
Robinhood Chain的数据,现在网上传的版本能差出好几百倍,喊“Robinhood季”的人自己都没对过账。
X上同一天出的两篇热门总结,一篇写日成交84.2万美元,另一篇写24小时DEX成交4.1亿美元。前几天社区里还有人转“DEX量1200亿”。这几个数,你随便挑一个都能编出一套故事。
我去DefiLlama查了一下:TVL约10.8亿美元,24小时DEX成交约3.1亿,近30天合计约217.7亿。也就是说,84.2万那个说法差了几百倍,根本不能用。
更值得看的是走势。10月14日单日最高11.29亿,11月5日Tenev喊“trenches are calling”那几天冲到9.79亿,11月7日直接掉到3.01亿,是这30天里最低的一天。周末本来就会缩量,这点我承认,可之前两个周末都没跌破3.5亿。
TVL十亿出头,一天DEX成交却能做到好几亿,这钱主要是在meme和NFT之间来回倒,不是什么代币化股票的真需求。券商自己的链,赚的就是你的换手。
数据都能查,懒得查的就只能接别人的故事。
#RobinhoodChain
X上同一天出的两篇热门总结,一篇写日成交84.2万美元,另一篇写24小时DEX成交4.1亿美元。前几天社区里还有人转“DEX量1200亿”。这几个数,你随便挑一个都能编出一套故事。
我去DefiLlama查了一下:TVL约10.8亿美元,24小时DEX成交约3.1亿,近30天合计约217.7亿。也就是说,84.2万那个说法差了几百倍,根本不能用。
更值得看的是走势。10月14日单日最高11.29亿,11月5日Tenev喊“trenches are calling”那几天冲到9.79亿,11月7日直接掉到3.01亿,是这30天里最低的一天。周末本来就会缩量,这点我承认,可之前两个周末都没跌破3.5亿。
TVL十亿出头,一天DEX成交却能做到好几亿,这钱主要是在meme和NFT之间来回倒,不是什么代币化股票的真需求。券商自己的链,赚的就是你的换手。
数据都能查,懒得查的就只能接别人的故事。
#RobinhoodChain
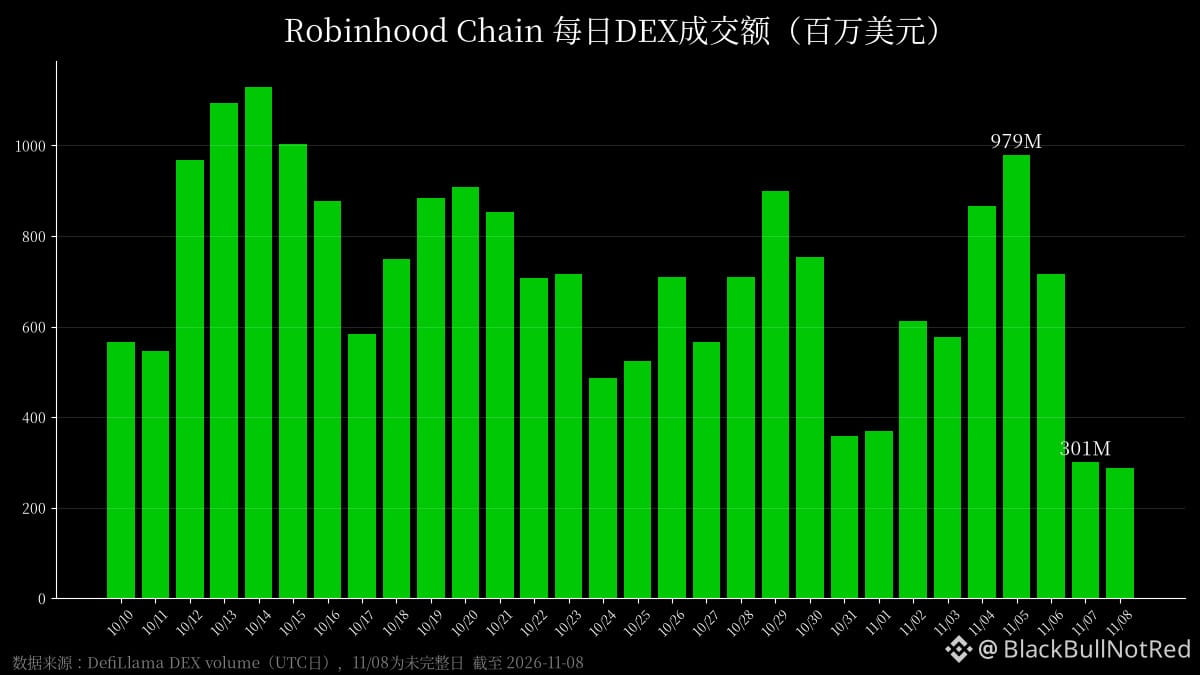
41
Robinhood Chain这波NFT行情,说白了就是"拿A送B白名单"的接力赛。
WIF Outlaws(2222张)地板据X新闻一天涨了20%-40%,推手还是那位crypto_czar_eth,口号是"Outlaw fp 1000刀 by Christmas... Coded"。
同一个人,之前喊Quotrons 10 ETH地板,后来被扒出卖了大约三分之一仓位,现在Quotrons掉到0.949 ETH左右,两个月来第一次跌破1 ETH,高点可是3.5 ETH。
再看需求从哪来:
Web Hood宣布跟WIF Outlaws合作,持2张Outlaws才保证有mint位,而且Web Hood自己"社区太火"把供应加到3000张。
TOTZ那边,快照时Outlaws持仓前100的钱包各送一个免费mint。
所以你买的不是一张骷髅头图,是下一个项目的门票。门票值钱的前提是下一个项目也有人接,下一个项目又靠再下一个……这种套娃涨得快,断一环就是Quotrons那样,没人管谁先跑的。
喊单的人一句"Coded"零成本,地板拉上去,最先能出货的是手里早就有货的人。你要玩就当短线门票玩,别听"generational wealth"那套,喊这词的号有的自己就几百粉。
#NFT #RobinhoodChain
Robinhood Chain这波NFT行情,说白了就是"拿A送B白名单"的接力赛。
WIF Outlaws(2222张)地板据X新闻一天涨了20%-40%,推手还是那位crypto_czar_eth,口号是"Outlaw fp 1000刀 by Christmas... Coded"。
同一个人,之前喊Quotrons 10 ETH地板,后来被扒出卖了大约三分之一仓位,现在Quotrons掉到0.949 ETH左右,两个月来第一次跌破1 ETH,高点可是3.5 ETH。
再看需求从哪来:
Web Hood宣布跟WIF Outlaws合作,持2张Outlaws才保证有mint位,而且Web Hood自己"社区太火"把供应加到3000张。
TOTZ那边,快照时Outlaws持仓前100的钱包各送一个免费mint。
所以你买的不是一张骷髅头图,是下一个项目的门票。门票值钱的前提是下一个项目也有人接,下一个项目又靠再下一个……这种套娃涨得快,断一环就是Quotrons那样,没人管谁先跑的。
喊单的人一句"Coded"零成本,地板拉上去,最先能出货的是手里早就有货的人。你要玩就当短线门票玩,别听"generational wealth"那套,喊这词的号有的自己就几百粉。
#NFT #RobinhoodChain
WIF Outlaws(2222张)地板据X新闻一天涨了20%-40%,推手还是那位crypto_czar_eth,口号是"Outlaw fp 1000刀 by Christmas... Coded"。
同一个人,之前喊Quotrons 10 ETH地板,后来被扒出卖了大约三分之一仓位,现在Quotrons掉到0.949 ETH左右,两个月来第一次跌破1 ETH,高点可是3.5 ETH。
再看需求从哪来:
Web Hood宣布跟WIF Outlaws合作,持2张Outlaws才保证有mint位,而且Web Hood自己"社区太火"把供应加到3000张。
TOTZ那边,快照时Outlaws持仓前100的钱包各送一个免费mint。
所以你买的不是一张骷髅头图,是下一个项目的门票。门票值钱的前提是下一个项目也有人接,下一个项目又靠再下一个……这种套娃涨得快,断一环就是Quotrons那样,没人管谁先跑的。
喊单的人一句"Coded"零成本,地板拉上去,最先能出货的是手里早就有货的人。你要玩就当短线门票玩,别听"generational wealth"那套,喊这词的号有的自己就几百粉。
#NFT #RobinhoodChain
10
Robinhood Chain的NFT现在玩的是一套很老的套娃。
Suited Ape Society,2222张,地板从200刀左右爬到500刀出头,X新闻给的总成交量也就50万刀上下。50万刀,放以太坊主网都不够一个蓝筹一天的零头,在这儿就能撑起一轮"牛"。
真正推着地板走的不是什么staking、poker、游戏、挖矿分红这一长串utility,是"持有就送下一个"。@crypto_czar_eth那条5700多浏览的帖子说得很直白:没有Outlaw、Suited Ape、Vaultling就是因为你卖了,我等着作为Suited Ape持有人领免费的Mutant。之前Vaultlings也是这个路数,SAS持有人拿GTD。
逻辑链很简单:新项目免费送给老项目持有人 → 老项目地板涨 → 大家再去等下一个免费mint。每一层的价值都是下一层"送"出来的。这种结构在2021年的以太坊上已经跑过一遍了,最后接盘的都是在地板最高那段冲进来想"拿资格"的人。
评论区一水的"Need to get myself a suited ape soon""1 ETH 🚀",这就是信号,不是情绪好,是新钱终于被喊来了。
我不是说它马上归零,社区和团队开发速度可能是真的。但500刀买的到底是一张图,还是一张"下一个空投的门票",自己想清楚。门票这东西,送的越多越不值钱。
#RobinhoodChain #NFT
Robinhood Chain的NFT现在玩的是一套很老的套娃。
Suited Ape Society,2222张,地板从200刀左右爬到500刀出头,X新闻给的总成交量也就50万刀上下。50万刀,放以太坊主网都不够一个蓝筹一天的零头,在这儿就能撑起一轮"牛"。
真正推着地板走的不是什么staking、poker、游戏、挖矿分红这一长串utility,是"持有就送下一个"。@crypto_czar_eth那条5700多浏览的帖子说得很直白:没有Outlaw、Suited Ape、Vaultling就是因为你卖了,我等着作为Suited Ape持有人领免费的Mutant。之前Vaultlings也是这个路数,SAS持有人拿GTD。
逻辑链很简单:新项目免费送给老项目持有人 → 老项目地板涨 → 大家再去等下一个免费mint。每一层的价值都是下一层"送"出来的。这种结构在2021年的以太坊上已经跑过一遍了,最后接盘的都是在地板最高那段冲进来想"拿资格"的人。
评论区一水的"Need to get myself a suited ape soon""1 ETH 🚀",这就是信号,不是情绪好,是新钱终于被喊来了。
我不是说它马上归零,社区和团队开发速度可能是真的。但500刀买的到底是一张图,还是一张"下一个空投的门票",自己想清楚。门票这东西,送的越多越不值钱。
#RobinhoodChain #NFT
Suited Ape Society,2222张,地板从200刀左右爬到500刀出头,X新闻给的总成交量也就50万刀上下。50万刀,放以太坊主网都不够一个蓝筹一天的零头,在这儿就能撑起一轮"牛"。
真正推着地板走的不是什么staking、poker、游戏、挖矿分红这一长串utility,是"持有就送下一个"。@crypto_czar_eth那条5700多浏览的帖子说得很直白:没有Outlaw、Suited Ape、Vaultling就是因为你卖了,我等着作为Suited Ape持有人领免费的Mutant。之前Vaultlings也是这个路数,SAS持有人拿GTD。
逻辑链很简单:新项目免费送给老项目持有人 → 老项目地板涨 → 大家再去等下一个免费mint。每一层的价值都是下一层"送"出来的。这种结构在2021年的以太坊上已经跑过一遍了,最后接盘的都是在地板最高那段冲进来想"拿资格"的人。
评论区一水的"Need to get myself a suited ape soon""1 ETH 🚀",这就是信号,不是情绪好,是新钱终于被喊来了。
我不是说它马上归零,社区和团队开发速度可能是真的。但500刀买的到底是一张图,还是一张"下一个空投的门票",自己想清楚。门票这东西,送的越多越不值钱。
#RobinhoodChain #NFT
12
Robinhood Chain这波热度一起来,NFT挖矿盘的老剧本已经整套搬过去了。
看了一圈HoodMiners:5000个NFT矿机,挖MINR,合并两台矿机烧一台,每次合并烧10万MINR。持有人发帖统一一句"Supply only goes down"。
供应只降?有人10月14日晒单,1台矿机第4个epoch领了689.5枚MINR。一边每个epoch往外印,一边靠玩家自己合并来烧,这叫通缩?这叫让接盘的人自己掏钱维持叙事。
更有意思的是它那个"InfoFi"活动:按你在X上的"verified activity"发奖励。翻一下相关帖,大量回复是"Support hoodminers""campaign sounds interesting for sure""ui actually decent"这种,浏览个位数到几十。这不是社区,这是计件刷评论。
然后第一个用它InfoFi平台的客户是TeraMap,就是现在新闻里那个3333块地、每块地挂股票代币资源属性、TERA代币用途"未来再说"的城市游戏。两家互相站台,再一起被模板号刷成"Robinhood Chain生态爆发"。
Robinhood这条链本身有没有价值是另一回事,但链上第一批赚钱的,通常是发矿机和发地块的人。你要冲随便,别把刷出来的热度当需求。
#RobinhoodChain #NFT
Robinhood Chain这波热度一起来,NFT挖矿盘的老剧本已经整套搬过去了。
看了一圈HoodMiners:5000个NFT矿机,挖MINR,合并两台矿机烧一台,每次合并烧10万MINR。持有人发帖统一一句"Supply only goes down"。
供应只降?有人10月14日晒单,1台矿机第4个epoch领了689.5枚MINR。一边每个epoch往外印,一边靠玩家自己合并来烧,这叫通缩?这叫让接盘的人自己掏钱维持叙事。
更有意思的是它那个"InfoFi"活动:按你在X上的"verified activity"发奖励。翻一下相关帖,大量回复是"Support hoodminers""campaign sounds interesting for sure""ui actually decent"这种,浏览个位数到几十。这不是社区,这是计件刷评论。
然后第一个用它InfoFi平台的客户是TeraMap,就是现在新闻里那个3333块地、每块地挂股票代币资源属性、TERA代币用途"未来再说"的城市游戏。两家互相站台,再一起被模板号刷成"Robinhood Chain生态爆发"。
Robinhood这条链本身有没有价值是另一回事,但链上第一批赚钱的,通常是发矿机和发地块的人。你要冲随便,别把刷出来的热度当需求。
#RobinhoodChain #NFT
看了一圈HoodMiners:5000个NFT矿机,挖MINR,合并两台矿机烧一台,每次合并烧10万MINR。持有人发帖统一一句"Supply only goes down"。
供应只降?有人10月14日晒单,1台矿机第4个epoch领了689.5枚MINR。一边每个epoch往外印,一边靠玩家自己合并来烧,这叫通缩?这叫让接盘的人自己掏钱维持叙事。
更有意思的是它那个"InfoFi"活动:按你在X上的"verified activity"发奖励。翻一下相关帖,大量回复是"Support hoodminers""campaign sounds interesting for sure""ui actually decent"这种,浏览个位数到几十。这不是社区,这是计件刷评论。
然后第一个用它InfoFi平台的客户是TeraMap,就是现在新闻里那个3333块地、每块地挂股票代币资源属性、TERA代币用途"未来再说"的城市游戏。两家互相站台,再一起被模板号刷成"Robinhood Chain生态爆发"。
Robinhood这条链本身有没有价值是另一回事,但链上第一批赚钱的,通常是发矿机和发地块的人。你要冲随便,别把刷出来的热度当需求。
#RobinhoodChain #NFT
11
"超2万亿美元资产背书",这句话今天被刷了一圈,我看着就想笑。
Robinhood Chain 新上8个股票代币:摩根大通、Visa、PayPal、迪士尼、麦当劳、Uber、BitMine,外加一个金矿股ETF GDX。官方原话是这几家底层合计市值超2万亿,到了二道贩子嘴里就成了"2万亿背书"。市值是市值,背书是背书,你手里那个ERC-20背后有多少真股票,跟摩根大通值多少钱半毛钱关系没有。
更好玩的是BMNR粉丝号,标题直接写"BitMine和摩根大通、Visa、PayPal平起平坐"。兄弟,那是上架,不是评级。一家ETH财库公司跟麦当劳摆一个货架,说明的是Robinhood想凑数,不是BitMine变蓝筹。
还有,这东西写的是"合格投资者"可交易,24/7,财报季也能交易。听着很爽,财报夜美股盘后休市,链上照样能砸,流动性薄成纸的时候谁给你接?价差谁吃?
代币化股票我不反对,方向没毛病。但每上一批就有人复制粘贴"IT'S HAPPENING",真正赚到的是平台的手续费和喊单号的流量。
#代币化股票 #RobinhoodChain
"超2万亿美元资产背书",这句话今天被刷了一圈,我看着就想笑。
Robinhood Chain 新上8个股票代币:摩根大通、Visa、PayPal、迪士尼、麦当劳、Uber、BitMine,外加一个金矿股ETF GDX。官方原话是这几家底层合计市值超2万亿,到了二道贩子嘴里就成了"2万亿背书"。市值是市值,背书是背书,你手里那个ERC-20背后有多少真股票,跟摩根大通值多少钱半毛钱关系没有。
更好玩的是BMNR粉丝号,标题直接写"BitMine和摩根大通、Visa、PayPal平起平坐"。兄弟,那是上架,不是评级。一家ETH财库公司跟麦当劳摆一个货架,说明的是Robinhood想凑数,不是BitMine变蓝筹。
还有,这东西写的是"合格投资者"可交易,24/7,财报季也能交易。听着很爽,财报夜美股盘后休市,链上照样能砸,流动性薄成纸的时候谁给你接?价差谁吃?
代币化股票我不反对,方向没毛病。但每上一批就有人复制粘贴"IT'S HAPPENING",真正赚到的是平台的手续费和喊单号的流量。
#代币化股票 #RobinhoodChain
Robinhood Chain 新上8个股票代币:摩根大通、Visa、PayPal、迪士尼、麦当劳、Uber、BitMine,外加一个金矿股ETF GDX。官方原话是这几家底层合计市值超2万亿,到了二道贩子嘴里就成了"2万亿背书"。市值是市值,背书是背书,你手里那个ERC-20背后有多少真股票,跟摩根大通值多少钱半毛钱关系没有。
更好玩的是BMNR粉丝号,标题直接写"BitMine和摩根大通、Visa、PayPal平起平坐"。兄弟,那是上架,不是评级。一家ETH财库公司跟麦当劳摆一个货架,说明的是Robinhood想凑数,不是BitMine变蓝筹。
还有,这东西写的是"合格投资者"可交易,24/7,财报季也能交易。听着很爽,财报夜美股盘后休市,链上照样能砸,流动性薄成纸的时候谁给你接?价差谁吃?
代币化股票我不反对,方向没毛病。但每上一批就有人复制粘贴"IT'S HAPPENING",真正赚到的是平台的手续费和喊单号的流量。
#代币化股票 #RobinhoodChain
51

·
--
Umia 打响 Robinhood Chain 首发项目:开源软件资助与激励平台 Slop Cash 定档 11 月 5 日上线。其亮点不仅是“新链首个项目”,还在于 ai16z 创始人 Shaw 担任联合创始人兼 CTO,叙事叠加 AI、开源激励与名人效应。
关键时间点:
11 月 5 日:在 Umia 上线
11 月 6 日 01:00:预竞价开启
11 月 8 日 01:00:正式竞价开启
11 月 11 日 01:00:拍卖结束,出价资产为 USDG
短线看首发热度与 Shaw 的号召力,中线则要观察拍卖成本、募资规模和上线后的承接力度。新链、新平台、新项目三重叠加,波动和不确定性都不低,建议先看清竞价与解锁规则,别因名人叙事盲目追高。
#RobinhoodChain #Umia #SlopCash
Umia 打响 Robinhood Chain 首发项目:开源软件资助与激励平台 Slop Cash 定档 11 月 5 日上线。其亮点不仅是“新链首个项目”,还在于 ai16z 创始人 Shaw 担任联合创始人兼 CTO,叙事叠加 AI、开源激励与名人效应。
关键时间点:
11 月 5 日:在 Umia 上线
11 月 6 日 01:00:预竞价开启
11 月 8 日 01:00:正式竞价开启
11 月 11 日 01:00:拍卖结束,出价资产为 USDG
短线看首发热度与 Shaw 的号召力,中线则要观察拍卖成本、募资规模和上线后的承接力度。新链、新平台、新项目三重叠加,波动和不确定性都不低,建议先看清竞价与解锁规则,别因名人叙事盲目追高。
#RobinhoodChain #Umia #SlopCash
关键时间点:
11 月 5 日:在 Umia 上线
11 月 6 日 01:00:预竞价开启
11 月 8 日 01:00:正式竞价开启
11 月 11 日 01:00:拍卖结束,出价资产为 USDG
短线看首发热度与 Shaw 的号召力,中线则要观察拍卖成本、募资规模和上线后的承接力度。新链、新平台、新项目三重叠加,波动和不确定性都不低,建议先看清竞价与解锁规则,别因名人叙事盲目追高。
#RobinhoodChain #Umia #SlopCash
11

·
--
Рост
спот мінус 23.1%, перпи мінус 4.62%. це Robinhood Chain за тиждень.
за даними DefiLlama, спотовий обсяг DEX за сім днів — $5.255 млрд.
перпетуалів за той самий тиждень — $6.869 млрд.
тобто деривативи там уже більші за спот, і просіли значно менше.
депозити в DeFi — $1.132 млрд, на місці. гроші з мережі не тікають.
стейблкоїнів $1.05 млрд, з них 64.6% припадає на USDG — уся ліквідність висить на одному стейблі, і це вже окремий ризик.
заголовки про падіння обсягу читаються як втеча. по цифрах тікає спотовий оберт, а не капітал.
стежу за депозитами: поки $1.132 млрд на місці, про відтік говорити рано.
питання одне: це звичайний спад після запуску чи трейдери там поступово міняють спот на перпи? я схиляюсь до другого, але доказу поки нема — тре ще пару тижнів даних.
#robinhoodchain #DEX #DeFiLlama #PERPS #USDG
спот мінус 23.1%, перпи мінус 4.62%. це Robinhood Chain за тиждень.
за даними DefiLlama, спотовий обсяг DEX за сім днів — $5.255 млрд.
перпетуалів за той самий тиждень — $6.869 млрд.
тобто деривативи там уже більші за спот, і просіли значно менше.
депозити в DeFi — $1.132 млрд, на місці. гроші з мережі не тікають.
стейблкоїнів $1.05 млрд, з них 64.6% припадає на USDG — уся ліквідність висить на одному стейблі, і це вже окремий ризик.
заголовки про падіння обсягу читаються як втеча. по цифрах тікає спотовий оберт, а не капітал.
стежу за депозитами: поки $1.132 млрд на місці, про відтік говорити рано.
питання одне: це звичайний спад після запуску чи трейдери там поступово міняють спот на перпи? я схиляюсь до другого, але доказу поки нема — тре ще пару тижнів даних.
#robinhoodchain #DEX #DeFiLlama #PERPS #USDG
за даними DefiLlama, спотовий обсяг DEX за сім днів — $5.255 млрд.
перпетуалів за той самий тиждень — $6.869 млрд.
тобто деривативи там уже більші за спот, і просіли значно менше.
депозити в DeFi — $1.132 млрд, на місці. гроші з мережі не тікають.
стейблкоїнів $1.05 млрд, з них 64.6% припадає на USDG — уся ліквідність висить на одному стейблі, і це вже окремий ризик.
заголовки про падіння обсягу читаються як втеча. по цифрах тікає спотовий оберт, а не капітал.
стежу за депозитами: поки $1.132 млрд на місці, про відтік говорити рано.
питання одне: це звичайний спад після запуску чи трейдери там поступово міняють спот на перпи? я схиляюсь до другого, але доказу поки нема — тре ще пару тижнів даних.
#robinhoodchain #DEX #DeFiLlama #PERPS #USDG

17

链上风投协议 Umia 宣布,开源软件资助与激励平台 Slop Cash(代币 SLOP)将作为首个项目于 11 月 5 日上线,并部署至 Robinhood Chain。项目关注度不低:其联合创始人兼 CTO 是 ai16z 创始人 Shaw。
时间点先记好:预竞价于北京时间 11 月 6 日 1:00 开启,正式竞价于 11 月 8 日 1:00 开启,11 月 11 日 1:00 结束,出价资产为 USDG。作为 Umia 的首发项目,这场拍卖的参与热度和定价表现,可作为观察新兴发射平台与 Robinhood Chain 生态的一个窗口。
新链、新平台、名人效应叠加,波动与不确定性同样会被放大。参与前建议仔细研究拍卖规则、授标机制与锁仓安排,别只盯着创始人光环。
#Umia #SlopCash #RobinhoodChain
链上风投协议 Umia 宣布,开源软件资助与激励平台 Slop Cash(代币 SLOP)将作为首个项目于 11 月 5 日上线,并部署至 Robinhood Chain。项目关注度不低:其联合创始人兼 CTO 是 ai16z 创始人 Shaw。
时间点先记好:预竞价于北京时间 11 月 6 日 1:00 开启,正式竞价于 11 月 8 日 1:00 开启,11 月 11 日 1:00 结束,出价资产为 USDG。作为 Umia 的首发项目,这场拍卖的参与热度和定价表现,可作为观察新兴发射平台与 Robinhood Chain 生态的一个窗口。
新链、新平台、名人效应叠加,波动与不确定性同样会被放大。参与前建议仔细研究拍卖规则、授标机制与锁仓安排,别只盯着创始人光环。
#Umia #SlopCash #RobinhoodChain
时间点先记好:预竞价于北京时间 11 月 6 日 1:00 开启,正式竞价于 11 月 8 日 1:00 开启,11 月 11 日 1:00 结束,出价资产为 USDG。作为 Umia 的首发项目,这场拍卖的参与热度和定价表现,可作为观察新兴发射平台与 Robinhood Chain 生态的一个窗口。
新链、新平台、名人效应叠加,波动与不确定性同样会被放大。参与前建议仔细研究拍卖规则、授标机制与锁仓安排,别只盯着创始人光环。
#Umia #SlopCash #RobinhoodChain
13
Robinhood Chain 现在最热的不是链本身,是“下一个CashCat”这几个字。
翻了下X:同一个号 @OMG2el13 在10月26日 15:00、15:02、15:03(UTC)三分钟里,把同一段“KURO – The Next CashCat on Robinhood Chain?”贴进三个不同人的回复区,浏览量分别是2、0、5。卖点:日本猫 + AI + 全球动画热度。就这。
还有那条“EARLY GAMEFI ALPHA: 8 PROJECTS TO WATCH ON ROBINHOOD CHAIN”,@Escanor0X0 26号发过一遍,@Menionchain 27号一字不差再发,而且同一分钟连发两次。所谓alpha,其实是模板。
不是说这条链没东西。有人拿数据对比过,Robinhood Chain约11.3亿刀TVL、日DEX成交约5.52亿,比刚宣布发币的Soneium大出一截,数字自己去DefiLlama核一下。但叙事一旦变成“找下一个XX”,基本就是上一个XX的早期筹码在找下家。CashCat跑出来不代表同链的猫都能跑,只代表接下来会有一百只猫排队等你。
周二美股收盘后Robinhood财报,这条链会被反复拉出来炒,回复区的next 100x只会更多。同一段话看到第三遍,直接屏蔽。
#RobinhoodChain
Robinhood Chain 现在最热的不是链本身,是“下一个CashCat”这几个字。
翻了下X:同一个号 @OMG2el13 在10月26日 15:00、15:02、15:03(UTC)三分钟里,把同一段“KURO – The Next CashCat on Robinhood Chain?”贴进三个不同人的回复区,浏览量分别是2、0、5。卖点:日本猫 + AI + 全球动画热度。就这。
还有那条“EARLY GAMEFI ALPHA: 8 PROJECTS TO WATCH ON ROBINHOOD CHAIN”,@Escanor0X0 26号发过一遍,@Menionchain 27号一字不差再发,而且同一分钟连发两次。所谓alpha,其实是模板。
不是说这条链没东西。有人拿数据对比过,Robinhood Chain约11.3亿刀TVL、日DEX成交约5.52亿,比刚宣布发币的Soneium大出一截,数字自己去DefiLlama核一下。但叙事一旦变成“找下一个XX”,基本就是上一个XX的早期筹码在找下家。CashCat跑出来不代表同链的猫都能跑,只代表接下来会有一百只猫排队等你。
周二美股收盘后Robinhood财报,这条链会被反复拉出来炒,回复区的next 100x只会更多。同一段话看到第三遍,直接屏蔽。
#RobinhoodChain
翻了下X:同一个号 @OMG2el13 在10月26日 15:00、15:02、15:03(UTC)三分钟里,把同一段“KURO – The Next CashCat on Robinhood Chain?”贴进三个不同人的回复区,浏览量分别是2、0、5。卖点:日本猫 + AI + 全球动画热度。就这。
还有那条“EARLY GAMEFI ALPHA: 8 PROJECTS TO WATCH ON ROBINHOOD CHAIN”,@Escanor0X0 26号发过一遍,@Menionchain 27号一字不差再发,而且同一分钟连发两次。所谓alpha,其实是模板。
不是说这条链没东西。有人拿数据对比过,Robinhood Chain约11.3亿刀TVL、日DEX成交约5.52亿,比刚宣布发币的Soneium大出一截,数字自己去DefiLlama核一下。但叙事一旦变成“找下一个XX”,基本就是上一个XX的早期筹码在找下家。CashCat跑出来不代表同链的猫都能跑,只代表接下来会有一百只猫排队等你。
周二美股收盘后Robinhood财报,这条链会被反复拉出来炒,回复区的next 100x只会更多。同一段话看到第三遍,直接屏蔽。
#RobinhoodChain
6

·
--
⛏️ 链上最稳的从来不是冲土狗的人,而是收「过路费」的发行平台——Robinhood Chain 的 PONS 今天仍以约 $1,077 万成交额居该链榜首。
但「卖铲子」的生意有它的暗面。9 月底链上分析师 Wazz 曝出:同一个操作在 Robinhood Chain 约 53 个 Meme 发行里,用 70–200 个钱包抢走 70% 以上筹码,至少抽走约 $1,843 万,最大几笔是 CRUMBS(约 $312 万)、LEGS(约 $290 万)、PINK(约 $144 万)。手法很固定:发行瞬间批量买入清空 bonding curve,再把筹码倒给后进来的散户。
我的判断:平台币(PONS)赚的是发行热度,本质是「过路费」——只要还有人发币、有人交易,它就有现金流;反过来,一旦 rug/抢跑事件频发、散户被反复抽水,用户的信任和发行热度就会流失,收入预期跟着下行。这是它和纯表情包 Meme 最大的区别,也是最大的长期变量。
所以更值得盯的不是 PONS 今天涨没涨,而是:链上新增发行的「质量」和「数量」会不会因为这类事件出现剪刀差。
你玩 Meme 会更在意「平台抽水/抢跑风险」,还是只盯着 K 线?🤔
#Binance #PONS #RobinhoodChain #MemeCoin(观察,非投资建议)
⛏️ 链上最稳的从来不是冲土狗的人,而是收「过路费」的发行平台——Robinhood Chain 的 PONS 今天仍以约 $1,077 万成交额居该链榜首。
但「卖铲子」的生意有它的暗面。9 月底链上分析师 Wazz 曝出:同一个操作在 Robinhood Chain 约 53 个 Meme 发行里,用 70–200 个钱包抢走 70% 以上筹码,至少抽走约 $1,843 万,最大几笔是 CRUMBS(约 $312 万)、LEGS(约 $290 万)、PINK(约 $144 万)。手法很固定:发行瞬间批量买入清空 bonding curve,再把筹码倒给后进来的散户。
我的判断:平台币(PONS)赚的是发行热度,本质是「过路费」——只要还有人发币、有人交易,它就有现金流;反过来,一旦 rug/抢跑事件频发、散户被反复抽水,用户的信任和发行热度就会流失,收入预期跟着下行。这是它和纯表情包 Meme 最大的区别,也是最大的长期变量。
所以更值得盯的不是 PONS 今天涨没涨,而是:链上新增发行的「质量」和「数量」会不会因为这类事件出现剪刀差。
你玩 Meme 会更在意「平台抽水/抢跑风险」,还是只盯着 K 线?🤔
#Binance #PONS #RobinhoodChain #MemeCoin(观察,非投资建议)
但「卖铲子」的生意有它的暗面。9 月底链上分析师 Wazz 曝出:同一个操作在 Robinhood Chain 约 53 个 Meme 发行里,用 70–200 个钱包抢走 70% 以上筹码,至少抽走约 $1,843 万,最大几笔是 CRUMBS(约 $312 万)、LEGS(约 $290 万)、PINK(约 $144 万)。手法很固定:发行瞬间批量买入清空 bonding curve,再把筹码倒给后进来的散户。
我的判断:平台币(PONS)赚的是发行热度,本质是「过路费」——只要还有人发币、有人交易,它就有现金流;反过来,一旦 rug/抢跑事件频发、散户被反复抽水,用户的信任和发行热度就会流失,收入预期跟着下行。这是它和纯表情包 Meme 最大的区别,也是最大的长期变量。
所以更值得盯的不是 PONS 今天涨没涨,而是:链上新增发行的「质量」和「数量」会不会因为这类事件出现剪刀差。
你玩 Meme 会更在意「平台抽水/抢跑风险」,还是只盯着 K 线?🤔
#Binance #PONS #RobinhoodChain #MemeCoin(观察,非投资建议)
1
1.1k
99%的买入税,被包装成"防狙击",评论区一片叫好,我看着有点想笑。
Robinhood Chain上的The Mutual Fun今天开盘:Pass持有人先mint Seat,两个一共0.02 ETH,钱进五个社区基金之一;TMF同步在Stonkbrokers上线,开盘税99%,之后随时间往下降。
翻译成人话:开盘那一下你冲进去,付全价,拿1%的币。这不是我说的,@Cryptking_1 自己帖子里写得明明白白,"paying full price but receiving only 1%"。
那被扣掉的99%去哪了?Seat的钱进基金说得很清楚,税的去向我翻了一圈热帖,没看到谁讲明白。没讲明白的东西,默认就不是给你准备的。
再看喊的人。"NFTs are making a comeback","今天CT唯一在聊的mint",一边说自己没Pass、等二级冷下来再捡便宜,一边帮着把热度往上抬。热度越高,越多人在高税阶段忍不住手痒。
防狙击防的是机器人,最后交学费的往往是急性子散户。税没降到个位数之前,我一个子都不碰。
#TMF #RobinhoodChain
99%的买入税,被包装成"防狙击",评论区一片叫好,我看着有点想笑。
Robinhood Chain上的The Mutual Fun今天开盘:Pass持有人先mint Seat,两个一共0.02 ETH,钱进五个社区基金之一;TMF同步在Stonkbrokers上线,开盘税99%,之后随时间往下降。
翻译成人话:开盘那一下你冲进去,付全价,拿1%的币。这不是我说的,@Cryptking_1 自己帖子里写得明明白白,"paying full price but receiving only 1%"。
那被扣掉的99%去哪了?Seat的钱进基金说得很清楚,税的去向我翻了一圈热帖,没看到谁讲明白。没讲明白的东西,默认就不是给你准备的。
再看喊的人。"NFTs are making a comeback","今天CT唯一在聊的mint",一边说自己没Pass、等二级冷下来再捡便宜,一边帮着把热度往上抬。热度越高,越多人在高税阶段忍不住手痒。
防狙击防的是机器人,最后交学费的往往是急性子散户。税没降到个位数之前,我一个子都不碰。
#TMF #RobinhoodChain
Robinhood Chain上的The Mutual Fun今天开盘:Pass持有人先mint Seat,两个一共0.02 ETH,钱进五个社区基金之一;TMF同步在Stonkbrokers上线,开盘税99%,之后随时间往下降。
翻译成人话:开盘那一下你冲进去,付全价,拿1%的币。这不是我说的,@Cryptking_1 自己帖子里写得明明白白,"paying full price but receiving only 1%"。
那被扣掉的99%去哪了?Seat的钱进基金说得很清楚,税的去向我翻了一圈热帖,没看到谁讲明白。没讲明白的东西,默认就不是给你准备的。
再看喊的人。"NFTs are making a comeback","今天CT唯一在聊的mint",一边说自己没Pass、等二级冷下来再捡便宜,一边帮着把热度往上抬。热度越高,越多人在高税阶段忍不住手痒。
防狙击防的是机器人,最后交学费的往往是急性子散户。税没降到个位数之前,我一个子都不碰。
#TMF #RobinhoodChain
24

·
--
Robinhood Chain's Meme Party Is Officially Over (Down 99.6%) 🎉💀
Remember when Robinhood Chain was the hottest meme battleground of 2026? Daily gas fees hit $8.4M on September 4. By October 18, they were $34,000. That's a 99.6% collapse. The party didn't end. It evaporated.
Here's the autopsy :
🔹 The launchpad economy died first — Pons V2 fee revenue dropped from $87M to $7M (-92%). GMGN fell from $22M to $900K (-96%). Axiom from $4.6M to $300K (-94%). The infrastructure that fed the meme frenzy is now a ghost town .
🔹 The tokens are basically dead — Median drawdown from all-time highs for Robinhood Chain memes is 97%. 72% of tokens are down 90% or more. The "tokenized stock + meme" narrative that looked like the future in September is now a cautionary tale .
🔹 But here's the weird part — The chain still has 873,000 active wallets and $1.05B TVL**, with **$480M sitting in Morpho stablecoin lending vaults. The speculators left. The yield farmers stayed. Robinhood Chain didn't die — it just stopped being a casino and became a bank .
The takeaway ? This is what happens when a chain built for tokenized stocks gets hijacked by memecoins. The speculation burns hot, then burns out. The real capital — the stablecoin yield crowd — doesn't care about your 10,000% launch. They care about 7% APY.
Pro tip : When a chain's fee revenue drops 99% in six weeks, the memes are gone. The question is whether the infrastructure survives without them. For Robinhood Chain, the answer is apparently yes — just not the part degens care about.
#memecoin #robinhoodchain #pons
Robinhood Chain's Meme Party Is Officially Over (Down 99.6%) 🎉💀
Remember when Robinhood Chain was the hottest meme battleground of 2026? Daily gas fees hit $8.4M on September 4. By October 18, they were $34,000. That's a 99.6% collapse. The party didn't end. It evaporated.
Here's the autopsy :
🔹 The launchpad economy died first — Pons V2 fee revenue dropped from $87M to $7M (-92%). GMGN fell from $22M to $900K (-96%). Axiom from $4.6M to $300K (-94%). The infrastructure that fed the meme frenzy is now a ghost town .
🔹 The tokens are basically dead — Median drawdown from all-time highs for Robinhood Chain memes is 97%. 72% of tokens are down 90% or more. The "tokenized stock + meme" narrative that looked like the future in September is now a cautionary tale .
🔹 But here's the weird part — The chain still has 873,000 active wallets and $1.05B TVL**, with **$480M sitting in Morpho stablecoin lending vaults. The speculators left. The yield farmers stayed. Robinhood Chain didn't die — it just stopped being a casino and became a bank .
The takeaway ? This is what happens when a chain built for tokenized stocks gets hijacked by memecoins. The speculation burns hot, then burns out. The real capital — the stablecoin yield crowd — doesn't care about your 10,000% launch. They care about 7% APY.
Pro tip : When a chain's fee revenue drops 99% in six weeks, the memes are gone. The question is whether the infrastructure survives without them. For Robinhood Chain, the answer is apparently yes — just not the part degens care about.
#memecoin #robinhoodchain #pons
Remember when Robinhood Chain was the hottest meme battleground of 2026? Daily gas fees hit $8.4M on September 4. By October 18, they were $34,000. That's a 99.6% collapse. The party didn't end. It evaporated.
Here's the autopsy :
🔹 The launchpad economy died first — Pons V2 fee revenue dropped from $87M to $7M (-92%). GMGN fell from $22M to $900K (-96%). Axiom from $4.6M to $300K (-94%). The infrastructure that fed the meme frenzy is now a ghost town .
🔹 The tokens are basically dead — Median drawdown from all-time highs for Robinhood Chain memes is 97%. 72% of tokens are down 90% or more. The "tokenized stock + meme" narrative that looked like the future in September is now a cautionary tale .
🔹 But here's the weird part — The chain still has 873,000 active wallets and $1.05B TVL**, with **$480M sitting in Morpho stablecoin lending vaults. The speculators left. The yield farmers stayed. Robinhood Chain didn't die — it just stopped being a casino and became a bank .
The takeaway ? This is what happens when a chain built for tokenized stocks gets hijacked by memecoins. The speculation burns hot, then burns out. The real capital — the stablecoin yield crowd — doesn't care about your 10,000% launch. They care about 7% APY.
Pro tip : When a chain's fee revenue drops 99% in six weeks, the memes are gone. The question is whether the infrastructure survives without them. For Robinhood Chain, the answer is apparently yes — just not the part degens care about.
#memecoin #robinhoodchain #pons
481
Войдите, чтобы посмотреть больше материала
Присоединяйтесь к пользователям криптовалют по всему миру на Binance Square
⚡️ Получайте новейшую и полезную информацию о криптоактивах.
💬 Нам доверяет крупнейшая в мире криптобиржа.
👍 Получите достоверные аналитические данные от верифицированных создателей контента.
Эл. почта/номер телефона
В тренде
1
#IsAnthropic’s$1.5TMarketCapJustified?
Просмотров: 27,142
153 обсуждают
2
#BTCBelow$62KAmidHikeFearsAndShiftToAnthropic
Просмотров: 124
3 обсуждают
3
#NvidiaBoardReportedlySplitOverHuang’sReturn
Просмотров: 151,509
1,264 обсуждают
4
#CanGTA6'sLaunchLiftTTWOShares?
Просмотров: 116,888
914 обсуждают
5
#LedgerProbesTamperedWalletsInBerlinAndDubai
Просмотров: 0
3 обсуждают
6
#13FInstitutionsBitcoinSpotETPHoldingsHitRecord
Просмотров: 3,404
66 обсуждают
7
#BTCRemainsUnderPressureAfterHawkishFOMCMinutes
Просмотров: 306,802
2,277 обсуждают
8
#StrategySTRCPreferredSlips3.65%Below$100Par
Просмотров: 10,759
94 обсуждают
9
#MASToUpgradeSGDTestnetToSGDigitalLedger
Просмотров: 33,831
346 обсуждают
10
#Solana2027RoadmapTargetsDoubleComputeCapacity
Просмотров: 15,449
189 обсуждают