
#altcoinanalysis
altcoinanalysis
Просмотров: 3.3M
10,184 обсуждают
Популярные
Новые

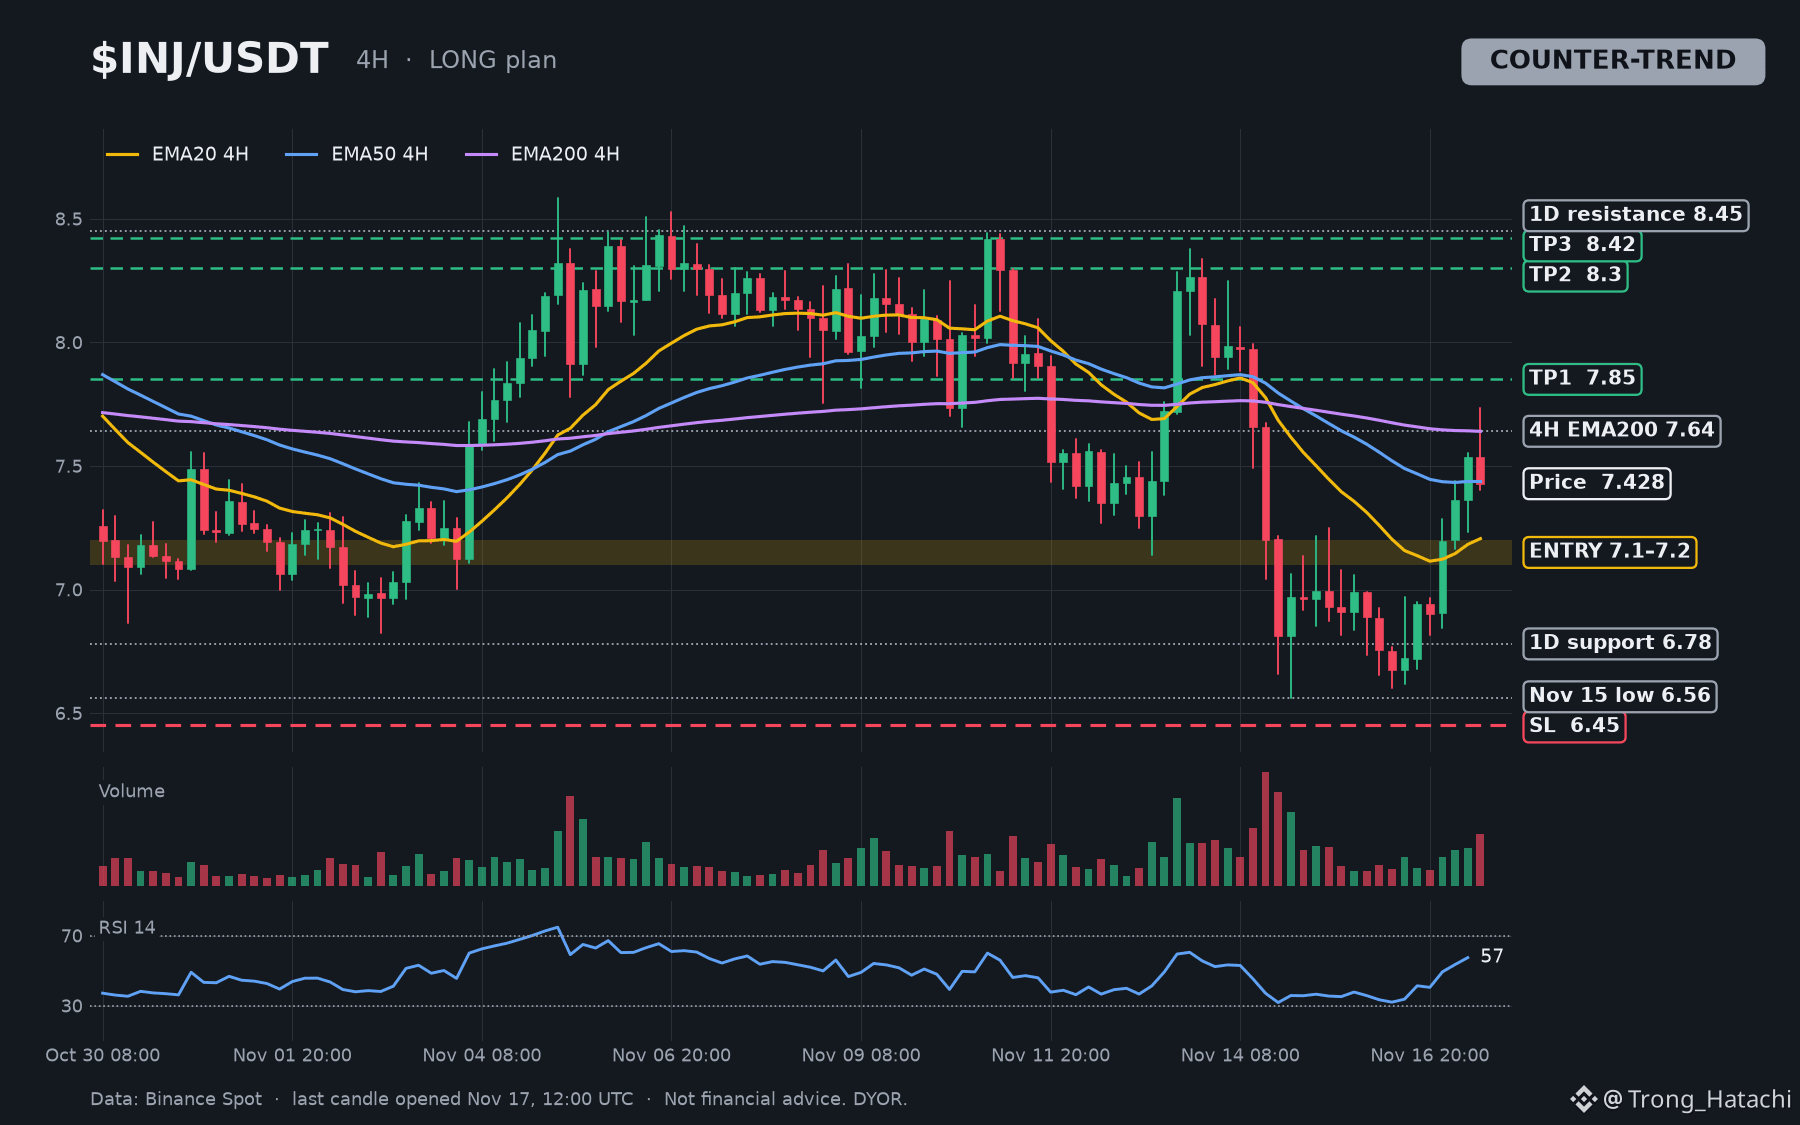
$INJ bounced 17% off its Nov 15-16 double bottom (6.56 / 6.60) to 7.736 today, then got rejected at the 4H EMA200 (7.64).
Trend: Bearish (4H). Counter-trend pullback long.
🎯 Entry long: 7.10 – 7.20 (limit; valid to Nov 18, 18:00 UTC, pre-FOMC)
✅ TP1: 7.85 (1H resistance)
✅ TP2: 8.30 (past 8.20; under 4H res 8.34)
✅ TP3: 8.42 (under 1D resistance 8.45)
🛑 SL: 6.45
📊 Logic:
• Entry: 1H support 7.12 (9 touches), Nov 13 low 7.14, 4H EMA20 7.18.
• Catalyst: Injective Foundation signed a University of Tokyo MoU (GlobeNewswire, Nov 16). No money disclosed.
• Funding ~0.01%, OI +13%/24h: new positions, not stretched.
• Risk: $BTC ~65.2K, 4H downtrend, F&G 12. EMA200 sits under TP1. SL (below the double-bottom wicks) is ~10% away, TP1 only ~1R: size small.
⚠️ Invalidation: losing 6.56 breaks the double bottom; SL 6.45 is the exit. If 7.85 prints before a fill, skip.
$INJ dips to 7.15: BUY or FADE? 👇
#INJ #Injective #AltcoinAnalysis
Disclaimer: Not financial advice. DYOR.
$INJ bounced 17% off its Nov 15-16 double bottom (6.56 / 6.60) to 7.736 today, then got rejected at the 4H EMA200 (7.64).
Trend: Bearish (4H). Counter-trend pullback long.
🎯 Entry long: 7.10 – 7.20 (limit; valid to Nov 18, 18:00 UTC, pre-FOMC)
✅ TP1: 7.85 (1H resistance)
✅ TP2: 8.30 (past 8.20; under 4H res 8.34)
✅ TP3: 8.42 (under 1D resistance 8.45)
🛑 SL: 6.45
📊 Logic:
• Entry: 1H support 7.12 (9 touches), Nov 13 low 7.14, 4H EMA20 7.18.
• Catalyst: Injective Foundation signed a University of Tokyo MoU (GlobeNewswire, Nov 16). No money disclosed.
• Funding ~0.01%, OI +13%/24h: new positions, not stretched.
• Risk: $BTC ~65.2K, 4H downtrend, F&G 12. EMA200 sits under TP1. SL (below the double-bottom wicks) is ~10% away, TP1 only ~1R: size small.
⚠️ Invalidation: losing 6.56 breaks the double bottom; SL 6.45 is the exit. If 7.85 prints before a fill, skip.
$INJ dips to 7.15: BUY or FADE? 👇
#INJ #Injective #AltcoinAnalysis
Disclaimer: Not financial advice. DYOR.
Trend: Bearish (4H). Counter-trend pullback long.
🎯 Entry long: 7.10 – 7.20 (limit; valid to Nov 18, 18:00 UTC, pre-FOMC)
✅ TP1: 7.85 (1H resistance)
✅ TP2: 8.30 (past 8.20; under 4H res 8.34)
✅ TP3: 8.42 (under 1D resistance 8.45)
🛑 SL: 6.45
📊 Logic:
• Entry: 1H support 7.12 (9 touches), Nov 13 low 7.14, 4H EMA20 7.18.
• Catalyst: Injective Foundation signed a University of Tokyo MoU (GlobeNewswire, Nov 16). No money disclosed.
• Funding ~0.01%, OI +13%/24h: new positions, not stretched.
• Risk: $BTC ~65.2K, 4H downtrend, F&G 12. EMA200 sits under TP1. SL (below the double-bottom wicks) is ~10% away, TP1 only ~1R: size small.
⚠️ Invalidation: losing 6.56 breaks the double bottom; SL 6.45 is the exit. If 7.85 prints before a fill, skip.
$INJ dips to 7.15: BUY or FADE? 👇
#INJ #Injective #AltcoinAnalysis
Disclaimer: Not financial advice. DYOR.
1
175

·
--
🚀 ALTCOIN MARKET WATCH: BLESS, HUMA & EVAA
The altcoin market is showing strong price movements, and three tokens are worth keeping on the radar. Let's take a closer look at their current performance and market structure.
1. BLESS/USDT – Strong Bullish Momentum
- Current Price: $0.018614
- 24H Change: +105.95%
- 7D Performance: +128.22%
- 180D Performance: +262.78%
- 24H High: $0.019690
Market View: BLESS is showing impressive buying pressure after a strong recovery. However, traders should watch for possible profit-taking near recent highs. A healthy consolidation could support further upside.
2. HUMA/USDT – Potential Recovery Setup
- Current Price: $0.009506
- 24H Change: +50.98%
- 30D Performance: -66.44%
- 24H High: $0.010394
- 24H Low: $0.006228
Market View: HUMA is attempting a recovery after an extended correction. Sustained volume and a successful breakout above nearby resistance will be important to confirm further strength.
3. EVAA/USDT – Powerful Market Performance
- Current Price: $3.4284
- 24H Change: +20.22%
- 7D Performance: +185.11%
- 180D Performance: +649.14%
- 24H High: $3.8220
Market View: EVAA is demonstrating significant bullish momentum. After its remarkable rally, traders should monitor whether the price can maintain support or enters a healthy correction.
📊 KEY MARKET TAKEAWAY
All three tokens are showing considerable volatility, but their market structures are different:
- $BLESS : Strong momentum.
- $HUMA : Recovery attempt.
- $EVAA : Powerful rally with correction risk.
Trading Strategy: Avoid chasing sudden green candles. Monitor trading volume, support and resistance levels, and wait for confirmation before entering any position.
Risk management comes first. Always do your own research (DYOR).
Which token has the strongest potential for the next move — BLESS, HUMA, or EVAA? Share your analysis below.
#BLESS #HUMA #EVAA #CryptoMarket #AltcoinAnalysis
🚀 ALTCOIN MARKET WATCH: BLESS, HUMA & EVAA
The altcoin market is showing strong price movements, and three tokens are worth keeping on the radar. Let's take a closer look at their current performance and market structure.
1. BLESS/USDT – Strong Bullish Momentum
- Current Price: $0.018614
- 24H Change: +105.95%
- 7D Performance: +128.22%
- 180D Performance: +262.78%
- 24H High: $0.019690
Market View: BLESS is showing impressive buying pressure after a strong recovery. However, traders should watch for possible profit-taking near recent highs. A healthy consolidation could support further upside.
2. HUMA/USDT – Potential Recovery Setup
- Current Price: $0.009506
- 24H Change: +50.98%
- 30D Performance: -66.44%
- 24H High: $0.010394
- 24H Low: $0.006228
Market View: HUMA is attempting a recovery after an extended correction. Sustained volume and a successful breakout above nearby resistance will be important to confirm further strength.
3. EVAA/USDT – Powerful Market Performance
- Current Price: $3.4284
- 24H Change: +20.22%
- 7D Performance: +185.11%
- 180D Performance: +649.14%
- 24H High: $3.8220
Market View: EVAA is demonstrating significant bullish momentum. After its remarkable rally, traders should monitor whether the price can maintain support or enters a healthy correction.
📊 KEY MARKET TAKEAWAY
All three tokens are showing considerable volatility, but their market structures are different:
- $BLESS : Strong momentum.
- $HUMA : Recovery attempt.
- $EVAA : Powerful rally with correction risk.
Trading Strategy: Avoid chasing sudden green candles. Monitor trading volume, support and resistance levels, and wait for confirmation before entering any position.
Risk management comes first. Always do your own research (DYOR).
Which token has the strongest potential for the next move — BLESS, HUMA, or EVAA? Share your analysis below.
#BLESS #HUMA #EVAA #CryptoMarket #AltcoinAnalysis
The altcoin market is showing strong price movements, and three tokens are worth keeping on the radar. Let's take a closer look at their current performance and market structure.
1. BLESS/USDT – Strong Bullish Momentum
- Current Price: $0.018614
- 24H Change: +105.95%
- 7D Performance: +128.22%
- 180D Performance: +262.78%
- 24H High: $0.019690
Market View: BLESS is showing impressive buying pressure after a strong recovery. However, traders should watch for possible profit-taking near recent highs. A healthy consolidation could support further upside.
2. HUMA/USDT – Potential Recovery Setup
- Current Price: $0.009506
- 24H Change: +50.98%
- 30D Performance: -66.44%
- 24H High: $0.010394
- 24H Low: $0.006228
Market View: HUMA is attempting a recovery after an extended correction. Sustained volume and a successful breakout above nearby resistance will be important to confirm further strength.
3. EVAA/USDT – Powerful Market Performance
- Current Price: $3.4284
- 24H Change: +20.22%
- 7D Performance: +185.11%
- 180D Performance: +649.14%
- 24H High: $3.8220
Market View: EVAA is demonstrating significant bullish momentum. After its remarkable rally, traders should monitor whether the price can maintain support or enters a healthy correction.
📊 KEY MARKET TAKEAWAY
All three tokens are showing considerable volatility, but their market structures are different:
- $BLESS : Strong momentum.
- $HUMA : Recovery attempt.
- $EVAA : Powerful rally with correction risk.
Trading Strategy: Avoid chasing sudden green candles. Monitor trading volume, support and resistance levels, and wait for confirmation before entering any position.
Risk management comes first. Always do your own research (DYOR).
Which token has the strongest potential for the next move — BLESS, HUMA, or EVAA? Share your analysis below.
#BLESS #HUMA #EVAA #CryptoMarket #AltcoinAnalysis

3
75
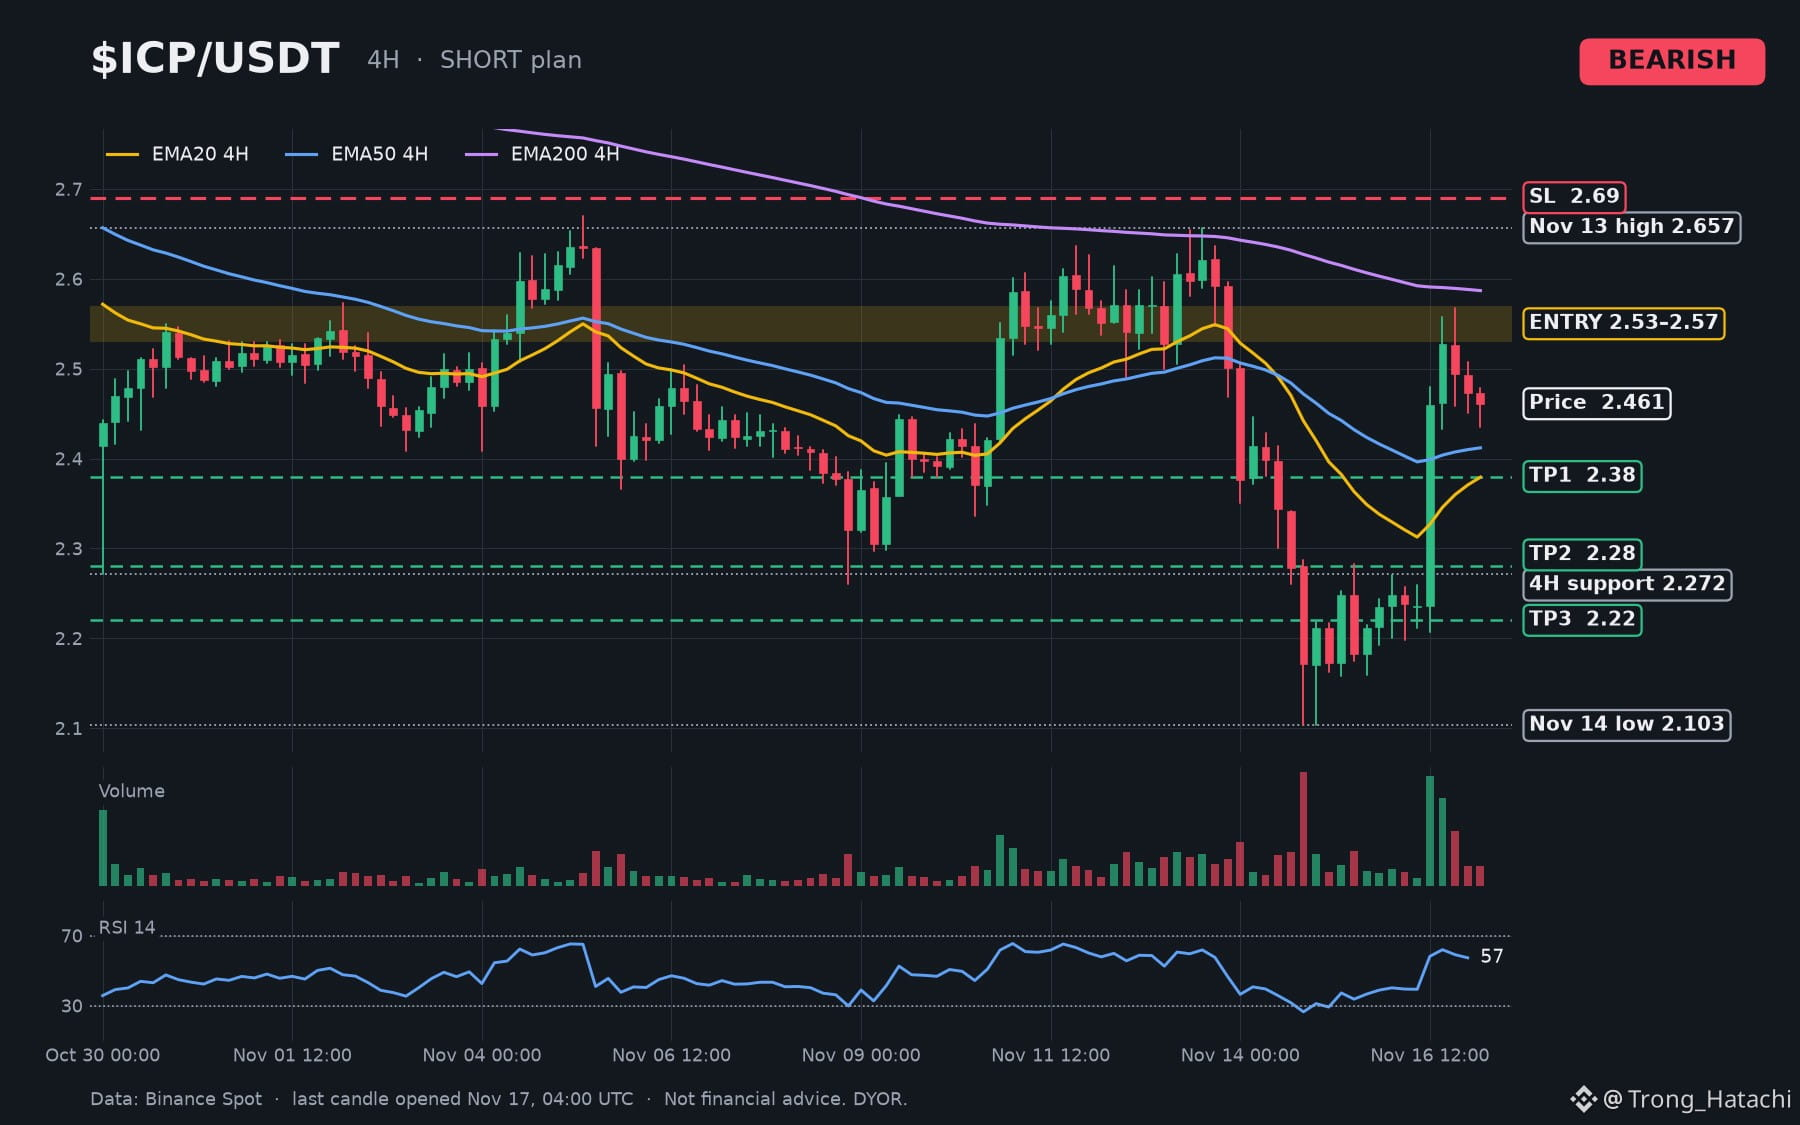
One 4H candle added +10% to $ICP yesterday, on its biggest Binance volume day since Oct 12 (12.3M USDT). It stalled at 2.567, just above the 2.47-2.52 shelf lost Nov 14.
Price 2.46 | Bias: Bearish 1D, 4H mixed
🎯 Entry short: 2.53 – 2.57 (only on a 4H rejection close; valid to Nov 18, 18:00 UTC, pre-FOMC minutes)
✅ TP1: 2.38 (4H EMA20/50 zone)
✅ TP2: 2.28 (above 4H support 2.27)
✅ TP3: 2.22 (above 1D support 2.21)
🛑 SL: 2.69
📊 Logic:
• Nov 11-13 daily lows held 2.47-2.52. Nov 14 broke to 2.103.
• 2.54 is 4H resistance (27 touches). 4H EMA200 ~2.59 sits above.
• 1D trend down, price under 1D EMA50/200.
• Funding ~0.01%, OI +14%/24h. Pump cause unconfirmed.
• Macro: $BTC ~64.6K, 4H downtrend, F&G 12.
• Risk: price above 4H EMA20/50. Entry 3-5% above price may not fill. 4H ATR 3.8%: size small.
⚠️ Invalidation: a 4H close above 2.69. If 2.28 breaks before a fill, skip.
$ICP back at 2.55: SELL or BREAK? 👇
#ICP #InternetComputer #AltcoinAnalysis
Disclaimer: Not financial advice. DYOR.
One 4H candle added +10% to $ICP yesterday, on its biggest Binance volume day since Oct 12 (12.3M USDT). It stalled at 2.567, just above the 2.47-2.52 shelf lost Nov 14.
Price 2.46 | Bias: Bearish 1D, 4H mixed
🎯 Entry short: 2.53 – 2.57 (only on a 4H rejection close; valid to Nov 18, 18:00 UTC, pre-FOMC minutes)
✅ TP1: 2.38 (4H EMA20/50 zone)
✅ TP2: 2.28 (above 4H support 2.27)
✅ TP3: 2.22 (above 1D support 2.21)
🛑 SL: 2.69
📊 Logic:
• Nov 11-13 daily lows held 2.47-2.52. Nov 14 broke to 2.103.
• 2.54 is 4H resistance (27 touches). 4H EMA200 ~2.59 sits above.
• 1D trend down, price under 1D EMA50/200.
• Funding ~0.01%, OI +14%/24h. Pump cause unconfirmed.
• Macro: $BTC ~64.6K, 4H downtrend, F&G 12.
• Risk: price above 4H EMA20/50. Entry 3-5% above price may not fill. 4H ATR 3.8%: size small.
⚠️ Invalidation: a 4H close above 2.69. If 2.28 breaks before a fill, skip.
$ICP back at 2.55: SELL or BREAK? 👇
#ICP #InternetComputer #AltcoinAnalysis
Disclaimer: Not financial advice. DYOR.
Price 2.46 | Bias: Bearish 1D, 4H mixed
🎯 Entry short: 2.53 – 2.57 (only on a 4H rejection close; valid to Nov 18, 18:00 UTC, pre-FOMC minutes)
✅ TP1: 2.38 (4H EMA20/50 zone)
✅ TP2: 2.28 (above 4H support 2.27)
✅ TP3: 2.22 (above 1D support 2.21)
🛑 SL: 2.69
📊 Logic:
• Nov 11-13 daily lows held 2.47-2.52. Nov 14 broke to 2.103.
• 2.54 is 4H resistance (27 touches). 4H EMA200 ~2.59 sits above.
• 1D trend down, price under 1D EMA50/200.
• Funding ~0.01%, OI +14%/24h. Pump cause unconfirmed.
• Macro: $BTC ~64.6K, 4H downtrend, F&G 12.
• Risk: price above 4H EMA20/50. Entry 3-5% above price may not fill. 4H ATR 3.8%: size small.
⚠️ Invalidation: a 4H close above 2.69. If 2.28 breaks before a fill, skip.
$ICP back at 2.55: SELL or BREAK? 👇
#ICP #InternetComputer #AltcoinAnalysis
Disclaimer: Not financial advice. DYOR.
1
120

$SOL
{spot}(SOLUSDT)
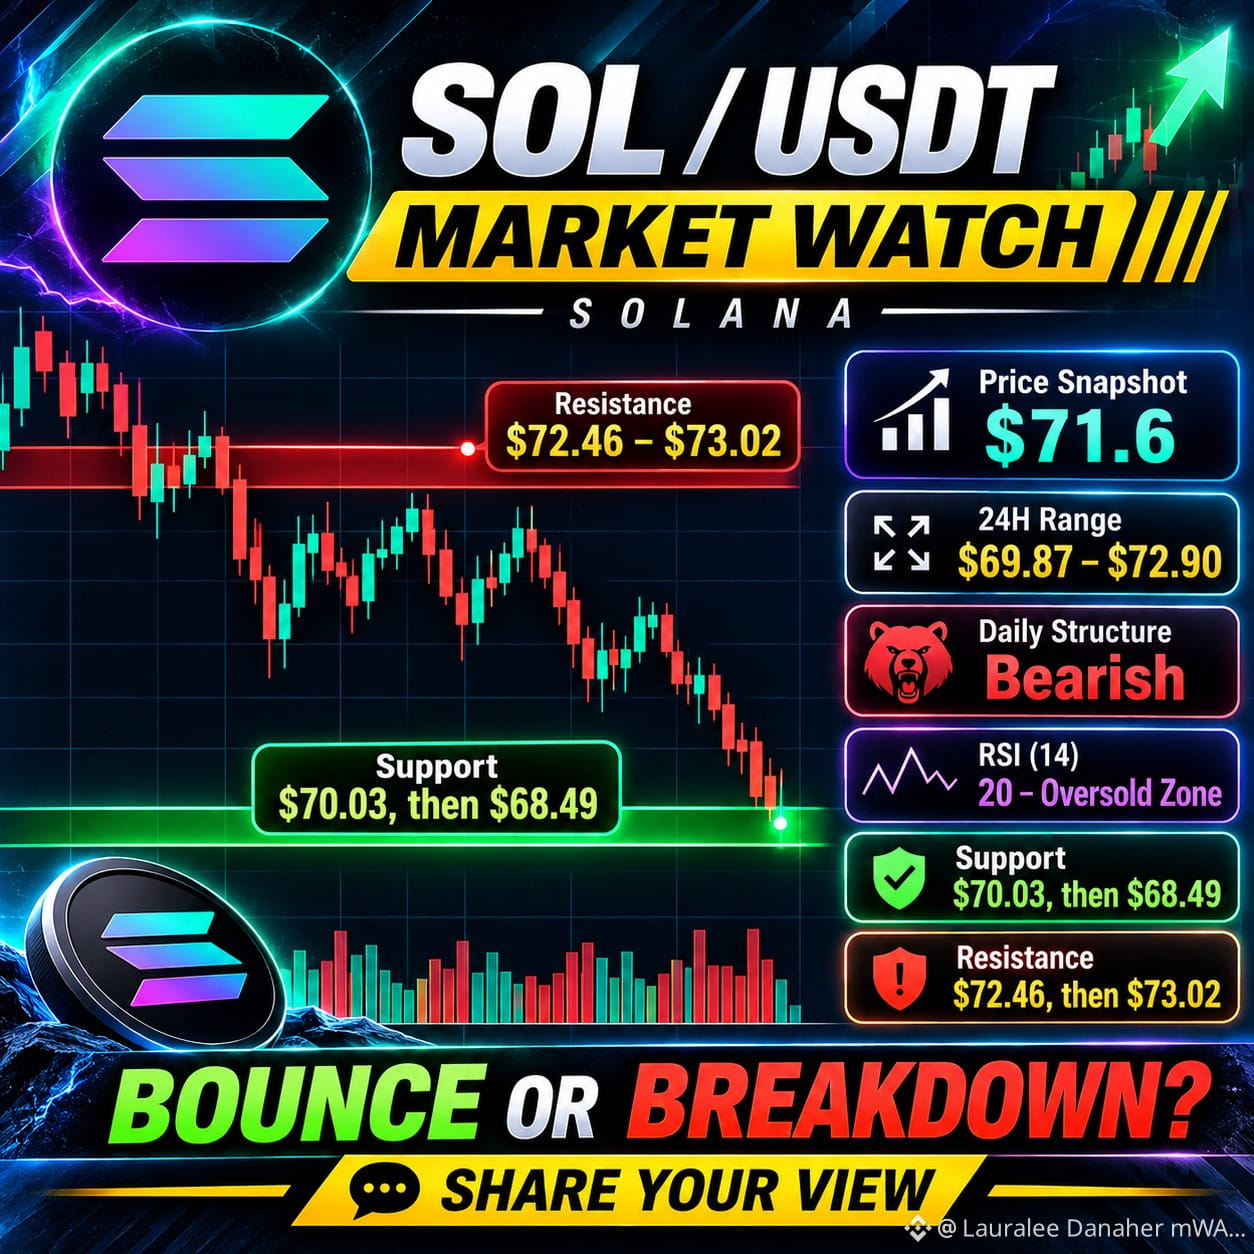
🚀 SOLANA ($SOL) – BOUNCE OR BREAKDOWN?
Solana is approaching an interesting technical zone! 👀
After recent selling pressure, SOL is showing oversold conditions on the daily RSI.
📊 TECHNICAL ANALYSIS
💰 Current Price: ~$71.60
🟢 SUPPORT LEVELS:
- $70.03
- $68.49
🔴 RESISTANCE LEVELS:
- $72.46
- $73.02
- $76.21
📉 BEARISH SCENARIO 🐻
If SOL loses $70 with a confirmed breakdown, further downside could follow.
📈 BULLISH SCENARIO 🐂
If buyers defend support and reclaim $72.46–$73.02, we could see a recovery attempt.
🔥 MY OBSERVATION
RSI is in oversold territory. However, oversold doesn't automatically mean a reversal.
Confirmation is everything!
💬 YOUR TURN!
Where will SOL go next?
1️⃣ $68 – More downside 🐻
2️⃣ $75 – Recovery begins 🚀
3️⃣ $80 – Strong bullish reversal 🔥
Are you LONG or SHORT on SOL?
👇 Comment your entry price and target!
#solana #BinanceSquareTalks #AltcoinAnalysis #CryptoCommunity
⚠️ Not financial advice. Always DYOR and manage risk.
$SOL
🚀 SOLANA ($SOL ) – BOUNCE OR BREAKDOWN?
Solana is approaching an interesting technical zone! 👀
After recent selling pressure, SOL is showing oversold conditions on the daily RSI.
📊 TECHNICAL ANALYSIS
💰 Current Price: ~$71.60
🟢 SUPPORT LEVELS:
- $70.03
- $68.49
🔴 RESISTANCE LEVELS:
- $72.46
- $73.02
- $76.21
📉 BEARISH SCENARIO 🐻
If SOL loses $70 with a confirmed breakdown, further downside could follow.
📈 BULLISH SCENARIO 🐂
If buyers defend support and reclaim $72.46–$73.02, we could see a recovery attempt.
🔥 MY OBSERVATION
RSI is in oversold territory. However, oversold doesn't automatically mean a reversal.
Confirmation is everything!
💬 YOUR TURN!
Where will SOL go next?
1️⃣ $68 – More downside 🐻
2️⃣ $75 – Recovery begins 🚀
3️⃣ $80 – Strong bullish reversal 🔥
Are you LONG or SHORT on SOL?
👇 Comment your entry price and target!
#solana #BinanceSquareTalks #AltcoinAnalysis #CryptoCommunity
⚠️ Not financial advice. Always DYOR and manage risk.
🚀 SOLANA ($SOL ) – BOUNCE OR BREAKDOWN?
Solana is approaching an interesting technical zone! 👀
After recent selling pressure, SOL is showing oversold conditions on the daily RSI.
📊 TECHNICAL ANALYSIS
💰 Current Price: ~$71.60
🟢 SUPPORT LEVELS:
- $70.03
- $68.49
🔴 RESISTANCE LEVELS:
- $72.46
- $73.02
- $76.21
📉 BEARISH SCENARIO 🐻
If SOL loses $70 with a confirmed breakdown, further downside could follow.
📈 BULLISH SCENARIO 🐂
If buyers defend support and reclaim $72.46–$73.02, we could see a recovery attempt.
🔥 MY OBSERVATION
RSI is in oversold territory. However, oversold doesn't automatically mean a reversal.
Confirmation is everything!
💬 YOUR TURN!
Where will SOL go next?
1️⃣ $68 – More downside 🐻
2️⃣ $75 – Recovery begins 🚀
3️⃣ $80 – Strong bullish reversal 🔥
Are you LONG or SHORT on SOL?
👇 Comment your entry price and target!
#solana #BinanceSquareTalks #AltcoinAnalysis #CryptoCommunity
⚠️ Not financial advice. Always DYOR and manage risk.
18
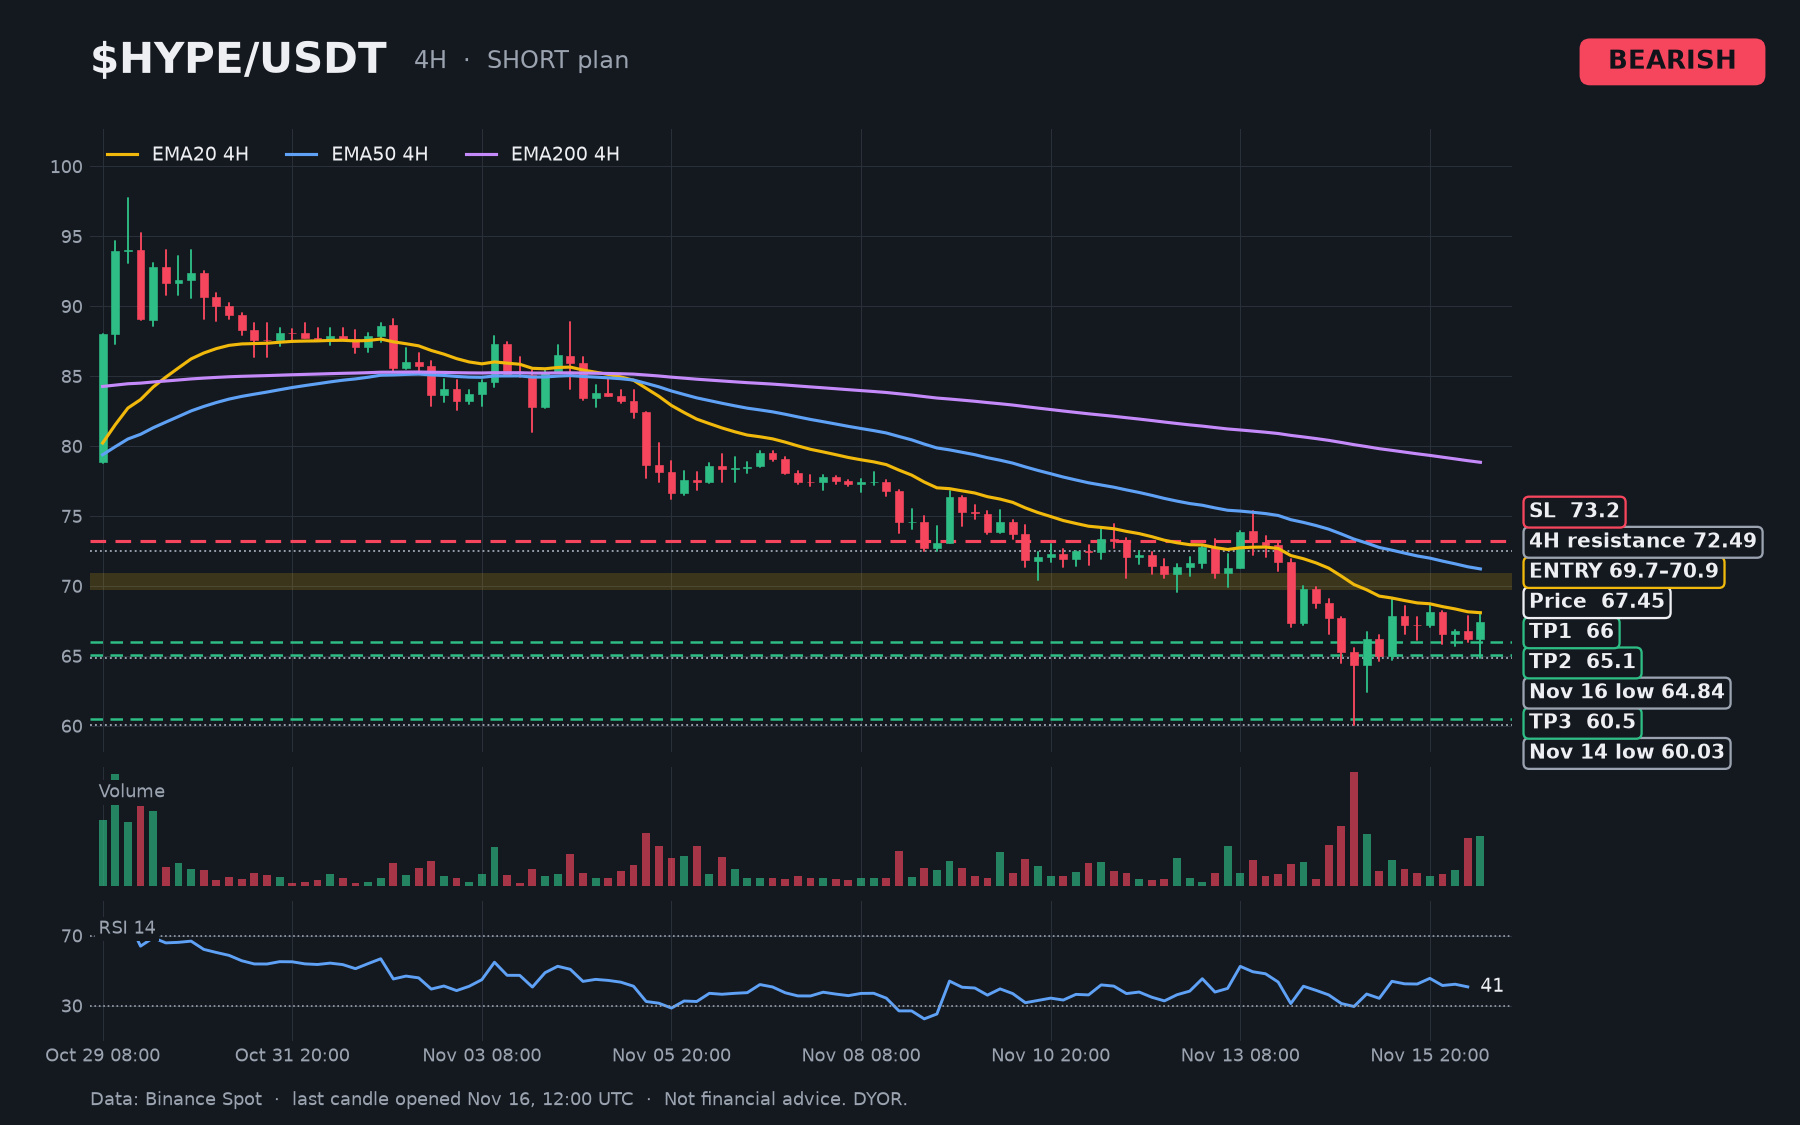
Oct 29: $HYPE wicked to 97.74 on 162M USDT, its top volume day since its Sep 24 Binance spot listing.
Nov 14: it hit 60.03 on the second biggest. -38.6% in 16 days.
Price 67.4 | Trend: Bearish (4H below EMA20/50/200)
🎯 Entry short: 69.7 – 70.9 (on a 4H rejection; valid to Nov 18, 18:00 UTC, pre-FOMC minutes)
✅ TP1: 66.0
✅ TP2: 65.1 (above today's low, 64.84)
✅ TP3: 60.5 (above Nov 14 low)
🛑 SL: 73.2
📊 Logic:
• Nov 10-13 lows held 69.55-70.60. Nov 14 broke it; no 4H high has reached 70 since.
• SL clears 4H EMA50 (~71.4) and 72.49 resistance.
• Funding ~0%, OI -3.7%/24h.
• Macro: $BTC ~65K in a 4H downtrend, Fear & Greed 10. FedWatch ~86% odds of a Dec 9 hike (Nov 10, via Barron's).
• Risk: 1H bounce 64.84 to 68.1 today. Entry ~4% above price may not fill. Smaller size fits.
⚠️ Invalidation: price above 73.2. If 64.84 breaks before a fill, the setup is void.
Old floor at 70 for $HYPE: CAP or RECLAIM? 👇
#HYPE #Hyperliquid #AltcoinAnalysis
Disclaimer: Not financial advice. DYOR.
Oct 29: $HYPE wicked to 97.74 on 162M USDT, its top volume day since its Sep 24 Binance spot listing.
Nov 14: it hit 60.03 on the second biggest. -38.6% in 16 days.
Price 67.4 | Trend: Bearish (4H below EMA20/50/200)
🎯 Entry short: 69.7 – 70.9 (on a 4H rejection; valid to Nov 18, 18:00 UTC, pre-FOMC minutes)
✅ TP1: 66.0
✅ TP2: 65.1 (above today's low, 64.84)
✅ TP3: 60.5 (above Nov 14 low)
🛑 SL: 73.2
📊 Logic:
• Nov 10-13 lows held 69.55-70.60. Nov 14 broke it; no 4H high has reached 70 since.
• SL clears 4H EMA50 (~71.4) and 72.49 resistance.
• Funding ~0%, OI -3.7%/24h.
• Macro: $BTC ~65K in a 4H downtrend, Fear & Greed 10. FedWatch ~86% odds of a Dec 9 hike (Nov 10, via Barron's).
• Risk: 1H bounce 64.84 to 68.1 today. Entry ~4% above price may not fill. Smaller size fits.
⚠️ Invalidation: price above 73.2. If 64.84 breaks before a fill, the setup is void.
Old floor at 70 for $HYPE : CAP or RECLAIM? 👇
#HYPE #Hyperliquid #AltcoinAnalysis
Disclaimer: Not financial advice. DYOR.
Nov 14: it hit 60.03 on the second biggest. -38.6% in 16 days.
Price 67.4 | Trend: Bearish (4H below EMA20/50/200)
🎯 Entry short: 69.7 – 70.9 (on a 4H rejection; valid to Nov 18, 18:00 UTC, pre-FOMC minutes)
✅ TP1: 66.0
✅ TP2: 65.1 (above today's low, 64.84)
✅ TP3: 60.5 (above Nov 14 low)
🛑 SL: 73.2
📊 Logic:
• Nov 10-13 lows held 69.55-70.60. Nov 14 broke it; no 4H high has reached 70 since.
• SL clears 4H EMA50 (~71.4) and 72.49 resistance.
• Funding ~0%, OI -3.7%/24h.
• Macro: $BTC ~65K in a 4H downtrend, Fear & Greed 10. FedWatch ~86% odds of a Dec 9 hike (Nov 10, via Barron's).
• Risk: 1H bounce 64.84 to 68.1 today. Entry ~4% above price may not fill. Smaller size fits.
⚠️ Invalidation: price above 73.2. If 64.84 breaks before a fill, the setup is void.
Old floor at 70 for $HYPE : CAP or RECLAIM? 👇
#HYPE #Hyperliquid #AltcoinAnalysis
Disclaimer: Not financial advice. DYOR.
-MISS_-HANIA-_SHEIKH-:
nice
2
7
388
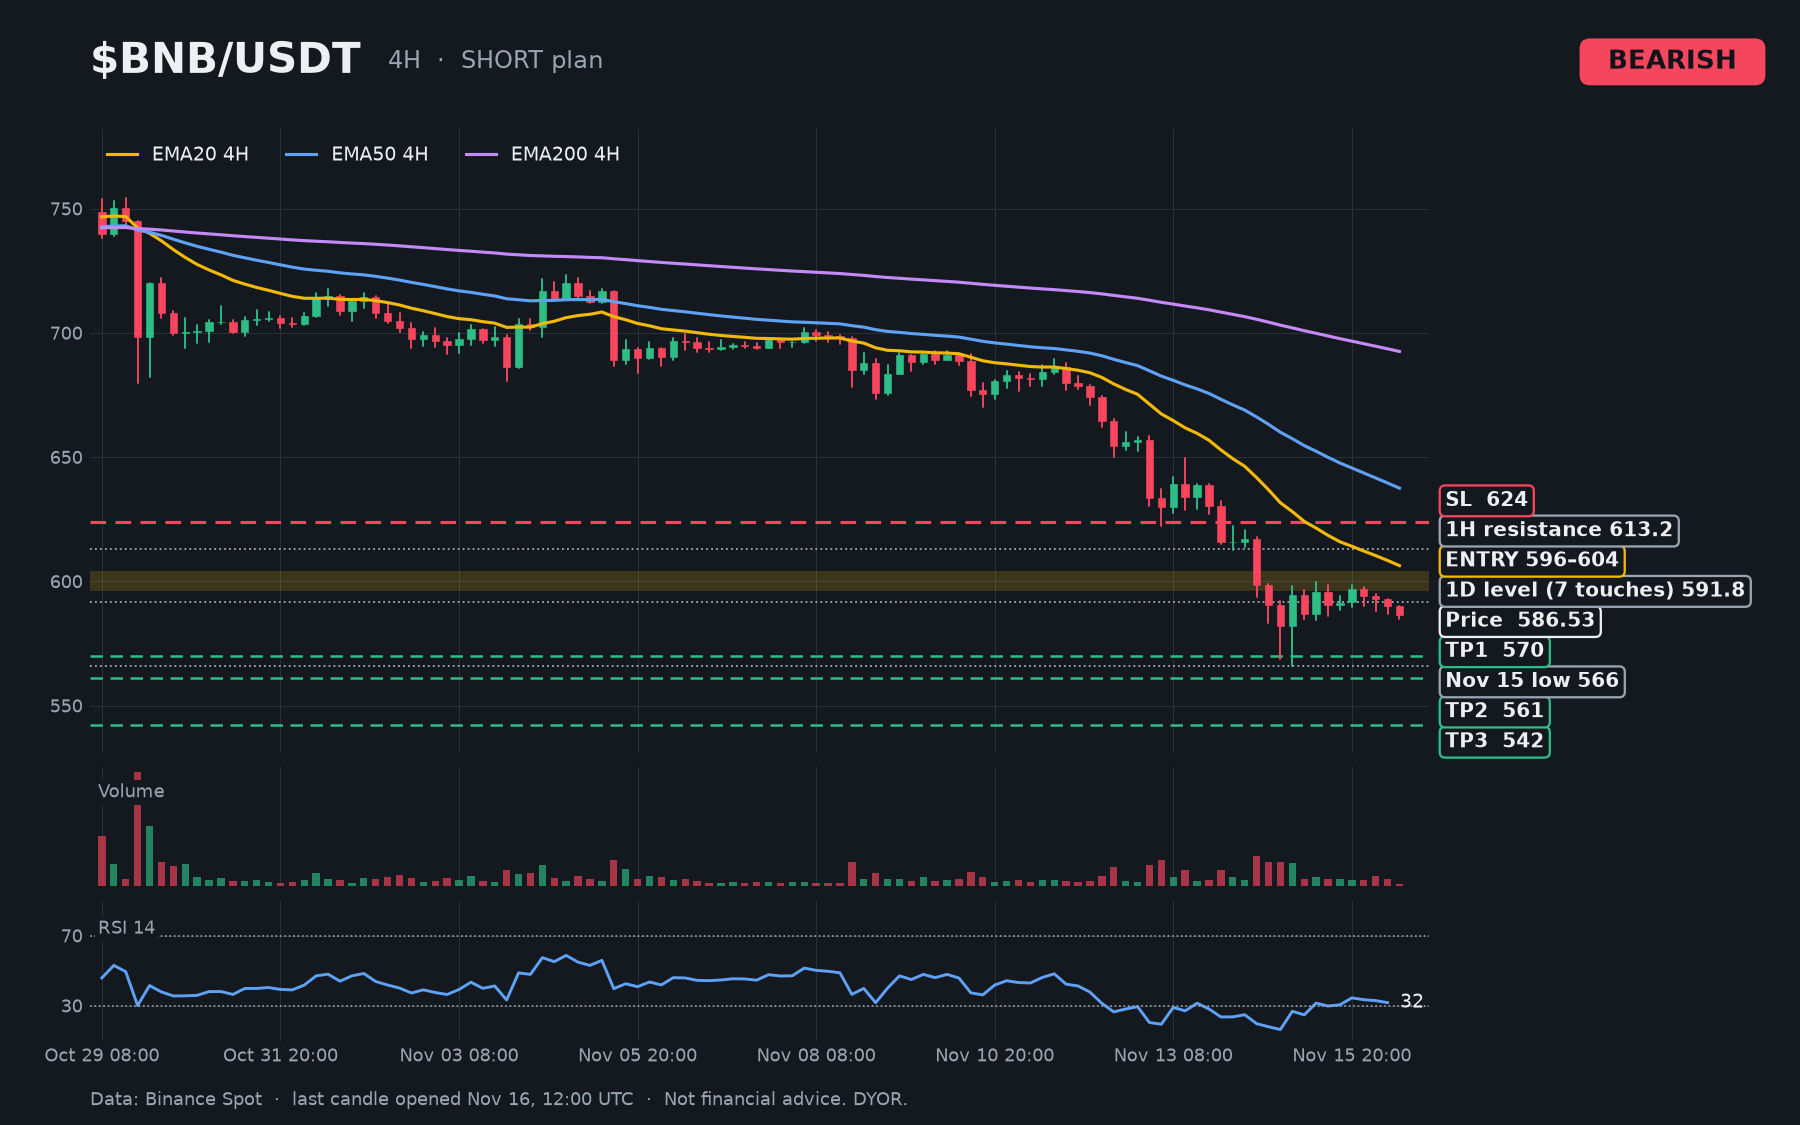
Since Nov 15, six $BNB 4H candles hit 596-600. None closed above 597.
The Nov 14 close, 581.90, was the lowest daily close since Aug 1.
Price 586 | Trend: Bearish (4H below all EMAs)
🎯 Entry short: 596 – 604 (only on a 4H rejection; valid to Nov 18, 18:00 UTC, pre-FOMC minutes)
✅ TP1: 570 (above Nov 15 low, 566)
✅ TP2: 561 (above 1D support 559, 5 touches)
✅ TP3: 542 (above Jul 1 low, 537)
🛑 SL: 624
📊 Logic:
• Price is back under 591.8 (1D, 7 touches). SL clears 4H EMA20 (~608), 613 and the 620-622 cluster.
• -23% from the Oct 29 open (759.85).
• Funding ~0%, OI -1.7%/24h: no crowded side.
• Macro: CME FedWatch ~86-90% odds of a Dec 9 hike (Nov 10). $BTC ~64K, 4H downtrend. Fear & Greed 10.
• Risk: 1D RSI 26 oversold, 4H MACD turning up. Entry ~2% above price may not fill. Size small.
⚠️ Invalidation: price above 624. If 566 breaks before a fill, skip.
Seventh test of 600 for $BNB: FADE or BREAK? 👇
#BNB #AltcoinAnalysis #CryptoMarket
Disclaimer: Not financial advice. DYOR.
Since Nov 15, six $BNB 4H candles hit 596-600. None closed above 597.
The Nov 14 close, 581.90, was the lowest daily close since Aug 1.
Price 586 | Trend: Bearish (4H below all EMAs)
🎯 Entry short: 596 – 604 (only on a 4H rejection; valid to Nov 18, 18:00 UTC, pre-FOMC minutes)
✅ TP1: 570 (above Nov 15 low, 566)
✅ TP2: 561 (above 1D support 559, 5 touches)
✅ TP3: 542 (above Jul 1 low, 537)
🛑 SL: 624
📊 Logic:
• Price is back under 591.8 (1D, 7 touches). SL clears 4H EMA20 (~608), 613 and the 620-622 cluster.
• -23% from the Oct 29 open (759.85).
• Funding ~0%, OI -1.7%/24h: no crowded side.
• Macro: CME FedWatch ~86-90% odds of a Dec 9 hike (Nov 10). $BTC ~64K, 4H downtrend. Fear & Greed 10.
• Risk: 1D RSI 26 oversold, 4H MACD turning up. Entry ~2% above price may not fill. Size small.
⚠️ Invalidation: price above 624. If 566 breaks before a fill, skip.
Seventh test of 600 for $BNB : FADE or BREAK? 👇
#BNB #AltcoinAnalysis #CryptoMarket
Disclaimer: Not financial advice. DYOR.
The Nov 14 close, 581.90, was the lowest daily close since Aug 1.
Price 586 | Trend: Bearish (4H below all EMAs)
🎯 Entry short: 596 – 604 (only on a 4H rejection; valid to Nov 18, 18:00 UTC, pre-FOMC minutes)
✅ TP1: 570 (above Nov 15 low, 566)
✅ TP2: 561 (above 1D support 559, 5 touches)
✅ TP3: 542 (above Jul 1 low, 537)
🛑 SL: 624
📊 Logic:
• Price is back under 591.8 (1D, 7 touches). SL clears 4H EMA20 (~608), 613 and the 620-622 cluster.
• -23% from the Oct 29 open (759.85).
• Funding ~0%, OI -1.7%/24h: no crowded side.
• Macro: CME FedWatch ~86-90% odds of a Dec 9 hike (Nov 10). $BTC ~64K, 4H downtrend. Fear & Greed 10.
• Risk: 1D RSI 26 oversold, 4H MACD turning up. Entry ~2% above price may not fill. Size small.
⚠️ Invalidation: price above 624. If 566 breaks before a fill, skip.
Seventh test of 600 for $BNB : FADE or BREAK? 👇
#BNB #AltcoinAnalysis #CryptoMarket
Disclaimer: Not financial advice. DYOR.
Koni00:
Thanks for sharing this valuable data
1
5
649

$EVAA is trading around $0.995, showing slight bearish pressure and low volatility. Immediate support lies near $0.994–$0.990, while resistance is around $0.998–$1.000. A breakout above $1.000 could signal bullish momentum, while a drop below $0.990 may increase downside risk. Watch volume and price action before entering a trade.
#EVAUSDT #CryptoTrading #AltcoinAnalysis #CryptoSignals #levelsabovemagical
$EVAA
{future}(EVAAUSDT)
$INIT
{future}(INITUSDT)
$EVAA is trading around $0.995, showing slight bearish pressure and low volatility. Immediate support lies near $0.994–$0.990, while resistance is around $0.998–$1.000. A breakout above $1.000 could signal bullish momentum, while a drop below $0.990 may increase downside risk. Watch volume and price action before entering a trade.
#EVAUSDT #CryptoTrading #AltcoinAnalysis #CryptoSignals #levelsabovemagical
$EVAA
$INIT
#EVAUSDT #CryptoTrading #AltcoinAnalysis #CryptoSignals #levelsabovemagical
$EVAA
$INIT
1
294

·
--
$SOL
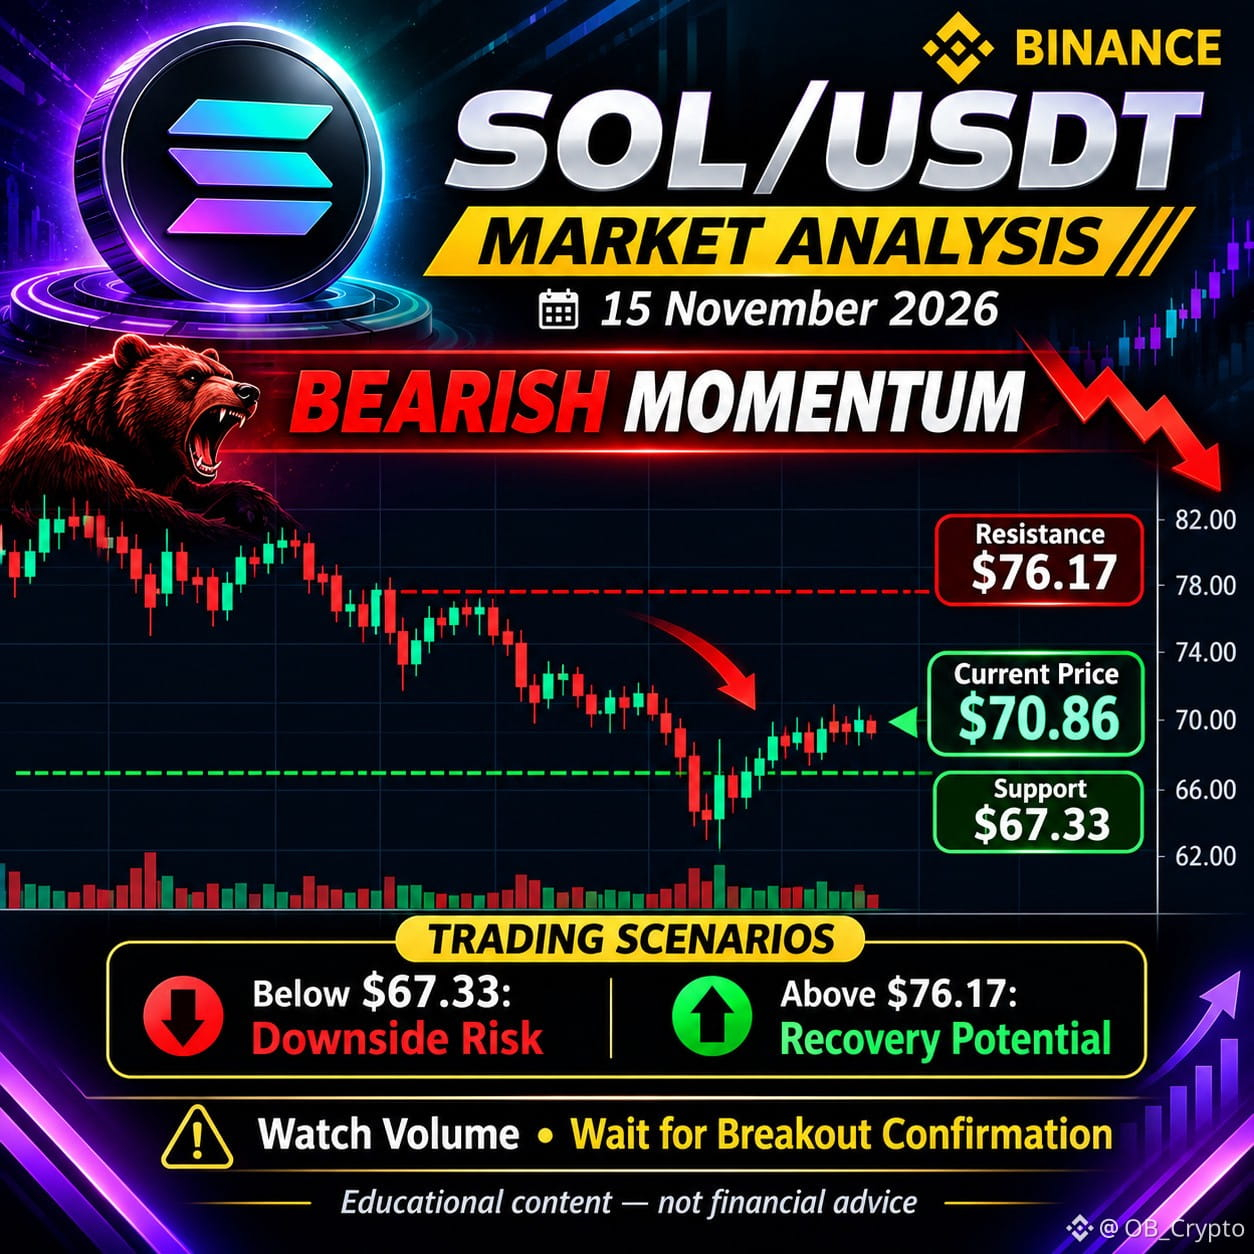
📉 SOLANA (SOL/USDT) – LIVE MARKET SETUP
Market Analysis:
SOL is trading around $70.70–$71.82, with strong selling pressure. Daily RSI is around 15.9, indicating deeply oversold conditions. A short-term bounce is possible, but the overall trend remains bearish.
Trading outlook:
🔴 Below $68.19: Further downside risk.
🟢 Above $71.33: Potential recovery.
⚠️ RSI oversold: Watch for a possible bounce.
{spot}(SOLUSDT)
#SOL空投 #Solana #solanAnalysis #AltcoinAnalysis #solanAnalysis
$SOL
📉 SOLANA (SOL/USDT) – LIVE MARKET SETUP
Market Analysis:
SOL is trading around $70.70–$71.82, with strong selling pressure. Daily RSI is around 15.9, indicating deeply oversold conditions. A short-term bounce is possible, but the overall trend remains bearish.
Trading outlook:
🔴 Below $68.19: Further downside risk.
🟢 Above $71.33: Potential recovery.
⚠️ RSI oversold: Watch for a possible bounce.
#SOL空投 #Solana #solanAnalysis #AltcoinAnalysis #solanAnalysis
📉 SOLANA (SOL/USDT) – LIVE MARKET SETUP
Market Analysis:
SOL is trading around $70.70–$71.82, with strong selling pressure. Daily RSI is around 15.9, indicating deeply oversold conditions. A short-term bounce is possible, but the overall trend remains bearish.
Trading outlook:
🔴 Below $68.19: Further downside risk.
🟢 Above $71.33: Potential recovery.
⚠️ RSI oversold: Watch for a possible bounce.
#SOL空投 #Solana #solanAnalysis #AltcoinAnalysis #solanAnalysis
134

·
--
Glide Path: $GLMR Holds Steady in European Session 🌊
Price action – $GLMR is trading at $0.007872, up 37.55 % over the past 24 hours on $2.8 M volume. The token broke out of the $0.0070‑$0.0075 band early in the session, then settled near the mid‑range, indicating a short‑term rally that may be profit‑taking driven.
Key levels – Immediate support sits around $0.0070, with a secondary floor near $0.0065. Resistance is clustered at $0.0085, while the midpoint of the current range is roughly $0.0078. A decisive move above $0.0085 or below $0.0070 would define the next bias.
Outlook – With neutral market sentiment and no catalyst on the horizon, the coin is likely to consolidate within the identified band. Traders should watch for a clear breakout or breakdown before committing to directional exposure.
#GLMR #AltcoinAnalysis #BinanceSpot
Glide Path: $GLMR Holds Steady in European Session 🌊
Price action – $GLMR is trading at $0.007872, up 37.55 % over the past 24 hours on $2.8 M volume. The token broke out of the $0.0070‑$0.0075 band early in the session, then settled near the mid‑range, indicating a short‑term rally that may be profit‑taking driven.
Key levels – Immediate support sits around $0.0070, with a secondary floor near $0.0065. Resistance is clustered at $0.0085, while the midpoint of the current range is roughly $0.0078. A decisive move above $0.0085 or below $0.0070 would define the next bias.
Outlook – With neutral market sentiment and no catalyst on the horizon, the coin is likely to consolidate within the identified band. Traders should watch for a clear breakout or breakdown before committing to directional exposure.
#GLMR #AltcoinAnalysis #BinanceSpot
Price action – $GLMR is trading at $0.007872, up 37.55 % over the past 24 hours on $2.8 M volume. The token broke out of the $0.0070‑$0.0075 band early in the session, then settled near the mid‑range, indicating a short‑term rally that may be profit‑taking driven.
Key levels – Immediate support sits around $0.0070, with a secondary floor near $0.0065. Resistance is clustered at $0.0085, while the midpoint of the current range is roughly $0.0078. A decisive move above $0.0085 or below $0.0070 would define the next bias.
Outlook – With neutral market sentiment and no catalyst on the horizon, the coin is likely to consolidate within the identified band. Traders should watch for a clear breakout or breakdown before committing to directional exposure.
#GLMR #AltcoinAnalysis #BinanceSpot
3
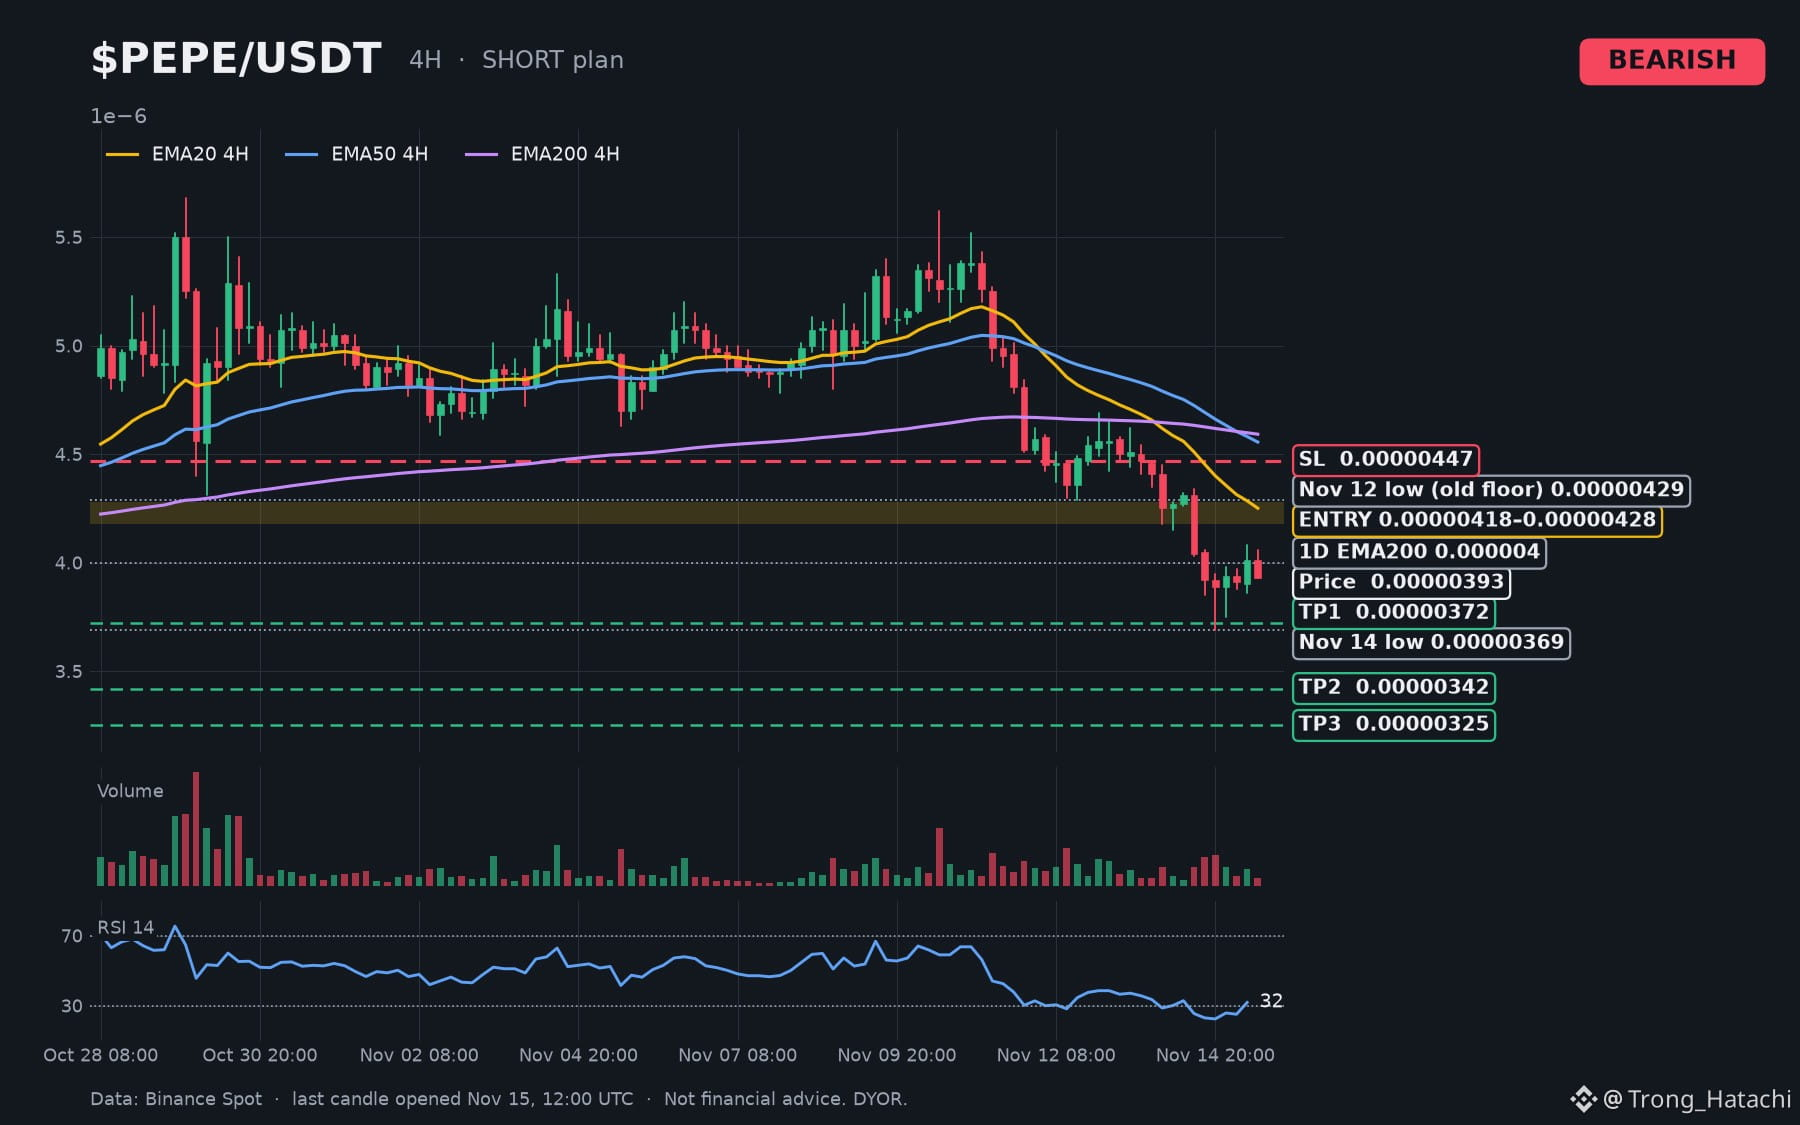
-31% in four days: $PEPE went from a 0.00000538 daily close (Nov 10) to a 0.00000369 wick (Nov 14).
The Nov 12-13 floor (~0.0000043) broke on the way down.
Trend: Bearish (4H below all EMAs)
🎯 Entry short: 0.00000418 – 0.00000428 (only if a bounce stalls; valid to Nov 17, 14:00 UTC)
✅ TP1: 0.00000372
✅ TP2: 0.00000342 (above Aug 30/Sep 2 lows)
✅ TP3: 0.00000325 (near Sep 10 low)
🛑 SL: 0.00000447 (above Nov 14 high)
📊 Logic:
• Old floor 0.00000429 + 4H EMA20 (~0.00000428) sit in the entry zone.
• 1D EMA200 ~0.0000040 lies between price and entry.
• Funding -0.046%, OI -7.5% in 24h: shorts paying, squeezes can be sharp.
• $BTC ~64.7K, 4H downtrend. Fear & Greed 10.
• No confirmed PEPE-specific news in 48h. Chart call only.
• 4H RSI 32. Entry ~7% above price may not fill. Size small if taken.
⚠️ Invalidation: 4H close above 0.00000447. If 0.00000369 breaks first, skip.
$PEPE at 0.0000039: SELL or BUY? 👇
#PEPE #MemeCoins #AltcoinAnalysis
Disclaimer: Not financial advice. DYOR.
-31% in four days: $PEPE went from a 0.00000538 daily close (Nov 10) to a 0.00000369 wick (Nov 14).
The Nov 12-13 floor (~0.0000043) broke on the way down.
Trend: Bearish (4H below all EMAs)
🎯 Entry short: 0.00000418 – 0.00000428 (only if a bounce stalls; valid to Nov 17, 14:00 UTC)
✅ TP1: 0.00000372
✅ TP2: 0.00000342 (above Aug 30/Sep 2 lows)
✅ TP3: 0.00000325 (near Sep 10 low)
🛑 SL: 0.00000447 (above Nov 14 high)
📊 Logic:
• Old floor 0.00000429 + 4H EMA20 (~0.00000428) sit in the entry zone.
• 1D EMA200 ~0.0000040 lies between price and entry.
• Funding -0.046%, OI -7.5% in 24h: shorts paying, squeezes can be sharp.
• $BTC ~64.7K, 4H downtrend. Fear & Greed 10.
• No confirmed PEPE-specific news in 48h. Chart call only.
• 4H RSI 32. Entry ~7% above price may not fill. Size small if taken.
⚠️ Invalidation: 4H close above 0.00000447. If 0.00000369 breaks first, skip.
$PEPE at 0.0000039: SELL or BUY? 👇
#PEPE #MemeCoins #AltcoinAnalysis
Disclaimer: Not financial advice. DYOR.
The Nov 12-13 floor (~0.0000043) broke on the way down.
Trend: Bearish (4H below all EMAs)
🎯 Entry short: 0.00000418 – 0.00000428 (only if a bounce stalls; valid to Nov 17, 14:00 UTC)
✅ TP1: 0.00000372
✅ TP2: 0.00000342 (above Aug 30/Sep 2 lows)
✅ TP3: 0.00000325 (near Sep 10 low)
🛑 SL: 0.00000447 (above Nov 14 high)
📊 Logic:
• Old floor 0.00000429 + 4H EMA20 (~0.00000428) sit in the entry zone.
• 1D EMA200 ~0.0000040 lies between price and entry.
• Funding -0.046%, OI -7.5% in 24h: shorts paying, squeezes can be sharp.
• $BTC ~64.7K, 4H downtrend. Fear & Greed 10.
• No confirmed PEPE-specific news in 48h. Chart call only.
• 4H RSI 32. Entry ~7% above price may not fill. Size small if taken.
⚠️ Invalidation: 4H close above 0.00000447. If 0.00000369 breaks first, skip.
$PEPE at 0.0000039: SELL or BUY? 👇
#PEPE #MemeCoins #AltcoinAnalysis
Disclaimer: Not financial advice. DYOR.
1
140
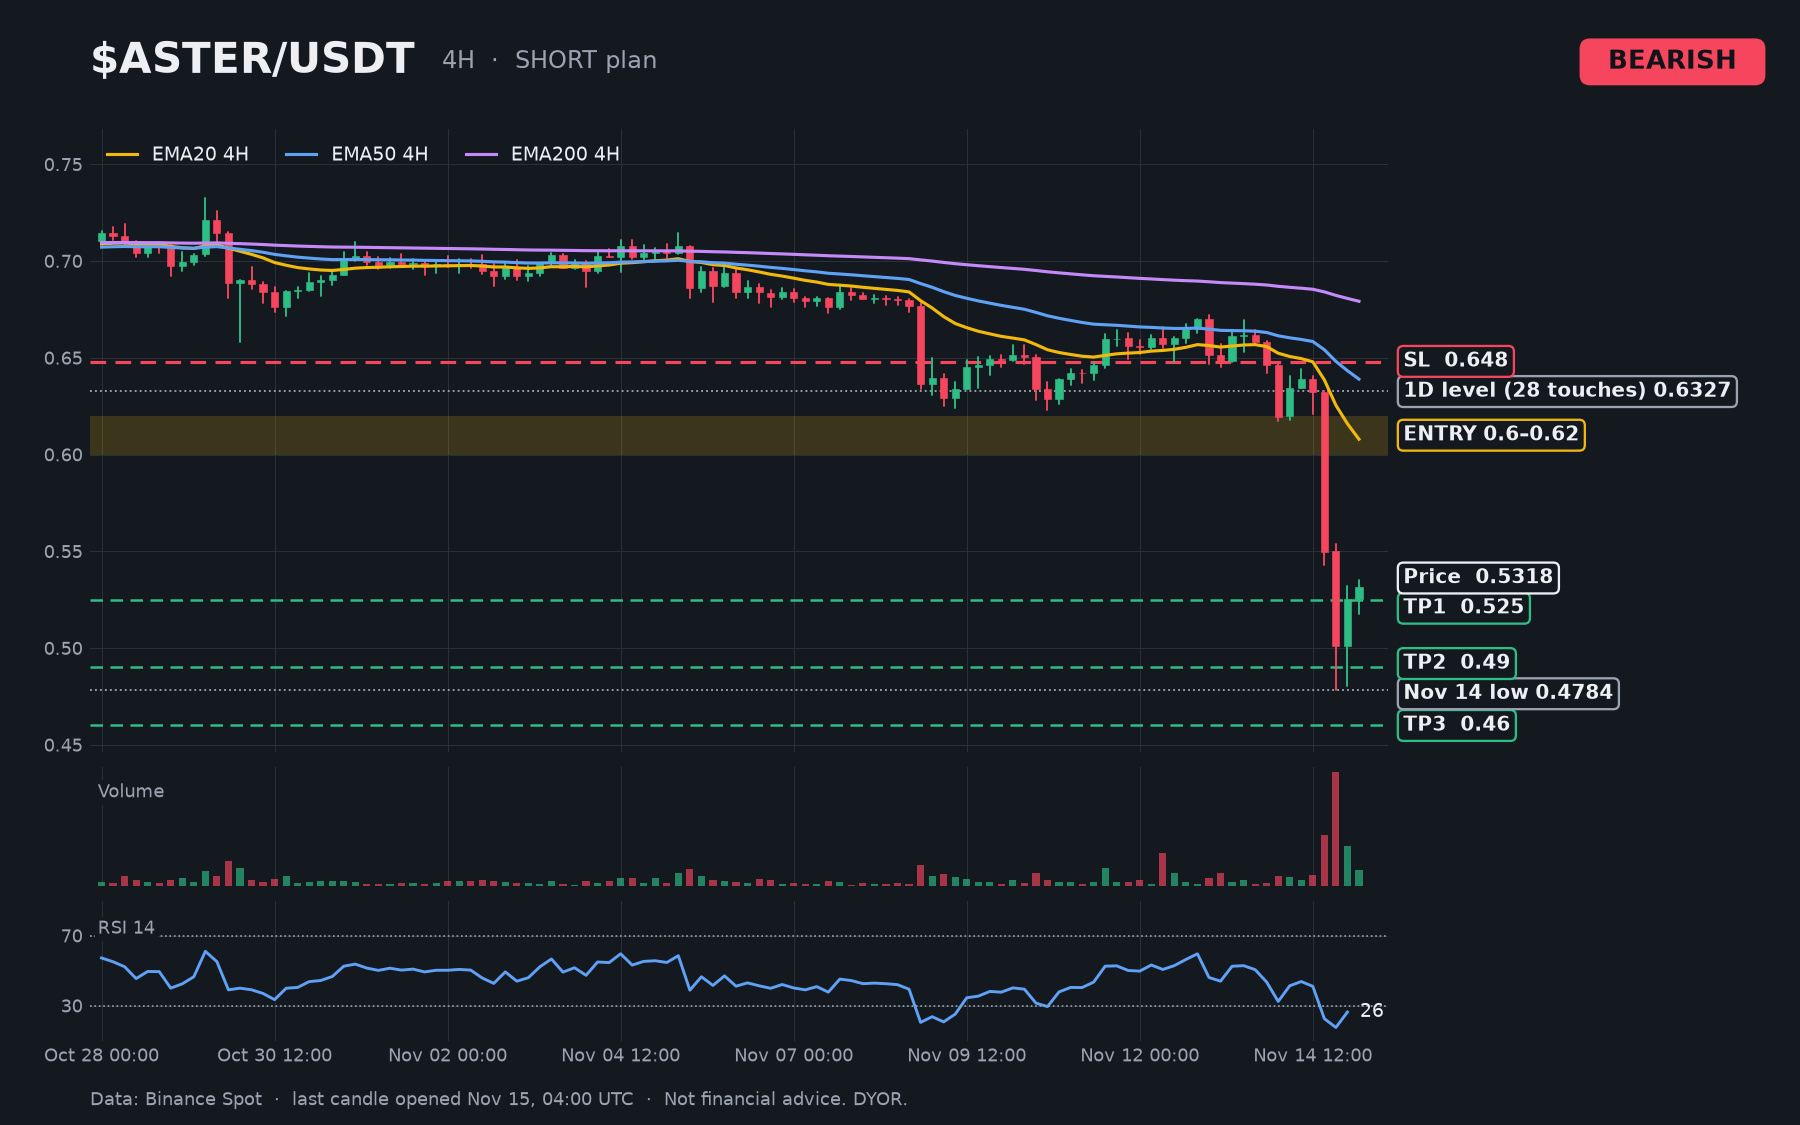
$ASTER closed Nov 14 at 0.501, its lowest daily close since Feb 5. June-August, no daily low went below 0.585. Then 0.632 to 0.478 in 8 hours.
Trend: Bearish (4H below all EMAs)
🎯 Entry short: 0.600 – 0.620 (only on a bounce that stalls there; valid to Nov 17, 00:00 UTC)
✅ TP1: 0.525
✅ TP2: 0.490 (above the Nov 14 low, 0.4784)
✅ TP3: 0.460 (near Feb 5 low, 0.457)
🛑 SL: 0.648
📊 Logic:
• Old floor, new ceiling: 0.6327 (1D, 28 touches) + 4H EMA20 ~0.616. 0.585 already lost.
• OI -18% in 24h, funding 0.005%: longs flushed, shorts not crowded.
• Supply: Stage 6 airdrop claims (~64M ASTER, per reports) open to Dec 4.
• Macro: $BTC ~64K, 4H downtrend. Fear & Greed 10.
• Risk: entry is ~15% above price and may never fill. 1D RSI 20.5 = oversold, sharp bounces likely. Small size.
⚠️ Invalidation: a 4H close above 0.648. If 0.4784 breaks before a fill, skip.
$ASTER back at 0.61: SELL or BUY? Drop one word 👇
#ASTER #AltcoinAnalysis #CryptoMarket
Disclaimer: Not financial advice. DYOR.
$ASTER closed Nov 14 at 0.501, its lowest daily close since Feb 5. June-August, no daily low went below 0.585. Then 0.632 to 0.478 in 8 hours.
Trend: Bearish (4H below all EMAs)
🎯 Entry short: 0.600 – 0.620 (only on a bounce that stalls there; valid to Nov 17, 00:00 UTC)
✅ TP1: 0.525
✅ TP2: 0.490 (above the Nov 14 low, 0.4784)
✅ TP3: 0.460 (near Feb 5 low, 0.457)
🛑 SL: 0.648
📊 Logic:
• Old floor, new ceiling: 0.6327 (1D, 28 touches) + 4H EMA20 ~0.616. 0.585 already lost.
• OI -18% in 24h, funding 0.005%: longs flushed, shorts not crowded.
• Supply: Stage 6 airdrop claims (~64M ASTER, per reports) open to Dec 4.
• Macro: $BTC ~64K, 4H downtrend. Fear & Greed 10.
• Risk: entry is ~15% above price and may never fill. 1D RSI 20.5 = oversold, sharp bounces likely. Small size.
⚠️ Invalidation: a 4H close above 0.648. If 0.4784 breaks before a fill, skip.
$ASTER back at 0.61: SELL or BUY? Drop one word 👇
#ASTER #AltcoinAnalysis #CryptoMarket
Disclaimer: Not financial advice. DYOR.
Trend: Bearish (4H below all EMAs)
🎯 Entry short: 0.600 – 0.620 (only on a bounce that stalls there; valid to Nov 17, 00:00 UTC)
✅ TP1: 0.525
✅ TP2: 0.490 (above the Nov 14 low, 0.4784)
✅ TP3: 0.460 (near Feb 5 low, 0.457)
🛑 SL: 0.648
📊 Logic:
• Old floor, new ceiling: 0.6327 (1D, 28 touches) + 4H EMA20 ~0.616. 0.585 already lost.
• OI -18% in 24h, funding 0.005%: longs flushed, shorts not crowded.
• Supply: Stage 6 airdrop claims (~64M ASTER, per reports) open to Dec 4.
• Macro: $BTC ~64K, 4H downtrend. Fear & Greed 10.
• Risk: entry is ~15% above price and may never fill. 1D RSI 20.5 = oversold, sharp bounces likely. Small size.
⚠️ Invalidation: a 4H close above 0.648. If 0.4784 breaks before a fill, skip.
$ASTER back at 0.61: SELL or BUY? Drop one word 👇
#ASTER #AltcoinAnalysis #CryptoMarket
Disclaimer: Not financial advice. DYOR.
2
202

·
--
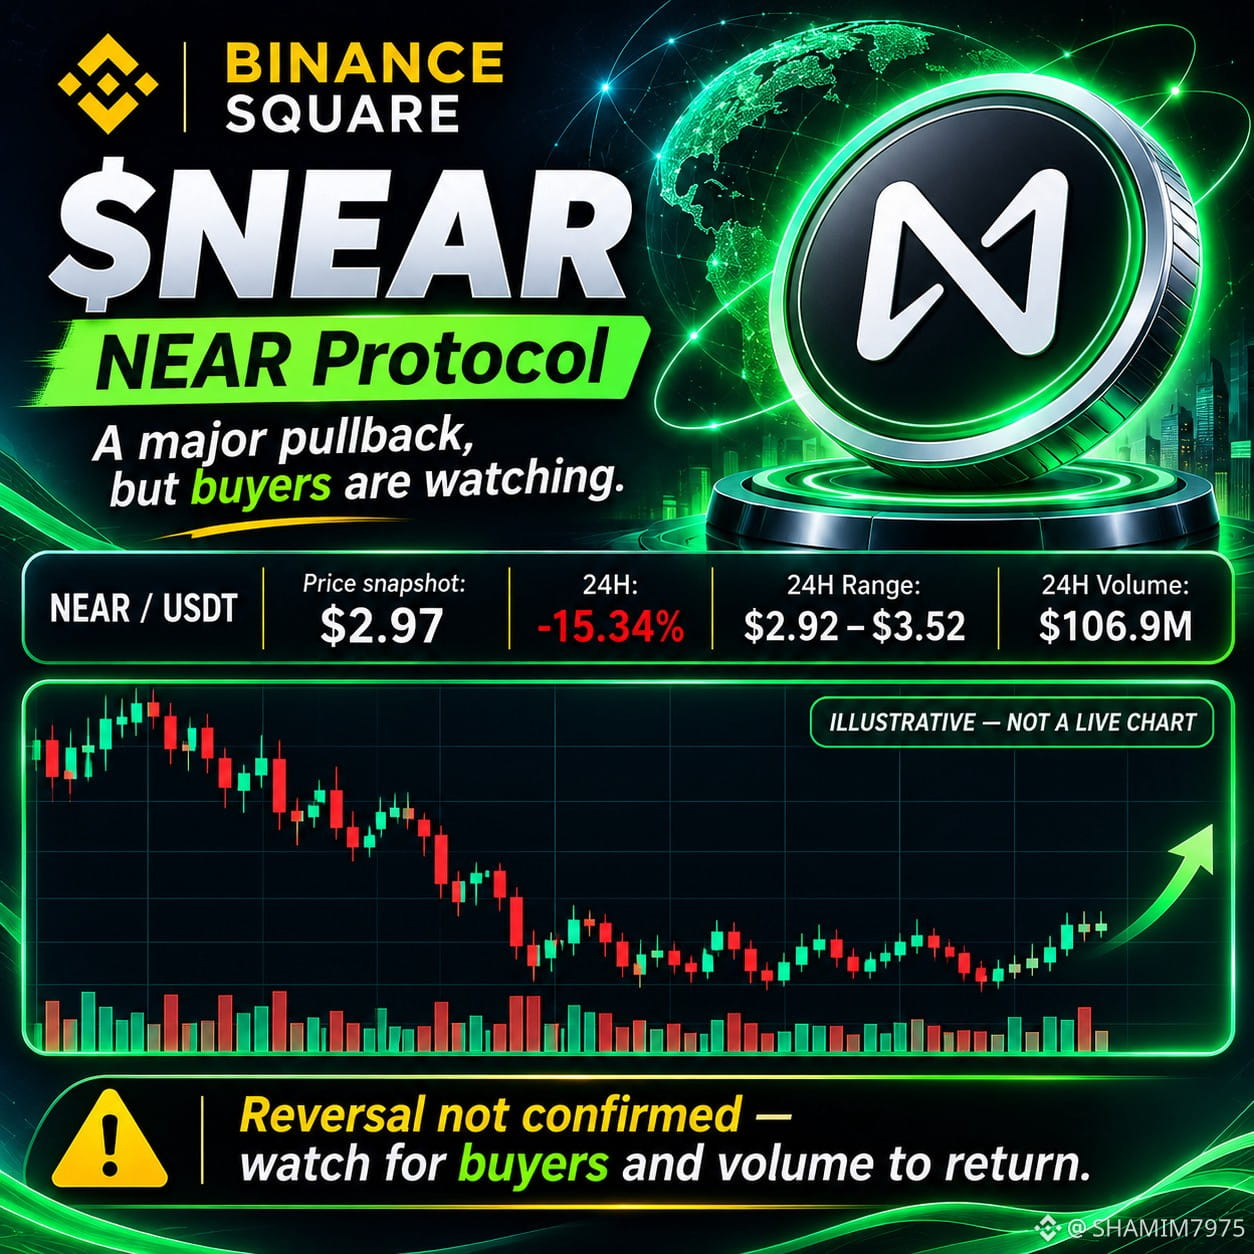
$NEAR is at an interesting point.
After a sharp 15.34% drop, the price is trading close to its 24-hour low of $2.92.
What I'm looking for now isn't another random green candle.
I want to see buyers defend this area, followed by stronger spot volume.
If NEAR builds a base and starts reclaiming lost ground, a recovery trade could become interesting.
But a clean break below $2.92 would weaken that idea.
This is where patience can make the difference between catching a setup and catching a falling knife.
#Near #NEARProtocol #cryptotrading #AltcoinAnalysis #BinanceSquare
$NEAR is at an interesting point.
After a sharp 15.34% drop, the price is trading close to its 24-hour low of $2.92.
What I'm looking for now isn't another random green candle.
I want to see buyers defend this area, followed by stronger spot volume.
If NEAR builds a base and starts reclaiming lost ground, a recovery trade could become interesting.
But a clean break below $2.92 would weaken that idea.
This is where patience can make the difference between catching a setup and catching a falling knife.
#Near #NEARProtocol #cryptotrading #AltcoinAnalysis #BinanceSquare
After a sharp 15.34% drop, the price is trading close to its 24-hour low of $2.92.
What I'm looking for now isn't another random green candle.
I want to see buyers defend this area, followed by stronger spot volume.
If NEAR builds a base and starts reclaiming lost ground, a recovery trade could become interesting.
But a clean break below $2.92 would weaken that idea.
This is where patience can make the difference between catching a setup and catching a falling knife.
#Near #NEARProtocol #cryptotrading #AltcoinAnalysis #BinanceSquare
777

·
--
$APT
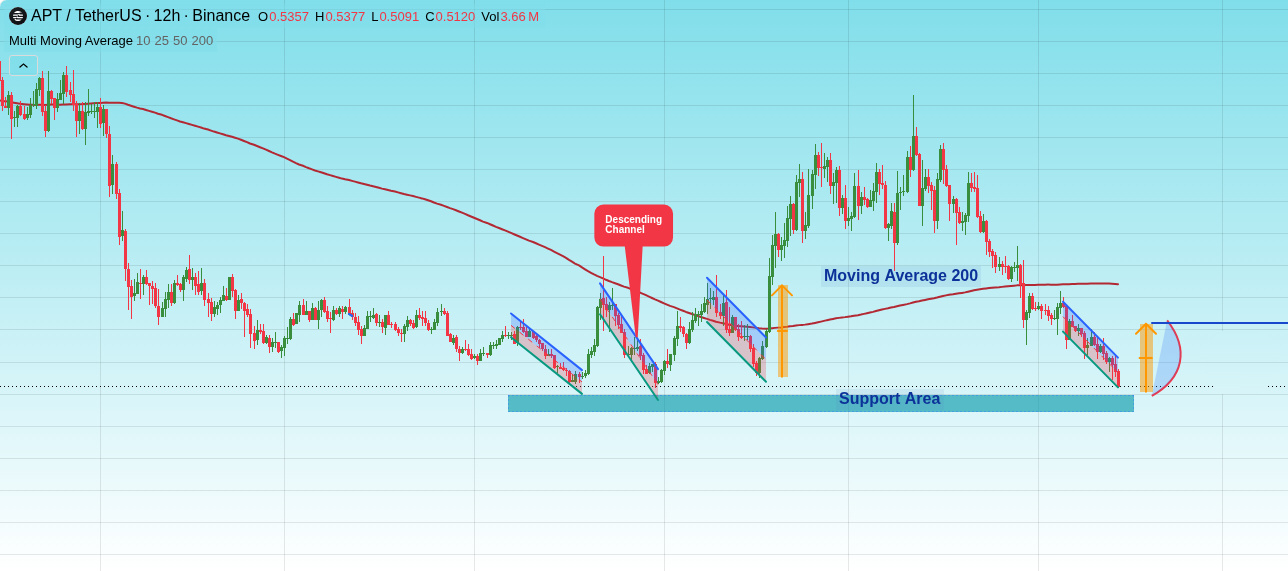
The recent Bitcoin decline is putting selling pressure on assets like $APT.
On the 12-hour chart, the price hit the lower boundary of a descending channel right near the major support zone at $0.4770.
A break from this channel could see a target toward $0.61.
#AltcoinAnalysis
$APT
The recent Bitcoin decline is putting selling pressure on assets like $APT .
On the 12-hour chart, the price hit the lower boundary of a descending channel right near the major support zone at $0.4770.
A break from this channel could see a target toward $0.61.
#AltcoinAnalysis
The recent Bitcoin decline is putting selling pressure on assets like $APT .
On the 12-hour chart, the price hit the lower boundary of a descending channel right near the major support zone at $0.4770.
A break from this channel could see a target toward $0.61.
#AltcoinAnalysis
4
1.4k
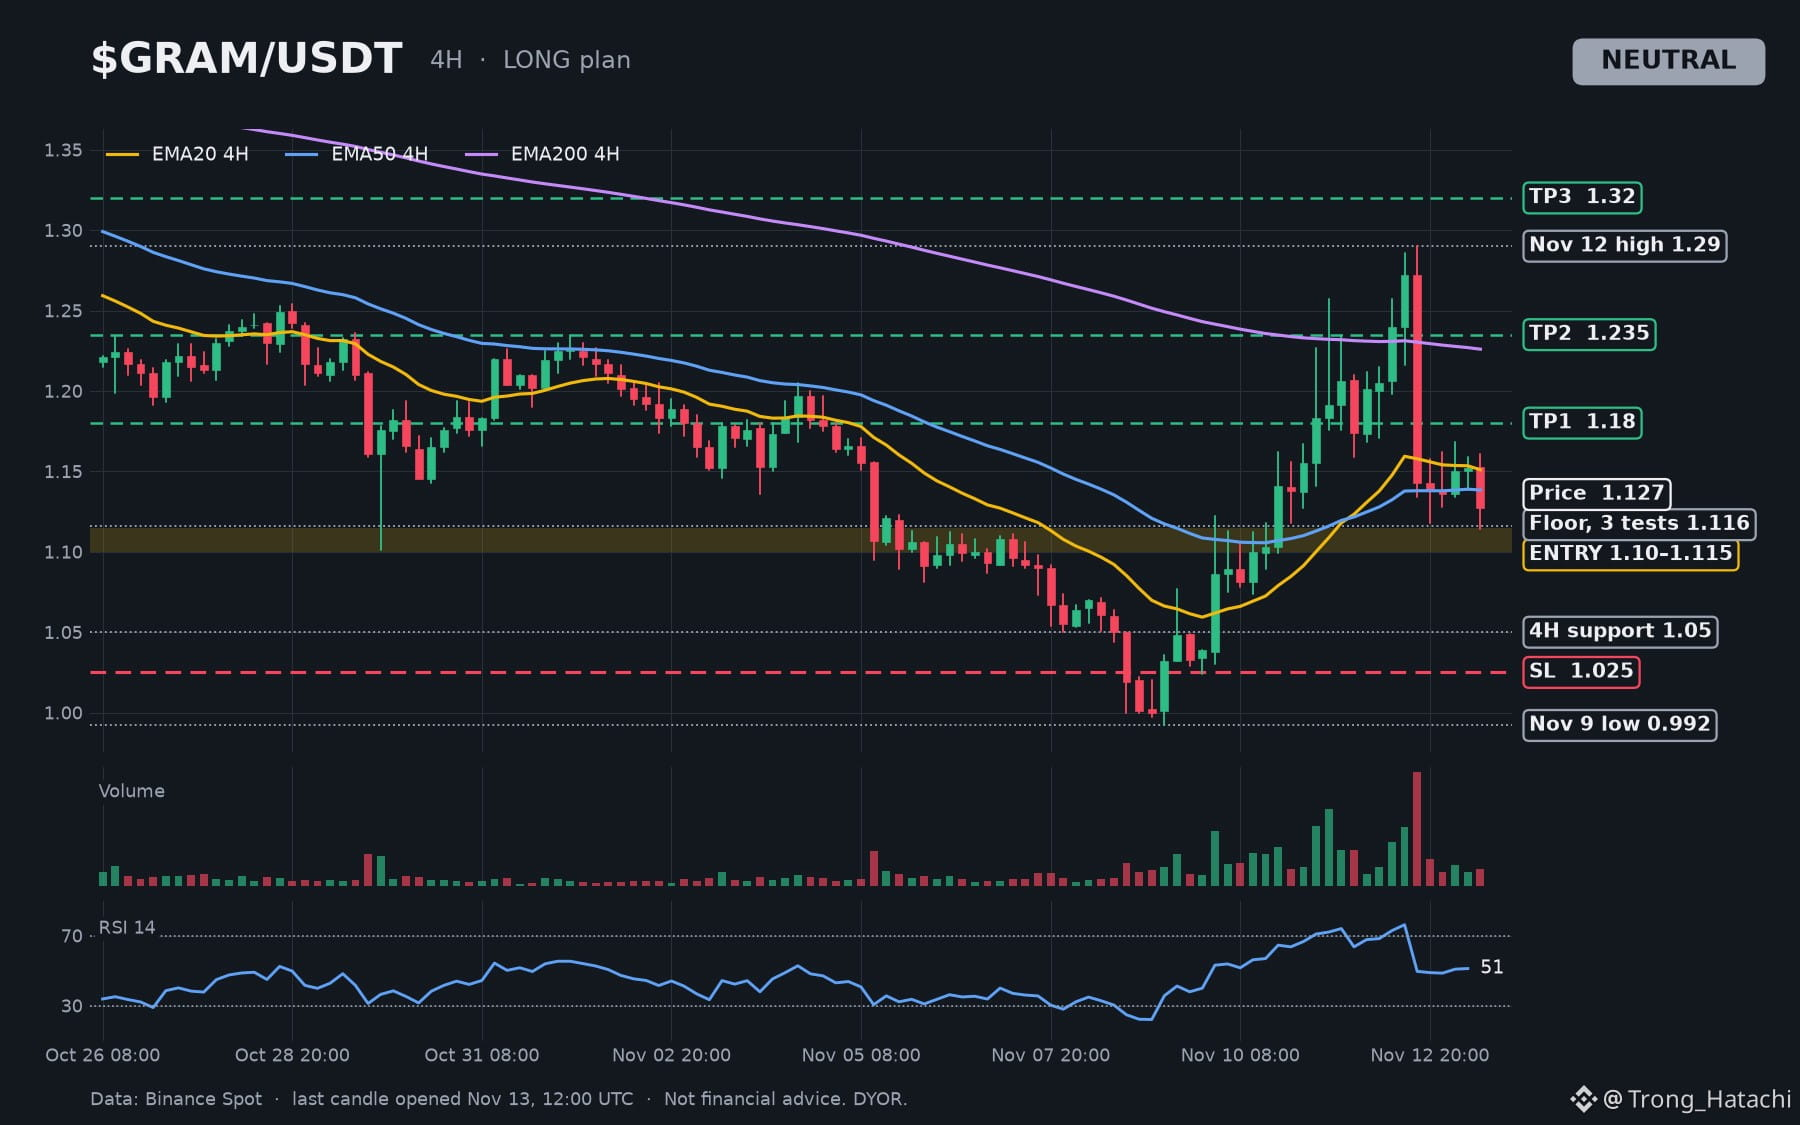
Durov said 700K+ self-custodial wallets were created in 48h (Nov 9). $GRAM (ex-TON) ran 0.992 to 1.29, then gave back ~55%. Now testing the 1.114 floor a 3rd time.
Trend: Neutral (4H)
🎯 Entry long: 1.10 – 1.115 (on a dip that holds 1H closes above 1.10; valid to Nov 15, 00:00 UTC)
✅ TP1: 1.18 (partial)
✅ TP2: 1.235 (4H EMA200 1.227 just below)
✅ TP3: 1.32 (under 1D resistance 1.335)
🛑 SL: 1.025
📊 Logic:
• 1.114-1.118 has held since Nov 11. The Nov 12 4H candle tagged 1.29 and dumped to close at 1.143.
• Funding -0.024%, OI -22% in 24h: late longs flushed.
• The count is Durov's, not on-chain (crypto.news, U.Today). Created isn't funded.
• Risk: 1.16-1.168 capped every 4H candle today. $BTC 4H downtrend, RSI ~25. Small size.
⚠️ Invalidation: 4H close below 1.05 = exit early. 1.025 is the hard stop, under the Nov 10 low (1.030). Skip if 1.20 prints first.
1.11 = FLOOR or TRAP? Drop one word 👇
#GRAM #AltcoinAnalysis #MarketUpdate $GRAM
Disclaimer: Not financial advice. DYOR.
Durov said 700K+ self-custodial wallets were created in 48h (Nov 9). $GRAM (ex-TON) ran 0.992 to 1.29, then gave back ~55%. Now testing the 1.114 floor a 3rd time.
Trend: Neutral (4H)
🎯 Entry long: 1.10 – 1.115 (on a dip that holds 1H closes above 1.10; valid to Nov 15, 00:00 UTC)
✅ TP1: 1.18 (partial)
✅ TP2: 1.235 (4H EMA200 1.227 just below)
✅ TP3: 1.32 (under 1D resistance 1.335)
🛑 SL: 1.025
📊 Logic:
• 1.114-1.118 has held since Nov 11. The Nov 12 4H candle tagged 1.29 and dumped to close at 1.143.
• Funding -0.024%, OI -22% in 24h: late longs flushed.
• The count is Durov's, not on-chain (crypto.news, U.Today). Created isn't funded.
• Risk: 1.16-1.168 capped every 4H candle today. $BTC 4H downtrend, RSI ~25. Small size.
⚠️ Invalidation: 4H close below 1.05 = exit early. 1.025 is the hard stop, under the Nov 10 low (1.030). Skip if 1.20 prints first.
1.11 = FLOOR or TRAP? Drop one word 👇
#GRAM #AltcoinAnalysis #MarketUpdate $GRAM
Disclaimer: Not financial advice. DYOR.
Trend: Neutral (4H)
🎯 Entry long: 1.10 – 1.115 (on a dip that holds 1H closes above 1.10; valid to Nov 15, 00:00 UTC)
✅ TP1: 1.18 (partial)
✅ TP2: 1.235 (4H EMA200 1.227 just below)
✅ TP3: 1.32 (under 1D resistance 1.335)
🛑 SL: 1.025
📊 Logic:
• 1.114-1.118 has held since Nov 11. The Nov 12 4H candle tagged 1.29 and dumped to close at 1.143.
• Funding -0.024%, OI -22% in 24h: late longs flushed.
• The count is Durov's, not on-chain (crypto.news, U.Today). Created isn't funded.
• Risk: 1.16-1.168 capped every 4H candle today. $BTC 4H downtrend, RSI ~25. Small size.
⚠️ Invalidation: 4H close below 1.05 = exit early. 1.025 is the hard stop, under the Nov 10 low (1.030). Skip if 1.20 prints first.
1.11 = FLOOR or TRAP? Drop one word 👇
#GRAM #AltcoinAnalysis #MarketUpdate $GRAM
Disclaimer: Not financial advice. DYOR.
2
262
·
--
Europe Session: SOPH Defends the Floor ⚔️
Price action – $SOPH is trading at $0.001630 on Binance Spot, up 25.39 % over the past 24 hours with 24‑hour volume around $2.6 M. The rally comes amid overall bearish sentiment in the alt‑coin arena, leaving the move on a thin footing.
Key levels – Immediate support is clustered at $0.00155, a zone that has previously absorbed selling pressure. Resistance sits near $0.00180, where the price has stalled in earlier attempts. The mid‑range pivot is around $0.00168, offering a potential short‑term target if buying resumes.
Outlook – From a support‑defense perspective, buyers must hold the $0.00155 floor; failure would likely open the path to a deeper decline toward $0.00140. While the 25 % surge is enticing, the broader bearish backdrop suggests caution and a watchful eye on the support zone.
#SOPH #AltcoinAnalysis #EuropeSession
Europe Session: SOPH Defends the Floor ⚔️
Price action – $SOPH is trading at $0.001630 on Binance Spot, up 25.39 % over the past 24 hours with 24‑hour volume around $2.6 M. The rally comes amid overall bearish sentiment in the alt‑coin arena, leaving the move on a thin footing.
Key levels – Immediate support is clustered at $0.00155, a zone that has previously absorbed selling pressure. Resistance sits near $0.00180, where the price has stalled in earlier attempts. The mid‑range pivot is around $0.00168, offering a potential short‑term target if buying resumes.
Outlook – From a support‑defense perspective, buyers must hold the $0.00155 floor; failure would likely open the path to a deeper decline toward $0.00140. While the 25 % surge is enticing, the broader bearish backdrop suggests caution and a watchful eye on the support zone.
#SOPH #AltcoinAnalysis #EuropeSession
Price action – $SOPH is trading at $0.001630 on Binance Spot, up 25.39 % over the past 24 hours with 24‑hour volume around $2.6 M. The rally comes amid overall bearish sentiment in the alt‑coin arena, leaving the move on a thin footing.
Key levels – Immediate support is clustered at $0.00155, a zone that has previously absorbed selling pressure. Resistance sits near $0.00180, where the price has stalled in earlier attempts. The mid‑range pivot is around $0.00168, offering a potential short‑term target if buying resumes.
Outlook – From a support‑defense perspective, buyers must hold the $0.00155 floor; failure would likely open the path to a deeper decline toward $0.00140. While the 25 % surge is enticing, the broader bearish backdrop suggests caution and a watchful eye on the support zone.
#SOPH #AltcoinAnalysis #EuropeSession
5
·
--
CBRS Momentum Test: Asia Session Pushes Higher 🚀
Price action – $CBRS is trading at $116.16 on Binance Spot (CBRS/USDT), up 15.13 % over the past 24 hours with $106.8 M of volume. The rally broke through the $112‑$113 zone, extending the bullish thrust from the previous session.
Key levels – Immediate resistance sits around $119.50, with a stronger ceiling near $122.00. Mid‑range bias lies at $118.00, acting as a potential swing point. The nearest support cluster is at $112.00, followed by a deeper floor at $108.50, which held during the prior pullback.
Outlook – The move appears stretched given the rapid 15 % gain and neutral sentiment. While the upside remains tempting, a corrective pullback toward the $112 support zone is likely if buying pressure wanes. Traders should monitor volume spikes and price action around the $118–$119 range for clues on direction.
#CBRS #AltcoinAnalysis #BinanceAsia
CBRS Momentum Test: Asia Session Pushes Higher 🚀
Price action – $CBRS is trading at $116.16 on Binance Spot (CBRS/USDT), up 15.13 % over the past 24 hours with $106.8 M of volume. The rally broke through the $112‑$113 zone, extending the bullish thrust from the previous session.
Key levels – Immediate resistance sits around $119.50, with a stronger ceiling near $122.00. Mid‑range bias lies at $118.00, acting as a potential swing point. The nearest support cluster is at $112.00, followed by a deeper floor at $108.50, which held during the prior pullback.
Outlook – The move appears stretched given the rapid 15 % gain and neutral sentiment. While the upside remains tempting, a corrective pullback toward the $112 support zone is likely if buying pressure wanes. Traders should monitor volume spikes and price action around the $118–$119 range for clues on direction.
#CBRS #AltcoinAnalysis #BinanceAsia
Price action – $CBRS is trading at $116.16 on Binance Spot (CBRS/USDT), up 15.13 % over the past 24 hours with $106.8 M of volume. The rally broke through the $112‑$113 zone, extending the bullish thrust from the previous session.
Key levels – Immediate resistance sits around $119.50, with a stronger ceiling near $122.00. Mid‑range bias lies at $118.00, acting as a potential swing point. The nearest support cluster is at $112.00, followed by a deeper floor at $108.50, which held during the prior pullback.
Outlook – The move appears stretched given the rapid 15 % gain and neutral sentiment. While the upside remains tempting, a corrective pullback toward the $112 support zone is likely if buying pressure wanes. Traders should monitor volume spikes and price action around the $118–$119 range for clues on direction.
#CBRS #AltcoinAnalysis #BinanceAsia
43

·
--
Падение
🚀 HOW TO IDENTIFY A STRONG ALTCOIN? | 5 KEY FACTORS
📊 Not Every Trending Coin Is a Good Opportunity!
The crypto market is full of altcoins, but smart research separates informed decisions from blind speculation.
🔍 5 Important Factors to Research:
1️⃣ Real Utility — Does the project solve a real-world problem?
2️⃣ Development Activity — Is the team actively building and improving?
3️⃣ Trading Volume — Is there genuine market participation?
4️⃣ Tokenomics — Understand supply, distribution, and token unlocks.
5️⃣ Market Strength — Compare performance with the overall crypto market.
📈 Trading Pairs to Explore:
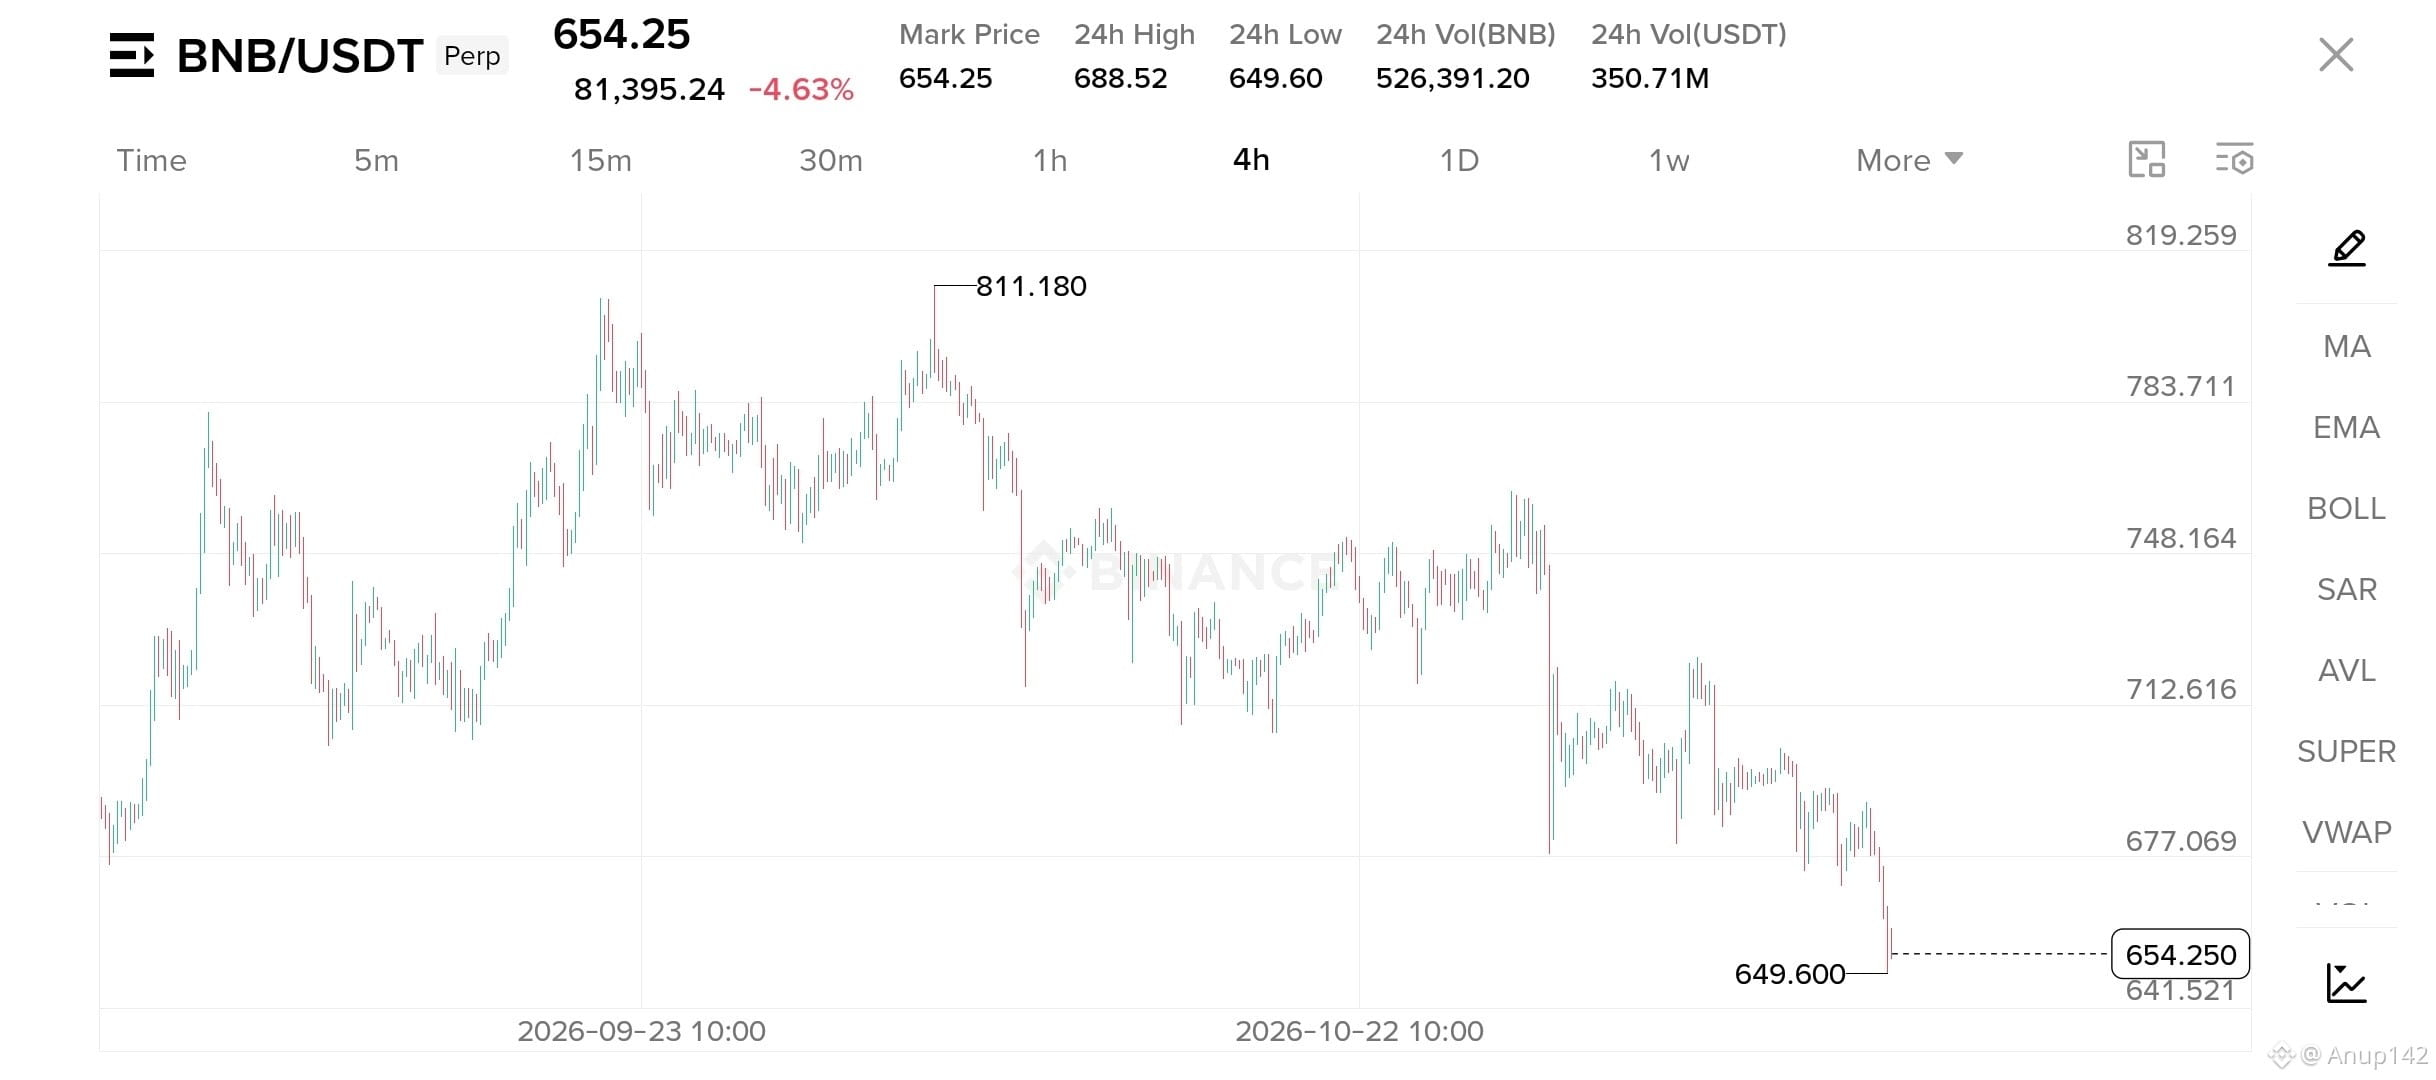
$BNB /USDT
{future}(BNBUSDT)
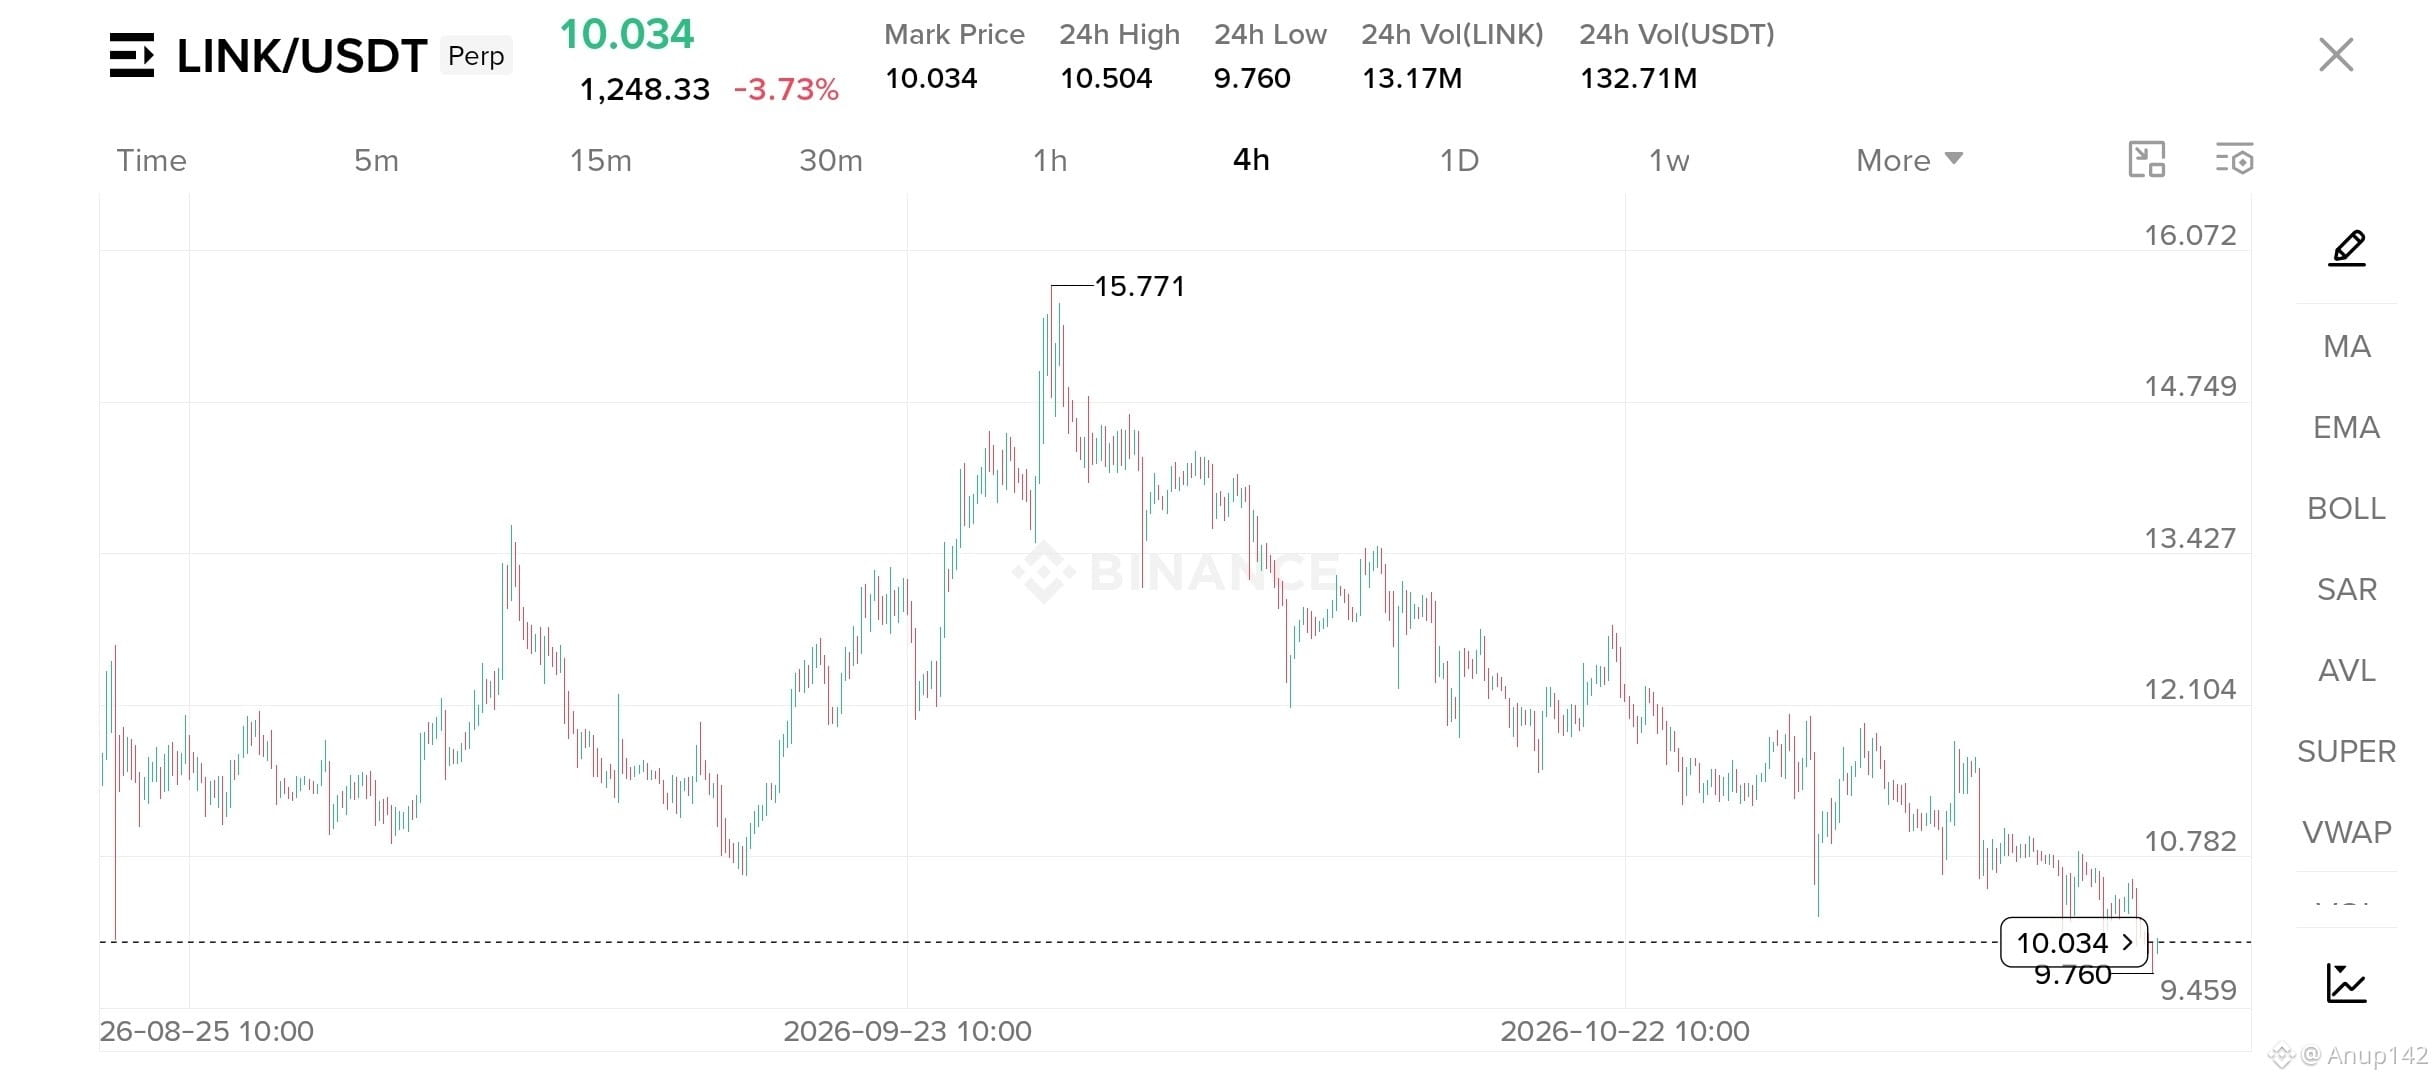
$LINK /USDT
{future}(LINKUSDT)
⚖️ MY MARKET VIEW: Don't chase hype or sudden price movements. Focus on research, market structure, and risk management.
👇 WHAT MATTERS MOST WHEN YOU RESEARCH AN ALTCOIN?
🔵 Real Utility
🟢 Development
🟡 Trading Volume
🟣 Tokenomics
💬 Share your thoughts in the comments!
👥 Follow @Square-Creator-2c790b869bb2 for BTC, GOLD & Altcoin market insights.
NFA | DYOR | Trade Smart. Stay Ahead.
#AltcoinAnalysis #cryptoeducation #bnb #LINK #CryptoMarket
🚀 HOW TO IDENTIFY A STRONG ALTCOIN? | 5 KEY FACTORS
📊 Not Every Trending Coin Is a Good Opportunity!
The crypto market is full of altcoins, but smart research separates informed decisions from blind speculation.
🔍 5 Important Factors to Research:
1️⃣ Real Utility — Does the project solve a real-world problem?
2️⃣ Development Activity — Is the team actively building and improving?
3️⃣ Trading Volume — Is there genuine market participation?
4️⃣ Tokenomics — Understand supply, distribution, and token unlocks.
5️⃣ Market Strength — Compare performance with the overall crypto market.
📈 Trading Pairs to Explore:
$BNB /USDT
$LINK /USDT
⚖️ MY MARKET VIEW: Don't chase hype or sudden price movements. Focus on research, market structure, and risk management.
👇 WHAT MATTERS MOST WHEN YOU RESEARCH AN ALTCOIN?
🔵 Real Utility
🟢 Development
🟡 Trading Volume
🟣 Tokenomics
💬 Share your thoughts in the comments!
👥 Follow @Anup142 for BTC, GOLD & Altcoin market insights.
NFA | DYOR | Trade Smart. Stay Ahead.
#AltcoinAnalysis #cryptoeducation #bnb #LINK #CryptoMarket
📊 Not Every Trending Coin Is a Good Opportunity!
The crypto market is full of altcoins, but smart research separates informed decisions from blind speculation.
🔍 5 Important Factors to Research:
1️⃣ Real Utility — Does the project solve a real-world problem?
2️⃣ Development Activity — Is the team actively building and improving?
3️⃣ Trading Volume — Is there genuine market participation?
4️⃣ Tokenomics — Understand supply, distribution, and token unlocks.
5️⃣ Market Strength — Compare performance with the overall crypto market.
📈 Trading Pairs to Explore:
$BNB /USDT
$LINK /USDT
⚖️ MY MARKET VIEW: Don't chase hype or sudden price movements. Focus on research, market structure, and risk management.
👇 WHAT MATTERS MOST WHEN YOU RESEARCH AN ALTCOIN?
🔵 Real Utility
🟢 Development
🟡 Trading Volume
🟣 Tokenomics
💬 Share your thoughts in the comments!
👥 Follow @Anup142 for BTC, GOLD & Altcoin market insights.
NFA | DYOR | Trade Smart. Stay Ahead.
#AltcoinAnalysis #cryptoeducation #bnb #LINK #CryptoMarket
1
75
·
--
BARD Beats the Noise: Stretched Rally Under Scrutiny 🎯
Price action – $BARD trades at $0.1083 on Binance Spot (BARD/USDT), up 26.96% over the last 24 hours. 24‑hour volume sits around $17.0 M, reflecting solid buying interest despite the neutral sentiment.
Key levels – Immediate support holds near $0.095, with a secondary floor around $0.088. Resistance caps the recent surge at $0.122, while the mid‑range pivot sits close to $0.108. A clean break above $0.122 could open the next upside band; a slip back to $0.095 would likely trigger a corrective bounce.
Outlook – The analyst angle is cautious: the rapid 27% jump appears stretched relative to the current structure. Watch for a pullback toward the $0.095 support zone before any renewed upside momentum. Maintaining a watchful stance is prudent until price stabilises around the mid‑range pivot. 📈⚖️🔍
#BARD #AltcoinAnalysis #CryptoWatch
BARD Beats the Noise: Stretched Rally Under Scrutiny 🎯
Price action – $BARD trades at $0.1083 on Binance Spot (BARD/USDT), up 26.96% over the last 24 hours. 24‑hour volume sits around $17.0 M, reflecting solid buying interest despite the neutral sentiment.
Key levels – Immediate support holds near $0.095, with a secondary floor around $0.088. Resistance caps the recent surge at $0.122, while the mid‑range pivot sits close to $0.108. A clean break above $0.122 could open the next upside band; a slip back to $0.095 would likely trigger a corrective bounce.
Outlook – The analyst angle is cautious: the rapid 27% jump appears stretched relative to the current structure. Watch for a pullback toward the $0.095 support zone before any renewed upside momentum. Maintaining a watchful stance is prudent until price stabilises around the mid‑range pivot. 📈⚖️🔍
#BARD #AltcoinAnalysis #CryptoWatch
Price action – $BARD trades at $0.1083 on Binance Spot (BARD/USDT), up 26.96% over the last 24 hours. 24‑hour volume sits around $17.0 M, reflecting solid buying interest despite the neutral sentiment.
Key levels – Immediate support holds near $0.095, with a secondary floor around $0.088. Resistance caps the recent surge at $0.122, while the mid‑range pivot sits close to $0.108. A clean break above $0.122 could open the next upside band; a slip back to $0.095 would likely trigger a corrective bounce.
Outlook – The analyst angle is cautious: the rapid 27% jump appears stretched relative to the current structure. Watch for a pullback toward the $0.095 support zone before any renewed upside momentum. Maintaining a watchful stance is prudent until price stabilises around the mid‑range pivot. 📈⚖️🔍
#BARD #AltcoinAnalysis #CryptoWatch
3

·
--
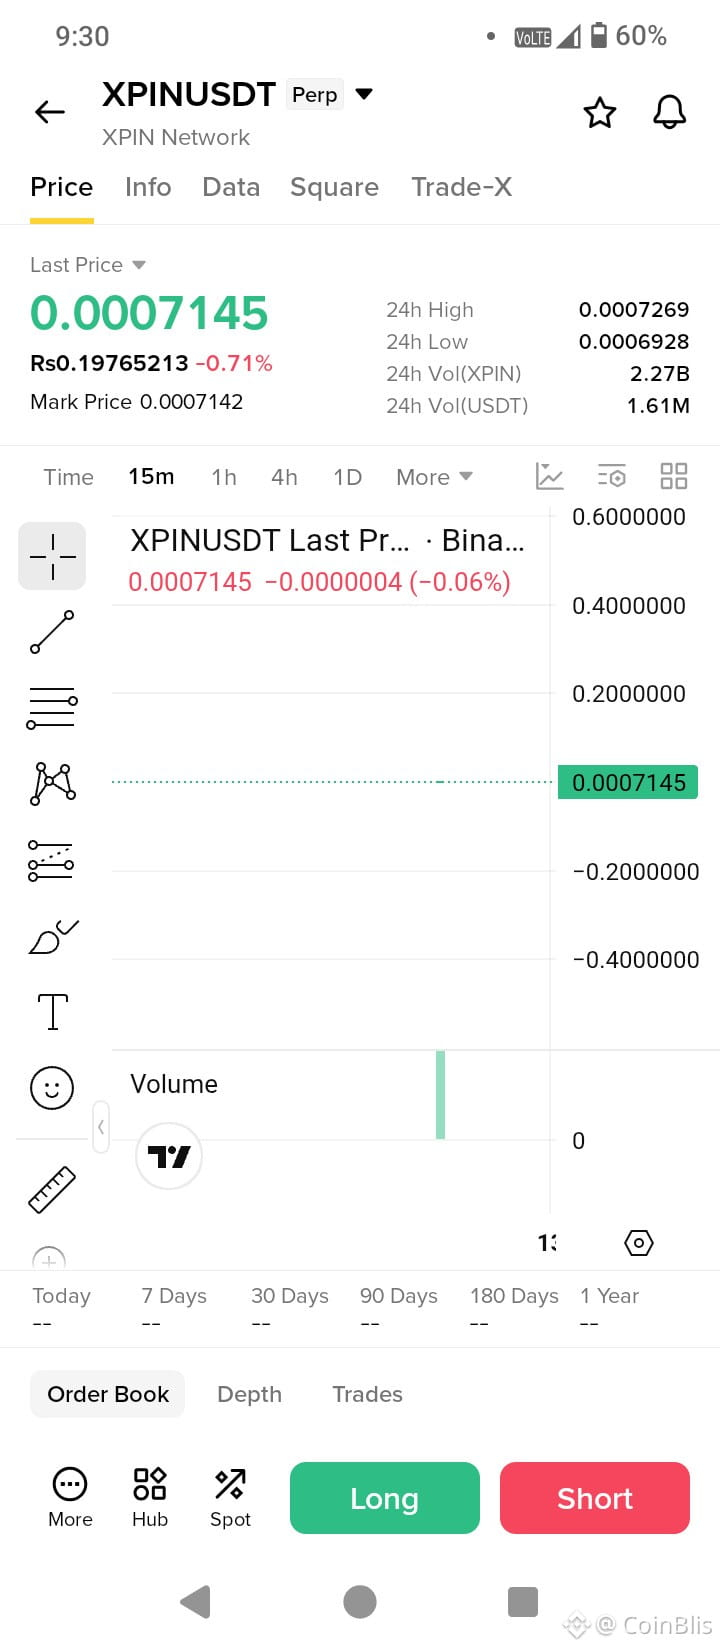
$XPIN SHORT TRADE SIGNAL | SELLERS TESTING MARKET STRENGTH
XPIN Network is trading at 0.0007145 USDT, down 0.71% over the last 24 hours. Price is consolidating within a narrow range, with resistance near 0.0007269 and immediate support around 0.0006928. A rejection from the upper range could create a short-term bearish opportunity.
TRADE SETUP — SHORT
- Entry Zone: 0.0007130 – 0.0007180
- TP1: 0.0007070
- TP2: 0.0007000
- TP3: 0.0006930
- Stop Loss: 0.0007300
MARKET OUTLOOK:
XPIN remains vulnerable to further downside if buyers fail to reclaim the 0.0007200–0.0007269 resistance zone. Watch for selling pressure and confirmation before entering. A breakout above resistance invalidates this bearish setup.
$AAPLB $NVDAB
#XPIN #XPINUSDT #cryptotrading #ShortSignal #AltcoinAnalysis
$XPIN SHORT TRADE SIGNAL | SELLERS TESTING MARKET STRENGTH
XPIN Network is trading at 0.0007145 USDT, down 0.71% over the last 24 hours. Price is consolidating within a narrow range, with resistance near 0.0007269 and immediate support around 0.0006928. A rejection from the upper range could create a short-term bearish opportunity.
TRADE SETUP — SHORT
- Entry Zone: 0.0007130 – 0.0007180
- TP1: 0.0007070
- TP2: 0.0007000
- TP3: 0.0006930
- Stop Loss: 0.0007300
MARKET OUTLOOK:
XPIN remains vulnerable to further downside if buyers fail to reclaim the 0.0007200–0.0007269 resistance zone. Watch for selling pressure and confirmation before entering. A breakout above resistance invalidates this bearish setup.
$AAPLB $NVDAB
#XPIN #XPINUSDT #cryptotrading #ShortSignal #AltcoinAnalysis
XPIN Network is trading at 0.0007145 USDT, down 0.71% over the last 24 hours. Price is consolidating within a narrow range, with resistance near 0.0007269 and immediate support around 0.0006928. A rejection from the upper range could create a short-term bearish opportunity.
TRADE SETUP — SHORT
- Entry Zone: 0.0007130 – 0.0007180
- TP1: 0.0007070
- TP2: 0.0007000
- TP3: 0.0006930
- Stop Loss: 0.0007300
MARKET OUTLOOK:
XPIN remains vulnerable to further downside if buyers fail to reclaim the 0.0007200–0.0007269 resistance zone. Watch for selling pressure and confirmation before entering. A breakout above resistance invalidates this bearish setup.
$AAPLB $NVDAB
#XPIN #XPINUSDT #cryptotrading #ShortSignal #AltcoinAnalysis
1
635

·
--
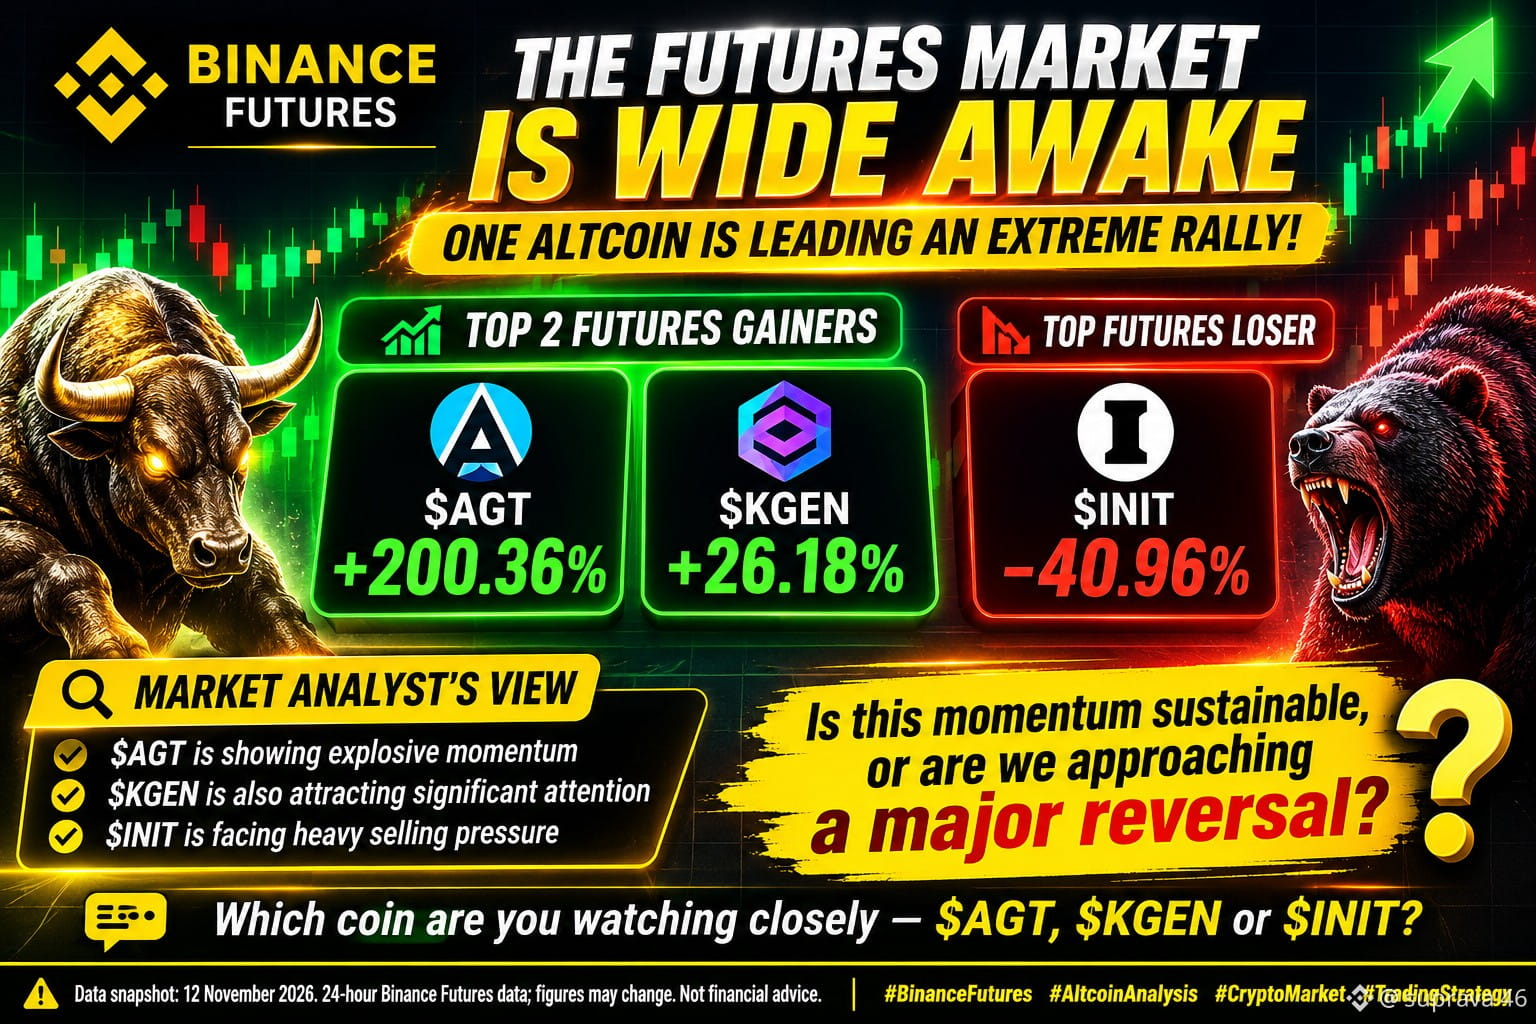
🚨 THE FUTURES MARKET IS WIDE AWAKE — ONE ALTCOIN IS LEADING AN EXTREME RALLY!
Today's Binance USDⓈ-M Futures market is showing some extraordinary price movements. But is this genuine momentum or a move that could reverse sharply?
📈 TOP 2 FUTURES GAINERS
🥇 $AGT — +200.36%
🥈 $KGEN — +26.18%
📉 TOP FUTURES LOSER
🔻 $INIT — -40.96%
🔍 MARKET ANALYST'S VIEW
$AGT is showing explosive momentum, while $KGEN is also attracting significant attention.
On the bearish side, $INIT is facing heavy selling pressure.
However, extreme price movements can bring extreme volatility.
Before trusting any breakout or breakdown, watch:
• Trading Volume
• Open Interest (OI)
• Funding Rate
• Price Structure
🎯 THE BIG QUESTION: Is this momentum sustainable, or are we approaching a major reversal?
Which coin are you watching closely — $AGT, $KGEN or $INIT?
⚠️ Data snapshot: 12 November 2026. 24-hour Binance Futures ticker data; figures may change. Not financial advice.
#BinanceFutures #AltcoinAnalysis #CryptoMarket #tradingStrategy
🚨 THE FUTURES MARKET IS WIDE AWAKE — ONE ALTCOIN IS LEADING AN EXTREME RALLY!
Today's Binance USDⓈ-M Futures market is showing some extraordinary price movements. But is this genuine momentum or a move that could reverse sharply?
📈 TOP 2 FUTURES GAINERS
🥇 $AGT — +200.36%
🥈 $KGEN — +26.18%
📉 TOP FUTURES LOSER
🔻 $INIT — -40.96%
🔍 MARKET ANALYST'S VIEW
$AGT is showing explosive momentum, while $KGEN is also attracting significant attention.
On the bearish side, $INIT is facing heavy selling pressure.
However, extreme price movements can bring extreme volatility.
Before trusting any breakout or breakdown, watch:
• Trading Volume
• Open Interest (OI)
• Funding Rate
• Price Structure
🎯 THE BIG QUESTION: Is this momentum sustainable, or are we approaching a major reversal?
Which coin are you watching closely — $AGT, $KGEN or $INIT?
⚠️ Data snapshot: 12 November 2026. 24-hour Binance Futures ticker data; figures may change. Not financial advice.
#BinanceFutures #AltcoinAnalysis #CryptoMarket #tradingStrategy
Today's Binance USDⓈ-M Futures market is showing some extraordinary price movements. But is this genuine momentum or a move that could reverse sharply?
📈 TOP 2 FUTURES GAINERS
🥇 $AGT — +200.36%
🥈 $KGEN — +26.18%
📉 TOP FUTURES LOSER
🔻 $INIT — -40.96%
🔍 MARKET ANALYST'S VIEW
$AGT is showing explosive momentum, while $KGEN is also attracting significant attention.
On the bearish side, $INIT is facing heavy selling pressure.
However, extreme price movements can bring extreme volatility.
Before trusting any breakout or breakdown, watch:
• Trading Volume
• Open Interest (OI)
• Funding Rate
• Price Structure
🎯 THE BIG QUESTION: Is this momentum sustainable, or are we approaching a major reversal?
Which coin are you watching closely — $AGT, $KGEN or $INIT?
⚠️ Data snapshot: 12 November 2026. 24-hour Binance Futures ticker data; figures may change. Not financial advice.
#BinanceFutures #AltcoinAnalysis #CryptoMarket #tradingStrategy
ASHUTOSH PATI:
Perfect analysis! This is exactly the right framework. $AGT showing explosive momentum and $KGEN attracting attention - but $INIT -40.96% shows the other side, heavy selling pressure can wipe out anyone chasing blindly.
2
4
1.6k
Войдите, чтобы посмотреть больше материала
Присоединяйтесь к пользователям криптовалют по всему миру на Binance Square
⚡️ Получайте новейшую и полезную информацию о криптоактивах.
💬 Нам доверяет крупнейшая в мире криптобиржа.
👍 Получите достоверные аналитические данные от верифицированных создателей контента.
Эл. почта/номер телефона
В тренде
1
#NvidiaEarningsTonight:AIStocks’NextMove?
Просмотров: 83,567
1,058 обсуждают
2
#A Packed Week of Earnings and Data Tests Markets
Просмотров: 127,502
626 обсуждают
3
#AnthropicIPOTestsInvestorAppetiteForAI
Просмотров: 284,391
2,715 обсуждают
4
#NvidiaBoardNotConsideringHuang’sReturnasCEO
Просмотров: 91,204
848 обсуждают
5
#KOSPIFalls2.59%ToLowestCloseSinceFebruary
Просмотров: 18,857
236 обсуждают
6
#AnthropicClearedToListOnNasdaqAsANT
Просмотров: 19,464
207 обсуждают
7
#WhatInvestmentSignalsDo13FFilingsReveal?
Просмотров: 47,912
602 обсуждают
8
#TetherCapitalMakesStrategicInvestmentInStables
Просмотров: 8,561
79 обсуждают
9
#EvernorthRecords$505MImpairmentOnPreListingXRP
Просмотров: 1,400
19 обсуждают
10
#GoldmanSachsReports$1.22BInEtherETFHoldings
Просмотров: 1,076
16 обсуждают