
Nouha X
105 Публикации

Nouha X
Отправить жалобу
Заблокировать пользователя
Binance square content creator | 500k Pumpfun Gained.
5.8 г
26 подписок(и/а)
34 подписчиков(а)
39 понравилось
Посты
Все
Видео
·
--
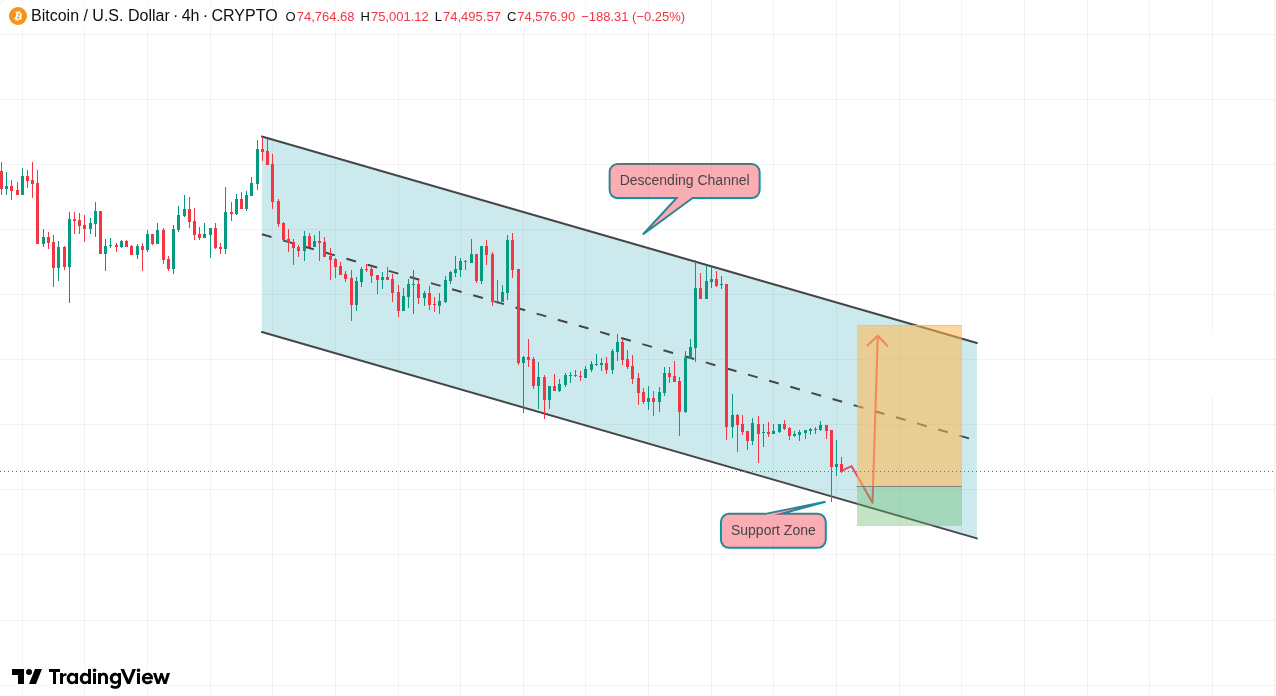
BTC is tracking inside a descending channel on the 4H chart, suggesting a broader correction.
Support is near $74,100 to $72,900, close to the lower boundary.
A bounce from there might see a recovery toward the middle or upper boundary near $79,000.
But a break below that support suggests more weakness is coming.
#MarketStructure
BTC is tracking inside a descending channel on the 4H chart, suggesting a broader correction.
Support is near $74,100 to $72,900, close to the lower boundary.
A bounce from there might see a recovery toward the middle or upper boundary near $79,000.
But a break below that support suggests more weakness is coming.
#MarketStructure
Support is near $74,100 to $72,900, close to the lower boundary.
A bounce from there might see a recovery toward the middle or upper boundary near $79,000.
But a break below that support suggests more weakness is coming.
#MarketStructure
66
·
--
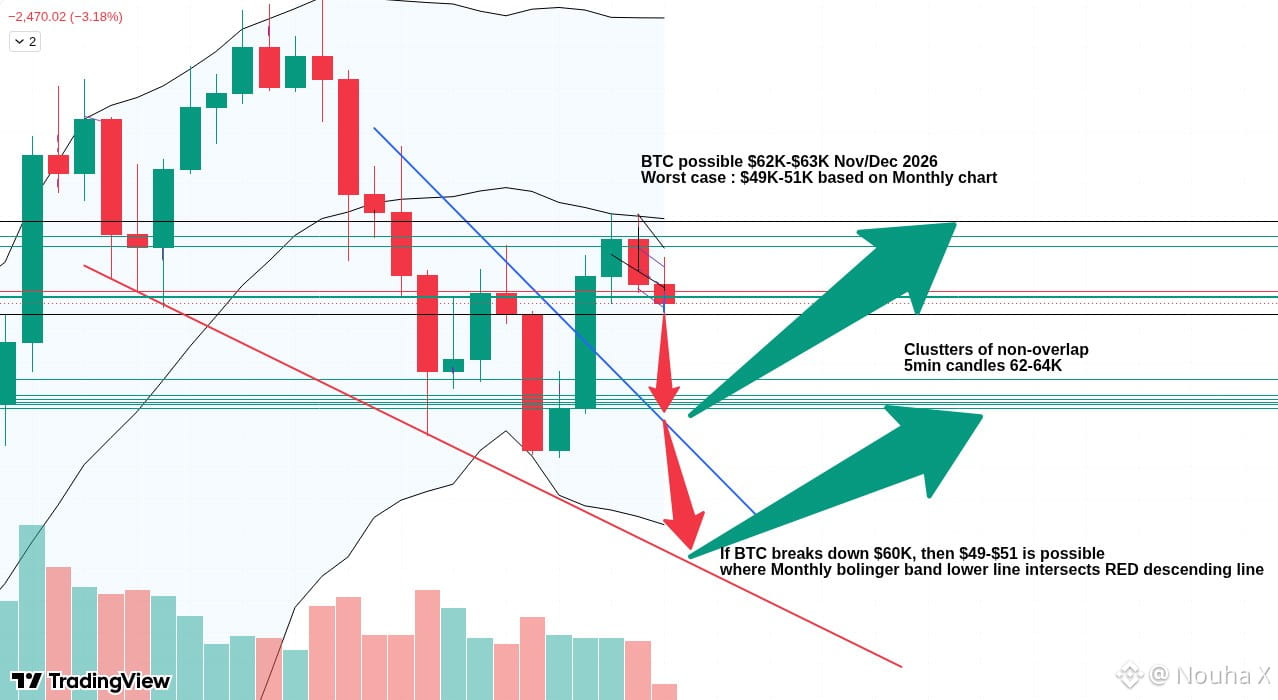
BTC might drop to the $61K–$62K range based on 5-minute candle clusters.
If it breaks 60K, the worst case is $49-$51K by Nov/Dec. That's where the monthly bolinger's lower line and RED descending line meet.
Historically, the bearish cycle bottoms in November, like 2018 and 2022.
#MarketCycle
BTC might drop to the $61K–$62K range based on 5-minute candle clusters.
If it breaks 60K, the worst case is $49-$51K by Nov/Dec. That's where the monthly bolinger's lower line and RED descending line meet.
Historically, the bearish cycle bottoms in November, like 2018 and 2022.
#MarketCycle
If it breaks 60K, the worst case is $49-$51K by Nov/Dec. That's where the monthly bolinger's lower line and RED descending line meet.
Historically, the bearish cycle bottoms in November, like 2018 and 2022.
#MarketCycle
76
·
--
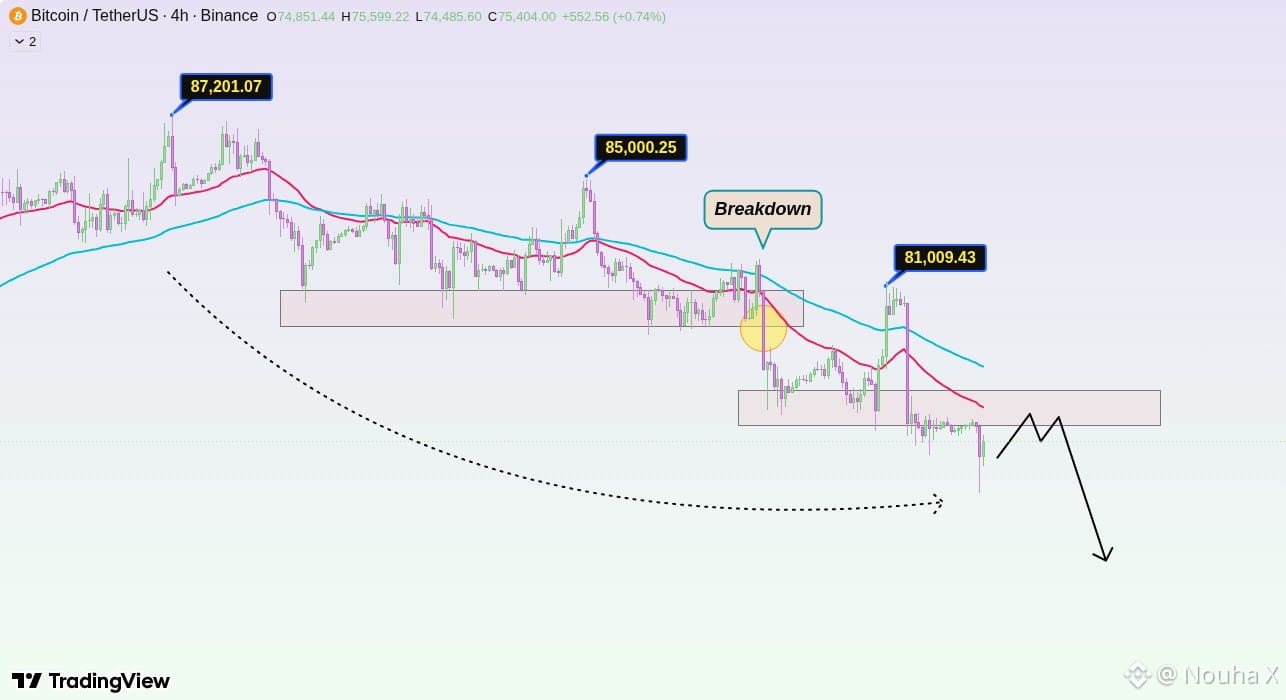
BTC is clearly losing support. We've seen lower highs at 87.2K, 85K, and 81K, with sellers stepping back in after each bounce. 📉
On the 4H chart, BTC dipped below the 76K–77.5K zone, which now looks like resistance.
It's still under both declining EMAs, suggesting this pause is probably just part of the downtrend, not a true recovery. #BitcoinTrend
BTC is clearly losing support. We've seen lower highs at 87.2K, 85K, and 81K, with sellers stepping back in after each bounce. 📉
On the 4H chart, BTC dipped below the 76K–77.5K zone, which now looks like resistance.
It's still under both declining EMAs, suggesting this pause is probably just part of the downtrend, not a true recovery. #BitcoinTrend
On the 4H chart, BTC dipped below the 76K–77.5K zone, which now looks like resistance.
It's still under both declining EMAs, suggesting this pause is probably just part of the downtrend, not a true recovery. #BitcoinTrend
93
·
--
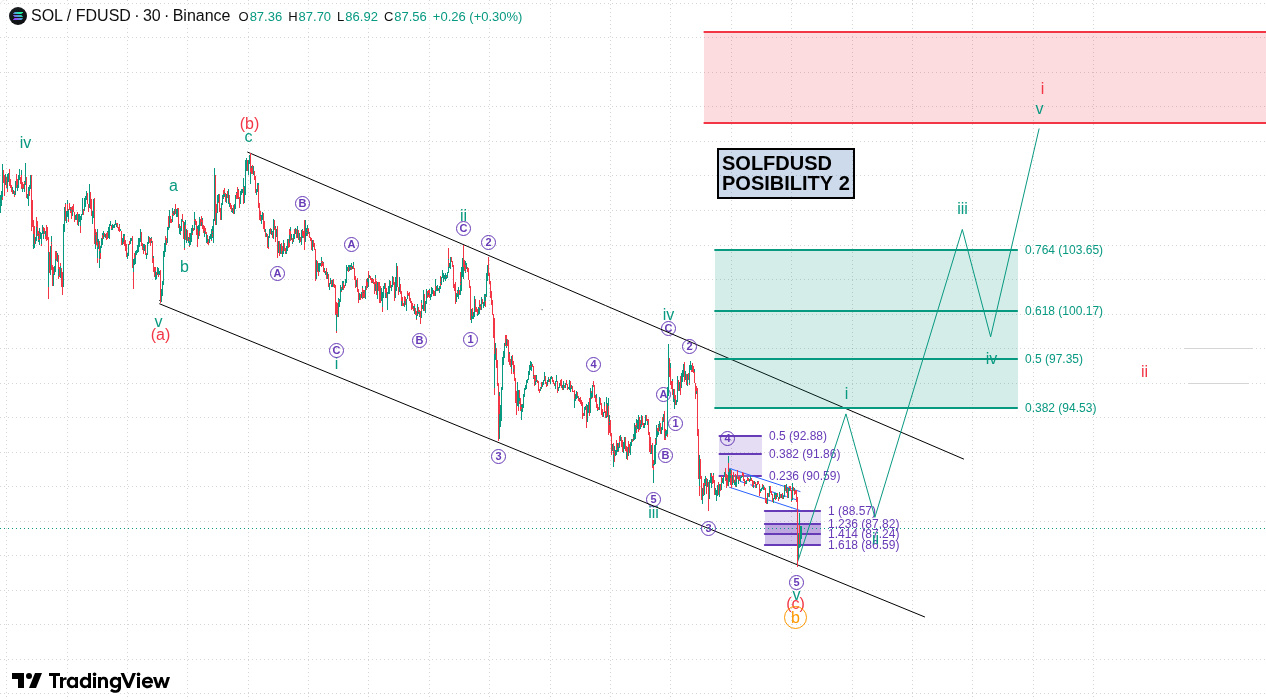
Seems like $SOL finished that liquidity sweep on the 30m-4h chart. 🧐
This deeper push into discount levels marks the completion of the corrective wave structure.
The shift is toward monitoring for a strong accumulation base now.
Seems like $SOL finished that liquidity sweep on the 30m-4h chart. 🧐
This deeper push into discount levels marks the completion of the corrective wave structure.
The shift is toward monitoring for a strong accumulation base now.
This deeper push into discount levels marks the completion of the corrective wave structure.
The shift is toward monitoring for a strong accumulation base now.
56
·
--
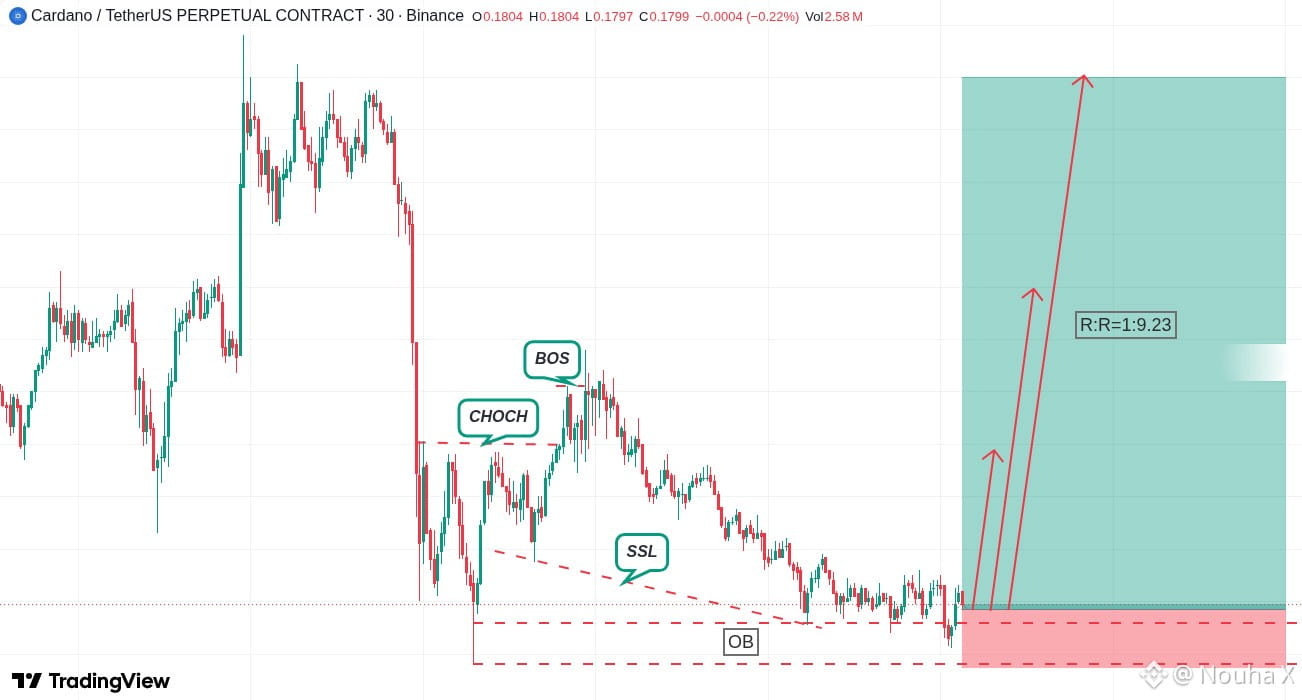
This ADA swing setup looks interesting for a long trade on the 30-minute chart 🧐
Entry near 0.1798 USDT with a hard stop at 0.1775 USDT.
The risk-reward is a solid 1 to 9.23. #SwingTrading
This ADA swing setup looks interesting for a long trade on the 30-minute chart 🧐
Entry near 0.1798 USDT with a hard stop at 0.1775 USDT.
The risk-reward is a solid 1 to 9.23. #SwingTrading
Entry near 0.1798 USDT with a hard stop at 0.1775 USDT.
The risk-reward is a solid 1 to 9.23. #SwingTrading
3
541
·
--
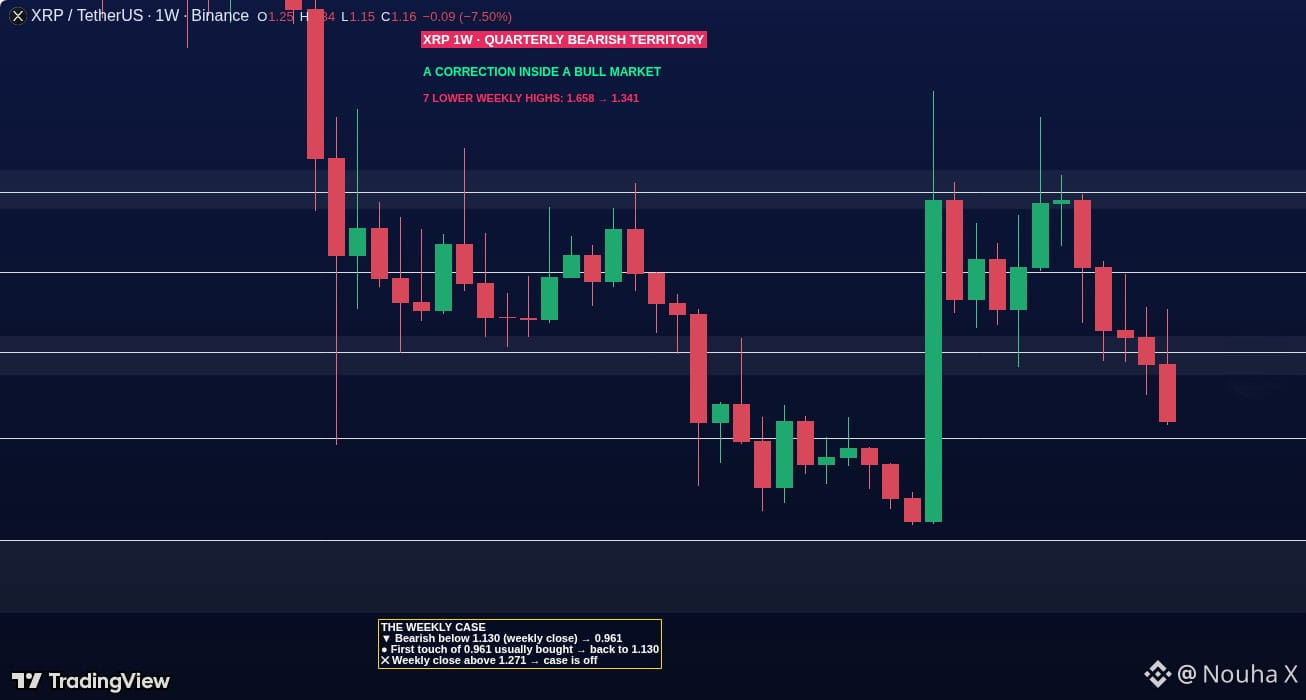
Seven lower highs on the weekly chart for $XRP... that's a correction right now. 📉
The line to watch is 1.13.
Last week closed under 1.271, heading deeper into quarterly bearish territory. #CryptoCorrection
Seven lower highs on the weekly chart for $XRP ... that's a correction right now. 📉
The line to watch is 1.13.
Last week closed under 1.271, heading deeper into quarterly bearish territory. #CryptoCorrection
The line to watch is 1.13.
Last week closed under 1.271, heading deeper into quarterly bearish territory. #CryptoCorrection
34
·
--
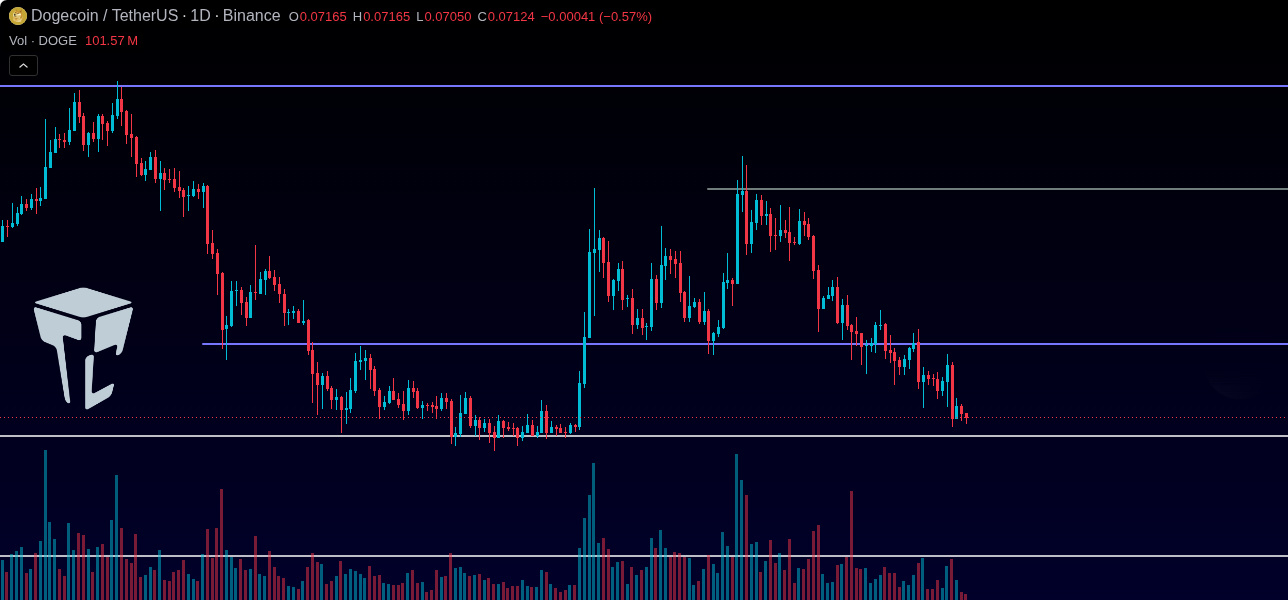
DOGE is under sustained bearish pressure right now. 📉
On the daily chart, it's in a long-term downtrend.
The price is getting close to the $0.06922 support zone. A confirmed break there is noted by TradeCityPro. $DOGE
DOGE is under sustained bearish pressure right now. 📉
On the daily chart, it's in a long-term downtrend.
The price is getting close to the $0.06922 support zone. A confirmed break there is noted by TradeCityPro. $DOGE
On the daily chart, it's in a long-term downtrend.
The price is getting close to the $0.06922 support zone. A confirmed break there is noted by TradeCityPro. $DOGE
87
·
--
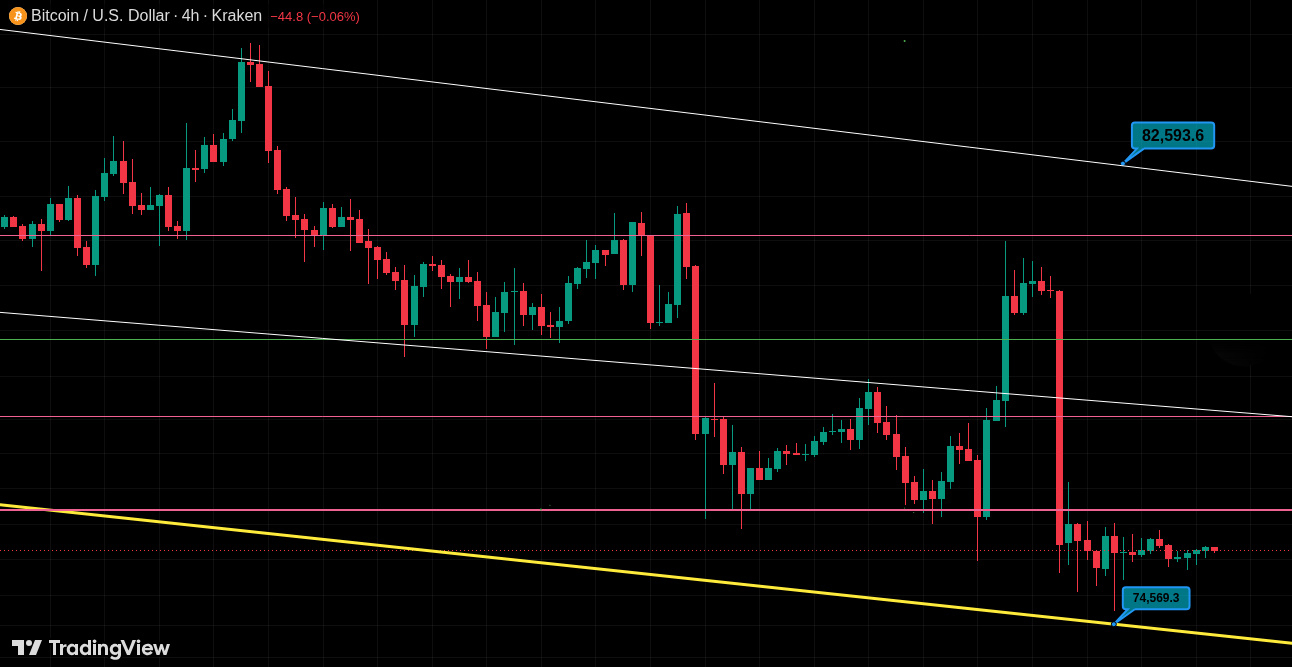
$BTC is consolidating near $75.8K on the 4H chart after that sharp rejection.
Buyers still haven't reclaimed resistance, so $76,485 is the first key level to watch.
The descending yellow support around $74.6K is moving lower, and losing it weakens the bounce setup.
Room for recovery exists, but sideways candles below resistance aren't confirmation.
#MarketConsolidation
$BTC is consolidating near $75.8K on the 4H chart after that sharp rejection.
Buyers still haven't reclaimed resistance, so $76,485 is the first key level to watch.
The descending yellow support around $74.6K is moving lower, and losing it weakens the bounce setup.
Room for recovery exists, but sideways candles below resistance aren't confirmation.
#MarketConsolidation
Buyers still haven't reclaimed resistance, so $76,485 is the first key level to watch.
The descending yellow support around $74.6K is moving lower, and losing it weakens the bounce setup.
Room for recovery exists, but sideways candles below resistance aren't confirmation.
#MarketConsolidation
122
·
--
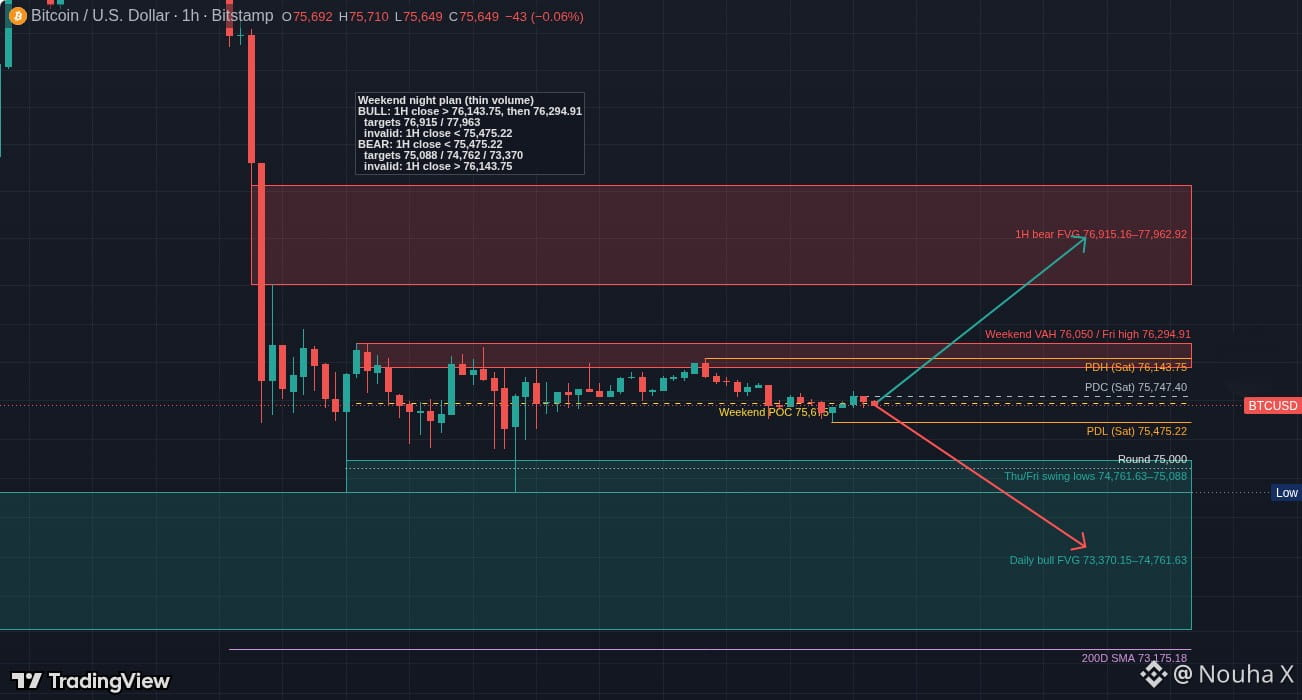
weekend drift around 75,650 in a tight range between 75,475 and 76,144 for $BTC
thin volume means an hourly close outside that range is needed to trust direction
daily structure is below the 50D SMA at 81,762 but above the 200D SMA at 73,175
weekend drift around 75,650 in a tight range between 75,475 and 76,144 for $BTC
thin volume means an hourly close outside that range is needed to trust direction
daily structure is below the 50D SMA at 81,762 but above the 200D SMA at 73,175
thin volume means an hourly close outside that range is needed to trust direction
daily structure is below the 50D SMA at 81,762 but above the 200D SMA at 73,175
94
·
--
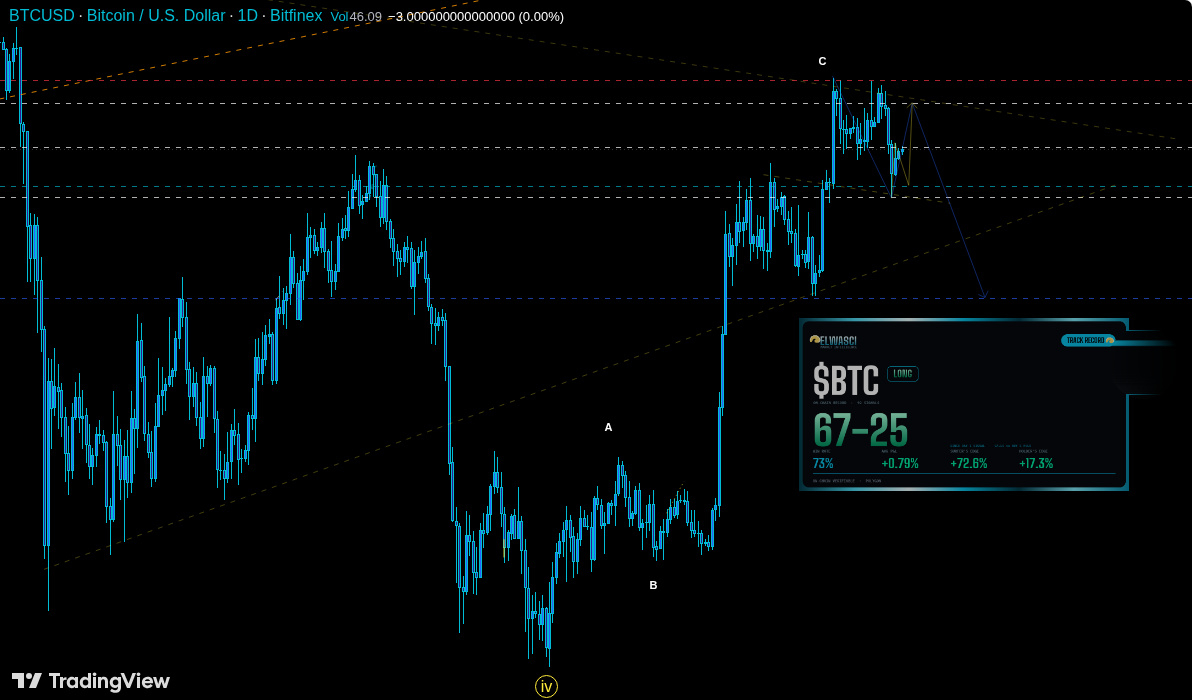
Looks like BearFriends think $BTC might dip to 75K eventually. 🐻
There's a pending drop toward $81K maybe in the next 72 hours, unless it clears the red horizontal near $87,262.
I've seen a simulated deviation of +72% tracking via immutable transactions compared to the +17% gains for current holders. #BTCshort
Looks like BearFriends think $BTC might dip to 75K eventually. 🐻
There's a pending drop toward $81K maybe in the next 72 hours, unless it clears the red horizontal near $87,262.
I've seen a simulated deviation of +72% tracking via immutable transactions compared to the +17% gains for current holders. #BTCshort
There's a pending drop toward $81K maybe in the next 72 hours, unless it clears the red horizontal near $87,262.
I've seen a simulated deviation of +72% tracking via immutable transactions compared to the +17% gains for current holders. #BTCshort
67
·
--
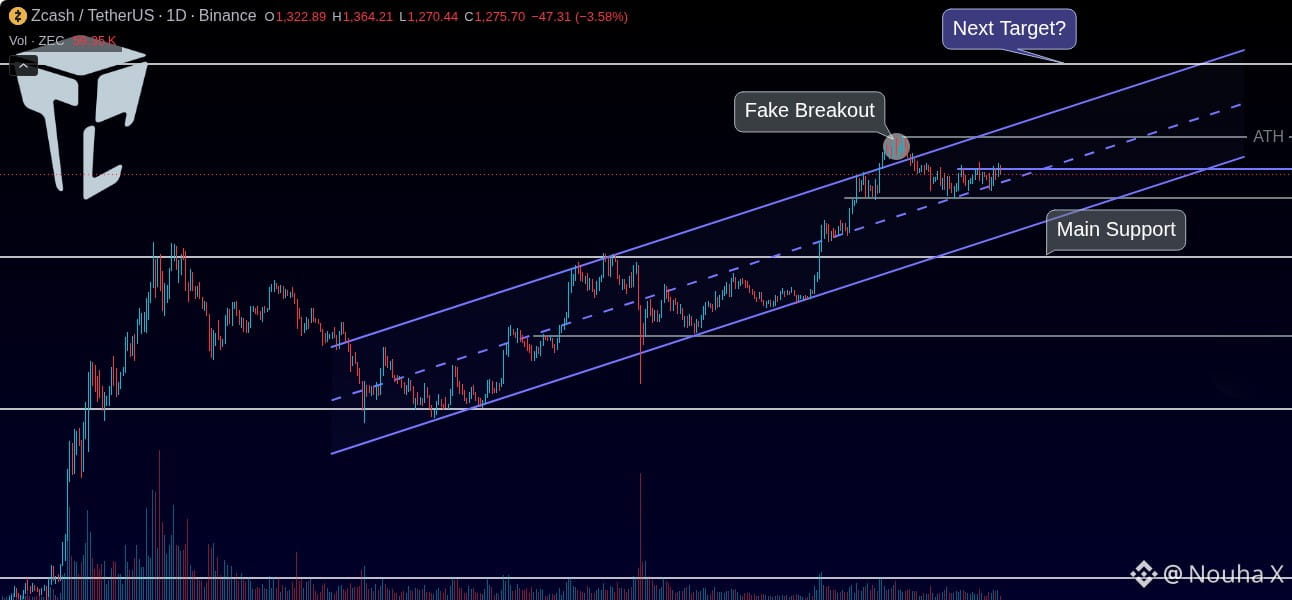
zcash $ZEC had that explosive rally through 2025, topping out near $670 after breaking $55.
it’s in a bullish structure, supported by the $204 range, with a higher low at $363 showing buying pressure. 🚀
#PrivacyCoins
zcash $ZEC had that explosive rally through 2025, topping out near $670 after breaking $55.
it’s in a bullish structure, supported by the $204 range, with a higher low at $363 showing buying pressure. 🚀
#PrivacyCoins
it’s in a bullish structure, supported by the $204 range, with a higher low at $363 showing buying pressure. 🚀
#PrivacyCoins
264
·
--
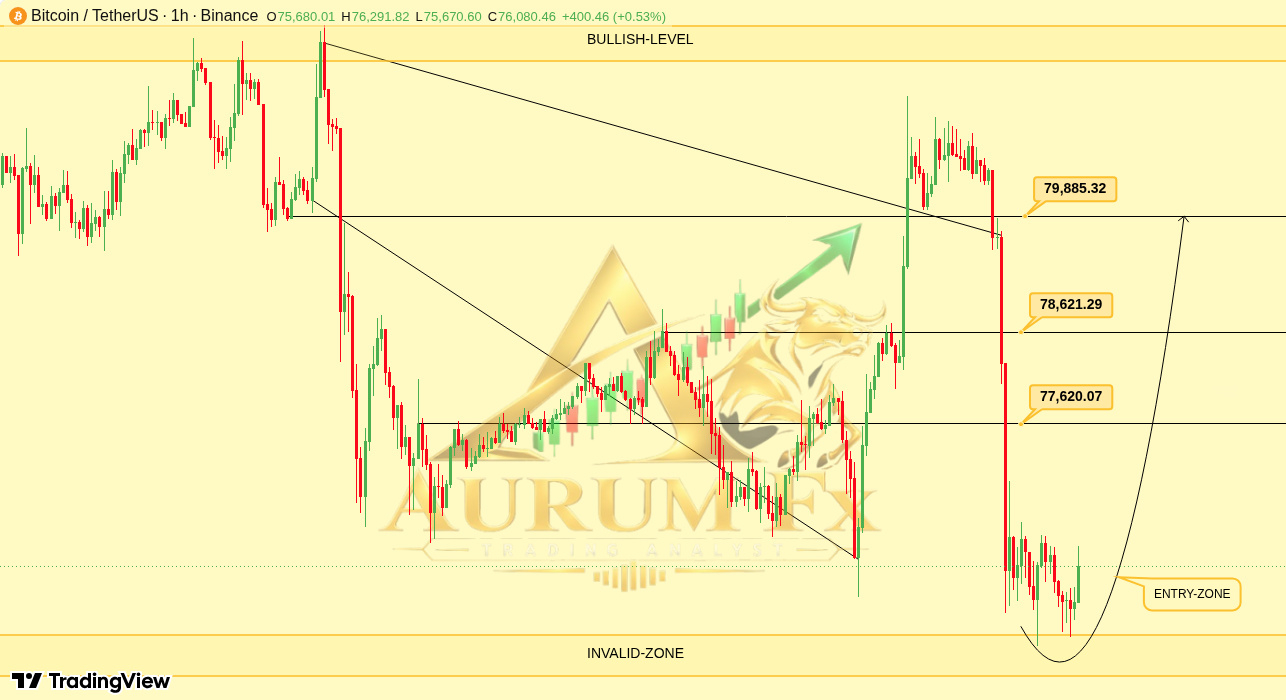
BTC is testing a key demand zone after an intraday selloff on the 1H chart.
If that support holds, we're looking for a gradual recovery.
Target 1 is $77,620, then $78,621, and finally $79,885. 🐂 #BitcoinRecovery
BTC is testing a key demand zone after an intraday selloff on the 1H chart.
If that support holds, we're looking for a gradual recovery.
Target 1 is $77,620, then $78,621, and finally $79,885. 🐂 #BitcoinRecovery
If that support holds, we're looking for a gradual recovery.
Target 1 is $77,620, then $78,621, and finally $79,885. 🐂 #BitcoinRecovery
88
·
--
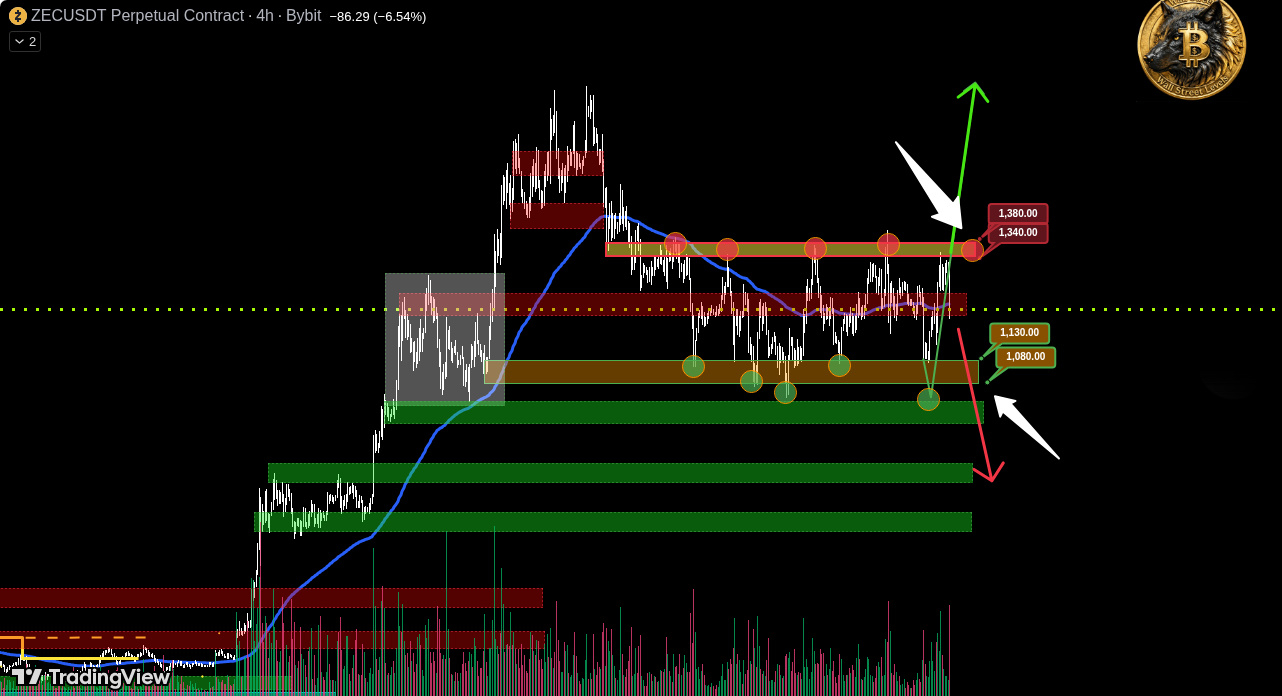
$ZEC tapped the $1340-$1380 zone on BYBIT:ZECUSDT.P but failed to reclaim it, so the price dropped.
IMA showed zero capital inflow during that breakout attempt.
Now we're waiting for a move down to the lower range boundary of $1080-$1130.
A break and hold above $1380 would cancel the short scenario.
$ZEC tapped the $1340-$1380 zone on BYBIT:ZECUSDT.P but failed to reclaim it, so the price dropped.
IMA showed zero capital inflow during that breakout attempt.
Now we're waiting for a move down to the lower range boundary of $1080-$1130.
A break and hold above $1380 would cancel the short scenario.
IMA showed zero capital inflow during that breakout attempt.
Now we're waiting for a move down to the lower range boundary of $1080-$1130.
A break and hold above $1380 would cancel the short scenario.
416
·
--
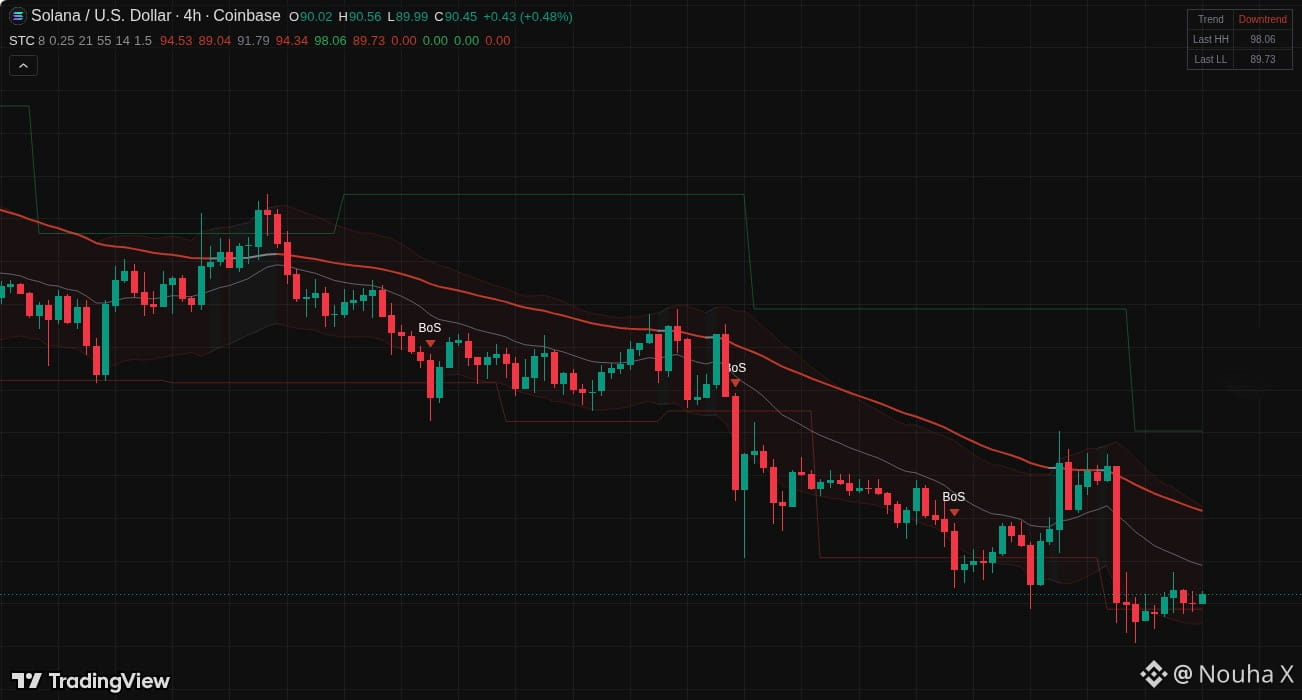
SOL is trading at 90.65 on the 4H, with a down trend bias. 📉
It's pinned in the lower half of the volatility band, below both EMA21 at 91.92 and EMA55 at 94.48.
The last swing low at 89.86 remains open under the current price. $SOL
SOL is trading at 90.65 on the 4H, with a down trend bias. 📉
It's pinned in the lower half of the volatility band, below both EMA21 at 91.92 and EMA55 at 94.48.
The last swing low at 89.86 remains open under the current price. $SOL
It's pinned in the lower half of the volatility band, below both EMA21 at 91.92 and EMA55 at 94.48.
The last swing low at 89.86 remains open under the current price. $SOL
164
·
--
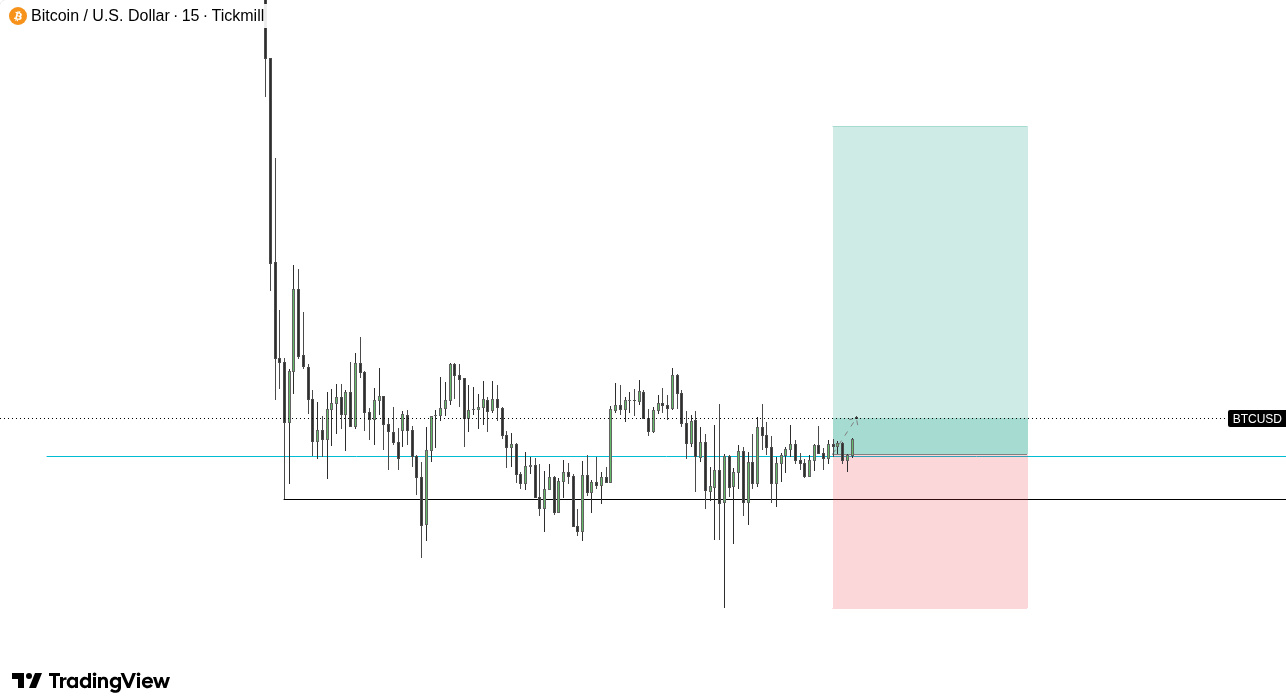
$BTC swept below the 75,450.50 low then reclaimed it on the 15m chart. Now consolidating near 75,700–75,800. A long entry around 75,729 has a stop at 74,763. If $BTC decisively breaks above 76,000, heading toward 77,781.66 could happen. 🤔 #CryptoAnalysis
$BTC swept below the 75,450.50 low then reclaimed it on the 15m chart. Now consolidating near 75,700–75,800. A long entry around 75,729 has a stop at 74,763. If $BTC decisively breaks above 76,000, heading toward 77,781.66 could happen. 🤔 #CryptoAnalysis
63
·
--
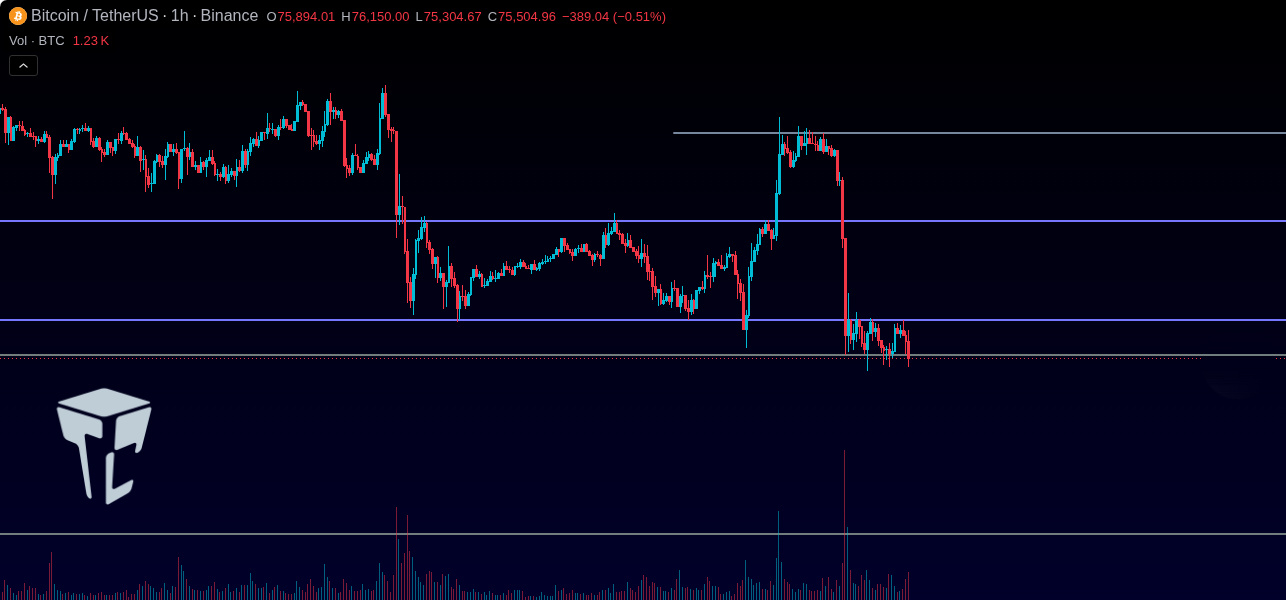
BTC $BTC is in a critical support zone after yesterday's sell-off. ⌛️ On the 1-hour chart, $BTC is consolidating tight between $75,568 and $76,385. A break below $75,568 acts as a bearish trigger. Opportunities exist on a breakout, but risk profiles differ. #CryptoAnalysis 🧐
BTC $BTC is in a critical support zone after yesterday's sell-off. ⌛️ On the 1-hour chart, $BTC is consolidating tight between $75,568 and $76,385. A break below $75,568 acts as a bearish trigger. Opportunities exist on a breakout, but risk profiles differ. #CryptoAnalysis 🧐
47
·
--
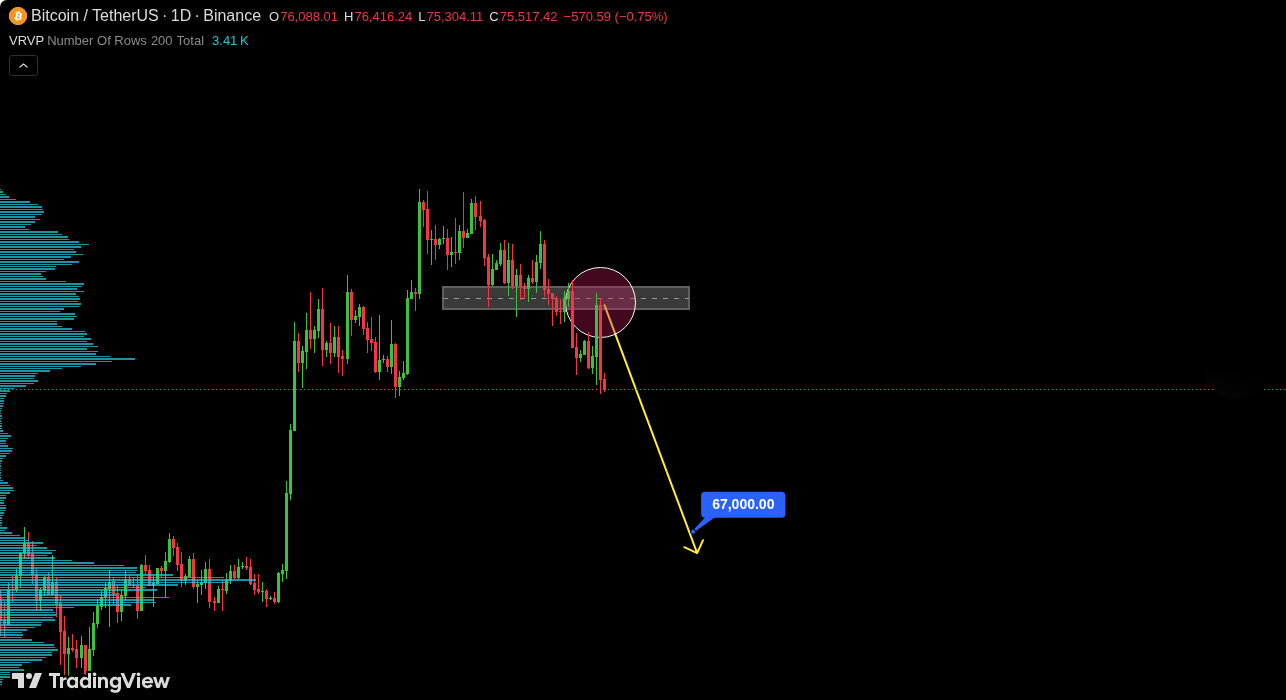
BTCUSDT is struggling on the daily chart. That recent rebound failed to hold at the former support zone, showing sellers are still in control. The lower highs confirm the bearish structure, and Bitcoin $BTC lost its recovery momentum fast. 📉 $BTC
BTCUSDT is struggling on the daily chart. That recent rebound failed to hold at the former support zone, showing sellers are still in control. The lower highs confirm the bearish structure, and Bitcoin $BTC lost its recovery momentum fast. 📉 $BTC
58
·
--
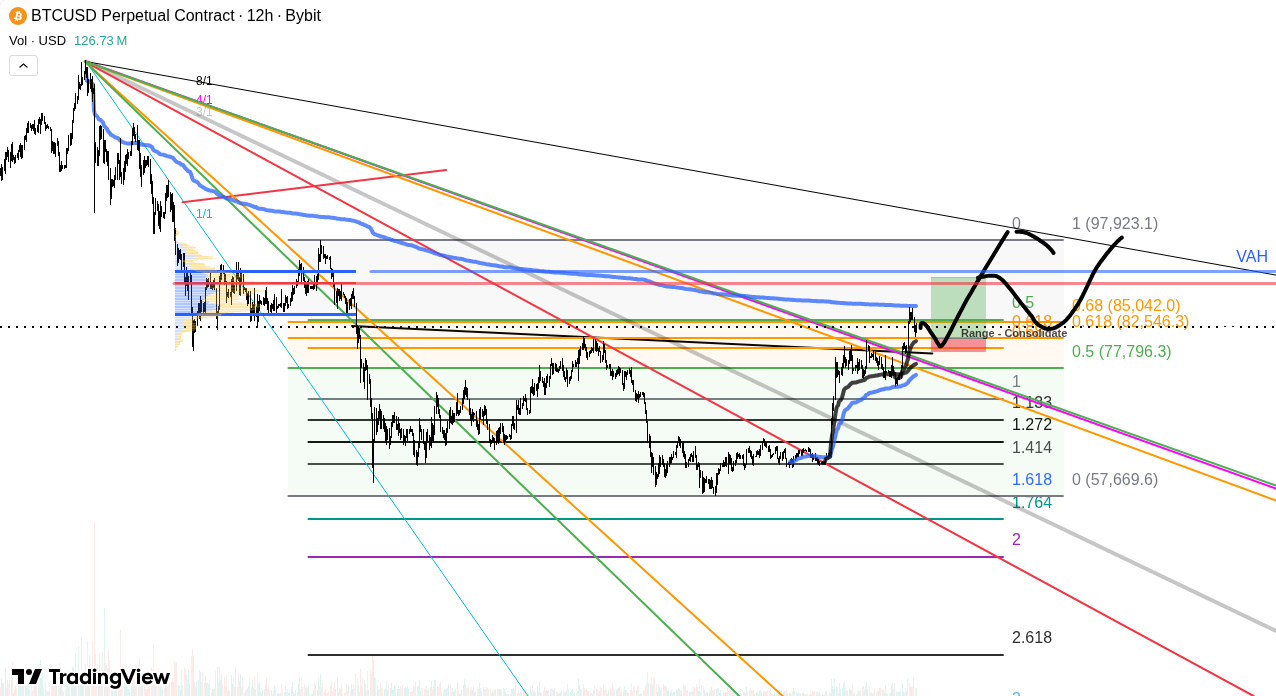
BTC $BTC seems to have strong resistance near the Avwap and POC based on the daily look at 25.09.26 🤔. While a mild ABC zigzag is the current setup, BTC $BTC has ranged under that resistance before, which might propel strength. A correction isn't heavily expected, but it's possible. #CryptoTrading $BTC
BTC $BTC seems to have strong resistance near the Avwap and POC based on the daily look at 25.09.26 🤔. While a mild ABC zigzag is the current setup, BTC $BTC has ranged under that resistance before, which might propel strength. A correction isn't heavily expected, but it's possible. #CryptoTrading $BTC
77
·
--
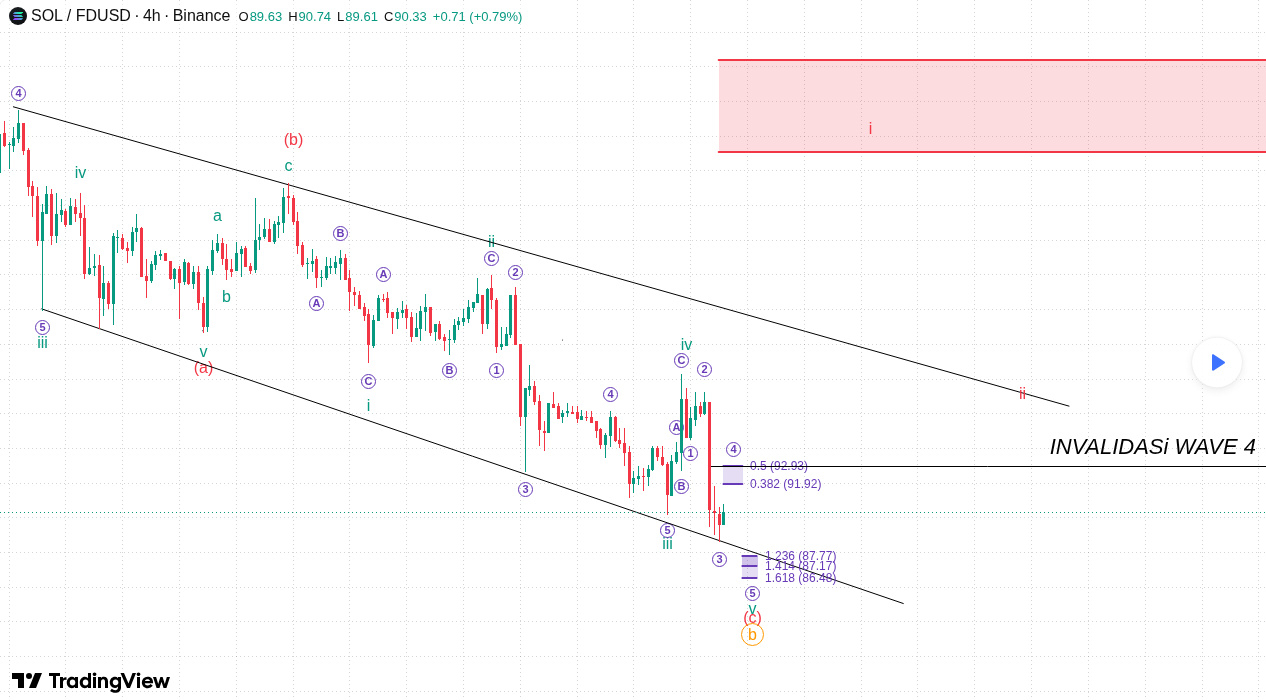
Looking at the SOL $SOL / FDUSD chart, we've got a dual possibility macro update inside that corrective descending channel 🧐. Scenario 1 suggests the Green Wave 5 and the bigger purple ABC correction are done at the lower trendline, which could signal a bullish reversal. But then there's Scenario 2, where $SOL is still navigating purple Wave 4 and one final low is pending. We need to watch that action closely. #CryptoTrading 📈
Looking at the SOL $SOL / FDUSD chart, we've got a dual possibility macro update inside that corrective descending channel 🧐. Scenario 1 suggests the Green Wave 5 and the bigger purple ABC correction are done at the lower trendline, which could signal a bullish reversal. But then there's Scenario 2, where $SOL is still navigating purple Wave 4 and one final low is pending. We need to watch that action closely. #CryptoTrading 📈
96
·
--
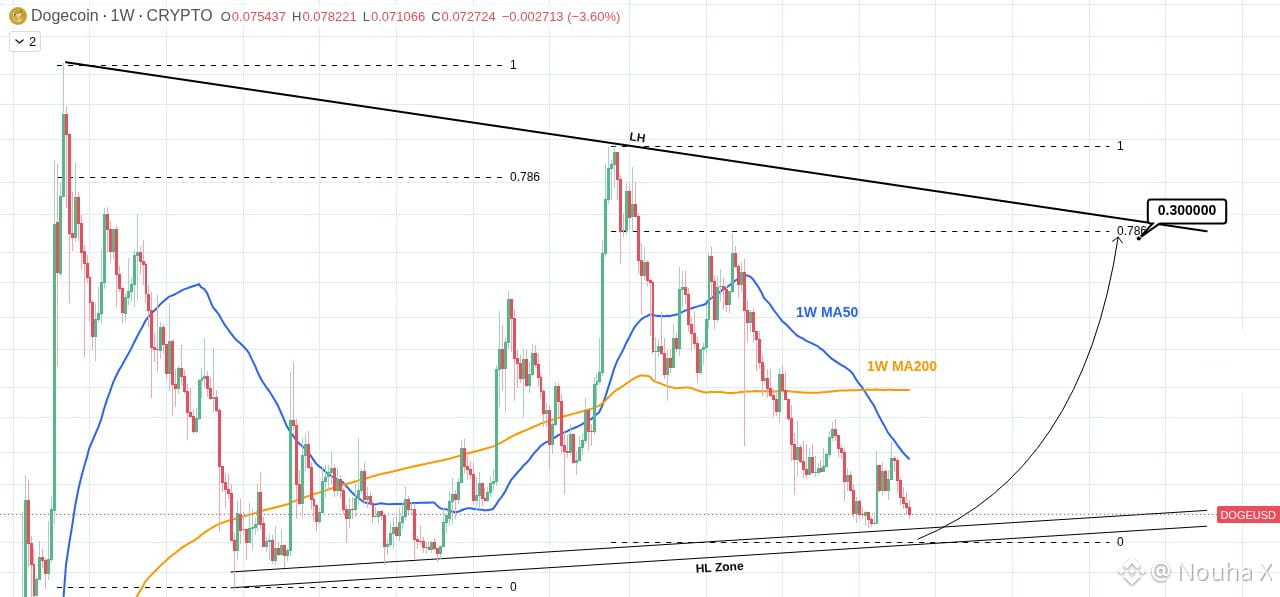
Bitcoin $BTC gave back the whole post-election pop today, selling off with tech, and tonight it dipped under the Nov 3 low before bouncing. It's back near 75,800, and 74,913 is the level I care about most. The rally from 75,618 to 81,105 fully reversed, with $BTC dropping from about 80,300 to 75,463 in roughly four hours this morning. Reports put liquidations at about $1.09 billion, so a lot of this looks like leverage getting flushed. On the Daily chart, we see lower highs at 85,591, 84,843, 81,888 and 81,105, and the price is below the 50-day near 81,990 but above the 200-day near 73,180. For the 1H timeframe, tonight's low was 75,088, and the gaps left above are still open. The bull case depends on $BTC holding 74,913 and closing a 1H candle above 76,915, targeting 77,963, then 79,472; this is invalidated by a 1H close below 74,913. Conversely, the bear case suggests $BTC stays under 76,915 and closes a 1H candle below 74,913, targeting 73,180; this is invalidated by a 1H close above 76,915. #CryptoAnalysis
Bitcoin $BTC gave back the whole post-election pop today, selling off with tech, and tonight it dipped under the Nov 3 low before bouncing. It's back near 75,800, and 74,913 is the level I care about most. The rally from 75,618 to 81,105 fully reversed, with $BTC dropping from about 80,300 to 75,463 in roughly four hours this morning. Reports put liquidations at about $1.09 billion, so a lot of this looks like leverage getting flushed. On the Daily chart, we see lower highs at 85,591, 84,843, 81,888 and 81,105, and the price is below the 50-day near 81,990 but above the 200-day near 73,180. For the 1H timeframe, tonight's low was 75,088, and the gaps left above are still open. The bull case depends on $BTC holding 74,913 and closing a 1H candle above 76,915, targeting 77,963, then 79,472; this is invalidated by a 1H close below 74,913. Conversely, the bear case suggests $BTC stays under 76,915 and closes a 1H candle below 74,913, targeting 73,180; this is invalidated by a 1H close above 76,915. #CryptoAnalysis
1
244
Войдите, чтобы посмотреть больше материала
Присоединяйтесь к пользователям криптовалют по всему миру на Binance Square
⚡️ Получайте новейшую и полезную информацию о криптоактивах.
💬 Нам доверяет крупнейшая в мире криптобиржа.
👍 Получите достоверные аналитические данные от верифицированных создателей контента.
Эл. почта/номер телефона