
#usjulyppiflat
usjulyppiflat
Просмотров: 76,755
622 обсуждают
Популярные
Новые

#USJulyPPIFlat Writing
#USJulyPPIFlat 🇺🇸📊
U.S. Producer Price Index (PPI) remained unchanged in July, coming in below expectations and signaling that wholesale inflation pressures may be easing. Goods prices declined while service costs saw a modest increase. Markets are now watching closely for clues on the Federal Reserve’s next move.
🔹 July PPI: 0.0% MoM
🔹 Expected: +0.2%
🔹 Annual PPI: 4.7% (down from 5.5%)
🔹 Lower inflation pressure could support a pause in rate hikes.
Will softer inflation fuel the next market rally? 📈
#pp I #Inflation #FederalReserve #USEconomy #Crypto #Bitcoin #stocks
#USJulyPPIFlat Writing
#USJulyPPIFlat 🇺🇸📊
U.S. Producer Price Index (PPI) remained unchanged in July, coming in below expectations and signaling that wholesale inflation pressures may be easing. Goods prices declined while service costs saw a modest increase. Markets are now watching closely for clues on the Federal Reserve’s next move.
🔹 July PPI: 0.0% MoM
🔹 Expected: +0.2%
🔹 Annual PPI: 4.7% (down from 5.5%)
🔹 Lower inflation pressure could support a pause in rate hikes.
Will softer inflation fuel the next market rally? 📈
#pp I #Inflation #FederalReserve #USEconomy #Crypto #Bitcoin #stocks
#USJulyPPIFlat 🇺🇸📊
U.S. Producer Price Index (PPI) remained unchanged in July, coming in below expectations and signaling that wholesale inflation pressures may be easing. Goods prices declined while service costs saw a modest increase. Markets are now watching closely for clues on the Federal Reserve’s next move.
🔹 July PPI: 0.0% MoM
🔹 Expected: +0.2%
🔹 Annual PPI: 4.7% (down from 5.5%)
🔹 Lower inflation pressure could support a pause in rate hikes.
Will softer inflation fuel the next market rally? 📈
#pp I #Inflation #FederalReserve #USEconomy #Crypto #Bitcoin #stocks
59

El PPI de julio en EE.UU. salió plano (0.0%), justo en consenso, después de que la semana pasada el CPI mostrara desaceleración. Dato clave porque el PPI mide inflación a nivel productor: si los costos de insumos no suben, las empresas no trasladan presión a precios finales, y la Fed tiene menos excusas para mantener tasas altas.
En cripto, esto importa porque **riesgo-on vive de tasas bajas**. Un PPI plano sumado al CPI suave de la semana pasada refuerza el escenario de recorte en septiembre. Los futuros de Fed Funds ya pricean ~70% de probabilidad de -25 pb.
Pero ojo: el mercado ya descontó esto. BTC está en 63.1K, lateral desde hace días, con sesgo bajista en 4H y 1H pero alcista en mensual. El Fear Index subió apenas dos puntos, a 29, sigue en Fear. Si el recorte llega y el precio no reacciona, es señal de que la liquidez no está fluyendo hacia cripto todavía.
**Lo que importa ahora no es la macro, es la estructura interna**: BTC barrió liquidez bajo 63.2K (mínimo diario previo) y rebotó, pero no recuperó máximos. Eso es debilidad relativa. Un PPI plano no cambia la falta de volumen comprador por encima de 64K.
¿Creés que el recorte de septiembre va a detonar un rally o ya está todo pricado? ¿Qué nivel mirás para confirmar giro alcista en BTC?
#USJulyPPIFlat
El PPI de julio en EE.UU. salió plano (0.0%), justo en consenso, después de que la semana pasada el CPI mostrara desaceleración. Dato clave porque el PPI mide inflación a nivel productor: si los costos de insumos no suben, las empresas no trasladan presión a precios finales, y la Fed tiene menos excusas para mantener tasas altas.
En cripto, esto importa porque **riesgo-on vive de tasas bajas**. Un PPI plano sumado al CPI suave de la semana pasada refuerza el escenario de recorte en septiembre. Los futuros de Fed Funds ya pricean ~70% de probabilidad de -25 pb.
Pero ojo: el mercado ya descontó esto. BTC está en 63.1K, lateral desde hace días, con sesgo bajista en 4H y 1H pero alcista en mensual. El Fear Index subió apenas dos puntos, a 29, sigue en Fear. Si el recorte llega y el precio no reacciona, es señal de que la liquidez no está fluyendo hacia cripto todavía.
**Lo que importa ahora no es la macro, es la estructura interna**: BTC barrió liquidez bajo 63.2K (mínimo diario previo) y rebotó, pero no recuperó máximos. Eso es debilidad relativa. Un PPI plano no cambia la falta de volumen comprador por encima de 64K.
¿Creés que el recorte de septiembre va a detonar un rally o ya está todo pricado? ¿Qué nivel mirás para confirmar giro alcista en BTC?
#USJulyPPIFlat
En cripto, esto importa porque **riesgo-on vive de tasas bajas**. Un PPI plano sumado al CPI suave de la semana pasada refuerza el escenario de recorte en septiembre. Los futuros de Fed Funds ya pricean ~70% de probabilidad de -25 pb.
Pero ojo: el mercado ya descontó esto. BTC está en 63.1K, lateral desde hace días, con sesgo bajista en 4H y 1H pero alcista en mensual. El Fear Index subió apenas dos puntos, a 29, sigue en Fear. Si el recorte llega y el precio no reacciona, es señal de que la liquidez no está fluyendo hacia cripto todavía.
**Lo que importa ahora no es la macro, es la estructura interna**: BTC barrió liquidez bajo 63.2K (mínimo diario previo) y rebotó, pero no recuperó máximos. Eso es debilidad relativa. Un PPI plano no cambia la falta de volumen comprador por encima de 64K.
¿Creés que el recorte de septiembre va a detonar un rally o ya está todo pricado? ¿Qué nivel mirás para confirmar giro alcista en BTC?
#USJulyPPIFlat
109

📈🔎 The Annual PPI Number Stands Out
A flat monthly PPI doesn't mean producer prices stopped rising.
The July final-demand index was unchanged month-over-month, but it was 4.7% above July 2025.
That contrast between the monthly and annual readings gives investors a more complete picture of price pressures.
For $BTC and $ETH spot investors, macro data remains an important part of market analysis.
#usjulyppiflat
📈🔎 The Annual PPI Number Stands Out
A flat monthly PPI doesn't mean producer prices stopped rising.
The July final-demand index was unchanged month-over-month, but it was 4.7% above July 2025.
That contrast between the monthly and annual readings gives investors a more complete picture of price pressures.
For $BTC and $ETH spot investors, macro data remains an important part of market analysis.
#usjulyppiflat
A flat monthly PPI doesn't mean producer prices stopped rising.
The July final-demand index was unchanged month-over-month, but it was 4.7% above July 2025.
That contrast between the monthly and annual readings gives investors a more complete picture of price pressures.
For $BTC and $ETH spot investors, macro data remains an important part of market analysis.
#usjulyppiflat
1
147

·
--
Проверено
🎯 PPI dropped YoY (5.5% to 4.7%) & MoM flattened at 0.0%! Good news, right? But #BTC shrugged and dipped below $63k anyway. Classical Bitcoin logic: good macro = "let's dip." 📉
🔮 My crystal ball says we pump to $65k today. What’s your take? Bull trap or moon bound? 🚀
💡 What to do? Keep calm, manage risk, and don't fight the chart.
⚠️ DYOR. Not financial advice.
🔥 New to Binance? Join the ride using code VINHTOCDO or link: [https://www.binance.com/register?ref=VINHTOCDO](https://www.binance.com/register?ref=VINHTOCDO)
#Bitcoin #USJulyPPIFlat #USJulyCPI&PPIDueThisWeek #BitcoinForecast #VINHTOCDO
$BTC
{future}(BTCUSDT)
$ETH
{future}(ETHUSDT)
$BNB
{future}(BNBUSDT)
🎯 PPI dropped YoY (5.5% to 4.7%) & MoM flattened at 0.0%! Good news, right? But #BTC shrugged and dipped below $63k anyway. Classical Bitcoin logic: good macro = "let's dip." 📉
🔮 My crystal ball says we pump to $65k today. What’s your take? Bull trap or moon bound? 🚀
💡 What to do? Keep calm, manage risk, and don't fight the chart.
⚠️ DYOR. Not financial advice.
🔥 New to Binance? Join the ride using code VINHTOCDO or link: https://www.binance.com/register?ref=VINHTOCDO
#Bitcoin #USJulyPPIFlat #USJulyCPI&PPIDueThisWeek #BitcoinForecast #VINHTOCDO
$BTC
$ETH
$BNB
🔮 My crystal ball says we pump to $65k today. What’s your take? Bull trap or moon bound? 🚀
💡 What to do? Keep calm, manage risk, and don't fight the chart.
⚠️ DYOR. Not financial advice.
🔥 New to Binance? Join the ride using code VINHTOCDO or link: https://www.binance.com/register?ref=VINHTOCDO
#Bitcoin #USJulyPPIFlat #USJulyCPI&PPIDueThisWeek #BitcoinForecast #VINHTOCDO
$BTC
$ETH
$BNB
BTC break $65.000
54%
BTC break $64.000
15%
BTC down $63.000
31%
13 проголосовали • Голосование закрыто
1
1
285

·
--
Рост
Проверено
🇺🇸 US July PPI: Inflation Pressure Eases
جاء مؤشر أسعار المنتجين الأمريكي PPI لشهر يوليو دون تغيير عند 0.0% شهريًا، مقابل توقعات بارتفاع 0.2%. كما تباطأ المعدل السنوي إلى 4.7% من 5.5% في يونيو.
البيانات تعطي الأسواق إشارة إيجابية بأن ضغوط التضخم على مستوى المنتجين بدأت تهدأ، خصوصًا مع تراجع أسعار السلع والطاقة، بينما ارتفعت أسعار الخدمات 0.2%.
لماذا يهم السوق؟
قراءة PPI الأضعف من المتوقع قد تخفف الضغوط على الفيدرالي وتدعم رهانات أكثر مرونة بشأن السياسة النقدية، وهو ما قد يكون إيجابيًا للأصول عالية المخاطر مثل Bitcoin وCrypto.
لكن الصورة ليست مثالية؛ فالتضخم الأساسي لا يزال مرتفعًا، لذلك ستبقى الأسواق تراقب بيانات PCE القادمة بحثًا عن تأكيد لمسار التضخم.
الخلاصة:
PPI يعطي السوق جرعة من التفاؤل، لكن المعركة ضد التضخم لم تنتهِ بعد.
{future}(QQQUSDT)
{future}(NVDAUSDT)
{future}(MSFTUSDT)
#USJulyPPIFlat
🇺🇸 US July PPI: Inflation Pressure Eases
جاء مؤشر أسعار المنتجين الأمريكي PPI لشهر يوليو دون تغيير عند 0.0% شهريًا، مقابل توقعات بارتفاع 0.2%. كما تباطأ المعدل السنوي إلى 4.7% من 5.5% في يونيو.
البيانات تعطي الأسواق إشارة إيجابية بأن ضغوط التضخم على مستوى المنتجين بدأت تهدأ، خصوصًا مع تراجع أسعار السلع والطاقة، بينما ارتفعت أسعار الخدمات 0.2%.
لماذا يهم السوق؟
قراءة PPI الأضعف من المتوقع قد تخفف الضغوط على الفيدرالي وتدعم رهانات أكثر مرونة بشأن السياسة النقدية، وهو ما قد يكون إيجابيًا للأصول عالية المخاطر مثل Bitcoin وCrypto.
لكن الصورة ليست مثالية؛ فالتضخم الأساسي لا يزال مرتفعًا، لذلك ستبقى الأسواق تراقب بيانات PCE القادمة بحثًا عن تأكيد لمسار التضخم.
الخلاصة:
PPI يعطي السوق جرعة من التفاؤل، لكن المعركة ضد التضخم لم تنتهِ بعد.
#USJulyPPIFlat
جاء مؤشر أسعار المنتجين الأمريكي PPI لشهر يوليو دون تغيير عند 0.0% شهريًا، مقابل توقعات بارتفاع 0.2%. كما تباطأ المعدل السنوي إلى 4.7% من 5.5% في يونيو.
البيانات تعطي الأسواق إشارة إيجابية بأن ضغوط التضخم على مستوى المنتجين بدأت تهدأ، خصوصًا مع تراجع أسعار السلع والطاقة، بينما ارتفعت أسعار الخدمات 0.2%.
لماذا يهم السوق؟
قراءة PPI الأضعف من المتوقع قد تخفف الضغوط على الفيدرالي وتدعم رهانات أكثر مرونة بشأن السياسة النقدية، وهو ما قد يكون إيجابيًا للأصول عالية المخاطر مثل Bitcoin وCrypto.
لكن الصورة ليست مثالية؛ فالتضخم الأساسي لا يزال مرتفعًا، لذلك ستبقى الأسواق تراقب بيانات PCE القادمة بحثًا عن تأكيد لمسار التضخم.
الخلاصة:
PPI يعطي السوق جرعة من التفاؤل، لكن المعركة ضد التضخم لم تنتهِ بعد.
#USJulyPPIFlat
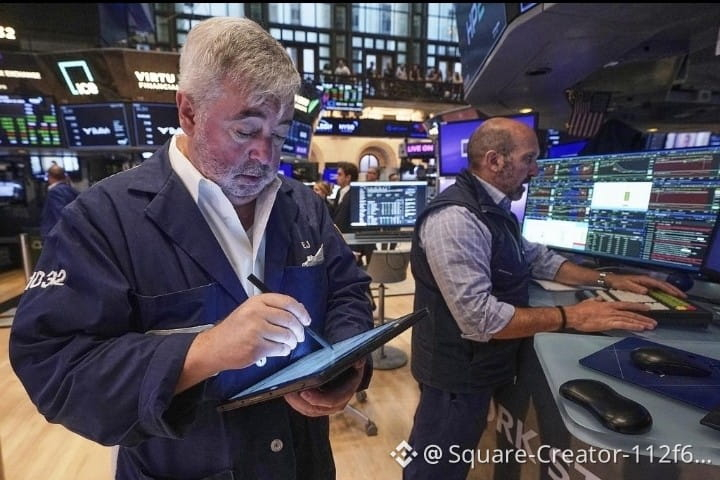
3
964

·
--
#usjulyppiflat 🇺🇸
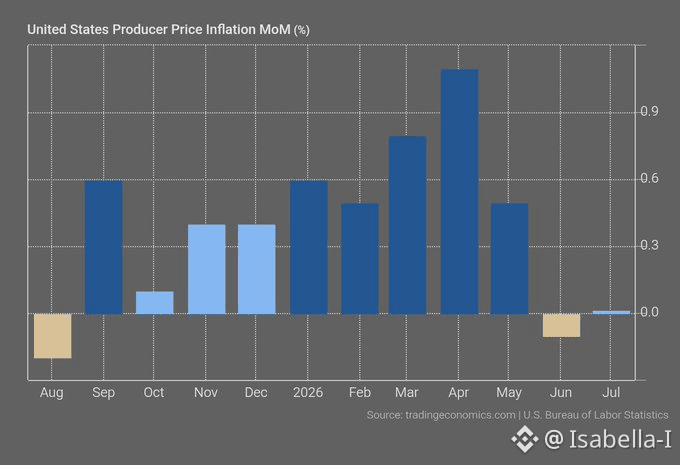
US Producer Prices (July
2026):
•
PPI
MoM: 0.0% (vs +0.2% exp, prior -0.1%)
•
PPI
YoY: 4.7% (vs 4.9% exp, prior 5.5%)
• Core
PPI
MoM: +0.2% (vs +0.3% exp)
• Core
PPI
YoY: 4.2% (in line with exp)
👉
Breakdown:
📈
Goods fell 0.7%, driven by a 3.1% decline in energy (gasoline -5.7%) and lower food prices (-0.9%).
Services rose 0.2%, anchored by portfolio management costs (+6.5%), while transportation & warehousing dipped 1.8%.
👉
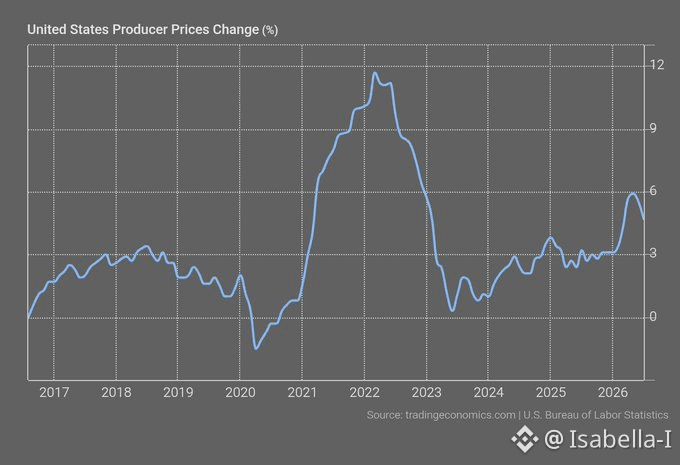
The annual rate slows to its lowest level since March, reflecting easing upstream price pressures.$TUT $PROM $PIVX
#usjulyppiflat 🇺🇸
US Producer Prices (July
2026):
•
PPI
MoM: 0.0% (vs +0.2% exp, prior -0.1%)
•
PPI
YoY: 4.7% (vs 4.9% exp, prior 5.5%)
• Core
PPI
MoM: +0.2% (vs +0.3% exp)
• Core
PPI
YoY: 4.2% (in line with exp)
👉
Breakdown:
📈
Goods fell 0.7%, driven by a 3.1% decline in energy (gasoline -5.7%) and lower food prices (-0.9%).
Services rose 0.2%, anchored by portfolio management costs (+6.5%), while transportation & warehousing dipped 1.8%.
👉
The annual rate slows to its lowest level since March, reflecting easing upstream price pressures.$TUT $PROM $PIVX
US Producer Prices (July
2026):
•
PPI
MoM: 0.0% (vs +0.2% exp, prior -0.1%)
•
PPI
YoY: 4.7% (vs 4.9% exp, prior 5.5%)
• Core
PPI
MoM: +0.2% (vs +0.3% exp)
• Core
PPI
YoY: 4.2% (in line with exp)
👉
Breakdown:
📈
Goods fell 0.7%, driven by a 3.1% decline in energy (gasoline -5.7%) and lower food prices (-0.9%).
Services rose 0.2%, anchored by portfolio management costs (+6.5%), while transportation & warehousing dipped 1.8%.
👉
The annual rate slows to its lowest level since March, reflecting easing upstream price pressures.$TUT $PROM $PIVX
222
🏭📊 July PPI Stays Flat
U.S. producer prices showed no monthly change in July, with the final-demand PPI unchanged after falling 0.1% in June.
But the annual picture remains notable: final-demand prices were 4.7% higher than a year earlier.
For spot investors watching $BTC and $BNB, the key signal is that monthly producer-price pressure paused while annual inflation remained elevated.
#usjulyppiflat
🏭📊 July PPI Stays Flat
U.S. producer prices showed no monthly change in July, with the final-demand PPI unchanged after falling 0.1% in June.
But the annual picture remains notable: final-demand prices were 4.7% higher than a year earlier.
For spot investors watching $BTC and $BNB, the key signal is that monthly producer-price pressure paused while annual inflation remained elevated.
#usjulyppiflat
U.S. producer prices showed no monthly change in July, with the final-demand PPI unchanged after falling 0.1% in June.
But the annual picture remains notable: final-demand prices were 4.7% higher than a year earlier.
For spot investors watching $BTC and $BNB, the key signal is that monthly producer-price pressure paused while annual inflation remained elevated.
#usjulyppiflat
34


·
--
Рост
Проверено
#usjulyppiflat
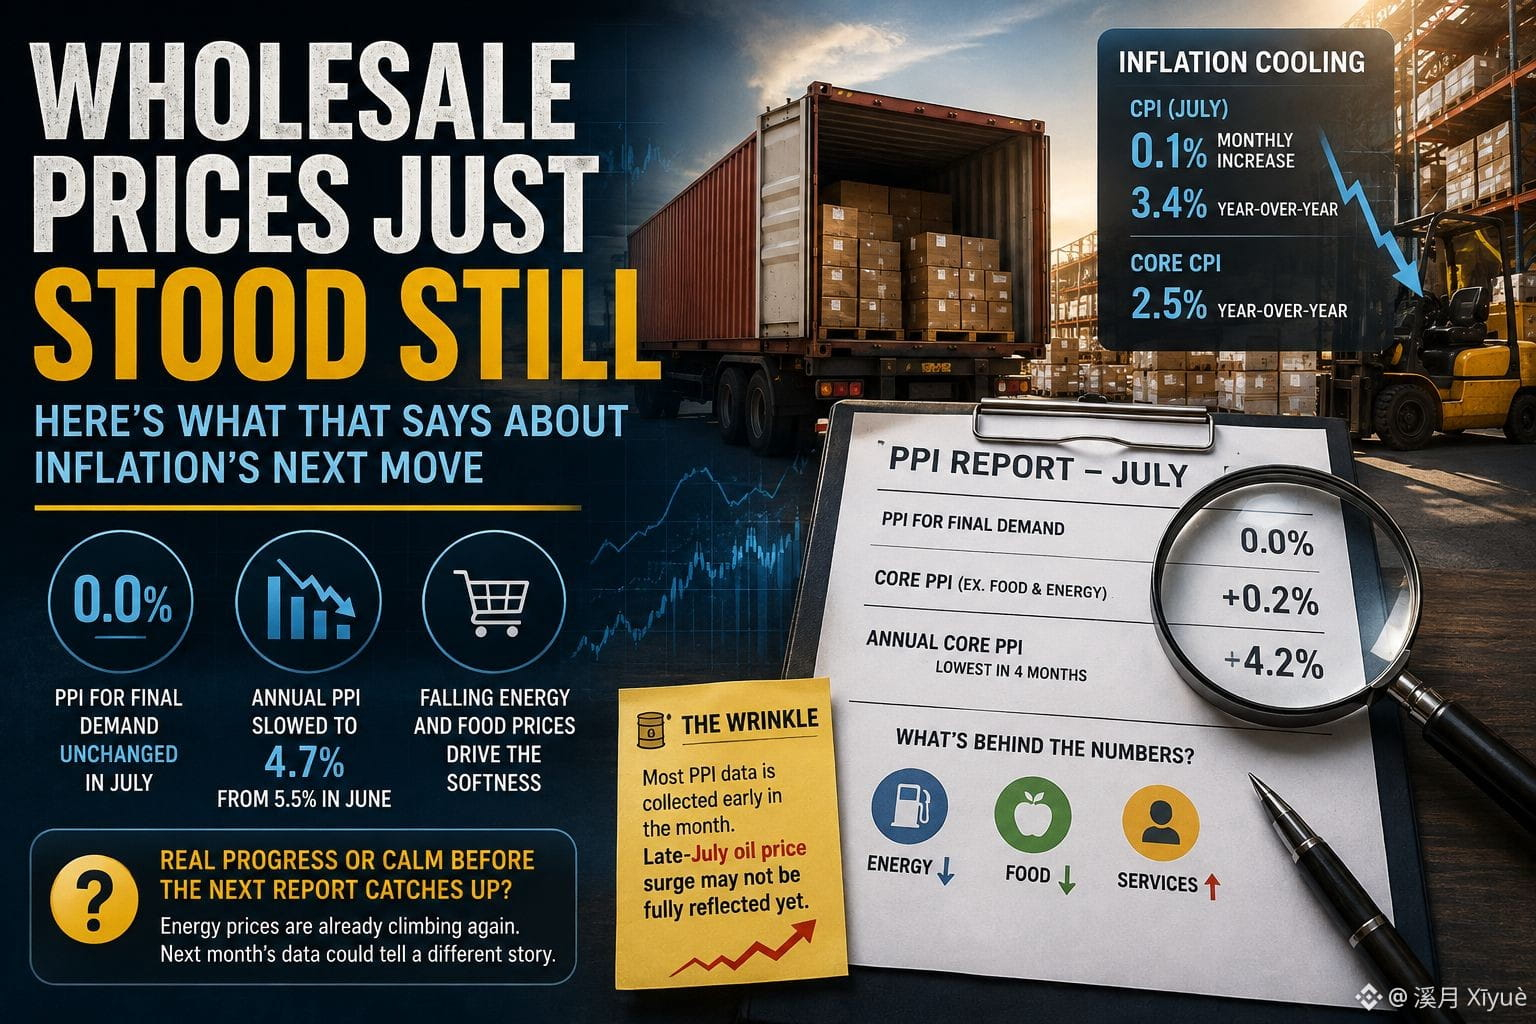
📦 Wholesale Prices Just Stood Still — Here's What That Says About Inflation's Next Move
A day after CPI showed inflation cooling, its producer-side counterpart delivered a similar message — with a few details worth a second look.
The breakdown: The Bureau of Labor Statistics reported Thursday that the Producer Price Index for final demand was unchanged in July, below the 0.2% increase economists had expected, following a 0.1% dip in June. On an annual basis, PPI slowed to 4.7% from 5.5% in June. Core PPI, which strips out food and energy, rose a modest 0.2% for the month against a 0.3% forecast, with the annual core rate easing to 4.2% — its lowest level in four months. The softness was driven mainly by falling energy and food prices, even as the cost of services still edged higher. This follows Wednesday's July CPI report, which showed a similar pattern: headline consumer prices rose just 0.1% for the month, with the annual rate slowing to 3.4% and core CPI easing to 2.5% year-over-year.
Why it matters: Two consecutive days of cooler-than-expected inflation data reinforce the disinflation narrative heading into the Fed's September meeting, giving policymakers more room to weigh their next move. There's a wrinkle worth noting, though: most PPI data is collected early in the month, meaning the late-July jump in oil prices tied to renewed Middle East tensions likely wasn't fully captured in this report — so some of today's relief could look different once next month's data catches up. A narrower measure that also strips out trade services showed a sharper pickup as well, pointing to some underlying service-sector cost pressure that hasn't fully faded even as the headline numbers cool.
Closing thought: With energy prices already climbing again since this data was collected, does today's flat reading mark real progress on inflation — or just a calm month before the next report catches up to it?
$EDEN
$TUT
$AKE
#usjulyppiflat
📦 Wholesale Prices Just Stood Still — Here's What That Says About Inflation's Next Move
A day after CPI showed inflation cooling, its producer-side counterpart delivered a similar message — with a few details worth a second look.
The breakdown: The Bureau of Labor Statistics reported Thursday that the Producer Price Index for final demand was unchanged in July, below the 0.2% increase economists had expected, following a 0.1% dip in June. On an annual basis, PPI slowed to 4.7% from 5.5% in June. Core PPI, which strips out food and energy, rose a modest 0.2% for the month against a 0.3% forecast, with the annual core rate easing to 4.2% — its lowest level in four months. The softness was driven mainly by falling energy and food prices, even as the cost of services still edged higher. This follows Wednesday's July CPI report, which showed a similar pattern: headline consumer prices rose just 0.1% for the month, with the annual rate slowing to 3.4% and core CPI easing to 2.5% year-over-year.
Why it matters: Two consecutive days of cooler-than-expected inflation data reinforce the disinflation narrative heading into the Fed's September meeting, giving policymakers more room to weigh their next move. There's a wrinkle worth noting, though: most PPI data is collected early in the month, meaning the late-July jump in oil prices tied to renewed Middle East tensions likely wasn't fully captured in this report — so some of today's relief could look different once next month's data catches up. A narrower measure that also strips out trade services showed a sharper pickup as well, pointing to some underlying service-sector cost pressure that hasn't fully faded even as the headline numbers cool.
Closing thought: With energy prices already climbing again since this data was collected, does today's flat reading mark real progress on inflation — or just a calm month before the next report catches up to it?
$EDEN
$TUT
$AKE
📦 Wholesale Prices Just Stood Still — Here's What That Says About Inflation's Next Move
A day after CPI showed inflation cooling, its producer-side counterpart delivered a similar message — with a few details worth a second look.
The breakdown: The Bureau of Labor Statistics reported Thursday that the Producer Price Index for final demand was unchanged in July, below the 0.2% increase economists had expected, following a 0.1% dip in June. On an annual basis, PPI slowed to 4.7% from 5.5% in June. Core PPI, which strips out food and energy, rose a modest 0.2% for the month against a 0.3% forecast, with the annual core rate easing to 4.2% — its lowest level in four months. The softness was driven mainly by falling energy and food prices, even as the cost of services still edged higher. This follows Wednesday's July CPI report, which showed a similar pattern: headline consumer prices rose just 0.1% for the month, with the annual rate slowing to 3.4% and core CPI easing to 2.5% year-over-year.
Why it matters: Two consecutive days of cooler-than-expected inflation data reinforce the disinflation narrative heading into the Fed's September meeting, giving policymakers more room to weigh their next move. There's a wrinkle worth noting, though: most PPI data is collected early in the month, meaning the late-July jump in oil prices tied to renewed Middle East tensions likely wasn't fully captured in this report — so some of today's relief could look different once next month's data catches up. A narrower measure that also strips out trade services showed a sharper pickup as well, pointing to some underlying service-sector cost pressure that hasn't fully faded even as the headline numbers cool.
Closing thought: With energy prices already climbing again since this data was collected, does today's flat reading mark real progress on inflation — or just a calm month before the next report catches up to it?
$EDEN
$TUT
$AKE
5
10.3k

·
--
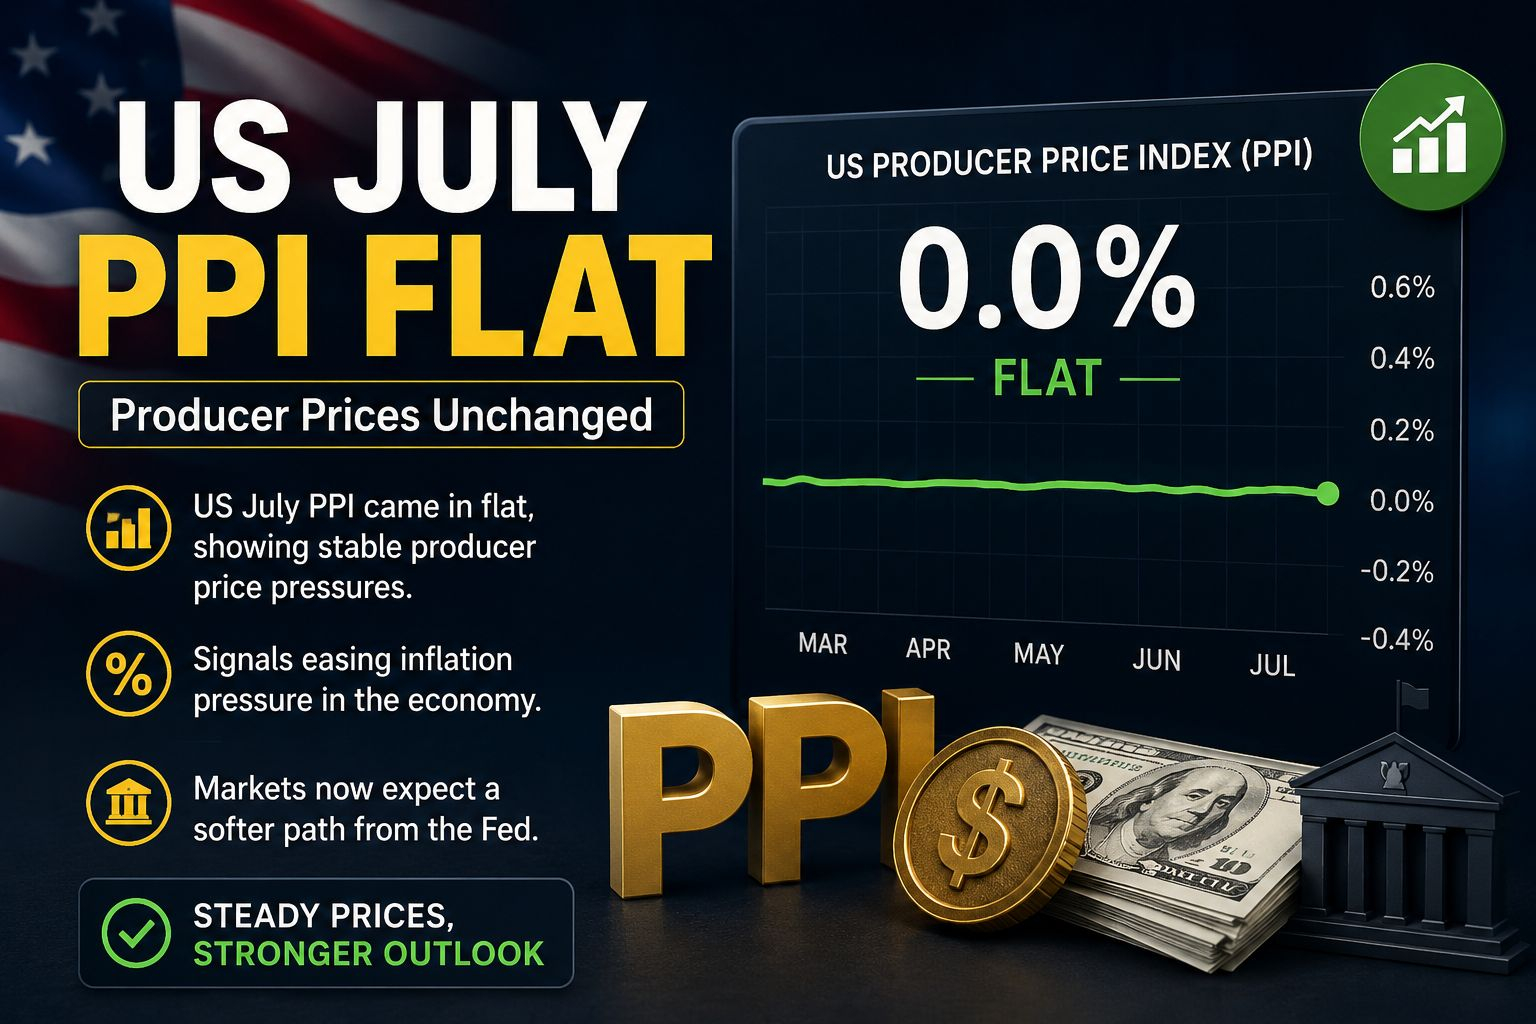
#USJulyPPIFlat 🇺🇸 US July PPI came in flat, showing producer prices were steady. This could ease some inflation pressure and support hopes for a softer Fed path. Markets may watch the next data closely. 💵📊
#USJulyPPIFlat #PPI #Inflation #Fed #Bitcoin #Crypto #BTC
{future}(BTCUSDT)
#USJulyPPIFlat 🇺🇸 US July PPI came in flat, showing producer prices were steady. This could ease some inflation pressure and support hopes for a softer Fed path. Markets may watch the next data closely. 💵📊
#USJulyPPIFlat #PPI #Inflation #Fed #Bitcoin #Crypto #BTC
#USJulyPPIFlat #PPI #Inflation #Fed #Bitcoin #Crypto #BTC
117

·
--
Проверено
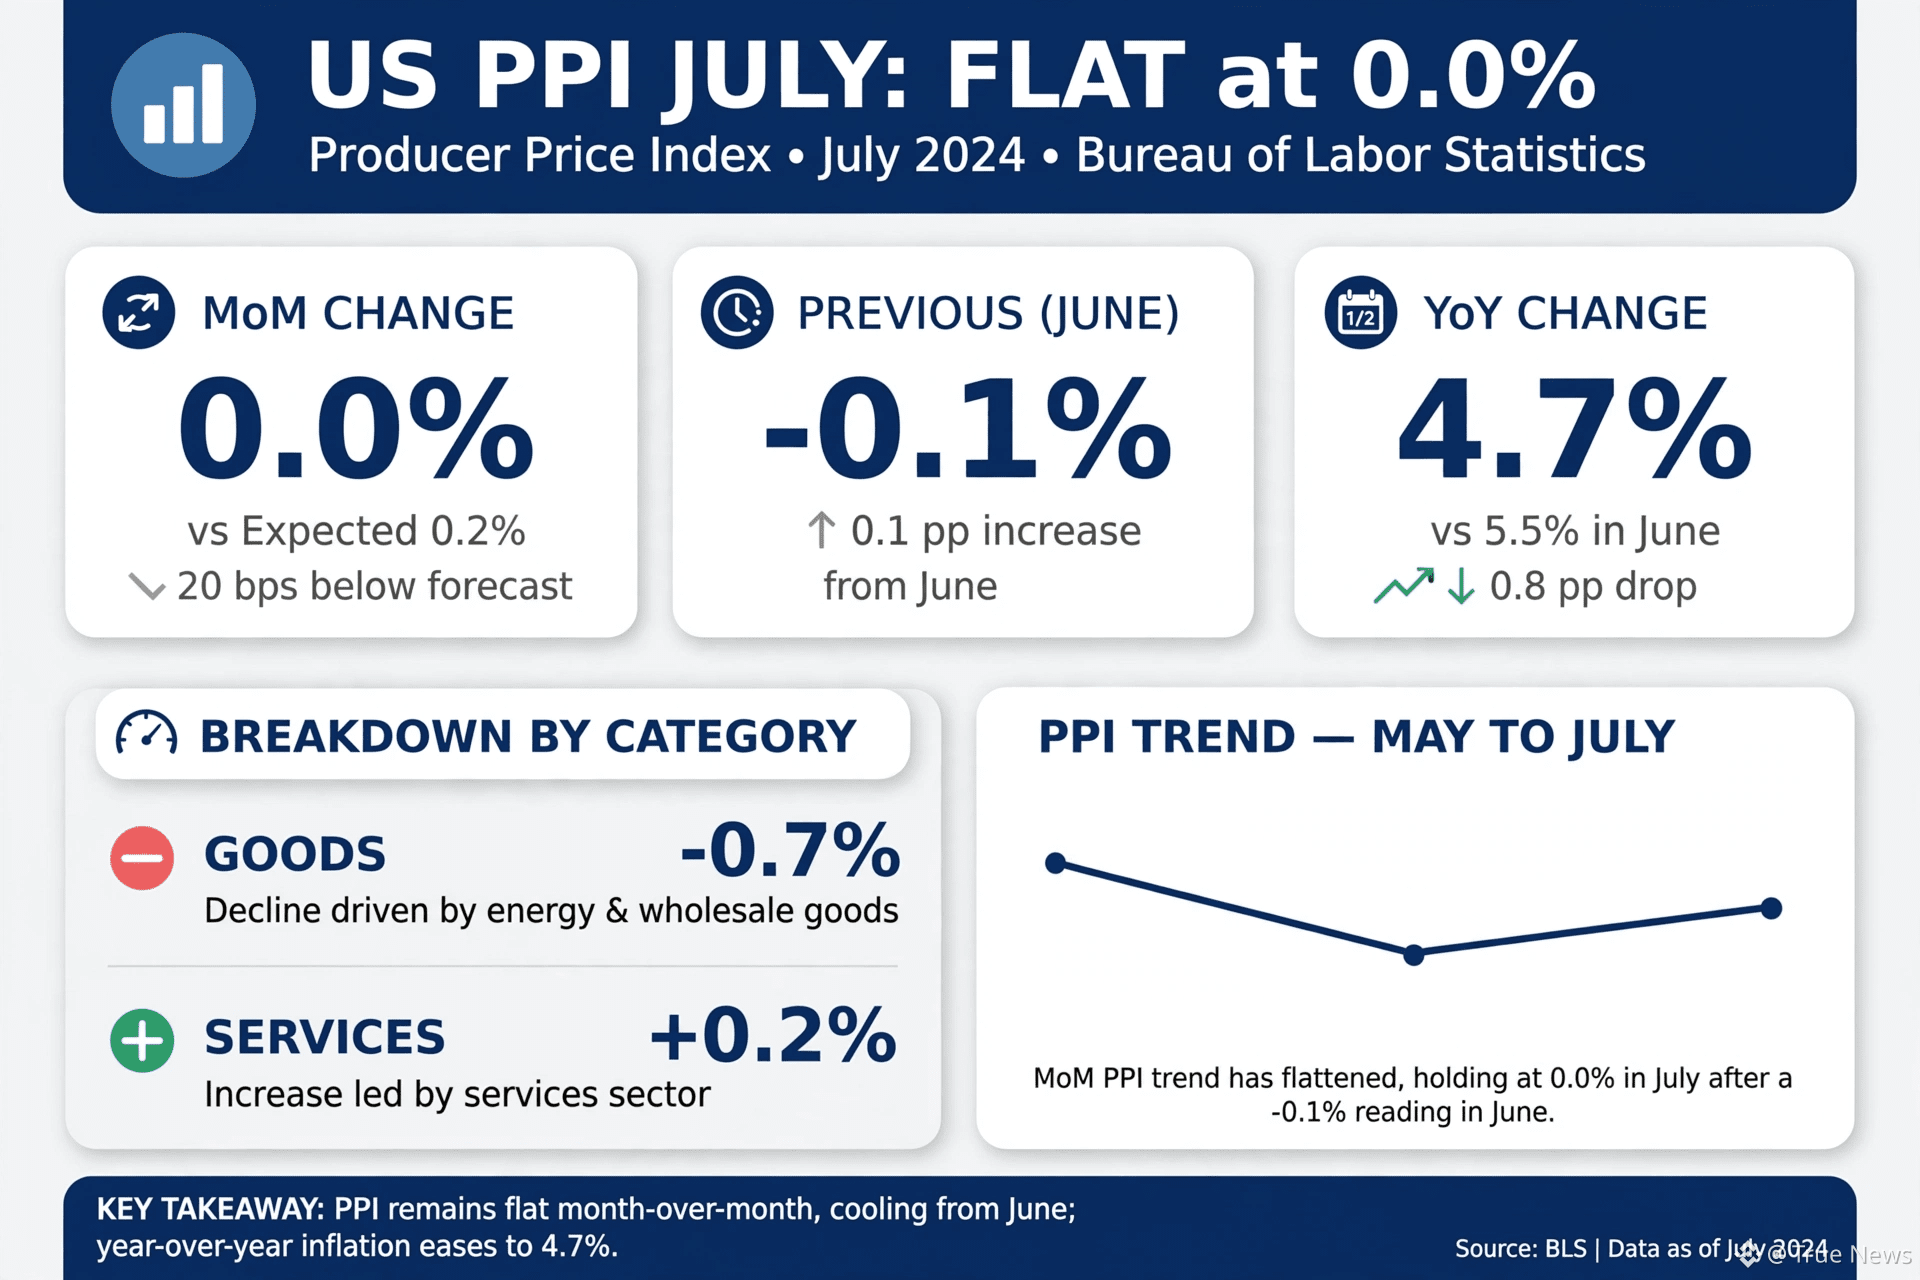
US PPI FLAT in July 📉
Expected: +0.2%
Actual: 0.0%
June revised to -0.1%
Goods prices fell -0.7%, services up +0.2%. YoY down to 4.7% from 5.5%.
Fed pause just got more likely.
#PPI #Inflation#usjulyppiflat
US PPI FLAT in July 📉
Expected: +0.2%
Actual: 0.0%
June revised to -0.1%
Goods prices fell -0.7%, services up +0.2%. YoY down to 4.7% from 5.5%.
Fed pause just got more likely.
#PPI #Inflation#usjulyppiflat
Expected: +0.2%
Actual: 0.0%
June revised to -0.1%
Goods prices fell -0.7%, services up +0.2%. YoY down to 4.7% from 5.5%.
Fed pause just got more likely.
#PPI #Inflation#usjulyppiflat
1
1k
⛽📉 Energy Helped Push PPI Lower
Final-demand energy prices dropped 3.1% in July, while gasoline prices fell 5.7%.
That decline helped pull the goods component lower even as some other producer-price categories increased.
Meanwhile, overall final-demand PPI remained flat for the month and was still 4.7% higher year-over-year.
$BTC and $BNB investors now have another important macro data point to assess.
#usjulyppiflat
⛽📉 Energy Helped Push PPI Lower
Final-demand energy prices dropped 3.1% in July, while gasoline prices fell 5.7%.
That decline helped pull the goods component lower even as some other producer-price categories increased.
Meanwhile, overall final-demand PPI remained flat for the month and was still 4.7% higher year-over-year.
$BTC and $BNB investors now have another important macro data point to assess.
#usjulyppiflat
Final-demand energy prices dropped 3.1% in July, while gasoline prices fell 5.7%.
That decline helped pull the goods component lower even as some other producer-price categories increased.
Meanwhile, overall final-demand PPI remained flat for the month and was still 4.7% higher year-over-year.
$BTC and $BNB investors now have another important macro data point to assess.
#usjulyppiflat
20
·
--
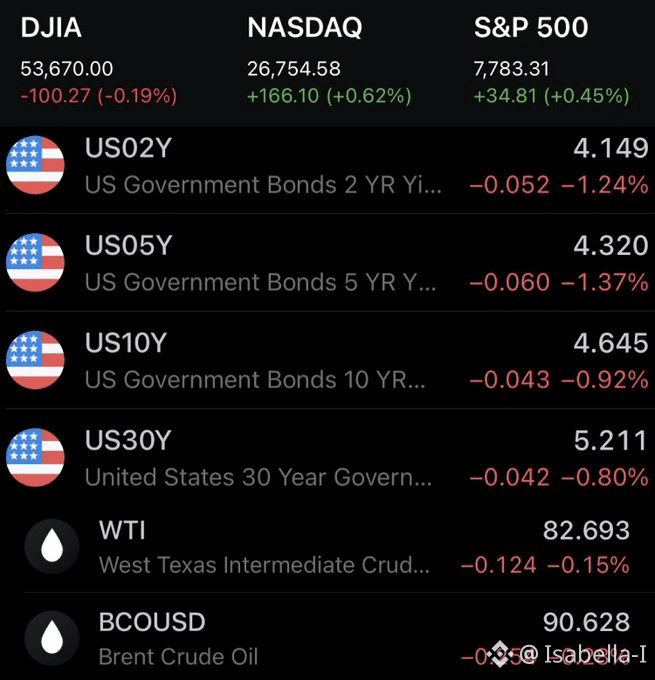
#usjulyppiflat So far it’s looking like another mixed day in the markets, as the cool PPI
report eased concerns of a rate hike in September, while tensions in the Middle East continue to cause volatility in oil and weigh on market sentiment.
PPI
came in cooler than expected with headline inflation at 4.7% YoY (down from 5.5% in June) and 0.0% MoM (the expectation was +0.2%, and was previous revised to –0.1%), and with Core inflation at 4.2% YoY (down from 4.7% in June) and +0.2% MoM (the expectation was +0.3%).
So just like the CPI report, PPI was cooler and added to the signals that the rate of inflation (an important distinction to make) is slowing down.
Whether inflation stays like this or not is up in the air, but with how this year has been so far, I for one have my doubts.
How did you feel about the PPI report and how the market is reacting to the data?$MMT $VANRY $BICO
#usjulyppiflat So far it’s looking like another mixed day in the markets, as the cool PPI
report eased concerns of a rate hike in September, while tensions in the Middle East continue to cause volatility in oil and weigh on market sentiment.
PPI
came in cooler than expected with headline inflation at 4.7% YoY (down from 5.5% in June) and 0.0% MoM (the expectation was +0.2%, and was previous revised to –0.1%), and with Core inflation at 4.2% YoY (down from 4.7% in June) and +0.2% MoM (the expectation was +0.3%).
So just like the CPI report, PPI was cooler and added to the signals that the rate of inflation (an important distinction to make) is slowing down.
Whether inflation stays like this or not is up in the air, but with how this year has been so far, I for one have my doubts.
How did you feel about the PPI report and how the market is reacting to the data?$MMT $VANRY $BICO
report eased concerns of a rate hike in September, while tensions in the Middle East continue to cause volatility in oil and weigh on market sentiment.
PPI
came in cooler than expected with headline inflation at 4.7% YoY (down from 5.5% in June) and 0.0% MoM (the expectation was +0.2%, and was previous revised to –0.1%), and with Core inflation at 4.2% YoY (down from 4.7% in June) and +0.2% MoM (the expectation was +0.3%).
So just like the CPI report, PPI was cooler and added to the signals that the rate of inflation (an important distinction to make) is slowing down.
Whether inflation stays like this or not is up in the air, but with how this year has been so far, I for one have my doubts.
How did you feel about the PPI report and how the market is reacting to the data?$MMT $VANRY $BICO
187

#USJulyPPIFlat
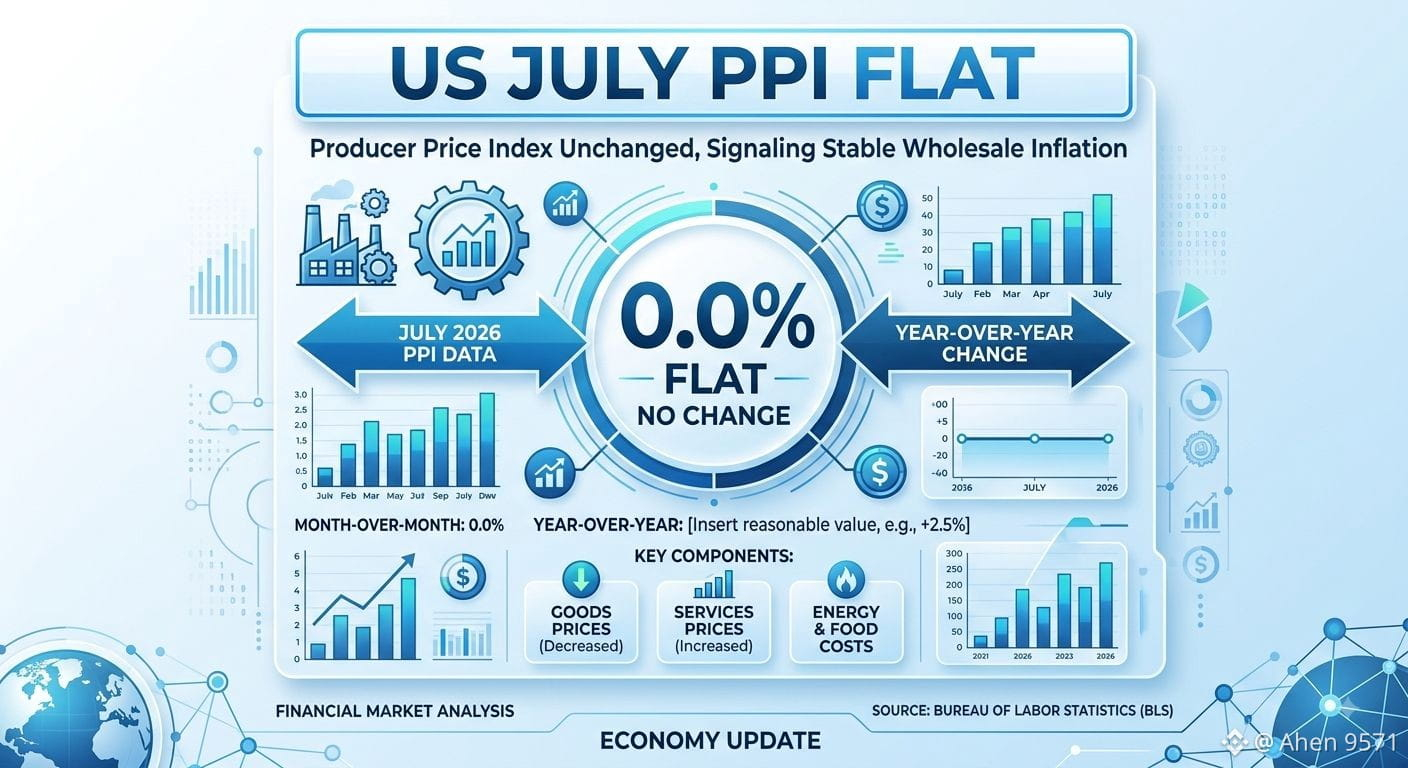
The U.S. Producer Price Index (PPI) was flat (0.0% MoM) for the month of July, underperforming market forecasts of a 0.2% increase and highlighting a distinct cooling trend in wholesale inflation.Key Inflation FiguresHeadline PPI (MoM): 0.0% (vs. 0.2% expected)Headline PPI (YoY): 4.7%, slowing down markedly from 5.5% in JuneCore PPI (MoM): 0.2%, beating expectations of a 0.3% riseCore PPI (YoY): 4.2%, continuing its decline from the previous monthPrimary Market DriversAccording to data released by the U.S. Bureau of Labor Statistics, the flat monthly reading was heavily driven by energy costs. Wholesale goods prices dropped by 0.7%, insulated by a 5.7% plunge in the gasoline index and a 0.9% decrease in food prices. This drop completely offset a 0.2% increase in the final demand services index.Monetary Policy ImpactComing on the heels of a mild consumer price report, this data has dramatically lowered expectations for aggressive action from the Federal Reserve. Investors using trackers like TradingView noted a subsequent rally in gold prices and a weaker dollar index. Federal Fed fund futures now point to heavy odds that the central bank will keep interest rates unchanged at its next policy meeting.If you would like, I can:Provide a direct breakdown of how this affects interest rate predictionsDetail the difference between this PPI data and yesterday's CPI reportShare how major stock indices reacted to the news$GOOGL.US $NVDAB
#USJulyPPIFlat
The U.S. Producer Price Index (PPI) was flat (0.0% MoM) for the month of July, underperforming market forecasts of a 0.2% increase and highlighting a distinct cooling trend in wholesale inflation.Key Inflation FiguresHeadline PPI (MoM): 0.0% (vs. 0.2% expected)Headline PPI (YoY): 4.7%, slowing down markedly from 5.5% in JuneCore PPI (MoM): 0.2%, beating expectations of a 0.3% riseCore PPI (YoY): 4.2%, continuing its decline from the previous monthPrimary Market DriversAccording to data released by the U.S. Bureau of Labor Statistics, the flat monthly reading was heavily driven by energy costs. Wholesale goods prices dropped by 0.7%, insulated by a 5.7% plunge in the gasoline index and a 0.9% decrease in food prices. This drop completely offset a 0.2% increase in the final demand services index.Monetary Policy ImpactComing on the heels of a mild consumer price report, this data has dramatically lowered expectations for aggressive action from the Federal Reserve. Investors using trackers like TradingView noted a subsequent rally in gold prices and a weaker dollar index. Federal Fed fund futures now point to heavy odds that the central bank will keep interest rates unchanged at its next policy meeting.If you would like, I can:Provide a direct breakdown of how this affects interest rate predictionsDetail the difference between this PPI data and yesterday's CPI reportShare how major stock indices reacted to the news$GOOGL.US $NVDAB
The U.S. Producer Price Index (PPI) was flat (0.0% MoM) for the month of July, underperforming market forecasts of a 0.2% increase and highlighting a distinct cooling trend in wholesale inflation.Key Inflation FiguresHeadline PPI (MoM): 0.0% (vs. 0.2% expected)Headline PPI (YoY): 4.7%, slowing down markedly from 5.5% in JuneCore PPI (MoM): 0.2%, beating expectations of a 0.3% riseCore PPI (YoY): 4.2%, continuing its decline from the previous monthPrimary Market DriversAccording to data released by the U.S. Bureau of Labor Statistics, the flat monthly reading was heavily driven by energy costs. Wholesale goods prices dropped by 0.7%, insulated by a 5.7% plunge in the gasoline index and a 0.9% decrease in food prices. This drop completely offset a 0.2% increase in the final demand services index.Monetary Policy ImpactComing on the heels of a mild consumer price report, this data has dramatically lowered expectations for aggressive action from the Federal Reserve. Investors using trackers like TradingView noted a subsequent rally in gold prices and a weaker dollar index. Federal Fed fund futures now point to heavy odds that the central bank will keep interest rates unchanged at its next policy meeting.If you would like, I can:Provide a direct breakdown of how this affects interest rate predictionsDetail the difference between this PPI data and yesterday's CPI reportShare how major stock indices reacted to the news$GOOGL.US $NVDAB
NVDAB-2,72%
GOOGLUS+0,21%
26

#USJulyPPIFlat
🌎 The United States Producer Price Index (PPI) for final demand was unchanged (0.0% MoM) in July 2026, coming in below the 0.2% monthly increase expected by economists. According to the U.S. Bureau of Labor Statistics (BLS), the flat headline reading was primarily driven by a sharp decline in energy costs, which offset moderate increases in services and construction.
On an annual basis, headline wholesale inflation slowed to 4.7% year-over-year, marking its lowest level since March and a notable step down from the 5.5% pace recorded in June.
💫Core PPI: Excluding volatile food and energy components, core producer prices rose 0.2% month-over-month. This also came in slightly below the Dow Jones consensus estimate of 0.3%. Year-over-year, core PPI cooled down to 4.2%.
💫Goods vs. Services: Final demand goods decreased by 0.7%, heavily pulled down by a 3.1% plunge in energy costs (including a 5.7% drop in gasoline and a 6.7% drop in diesel). Conversely, final demand services edged up by 0.2%.
💫Intermediate Demand: Further down the supply chain, processed goods for intermediate demand fell 0.6%, while unprocessed goods tumbled 1.8% due to an 11.9% drop in crude petroleum.
$SOL
{future}(SOLUSDT)
$BTC
{spot}(BTCUSDT)
#USJulyPPIFlat
#USJulyPPIFlat
🌎 The United States Producer Price Index (PPI) for final demand was unchanged (0.0% MoM) in July 2026, coming in below the 0.2% monthly increase expected by economists. According to the U.S. Bureau of Labor Statistics (BLS), the flat headline reading was primarily driven by a sharp decline in energy costs, which offset moderate increases in services and construction.
On an annual basis, headline wholesale inflation slowed to 4.7% year-over-year, marking its lowest level since March and a notable step down from the 5.5% pace recorded in June.
💫Core PPI: Excluding volatile food and energy components, core producer prices rose 0.2% month-over-month. This also came in slightly below the Dow Jones consensus estimate of 0.3%. Year-over-year, core PPI cooled down to 4.2%.
💫Goods vs. Services: Final demand goods decreased by 0.7%, heavily pulled down by a 3.1% plunge in energy costs (including a 5.7% drop in gasoline and a 6.7% drop in diesel). Conversely, final demand services edged up by 0.2%.
💫Intermediate Demand: Further down the supply chain, processed goods for intermediate demand fell 0.6%, while unprocessed goods tumbled 1.8% due to an 11.9% drop in crude petroleum.
$SOL
$BTC
#USJulyPPIFlat
🌎 The United States Producer Price Index (PPI) for final demand was unchanged (0.0% MoM) in July 2026, coming in below the 0.2% monthly increase expected by economists. According to the U.S. Bureau of Labor Statistics (BLS), the flat headline reading was primarily driven by a sharp decline in energy costs, which offset moderate increases in services and construction.
On an annual basis, headline wholesale inflation slowed to 4.7% year-over-year, marking its lowest level since March and a notable step down from the 5.5% pace recorded in June.
💫Core PPI: Excluding volatile food and energy components, core producer prices rose 0.2% month-over-month. This also came in slightly below the Dow Jones consensus estimate of 0.3%. Year-over-year, core PPI cooled down to 4.2%.
💫Goods vs. Services: Final demand goods decreased by 0.7%, heavily pulled down by a 3.1% plunge in energy costs (including a 5.7% drop in gasoline and a 6.7% drop in diesel). Conversely, final demand services edged up by 0.2%.
💫Intermediate Demand: Further down the supply chain, processed goods for intermediate demand fell 0.6%, while unprocessed goods tumbled 1.8% due to an 11.9% drop in crude petroleum.
$SOL
$BTC
#USJulyPPIFlat
103

#usjulyppiflat
📈 U.S. PPI FLASH: WHOLESALE INFLATION STALLS AT 0.0%
The latest Producer Price Index (PPI) print just delivered a massive macro green flag for the crypto market. Wholesale inflation is cooling off rapidly, paving the way for easier monetary policy.
The Breakdown:
MoM PPI: Stagnated at 0.0% (beating the 0.2% expected consensus).
YoY PPI: Decelerated sharply to 4.7%.
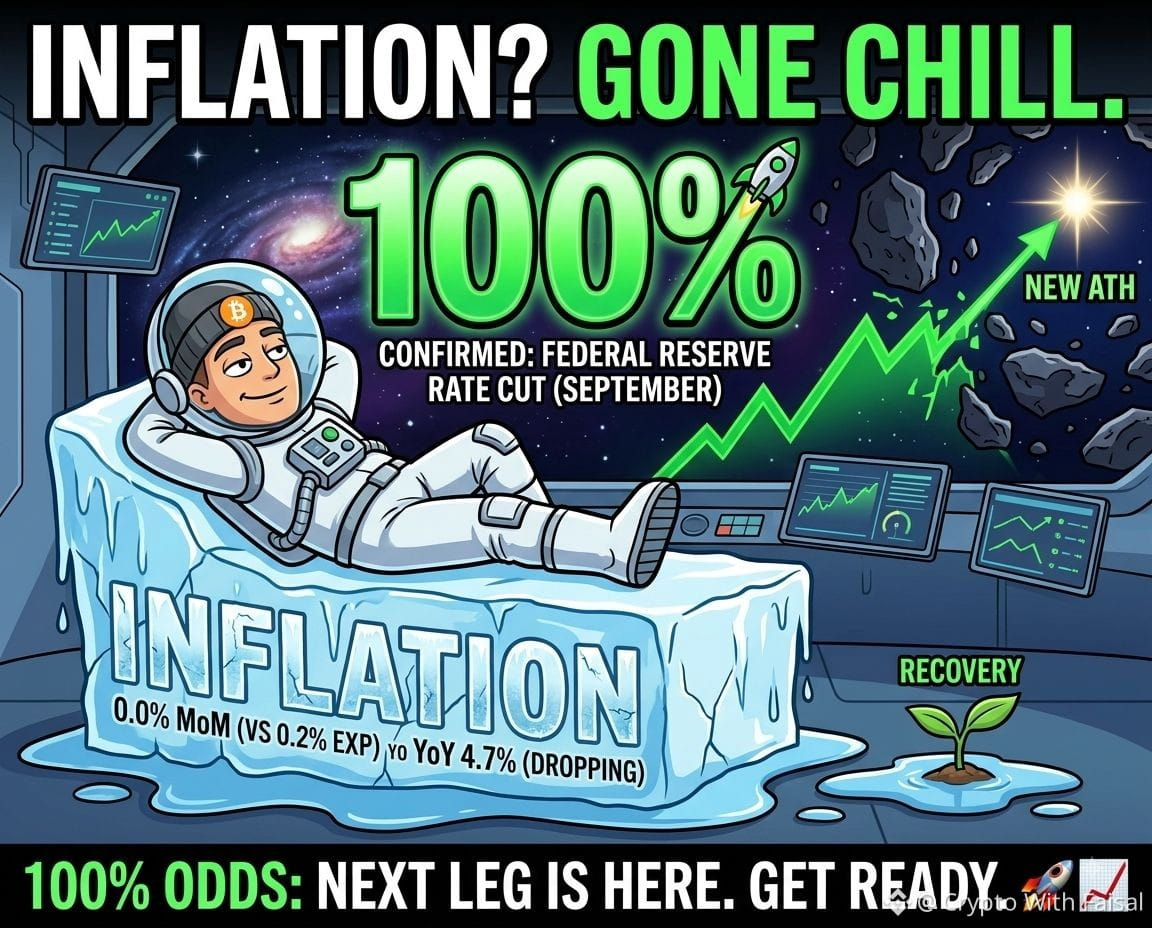
Fed Rate Cut Odds: CME FedWatch now signals a 100% probability of a Federal Reserve rate cut in September, with expectations for a heavier 50+ bps cut gaining momentum.
Why This Matters:
Yesterday’s post-CPI price action created a brief shakeout that trapped impatient bears. However, the flat PPI data confirms that inflationary pressures are fading. Rate cuts historically unleash massive liquidity into risk-on assets like Bitcoin.
The Strategic Takeaway:
Don't let short-term market noise cloud the macro reality. The structural setup for liquidity is turning bullish. Manage your risk, avoid getting caught on the wrong side of over-leveraged shorts, and stay positioned for the trend! 🎯
(Not financial advice. Always DYOR.)
#PPI
#bitcoin
#FedRateCut
$BTC
{future}(BTCUSDT)
$ETH
{future}(ETHUSDT)
$BNB
{future}(BNBUSDT)
#usjulyppiflat
📈 U.S. PPI FLASH: WHOLESALE INFLATION STALLS AT 0.0%
The latest Producer Price Index (PPI) print just delivered a massive macro green flag for the crypto market. Wholesale inflation is cooling off rapidly, paving the way for easier monetary policy.
The Breakdown:
MoM PPI: Stagnated at 0.0% (beating the 0.2% expected consensus).
YoY PPI: Decelerated sharply to 4.7%.
Fed Rate Cut Odds: CME FedWatch now signals a 100% probability of a Federal Reserve rate cut in September, with expectations for a heavier 50+ bps cut gaining momentum.
Why This Matters:
Yesterday’s post-CPI price action created a brief shakeout that trapped impatient bears. However, the flat PPI data confirms that inflationary pressures are fading. Rate cuts historically unleash massive liquidity into risk-on assets like Bitcoin.
The Strategic Takeaway:
Don't let short-term market noise cloud the macro reality. The structural setup for liquidity is turning bullish. Manage your risk, avoid getting caught on the wrong side of over-leveraged shorts, and stay positioned for the trend! 🎯
(Not financial advice. Always DYOR.)
#PPI
#bitcoin
#FedRateCut
$BTC
$ETH
$BNB
📈 U.S. PPI FLASH: WHOLESALE INFLATION STALLS AT 0.0%
The latest Producer Price Index (PPI) print just delivered a massive macro green flag for the crypto market. Wholesale inflation is cooling off rapidly, paving the way for easier monetary policy.
The Breakdown:
MoM PPI: Stagnated at 0.0% (beating the 0.2% expected consensus).
YoY PPI: Decelerated sharply to 4.7%.
Fed Rate Cut Odds: CME FedWatch now signals a 100% probability of a Federal Reserve rate cut in September, with expectations for a heavier 50+ bps cut gaining momentum.
Why This Matters:
Yesterday’s post-CPI price action created a brief shakeout that trapped impatient bears. However, the flat PPI data confirms that inflationary pressures are fading. Rate cuts historically unleash massive liquidity into risk-on assets like Bitcoin.
The Strategic Takeaway:
Don't let short-term market noise cloud the macro reality. The structural setup for liquidity is turning bullish. Manage your risk, avoid getting caught on the wrong side of over-leveraged shorts, and stay positioned for the trend! 🎯
(Not financial advice. Always DYOR.)
#PPI
#bitcoin
#FedRateCut
$BTC
$ETH
$BNB
2
143

·
--
Проверено
#usjulyppiflat
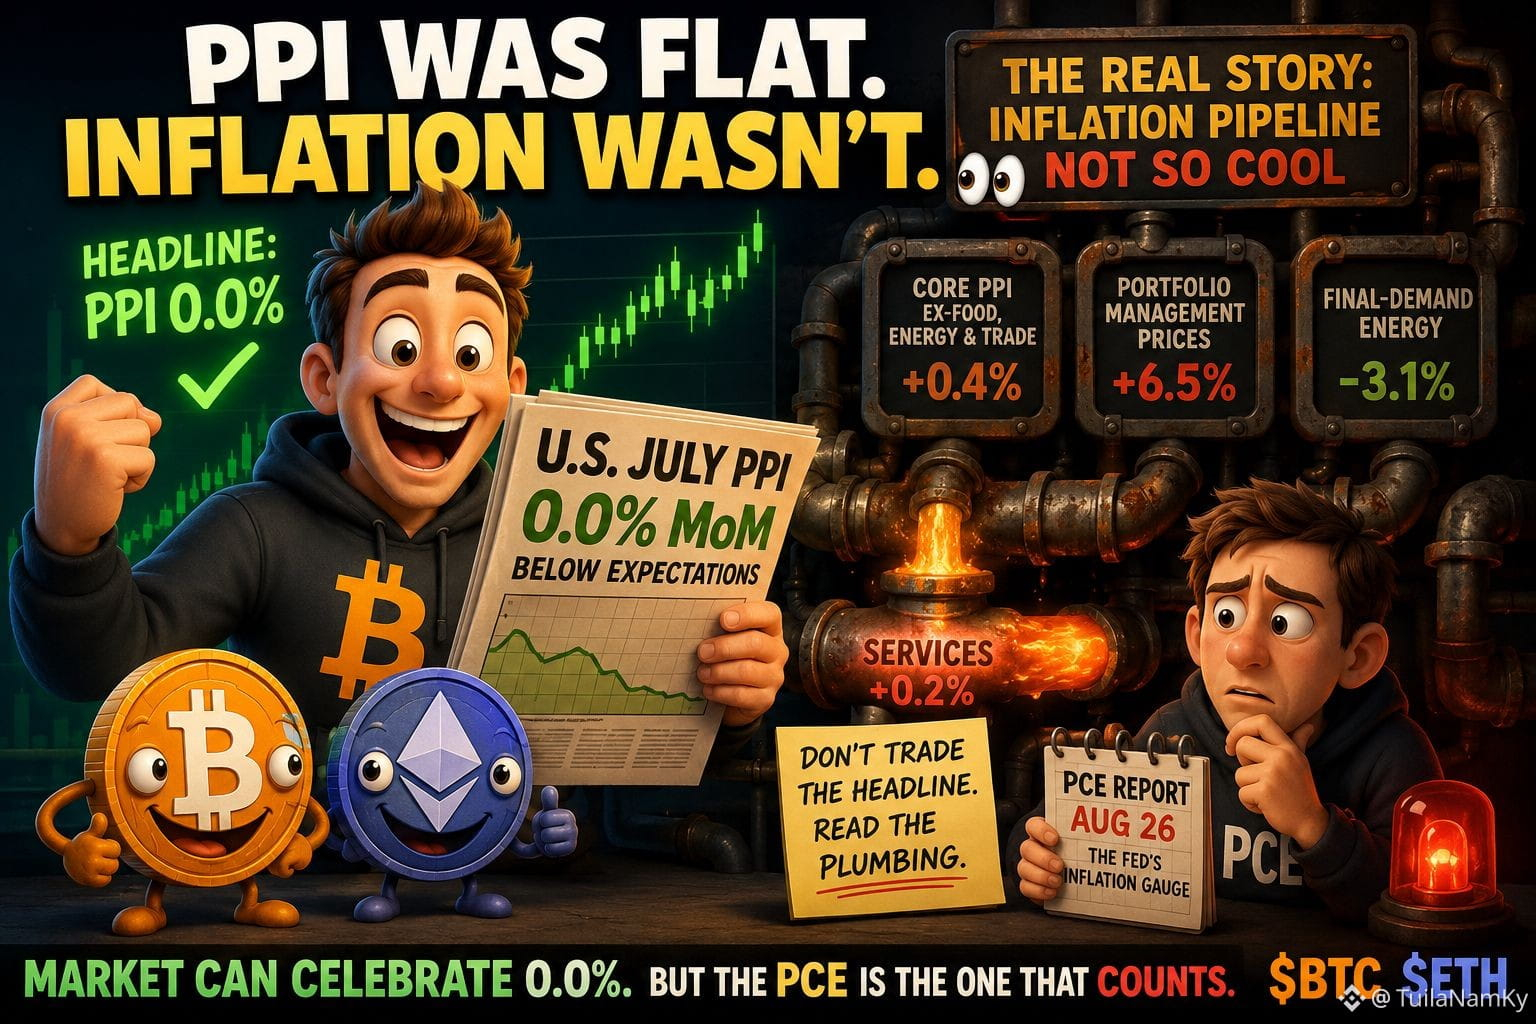
PPI was flat. Inflation wasn’t. 👀
The headline looks almost perfect for risk assets: 🇺🇸 July PPI came in at 0.0% MoM, below the +0.2% expected, while annual PPI cooled to 4.7% from 5.5%.
But here’s where the story gets interesting.
The 5 numbers that matter:
• PPI: 0.0% MoM
• PPI: 4.7% YoY
• Core PPI ex-food, energy & trade: +0.4%
• Portfolio management prices: +6.5%
• Final-demand energy: -3.1%
The contradiction?
Goods prices fell 0.7%, largely helped by cheaper energy and gasoline, while services still rose 0.2%.
So the “cooling inflation” headline may be hiding a stickier services story.
Plot twist: the market can celebrate 0.0%, but the inflation pipeline feeding into PCE deserves more attention. The July PCE report is due August 26, and that’s the inflation gauge the Fed targets.
For $BTC and $ETH , the takeaway isn’t “bullish” or “bearish.”
It’s this:
Don’t trade the headline. Read the plumbing.
Is the market celebrating too early? 👀
#BTC #ETH
{future}(BTCUSDT)
{future}(ETHUSDT)
#usjulyppiflat
PPI was flat. Inflation wasn’t. 👀
The headline looks almost perfect for risk assets: 🇺🇸 July PPI came in at 0.0% MoM, below the +0.2% expected, while annual PPI cooled to 4.7% from 5.5%.
But here’s where the story gets interesting.
The 5 numbers that matter:
• PPI: 0.0% MoM
• PPI: 4.7% YoY
• Core PPI ex-food, energy & trade: +0.4%
• Portfolio management prices: +6.5%
• Final-demand energy: -3.1%
The contradiction?
Goods prices fell 0.7%, largely helped by cheaper energy and gasoline, while services still rose 0.2%.
So the “cooling inflation” headline may be hiding a stickier services story.
Plot twist: the market can celebrate 0.0%, but the inflation pipeline feeding into PCE deserves more attention. The July PCE report is due August 26, and that’s the inflation gauge the Fed targets.
For $BTC and $ETH , the takeaway isn’t “bullish” or “bearish.”
It’s this:
Don’t trade the headline. Read the plumbing.
Is the market celebrating too early? 👀
#BTC #ETH
PPI was flat. Inflation wasn’t. 👀
The headline looks almost perfect for risk assets: 🇺🇸 July PPI came in at 0.0% MoM, below the +0.2% expected, while annual PPI cooled to 4.7% from 5.5%.
But here’s where the story gets interesting.
The 5 numbers that matter:
• PPI: 0.0% MoM
• PPI: 4.7% YoY
• Core PPI ex-food, energy & trade: +0.4%
• Portfolio management prices: +6.5%
• Final-demand energy: -3.1%
The contradiction?
Goods prices fell 0.7%, largely helped by cheaper energy and gasoline, while services still rose 0.2%.
So the “cooling inflation” headline may be hiding a stickier services story.
Plot twist: the market can celebrate 0.0%, but the inflation pipeline feeding into PCE deserves more attention. The July PCE report is due August 26, and that’s the inflation gauge the Fed targets.
For $BTC and $ETH , the takeaway isn’t “bullish” or “bearish.”
It’s this:
Don’t trade the headline. Read the plumbing.
Is the market celebrating too early? 👀
#BTC #ETH
346

·
--
#USJulyPPIFlat
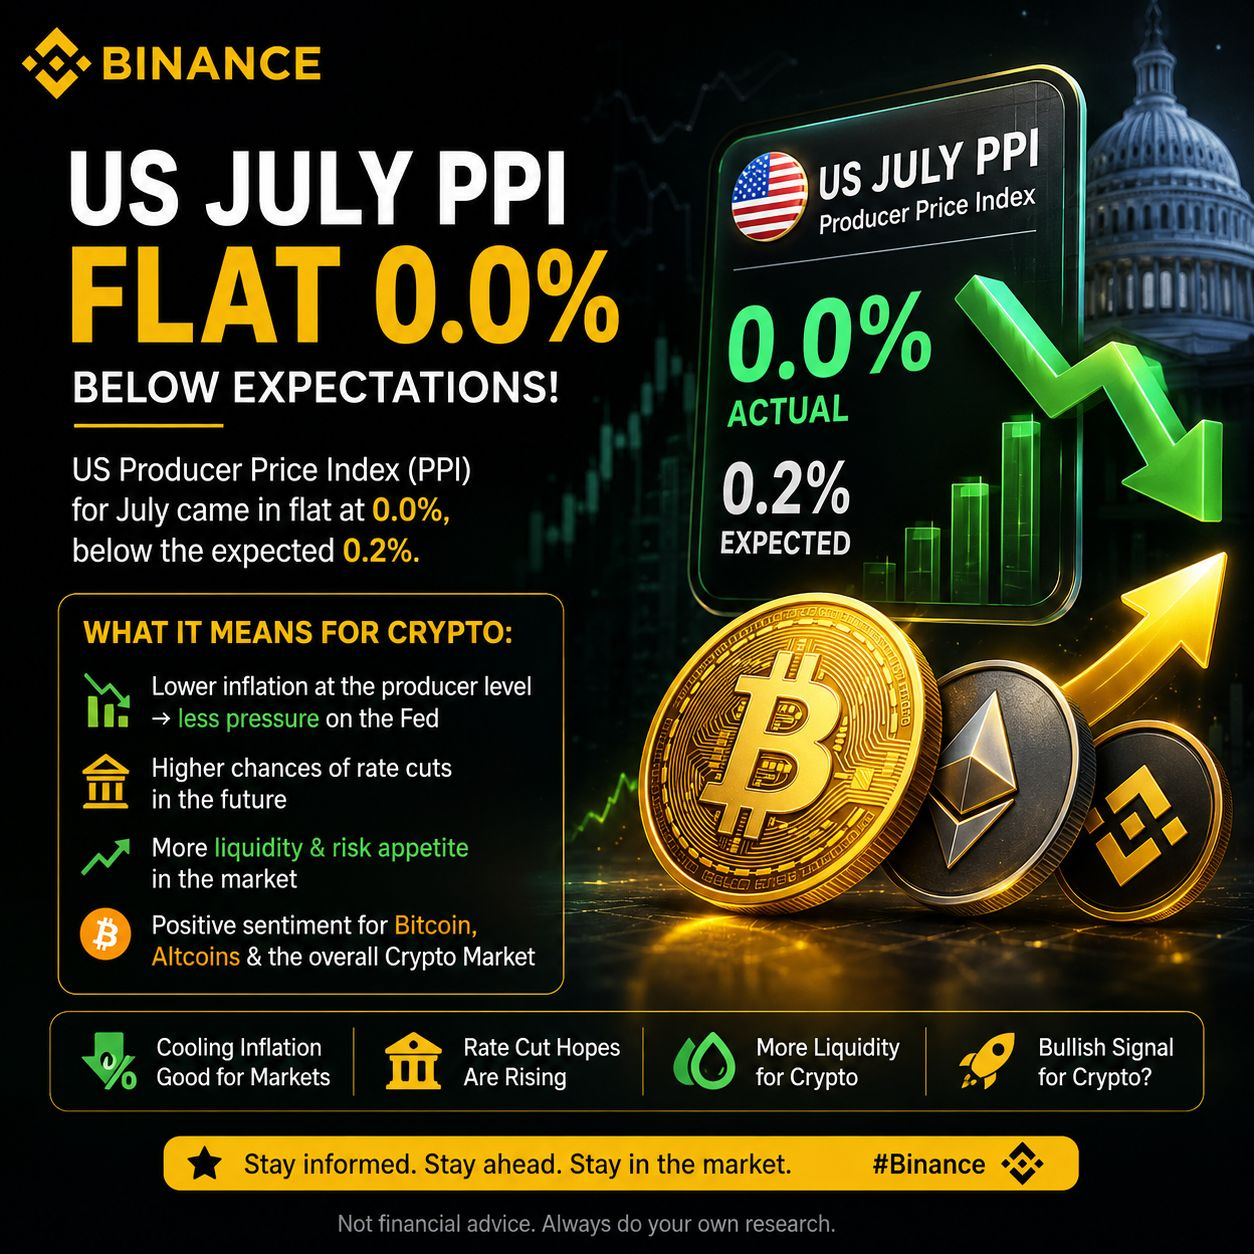
🇺🇸 US July PPI: 0.0% — What It Means for Crypto 📊
US July PPI came in flat at 0.0%, below market expectations. This suggests that producer-level inflation remained under control.
For crypto, this could be a positive signal as softer inflation may reduce pressure on the Federal Reserve to keep interest rates higher for longer. Lower rate expectations can improve liquidity and risk appetite, potentially supporting Bitcoin (BTC), Ethereum (ETH), and other risk assets.
However, traders will now be watching CPI, Fed policy, and upcoming economic data for confirmation. 📈
#USJulyPPIFlat
🇺🇸 US July PPI: 0.0% — What It Means for Crypto 📊
US July PPI came in flat at 0.0%, below market expectations. This suggests that producer-level inflation remained under control.
For crypto, this could be a positive signal as softer inflation may reduce pressure on the Federal Reserve to keep interest rates higher for longer. Lower rate expectations can improve liquidity and risk appetite, potentially supporting Bitcoin (BTC), Ethereum (ETH), and other risk assets.
However, traders will now be watching CPI, Fed policy, and upcoming economic data for confirmation. 📈
🇺🇸 US July PPI: 0.0% — What It Means for Crypto 📊
US July PPI came in flat at 0.0%, below market expectations. This suggests that producer-level inflation remained under control.
For crypto, this could be a positive signal as softer inflation may reduce pressure on the Federal Reserve to keep interest rates higher for longer. Lower rate expectations can improve liquidity and risk appetite, potentially supporting Bitcoin (BTC), Ethereum (ETH), and other risk assets.
However, traders will now be watching CPI, Fed policy, and upcoming economic data for confirmation. 📈
125

Проверено
Хранение $EDEN 0.5 USDT
#USJulyPPIFlat
#USJulyPPIFlat 📉
U.S. July PPI just came in **flat at 0.0% MoM** vs **0.2% expected**.
YoY also cooled to **4.7%** — meaning wholesale inflation is finally backing off. 🧊
That’s a big deal because the market now has a much cleaner reason to price in a **September rate cut**.
After yesterday’s CPI fakeout, this print feels like the kind of data bulls were waiting for. 🚀💚
If momentum follows through, risk assets could rip.
But traders know the rule: **confirm the breakout, don’t chase the noise.**
**What’s your take — real bullish fuel or another trap?**
$LDO
{spot}(LDOUSDT)
$EDEN
$H
{future}(HUSDT)
#RateCut #BinanceSquare #USJulyCPI&PPIDueThisWeek
#USJulyPPIFlat
#USJulyPPIFlat 📉
U.S. July PPI just came in **flat at 0.0% MoM** vs **0.2% expected**.
YoY also cooled to **4.7%** — meaning wholesale inflation is finally backing off. 🧊
That’s a big deal because the market now has a much cleaner reason to price in a **September rate cut**.
After yesterday’s CPI fakeout, this print feels like the kind of data bulls were waiting for. 🚀💚
If momentum follows through, risk assets could rip.
But traders know the rule: **confirm the breakout, don’t chase the noise.**
**What’s your take — real bullish fuel or another trap?**
$LDO
$EDEN
$H
#RateCut #BinanceSquare #USJulyCPI&PPIDueThisWeek
#USJulyPPIFlat 📉
U.S. July PPI just came in **flat at 0.0% MoM** vs **0.2% expected**.
YoY also cooled to **4.7%** — meaning wholesale inflation is finally backing off. 🧊
That’s a big deal because the market now has a much cleaner reason to price in a **September rate cut**.
After yesterday’s CPI fakeout, this print feels like the kind of data bulls were waiting for. 🚀💚
If momentum follows through, risk assets could rip.
But traders know the rule: **confirm the breakout, don’t chase the noise.**
**What’s your take — real bullish fuel or another trap?**
$LDO
$EDEN
$H
#RateCut #BinanceSquare #USJulyCPI&PPIDueThisWeek
279

·
--
Everyone thinks flat PPI means instant pump, but actually that’s where a lot of overleveraged longs get baited.
The common mistake is treating the headline like a buy signal and smashing market orders on $BTC or $ETH before the second reaction hits. With fear still sitting around the market, liquidity grabs are way more likely than clean god candles.
Look at #USJulyPPIFlat as a case study. A “cool” inflation print can be bullish for rate-cut hopes, sure, but the first move is often just algos and crowded positioning. If everyone is leaning the same way, market makers love sweeping both sides before the real direction shows.
Also watch $USDT flows and stablecoin rotation, ser. If fresh bids don’t show up after the headline, that pump can turn into exit liquidity fast. Macro can open the door, but volume decides who actually walks through it.
Are you buying the flat PPI narrative here or waiting for confirmation? #USJulyPPIFlat #USJulyCPI
Everyone thinks flat PPI means instant pump, but actually that’s where a lot of overleveraged longs get baited.
The common mistake is treating the headline like a buy signal and smashing market orders on $BTC or $ETH before the second reaction hits. With fear still sitting around the market, liquidity grabs are way more likely than clean god candles.
Look at #USJulyPPIFlat as a case study. A “cool” inflation print can be bullish for rate-cut hopes, sure, but the first move is often just algos and crowded positioning. If everyone is leaning the same way, market makers love sweeping both sides before the real direction shows.
Also watch $USDT flows and stablecoin rotation, ser. If fresh bids don’t show up after the headline, that pump can turn into exit liquidity fast. Macro can open the door, but volume decides who actually walks through it.
Are you buying the flat PPI narrative here or waiting for confirmation? #USJulyPPIFlat #USJulyCPI
The common mistake is treating the headline like a buy signal and smashing market orders on $BTC or $ETH before the second reaction hits. With fear still sitting around the market, liquidity grabs are way more likely than clean god candles.
Look at #USJulyPPIFlat as a case study. A “cool” inflation print can be bullish for rate-cut hopes, sure, but the first move is often just algos and crowded positioning. If everyone is leaning the same way, market makers love sweeping both sides before the real direction shows.
Also watch $USDT flows and stablecoin rotation, ser. If fresh bids don’t show up after the headline, that pump can turn into exit liquidity fast. Macro can open the door, but volume decides who actually walks through it.
Are you buying the flat PPI narrative here or waiting for confirmation? #USJulyPPIFlat #USJulyCPI
59
⚖️📉 Goods Down, Services Up
July's flat PPI headline hides a sharp split underneath.
📉 Final-demand goods: -0.7%
📈 Final-demand services: +0.2%
📈 Final-demand construction: +2.2%
The overall index ended unchanged because these movements offset each other.
For $BTC and $ETH spot markets, the details matter more than the headline alone.
#usjulyppiflat
⚖️📉 Goods Down, Services Up
July's flat PPI headline hides a sharp split underneath.
📉 Final-demand goods: -0.7%
📈 Final-demand services: +0.2%
📈 Final-demand construction: +2.2%
The overall index ended unchanged because these movements offset each other.
For $BTC and $ETH spot markets, the details matter more than the headline alone.
#usjulyppiflat
July's flat PPI headline hides a sharp split underneath.
📉 Final-demand goods: -0.7%
📈 Final-demand services: +0.2%
📈 Final-demand construction: +2.2%
The overall index ended unchanged because these movements offset each other.
For $BTC and $ETH spot markets, the details matter more than the headline alone.
#usjulyppiflat
37
Войдите, чтобы посмотреть больше материала
Присоединяйтесь к пользователям криптовалют по всему миру на Binance Square
⚡️ Получайте новейшую и полезную информацию о криптоактивах.
💬 Нам доверяет крупнейшая в мире криптобиржа.
👍 Получите достоверные аналитические данные от верифицированных создателей контента.
Эл. почта/номер телефона
В тренде
1
#MoreHikesExpectedIsBTCUnderPressure
Просмотров: 3,276
80 обсуждают
2
#NvidiaBeatsEstimatesWith$130BQ4Outlook
Просмотров: 69,997
294 обсуждают
3
#AnthropicIPOPriceCouldExceed$80
Просмотров: 69,510
244 обсуждают
4
#RussiaCentralBankAddsAlfaBankToCryptoExchangeRegister
Просмотров: 4,912
54 обсуждают
5
#VisaPlansStablecoinPrefundingForAPACCrossBorderPayments
Просмотров: 4,978
40 обсуждают
6
#CanadaAndUSLaunchOperationNiagaraAgainstApprovalPhishing
Просмотров: 43,874
57 обсуждают
7
#BankOfEnglandUnveilsClearingHousePathwayCoveringDLTFirms
Просмотров: 4,660
66 обсуждают
8
#DBSAndCirclePartnerToExpandAsianInstitutionsUSDCAccess
Просмотров: 6,048
67 обсуждают
9
#LedgerHardwareImplantReportsExtendToDubai
Просмотров: 103,931
909 обсуждают
10
#NvidiaBoardNotConsideringHuang’sReturnasCEO
Просмотров: 280,975
1,681 обсуждают