
#multitimeframe
multitimeframe
Просмотров: 2,826
61 обсуждают
Популярные
Новые

·
--
Статья
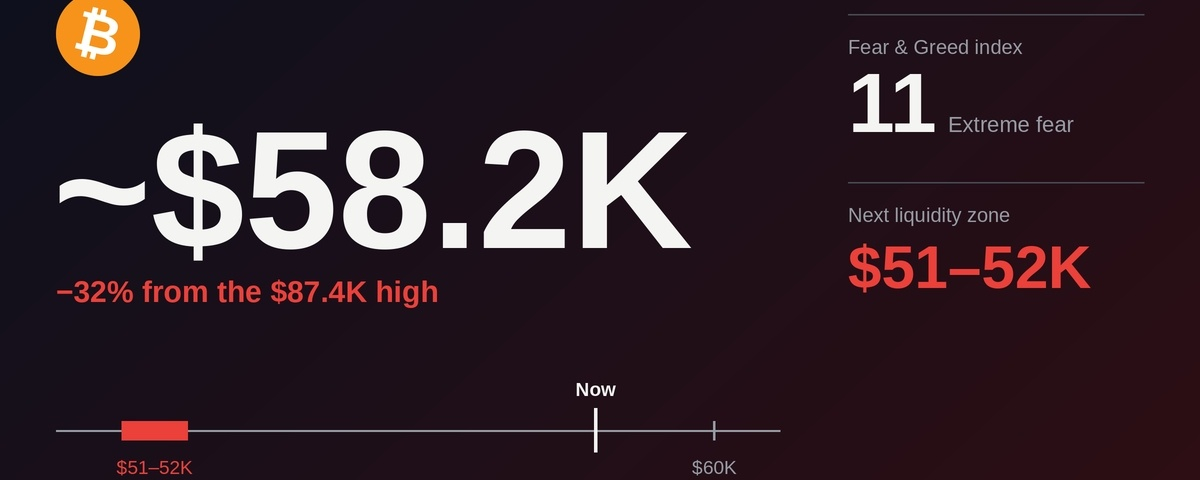
Bitcoin Breaks $60K: Is $52K the Next Liquidity Magnet?$BTC has slipped below the psychological $60,000 level and printed around $58.2K on Binance, down roughly 32% from the $87.4K daily high and about 53% below the all-time high of $126.2K. Here is what the data is showing 👀
🔹 Trend: bearish on every timeframe
Weekly: price is now below the 200-week moving average (around $68K), a key long-term line to reclaim.
Daily: below all major EMAs, with RSI at 17, a very rare oversold reading.
4H and 1H: a vertical drop, with a volume spike that looks like a capitulation candle.
🔹 Leverage: flushed, but not erased
Open interest on Binance BTC futures is around $8.3B, down more than 5% in 24 hours. Across Binance futures, open interest has dropped from its recent peak of roughly $46B to about $33B. Leverage is leaving the system, which is healthy, but the decline is not over.
🔹 Institutional flows: the pressure is coming from spot 🏛️
US spot Bitcoin ETFs keep bleeding. Outflows of hundreds of millions of dollars hit in a single day, and the monthly total is now in the billions. The institutional futures market tells the same story: open interest on CME Bitcoin futures fell about 9.5% in 24 hours to roughly $5.8B, one of the sharpest drops among the major venues. That suggests institutional players are reducing exposure. Meanwhile, Binance open interest has stayed flat while the price kept falling, which points to spot selling rather than leverage driving this latest leg down 👀 A return of ETF inflows would be one of the first signs the pressure is easing. (invezz) (coindoo)
🔹 Liquidity map: where the magnet sits
On the Binance BTCUSDT liquidation heatmap:
The dense band at $59K–$60.5K has just been swept.
A staircase of liquidity sits between $53K and $57K.
The brightest cluster below the price is at $51K–$52K.
The order book adds a warning: between $58K and $52K it looks thin, so a break can move fast.
🔹 Sentiment: extreme fear
The Fear & Greed Index is at 11, down from 64 a month ago. Extreme fear can mark bottoms, but it is a signal, not a floor.
📉 Key levels
Support: $57.8K (yearly low), $55K–$53K, then $51K–$52K.
Resistance: $60K, $61.2K–$62.2K, then $65.4K (4H EMA50).
👀 Scenarios
Bearish: a daily close below $57.8K opens the road toward the $51K–$52K liquidity zone.Rebound: with RSI this stretched and fear this deep, a relief bounce is possible. But without a return of ETF inflows, it would likely stay a bounce inside a downtrend.
The next daily close will tell us a lot. Stay patient and manage your risk 🔹
Not financial advice.
#BTC #MultiTimeFrame #liquidity
{spot}(BTCUSDT)
Bitcoin Breaks $60K: Is $52K the Next Liquidity Magnet?
$BTC has slipped below the psychological $60,000 level and printed around $58.2K on Binance, down roughly 32% from the $87.4K daily high and about 53% below the all-time high of $126.2K. Here is what the data is showing 👀
🔹 Trend: bearish on every timeframe
Weekly: price is now below the 200-week moving average (around $68K), a key long-term line to reclaim.
Daily: below all major EMAs, with RSI at 17, a very rare oversold reading.
4H and 1H: a vertical drop, with a volume spike that looks like a capitulation candle.
🔹 Leverage: flushed, but not erased
Open interest on Binance BTC futures is around $8.3B, down more than 5% in 24 hours. Across Binance futures, open interest has dropped from its recent peak of roughly $46B to about $33B. Leverage is leaving the system, which is healthy, but the decline is not over.
🔹 Institutional flows: the pressure is coming from spot 🏛️
US spot Bitcoin ETFs keep bleeding. Outflows of hundreds of millions of dollars hit in a single day, and the monthly total is now in the billions. The institutional futures market tells the same story: open interest on CME Bitcoin futures fell about 9.5% in 24 hours to roughly $5.8B, one of the sharpest drops among the major venues. That suggests institutional players are reducing exposure. Meanwhile, Binance open interest has stayed flat while the price kept falling, which points to spot selling rather than leverage driving this latest leg down 👀 A return of ETF inflows would be one of the first signs the pressure is easing. (invezz) (coindoo)
🔹 Liquidity map: where the magnet sits
On the Binance BTCUSDT liquidation heatmap:
The dense band at $59K–$60.5K has just been swept.
A staircase of liquidity sits between $53K and $57K.
The brightest cluster below the price is at $51K–$52K.
The order book adds a warning: between $58K and $52K it looks thin, so a break can move fast.
🔹 Sentiment: extreme fear
The Fear & Greed Index is at 11, down from 64 a month ago. Extreme fear can mark bottoms, but it is a signal, not a floor.
📉 Key levels
Support: $57.8K (yearly low), $55K–$53K, then $51K–$52K.
Resistance: $60K, $61.2K–$62.2K, then $65.4K (4H EMA50).
👀 Scenarios
Bearish: a daily close below $57.8K opens the road toward the $51K–$52K liquidity zone.Rebound: with RSI this stretched and fear this deep, a relief bounce is possible. But without a return of ETF inflows, it would likely stay a bounce inside a downtrend.
The next daily close will tell us a lot. Stay patient and manage your risk 🔹
Not financial advice.
#BTC #MultiTimeFrame #liquidity
🔹 Trend: bearish on every timeframe
Weekly: price is now below the 200-week moving average (around $68K), a key long-term line to reclaim.
Daily: below all major EMAs, with RSI at 17, a very rare oversold reading.
4H and 1H: a vertical drop, with a volume spike that looks like a capitulation candle.
🔹 Leverage: flushed, but not erased
Open interest on Binance BTC futures is around $8.3B, down more than 5% in 24 hours. Across Binance futures, open interest has dropped from its recent peak of roughly $46B to about $33B. Leverage is leaving the system, which is healthy, but the decline is not over.
🔹 Institutional flows: the pressure is coming from spot 🏛️
US spot Bitcoin ETFs keep bleeding. Outflows of hundreds of millions of dollars hit in a single day, and the monthly total is now in the billions. The institutional futures market tells the same story: open interest on CME Bitcoin futures fell about 9.5% in 24 hours to roughly $5.8B, one of the sharpest drops among the major venues. That suggests institutional players are reducing exposure. Meanwhile, Binance open interest has stayed flat while the price kept falling, which points to spot selling rather than leverage driving this latest leg down 👀 A return of ETF inflows would be one of the first signs the pressure is easing. (invezz) (coindoo)
🔹 Liquidity map: where the magnet sits
On the Binance BTCUSDT liquidation heatmap:
The dense band at $59K–$60.5K has just been swept.
A staircase of liquidity sits between $53K and $57K.
The brightest cluster below the price is at $51K–$52K.
The order book adds a warning: between $58K and $52K it looks thin, so a break can move fast.
🔹 Sentiment: extreme fear
The Fear & Greed Index is at 11, down from 64 a month ago. Extreme fear can mark bottoms, but it is a signal, not a floor.
📉 Key levels
Support: $57.8K (yearly low), $55K–$53K, then $51K–$52K.
Resistance: $60K, $61.2K–$62.2K, then $65.4K (4H EMA50).
👀 Scenarios
Bearish: a daily close below $57.8K opens the road toward the $51K–$52K liquidity zone.Rebound: with RSI this stretched and fear this deep, a relief bounce is possible. But without a return of ETF inflows, it would likely stay a bounce inside a downtrend.
The next daily close will tell us a lot. Stay patient and manage your risk 🔹
Not financial advice.
#BTC #MultiTimeFrame #liquidity
1
505

Статья
Multi-Timeframe Analysis: Master the Market Structure 📊📉Most traders make the mistake of relying on a single timeframe (like 5m or 15m) and end up getting trapped. Professional traders always utilize a Top-Down Approach through multi-timeframe analysis.
Understand this strategy and elevate your trading game today:
1️⃣ 4H (Major Trend): To determine the overall market direction and macro trend.
2️⃣ 1H (Key Levels): To identify major support, resistance, and liquidity zones.
3️⃣ 15m (Structure Shift): To spot market structure shifts or trend reversals.
4️⃣ 5m (Setup Formation): To locate Order Blocks and Fair Value Gaps (FVG).
5️⃣ 3m (Precise Entry): To secure precise entries with a tight stop loss (SL) and high risk-to-reward ratio (R:R).
💡 Golden Rule: Always trade in the direction of the Higher Timeframe (HTF) and execute your entries with confirmation on the Lower Timeframe (LTF)!
Which timeframe do you check first before taking a trade? Let me know in the comments below! 👇
#tradingtips #MultiTimeFrame #cryptotrading #smartmoney #BinanceSquare
Multi-Timeframe Analysis: Master the Market Structure 📊📉
Most traders make the mistake of relying on a single timeframe (like 5m or 15m) and end up getting trapped. Professional traders always utilize a Top-Down Approach through multi-timeframe analysis.
Understand this strategy and elevate your trading game today:
1️⃣ 4H (Major Trend): To determine the overall market direction and macro trend.
2️⃣ 1H (Key Levels): To identify major support, resistance, and liquidity zones.
3️⃣ 15m (Structure Shift): To spot market structure shifts or trend reversals.
4️⃣ 5m (Setup Formation): To locate Order Blocks and Fair Value Gaps (FVG).
5️⃣ 3m (Precise Entry): To secure precise entries with a tight stop loss (SL) and high risk-to-reward ratio (R:R).
💡 Golden Rule: Always trade in the direction of the Higher Timeframe (HTF) and execute your entries with confirmation on the Lower Timeframe (LTF)!
Which timeframe do you check first before taking a trade? Let me know in the comments below! 👇
#tradingtips #MultiTimeFrame #cryptotrading #smartmoney #BinanceSquare
Understand this strategy and elevate your trading game today:
1️⃣ 4H (Major Trend): To determine the overall market direction and macro trend.
2️⃣ 1H (Key Levels): To identify major support, resistance, and liquidity zones.
3️⃣ 15m (Structure Shift): To spot market structure shifts or trend reversals.
4️⃣ 5m (Setup Formation): To locate Order Blocks and Fair Value Gaps (FVG).
5️⃣ 3m (Precise Entry): To secure precise entries with a tight stop loss (SL) and high risk-to-reward ratio (R:R).
💡 Golden Rule: Always trade in the direction of the Higher Timeframe (HTF) and execute your entries with confirmation on the Lower Timeframe (LTF)!
Which timeframe do you check first before taking a trade? Let me know in the comments below! 👇
#tradingtips #MultiTimeFrame #cryptotrading #smartmoney #BinanceSquare
28

$SHELL | Why Timeframes Can Tell Different Stories
A technical summary dated October 27 showed a more positive bias on the 4-hour chart, while the weekly outlook remained neutral to weak. Some calculations also placed the 50-day average below the 200-day average.
Short-term strength does not automatically confirm a long-term trend change.
#MultiTimeframe #TrendAnalysis #PriceAction
$SHELL | Why Timeframes Can Tell Different Stories
A technical summary dated October 27 showed a more positive bias on the 4-hour chart, while the weekly outlook remained neutral to weak. Some calculations also placed the 50-day average below the 200-day average.
Short-term strength does not automatically confirm a long-term trend change.
#MultiTimeframe #TrendAnalysis #PriceAction
A technical summary dated October 27 showed a more positive bias on the 4-hour chart, while the weekly outlook remained neutral to weak. Some calculations also placed the 50-day average below the 200-day average.
Short-term strength does not automatically confirm a long-term trend change.
#MultiTimeframe #TrendAnalysis #PriceAction

30
·
--
Статья
Multi-Timeframe Analysis: Explained Simply📘 What is Multi-Timeframe Analysis?
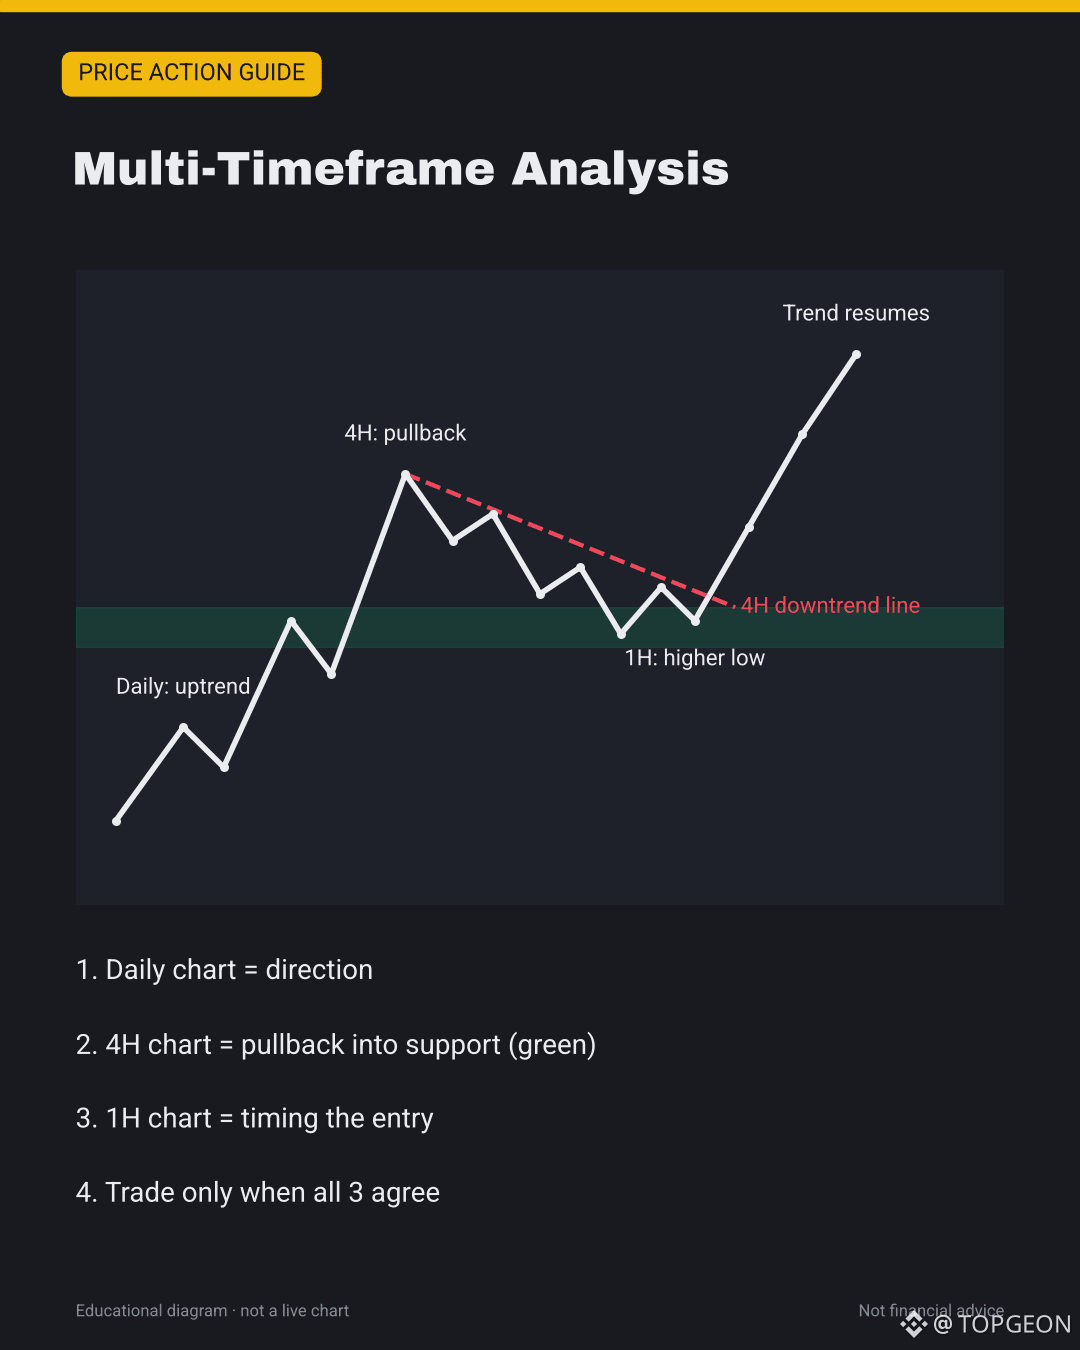
Multi-timeframe analysis means reading the same coin on three charts before you trade: a big one, a middle one and a small one. Each chart answers a different question.
Most beginners stare at one chart only. Then a "breakout" on the 15-minute chart runs straight into a wall that was obvious on the daily chart. Looking higher first saves you from that.
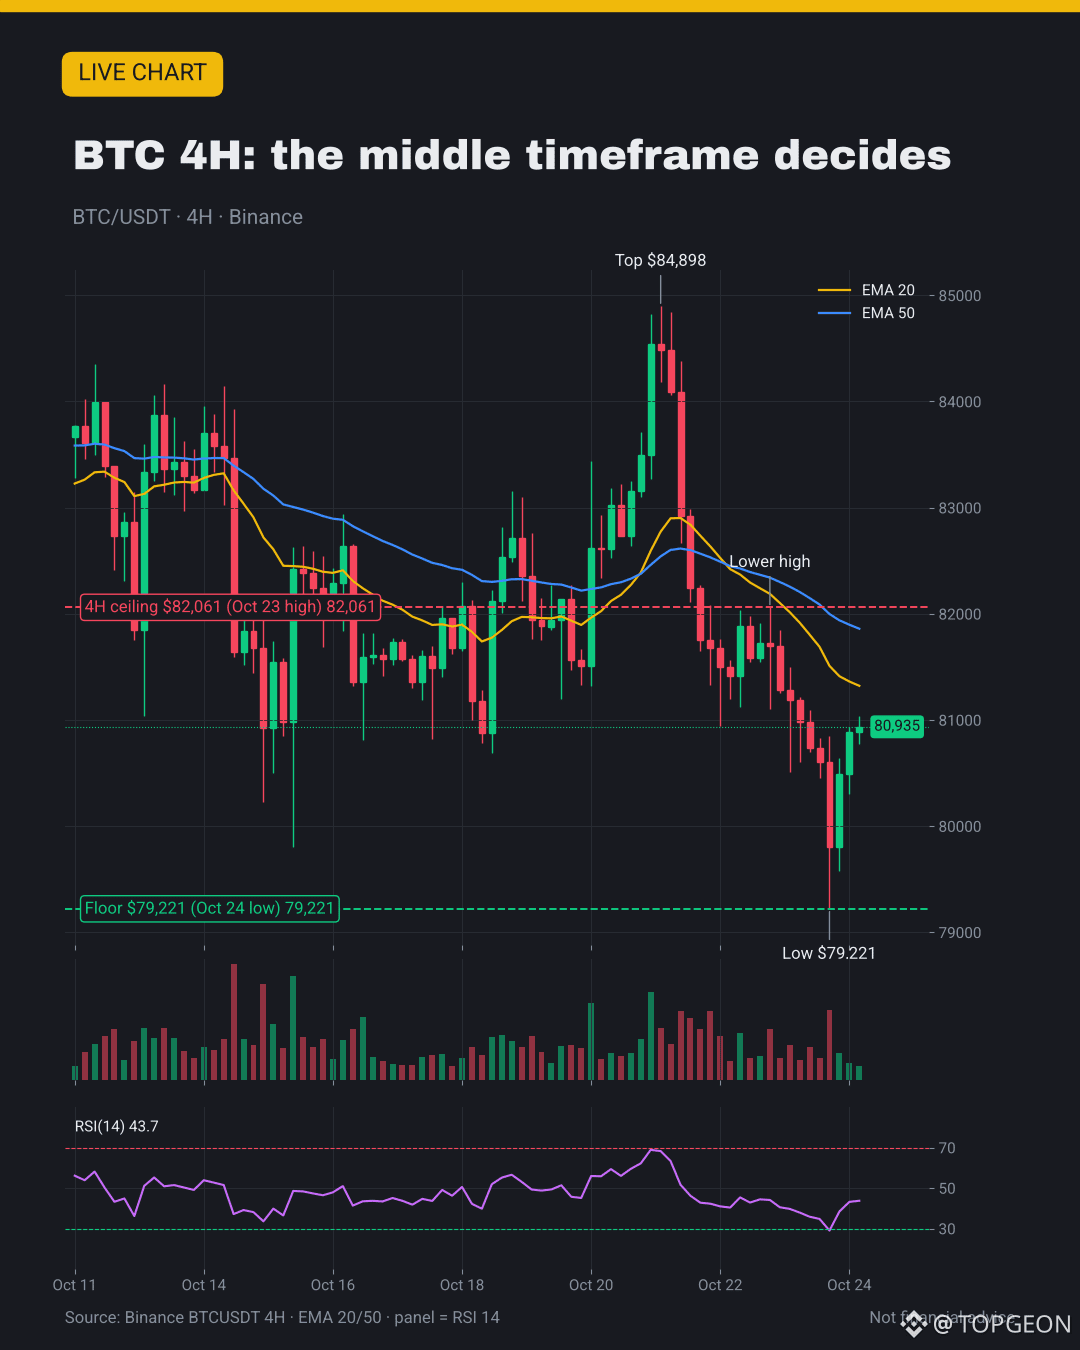
📊 Live chart in the cover and in the image post below.
🔍 How to spot it
• Pick a set where each chart is about 4-6x the next one. Swing traders: Daily, 4H, 1H. Day traders: 4H, 1H, 15m
• Higher timeframe (Daily): what is the main trend? Higher highs and higher lows, or lower highs and lower lows?
• Middle timeframe (4H): where are the key zones? Mark the nearest floor and ceiling
• Lower timeframe (1H): is price turning at that zone right now?
• If all three point the same way, the setup is strong. If they disagree, it is a warning
📈 How traders use it
• Entry: trade in the direction of the higher timeframe, at a middle-timeframe zone, when the lower timeframe turns (for example, a 1H higher low at 4H support in a daily uptrend)
• Stop-loss: beyond the zone you used on the middle chart, not just beyond the last small candle
• Target: the next ceiling or floor on the middle or higher chart
• Higher timeframe always wins a conflict. A 1H buy signal inside a daily downtrend is a counter-trend trade: size down or skip it
🧪 Live example: $BTC right now
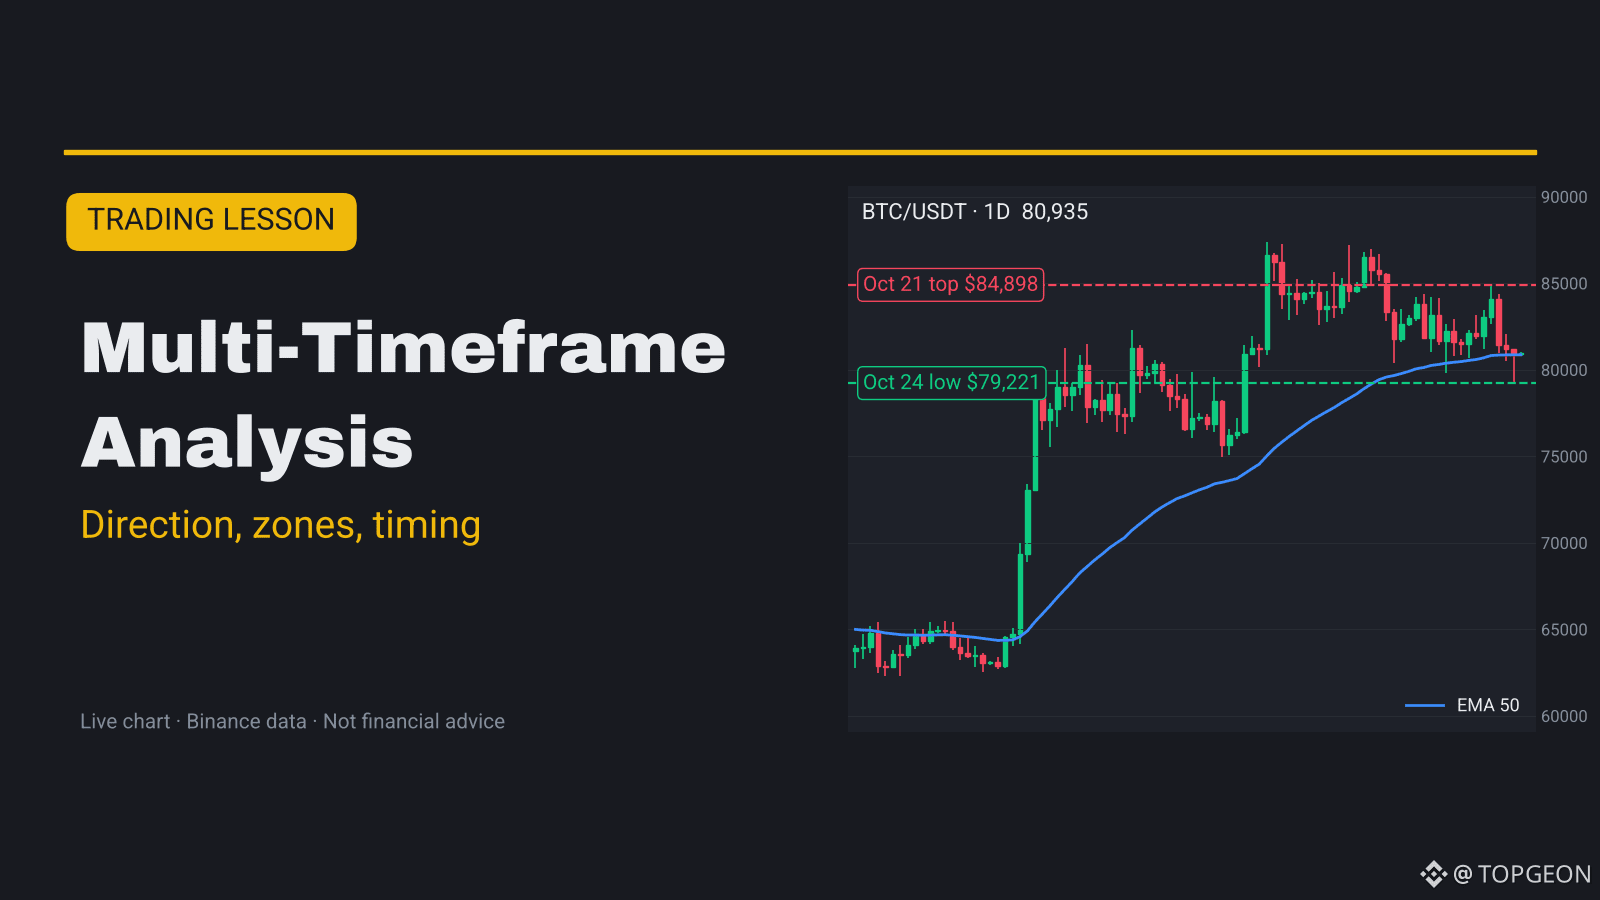
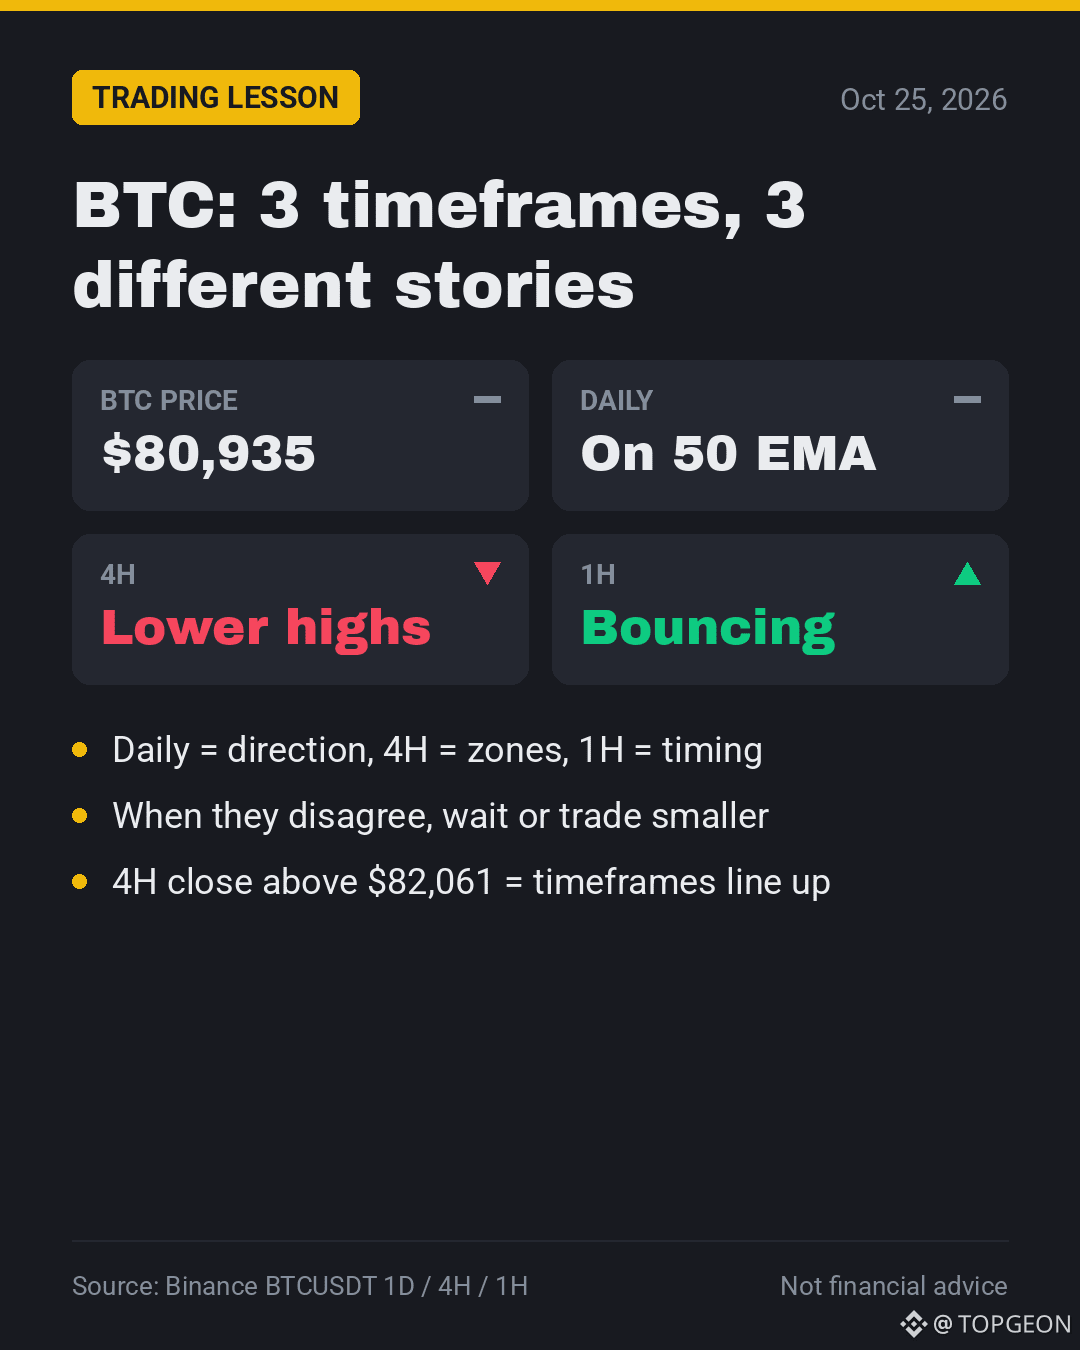
• Daily: the big picture is still up. BTC sits far above the 200 EMA (~$76.5K) after the summer run from the low $60Ks. But daily tops are getting lower: $87,396 (Sep 21), $87,000 (Oct 5), $84,898 (Oct 21). Price is now testing the daily 50 EMA (~$80.9K), RSI 44.5. So: uptrend, but losing steam
• 4H: clearly down. Lower highs since the $84,898 top: $82,061 (Oct 23), then $81,097 (Oct 24). Price is under the 4H 20 and 50 EMA (~$81.3K / ~$81.9K), RSI 44
• 1H: bouncing. After the $79,221 low (Oct 24, 15:00 UTC) it made higher lows at $79,580 and $80,305 and is now near $80.9K, above the 1H 20 EMA, RSI 54
• Verdict: the timeframes do NOT agree. The 1H bounce is going up into a 4H downtrend. A multi-timeframe trader waits
• What would line them up: a 4H close above $82,061 (breaks the lower-high chain) while the daily holds its 50 EMA. A drop back under $79,221 would turn the daily bearish too
⚠️ Common mistakes
• Using timeframes that are too close (5m and 15m tell the same story)
• Using too many charts and freezing. Three is enough
• Letting the small chart override the big one because a candle looks exciting
• Switching timeframes after entering to find a reason to stay in a losing trade
✅ Quick checklist
• Daily first: write down the trend in one word
• 4H next: mark one floor and one ceiling
• 1H last: wait for a turn at that zone
• Trade only when all three agree, or cut your size
• Stop beyond the 4H zone, risk 1-2% per trade
💬 Which timeframe do you check first before a trade? 👇
Not financial advice. DYOR.
#TradingTips #MultiTimeframe #Bitcoin
Multi-Timeframe Analysis: Explained Simply
📘 What is Multi-Timeframe Analysis?
Multi-timeframe analysis means reading the same coin on three charts before you trade: a big one, a middle one and a small one. Each chart answers a different question.
Most beginners stare at one chart only. Then a "breakout" on the 15-minute chart runs straight into a wall that was obvious on the daily chart. Looking higher first saves you from that.
📊 Live chart in the cover and in the image post below.
🔍 How to spot it
• Pick a set where each chart is about 4-6x the next one. Swing traders: Daily, 4H, 1H. Day traders: 4H, 1H, 15m
• Higher timeframe (Daily): what is the main trend? Higher highs and higher lows, or lower highs and lower lows?
• Middle timeframe (4H): where are the key zones? Mark the nearest floor and ceiling
• Lower timeframe (1H): is price turning at that zone right now?
• If all three point the same way, the setup is strong. If they disagree, it is a warning
📈 How traders use it
• Entry: trade in the direction of the higher timeframe, at a middle-timeframe zone, when the lower timeframe turns (for example, a 1H higher low at 4H support in a daily uptrend)
• Stop-loss: beyond the zone you used on the middle chart, not just beyond the last small candle
• Target: the next ceiling or floor on the middle or higher chart
• Higher timeframe always wins a conflict. A 1H buy signal inside a daily downtrend is a counter-trend trade: size down or skip it
🧪 Live example: $BTC right now
• Daily: the big picture is still up. BTC sits far above the 200 EMA (~$76.5K) after the summer run from the low $60Ks. But daily tops are getting lower: $87,396 (Sep 21), $87,000 (Oct 5), $84,898 (Oct 21). Price is now testing the daily 50 EMA (~$80.9K), RSI 44.5. So: uptrend, but losing steam
• 4H: clearly down. Lower highs since the $84,898 top: $82,061 (Oct 23), then $81,097 (Oct 24). Price is under the 4H 20 and 50 EMA (~$81.3K / ~$81.9K), RSI 44
• 1H: bouncing. After the $79,221 low (Oct 24, 15:00 UTC) it made higher lows at $79,580 and $80,305 and is now near $80.9K, above the 1H 20 EMA, RSI 54
• Verdict: the timeframes do NOT agree. The 1H bounce is going up into a 4H downtrend. A multi-timeframe trader waits
• What would line them up: a 4H close above $82,061 (breaks the lower-high chain) while the daily holds its 50 EMA. A drop back under $79,221 would turn the daily bearish too
⚠️ Common mistakes
• Using timeframes that are too close (5m and 15m tell the same story)
• Using too many charts and freezing. Three is enough
• Letting the small chart override the big one because a candle looks exciting
• Switching timeframes after entering to find a reason to stay in a losing trade
✅ Quick checklist
• Daily first: write down the trend in one word
• 4H next: mark one floor and one ceiling
• 1H last: wait for a turn at that zone
• Trade only when all three agree, or cut your size
• Stop beyond the 4H zone, risk 1-2% per trade
💬 Which timeframe do you check first before a trade? 👇
Not financial advice. DYOR.
#TradingTips #MultiTimeframe #Bitcoin
Multi-timeframe analysis means reading the same coin on three charts before you trade: a big one, a middle one and a small one. Each chart answers a different question.
Most beginners stare at one chart only. Then a "breakout" on the 15-minute chart runs straight into a wall that was obvious on the daily chart. Looking higher first saves you from that.
📊 Live chart in the cover and in the image post below.
🔍 How to spot it
• Pick a set where each chart is about 4-6x the next one. Swing traders: Daily, 4H, 1H. Day traders: 4H, 1H, 15m
• Higher timeframe (Daily): what is the main trend? Higher highs and higher lows, or lower highs and lower lows?
• Middle timeframe (4H): where are the key zones? Mark the nearest floor and ceiling
• Lower timeframe (1H): is price turning at that zone right now?
• If all three point the same way, the setup is strong. If they disagree, it is a warning
📈 How traders use it
• Entry: trade in the direction of the higher timeframe, at a middle-timeframe zone, when the lower timeframe turns (for example, a 1H higher low at 4H support in a daily uptrend)
• Stop-loss: beyond the zone you used on the middle chart, not just beyond the last small candle
• Target: the next ceiling or floor on the middle or higher chart
• Higher timeframe always wins a conflict. A 1H buy signal inside a daily downtrend is a counter-trend trade: size down or skip it
🧪 Live example: $BTC right now
• Daily: the big picture is still up. BTC sits far above the 200 EMA (~$76.5K) after the summer run from the low $60Ks. But daily tops are getting lower: $87,396 (Sep 21), $87,000 (Oct 5), $84,898 (Oct 21). Price is now testing the daily 50 EMA (~$80.9K), RSI 44.5. So: uptrend, but losing steam
• 4H: clearly down. Lower highs since the $84,898 top: $82,061 (Oct 23), then $81,097 (Oct 24). Price is under the 4H 20 and 50 EMA (~$81.3K / ~$81.9K), RSI 44
• 1H: bouncing. After the $79,221 low (Oct 24, 15:00 UTC) it made higher lows at $79,580 and $80,305 and is now near $80.9K, above the 1H 20 EMA, RSI 54
• Verdict: the timeframes do NOT agree. The 1H bounce is going up into a 4H downtrend. A multi-timeframe trader waits
• What would line them up: a 4H close above $82,061 (breaks the lower-high chain) while the daily holds its 50 EMA. A drop back under $79,221 would turn the daily bearish too
⚠️ Common mistakes
• Using timeframes that are too close (5m and 15m tell the same story)
• Using too many charts and freezing. Three is enough
• Letting the small chart override the big one because a candle looks exciting
• Switching timeframes after entering to find a reason to stay in a losing trade
✅ Quick checklist
• Daily first: write down the trend in one word
• 4H next: mark one floor and one ceiling
• 1H last: wait for a turn at that zone
• Trade only when all three agree, or cut your size
• Stop beyond the 4H zone, risk 1-2% per trade
💬 Which timeframe do you check first before a trade? 👇
Not financial advice. DYOR.
#TradingTips #MultiTimeframe #Bitcoin
92
·
--
🤔 Is this $BTC bounce real, or is just the small chart talking?
📈 Hourly chart: bouncing nicely off $79.2K.
📉 4-hour chart: still lower tops since $84.9K.
🧭 Daily chart: big uptrend, but running out of steam.
🎯 My take: wait for a 4-hour close above $82K so all three agree.
💬 Which chart do you check first? 👇
📖 Full lesson: https://app.binance.com/uni-qr/cart/380963969114151
#MultiTimeframe #Bitcoin
🤔 Is this $BTC bounce real, or is just the small chart talking?
📈 Hourly chart: bouncing nicely off $79.2K.
📉 4-hour chart: still lower tops since $84.9K.
🧭 Daily chart: big uptrend, but running out of steam.
🎯 My take: wait for a 4-hour close above $82K so all three agree.
💬 Which chart do you check first? 👇
📖 Full lesson: https://app.binance.com/uni-qr/cart/380963969114151
#MultiTimeframe #Bitcoin
📈 Hourly chart: bouncing nicely off $79.2K.
📉 4-hour chart: still lower tops since $84.9K.
🧭 Daily chart: big uptrend, but running out of steam.
🎯 My take: wait for a 4-hour close above $82K so all three agree.
💬 Which chart do you check first? 👇
📖 Full lesson: https://app.binance.com/uni-qr/cart/380963969114151
#MultiTimeframe #Bitcoin
86

·
--
Рост
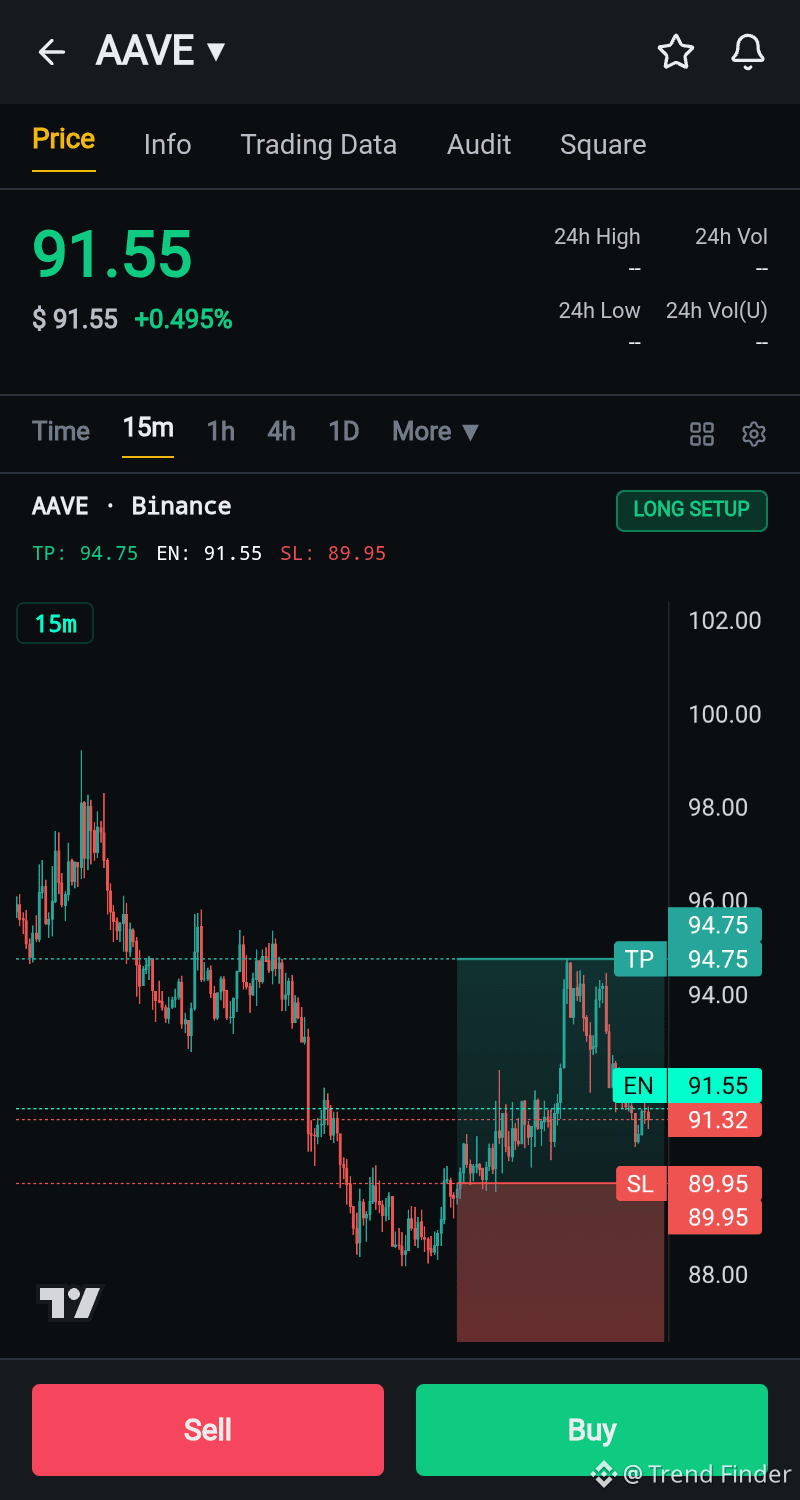
🚀 $AAVE Alert! Strong macro bullish trend detected on 1D/4H. We're seeing a healthy pullback, but the 1H MACD just gave a bullish cross near the EMA50! 📈 Potential 'buy the dip' setup for a rally continuation. Don't miss this opportunity! #CryptoTrading #MultiTimeframe #AAVEUSDT
{future}(AAVEUSDT)
🚀 $AAVE Alert! Strong macro bullish trend detected on 1D/4H. We're seeing a healthy pullback, but the 1H MACD just gave a bullish cross near the EMA50! 📈 Potential 'buy the dip' setup for a rally continuation. Don't miss this opportunity! #CryptoTrading #MultiTimeframe #AAVEUSDT

Congratulations 🎉
От Trend Finder
1
1
30
·
--
Падение
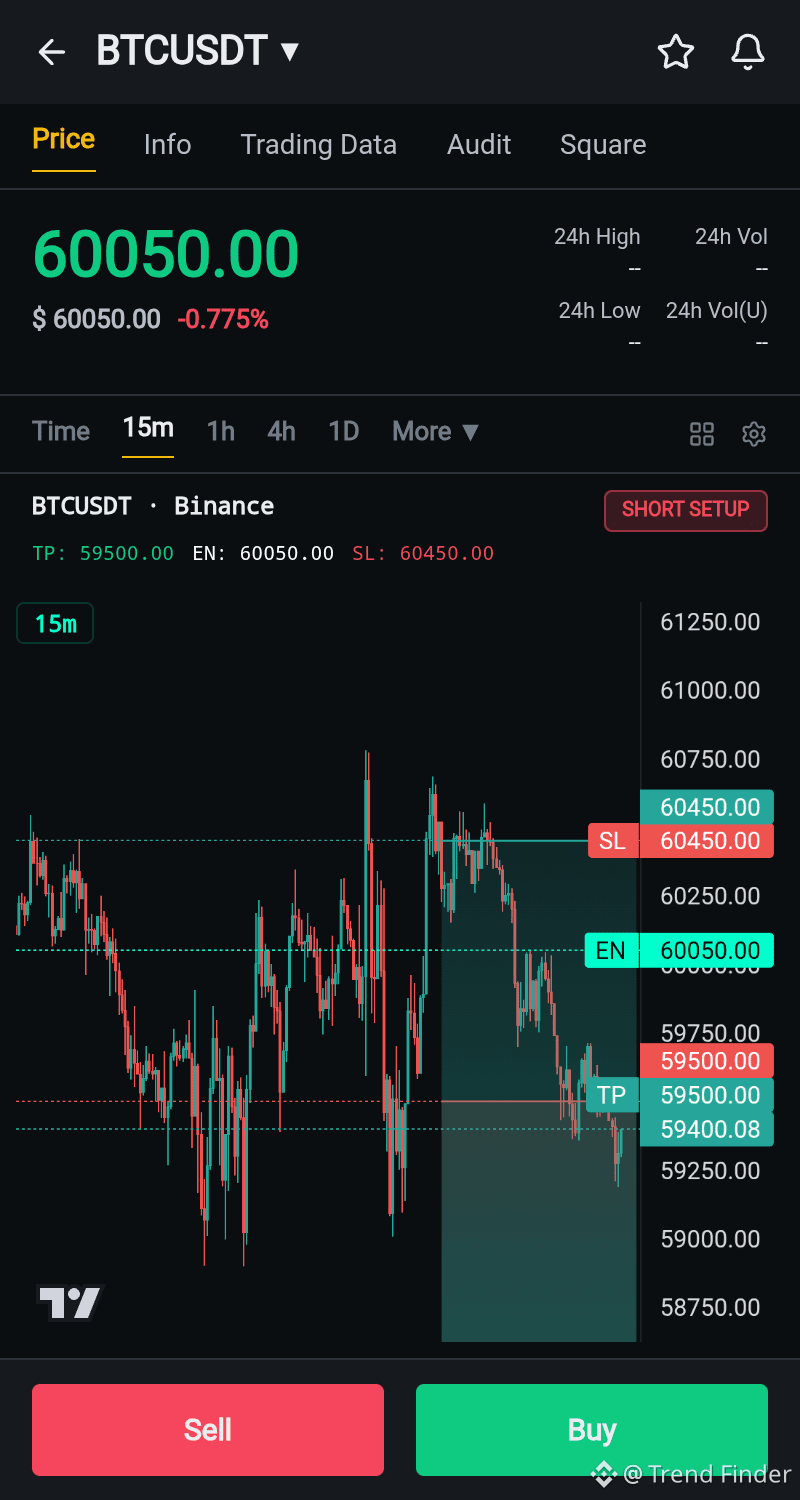
🚨 $BTC Deep Scan Alert! 🚨 Macro trend is STRONGLY BEARISH (1D/4h below all EMAs, high ADX). While 1D RSI is oversold & MACD histograms hint at a bounce, we anticipate a trend continuation after a retest of resistance. High-probability SHORT setup identified! 📉
Entry: 60050
SL: 60450
TP1: 59500
TP2: 58800
R/R 3.125! Plan your trade, trade your plan! #BTC #Crypto #Trading #ShortSetup #MultiTimeframe
🚨 $BTC Deep Scan Alert! 🚨 Macro trend is STRONGLY BEARISH (1D/4h below all EMAs, high ADX). While 1D RSI is oversold & MACD histograms hint at a bounce, we anticipate a trend continuation after a retest of resistance. High-probability SHORT setup identified! 📉
Entry: 60050
SL: 60450
TP1: 59500
TP2: 58800
R/R 3.125! Plan your trade, trade your plan! #BTC #Crypto #Trading #ShortSetup #MultiTimeframe
Entry: 60050
SL: 60450
TP1: 59500
TP2: 58800
R/R 3.125! Plan your trade, trade your plan! #BTC #Crypto #Trading #ShortSetup #MultiTimeframe
56

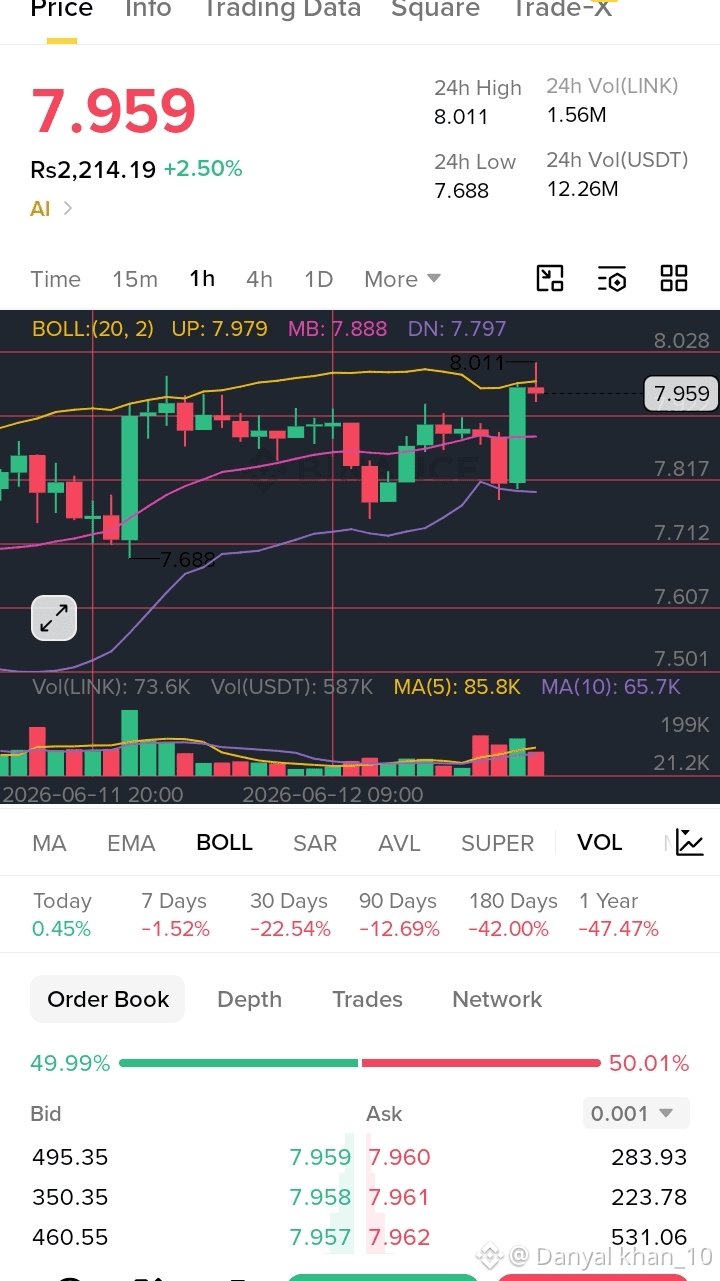
$LINK /USDT – 15m / 1h / 1D Multi-Timeframe Analysis 🔗
Current Price: $7.959 | +2.50%
24h High: $8.011 | 24h Low: $7.688
🔹 15m Chart
Bollinger Bands: UP 7.979 / MB 7.888 / DN 7.797
Price near upper band – slight resistance at $8.00.
Volume: 73.6K LINK (below MA5) – momentum slowing.
🔹 1h Chart
Trend: Mild bullish. Price above MB 7.888.
Support: 7.88 | Resistance: 8.01 (24h high)
Break above 8.01 = target 8.15.
🔹 1D Chart (Daily)
Bollinger Bands: Price trading above MB after downtrend.
30-Day: -22.54% | 90-Day: -12.69% (still recovering).
Major resistance: 8.30 | Strong support: 7.50
📊 Order Book: 49.99% Buy | 50.01% Sell – perfectly balanced (no clear bias).
💡 Trade Idea:
✅ Short-term: Small long above 7.98, SL 7.87, T1 8.01, T2 8.15
❌ Long-term: Wait for breakout above 8.30 or dip to 7.70.
Use 2% risk only – low volatility right now.
#LINKUSDT #Chainlink #MultiTimeframe #BinanceSquare
$LINK
{spot}(LINKUSDT)
$LINK /USDT – 15m / 1h / 1D Multi-Timeframe Analysis 🔗
Current Price: $7.959 | +2.50%
24h High: $8.011 | 24h Low: $7.688
🔹 15m Chart
Bollinger Bands: UP 7.979 / MB 7.888 / DN 7.797
Price near upper band – slight resistance at $8.00.
Volume: 73.6K LINK (below MA5) – momentum slowing.
🔹 1h Chart
Trend: Mild bullish. Price above MB 7.888.
Support: 7.88 | Resistance: 8.01 (24h high)
Break above 8.01 = target 8.15.
🔹 1D Chart (Daily)
Bollinger Bands: Price trading above MB after downtrend.
30-Day: -22.54% | 90-Day: -12.69% (still recovering).
Major resistance: 8.30 | Strong support: 7.50
📊 Order Book: 49.99% Buy | 50.01% Sell – perfectly balanced (no clear bias).
💡 Trade Idea:
✅ Short-term: Small long above 7.98, SL 7.87, T1 8.01, T2 8.15
❌ Long-term: Wait for breakout above 8.30 or dip to 7.70.
Use 2% risk only – low volatility right now.
#LINKUSDT #Chainlink #MultiTimeframe #BinanceSquare
$LINK
Current Price: $7.959 | +2.50%
24h High: $8.011 | 24h Low: $7.688
🔹 15m Chart
Bollinger Bands: UP 7.979 / MB 7.888 / DN 7.797
Price near upper band – slight resistance at $8.00.
Volume: 73.6K LINK (below MA5) – momentum slowing.
🔹 1h Chart
Trend: Mild bullish. Price above MB 7.888.
Support: 7.88 | Resistance: 8.01 (24h high)
Break above 8.01 = target 8.15.
🔹 1D Chart (Daily)
Bollinger Bands: Price trading above MB after downtrend.
30-Day: -22.54% | 90-Day: -12.69% (still recovering).
Major resistance: 8.30 | Strong support: 7.50
📊 Order Book: 49.99% Buy | 50.01% Sell – perfectly balanced (no clear bias).
💡 Trade Idea:
✅ Short-term: Small long above 7.98, SL 7.87, T1 8.01, T2 8.15
❌ Long-term: Wait for breakout above 8.30 or dip to 7.70.
Use 2% risk only – low volatility right now.
#LINKUSDT #Chainlink #MultiTimeframe #BinanceSquare
$LINK
1
30
$SHELL — Tổng quan 20/8: các timeframe vẫn chưa hoàn toàn đồng thuận
$SHELL hiện giao dịch quanh 0.0209 USDT.
📊 Hôm nay: -0.48%
📊 Rolling 24H: +0.97%
📊 Rolling 7D: +7.18%
📊 Tuần hiện tại: gần 0% so với giá mở tuần
Các vùng đáng chú ý:
📍 0.0208
Đáy phiên hôm nay.
📍 0.0204–0.0206
Vùng hỗ trợ gần và cũng gần weighted average 24H.
📍 0.0214
Đỉnh ngày và đỉnh rolling 24H.
📍 0.0220
Đỉnh 7D và đỉnh tuần hiện tại.
Dữ liệu ngắn hạn đang khá cân bằng: 7D vẫn tích cực nhưng phiên hôm nay gần như đi ngang quanh mức mở cửa.
Thị trường cần thêm dữ liệu để xác nhận liệu $SHELL sẽ tiếp tục tích lũy hay mở rộng biên dao động.
#SHELL #MultiTimeframe #CryptoAnalysis #Binance
$SHELL — Tổng quan 20/8: các timeframe vẫn chưa hoàn toàn đồng thuận
$SHELL hiện giao dịch quanh 0.0209 USDT.
📊 Hôm nay: -0.48%
📊 Rolling 24H: +0.97%
📊 Rolling 7D: +7.18%
📊 Tuần hiện tại: gần 0% so với giá mở tuần
Các vùng đáng chú ý:
📍 0.0208
Đáy phiên hôm nay.
📍 0.0204–0.0206
Vùng hỗ trợ gần và cũng gần weighted average 24H.
📍 0.0214
Đỉnh ngày và đỉnh rolling 24H.
📍 0.0220
Đỉnh 7D và đỉnh tuần hiện tại.
Dữ liệu ngắn hạn đang khá cân bằng: 7D vẫn tích cực nhưng phiên hôm nay gần như đi ngang quanh mức mở cửa.
Thị trường cần thêm dữ liệu để xác nhận liệu $SHELL sẽ tiếp tục tích lũy hay mở rộng biên dao động.
#SHELL #MultiTimeframe #CryptoAnalysis #Binance
$SHELL hiện giao dịch quanh 0.0209 USDT.
📊 Hôm nay: -0.48%
📊 Rolling 24H: +0.97%
📊 Rolling 7D: +7.18%
📊 Tuần hiện tại: gần 0% so với giá mở tuần
Các vùng đáng chú ý:
📍 0.0208
Đáy phiên hôm nay.
📍 0.0204–0.0206
Vùng hỗ trợ gần và cũng gần weighted average 24H.
📍 0.0214
Đỉnh ngày và đỉnh rolling 24H.
📍 0.0220
Đỉnh 7D và đỉnh tuần hiện tại.
Dữ liệu ngắn hạn đang khá cân bằng: 7D vẫn tích cực nhưng phiên hôm nay gần như đi ngang quanh mức mở cửa.
Thị trường cần thêm dữ liệu để xác nhận liệu $SHELL sẽ tiếp tục tích lũy hay mở rộng biên dao động.
#SHELL #MultiTimeframe #CryptoAnalysis #Binance
63
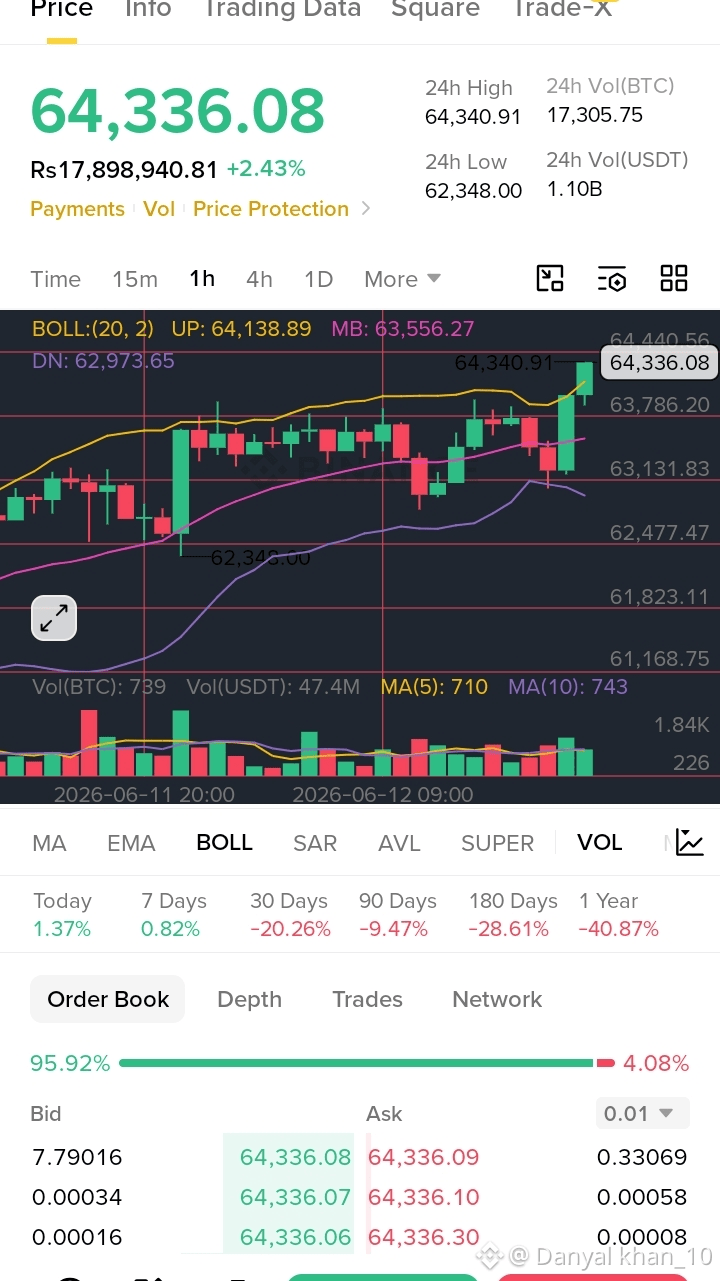
$BTC /USDT – 15m / 1h / 1D Multi-Timeframe Analysis 🔥
Current Price: $64,336 | +2.43%
24h High: $64,340 | 24h Low: $62,973
🔹 15m Chart
Bollinger Bands: UP 64,138 / MB 63,556 / DN 62,973
Price above upper band – overextended. Small pullback likely.
Support: 64,100 | Resistance: 64,340
🔹 1h Chart
Trend: Bullish. Price holding above MB 63,556.
Volume: 739 BTC (avg). Break above 64,350 = next leg up to 64,800.
🔹 1D Chart (Daily)
Bollinger Bands widening – momentum increasing.
Price near upper band. Major resistance at 65,000.
Support: 63,500 (MB) | Strong support: 62,900 (DN)
📊 Order Book: 95.9% Buy | 4.1% Sell – extremely bullish sentiment.
📅 Performance Today: +1.37% | 30 Days: -20.26% | 1 Year: -40.87%
💡 Trade Idea:
✅ Short-term (15m/1h): Long on dip to 64,100–64,200
🎯 Target: 64,800 / 65,000
🛑 SL: 63,900
⏳ Long-term (Daily): Wait for confirmation above 65,000.
Use 2x leverage max for futures. Spot: hold if you believe in uptrend.
#BTCUSDT #Bitcoin #MultiTimeframe #BinanceSquare
$BTC
{spot}(BTCUSDT)
$BTC /USDT – 15m / 1h / 1D Multi-Timeframe Analysis 🔥
Current Price: $64,336 | +2.43%
24h High: $64,340 | 24h Low: $62,973
🔹 15m Chart
Bollinger Bands: UP 64,138 / MB 63,556 / DN 62,973
Price above upper band – overextended. Small pullback likely.
Support: 64,100 | Resistance: 64,340
🔹 1h Chart
Trend: Bullish. Price holding above MB 63,556.
Volume: 739 BTC (avg). Break above 64,350 = next leg up to 64,800.
🔹 1D Chart (Daily)
Bollinger Bands widening – momentum increasing.
Price near upper band. Major resistance at 65,000.
Support: 63,500 (MB) | Strong support: 62,900 (DN)
📊 Order Book: 95.9% Buy | 4.1% Sell – extremely bullish sentiment.
📅 Performance Today: +1.37% | 30 Days: -20.26% | 1 Year: -40.87%
💡 Trade Idea:
✅ Short-term (15m/1h): Long on dip to 64,100–64,200
🎯 Target: 64,800 / 65,000
🛑 SL: 63,900
⏳ Long-term (Daily): Wait for confirmation above 65,000.
Use 2x leverage max for futures. Spot: hold if you believe in uptrend.
#BTCUSDT #Bitcoin #MultiTimeframe #BinanceSquare
$BTC
Current Price: $64,336 | +2.43%
24h High: $64,340 | 24h Low: $62,973
🔹 15m Chart
Bollinger Bands: UP 64,138 / MB 63,556 / DN 62,973
Price above upper band – overextended. Small pullback likely.
Support: 64,100 | Resistance: 64,340
🔹 1h Chart
Trend: Bullish. Price holding above MB 63,556.
Volume: 739 BTC (avg). Break above 64,350 = next leg up to 64,800.
🔹 1D Chart (Daily)
Bollinger Bands widening – momentum increasing.
Price near upper band. Major resistance at 65,000.
Support: 63,500 (MB) | Strong support: 62,900 (DN)
📊 Order Book: 95.9% Buy | 4.1% Sell – extremely bullish sentiment.
📅 Performance Today: +1.37% | 30 Days: -20.26% | 1 Year: -40.87%
💡 Trade Idea:
✅ Short-term (15m/1h): Long on dip to 64,100–64,200
🎯 Target: 64,800 / 65,000
🛑 SL: 63,900
⏳ Long-term (Daily): Wait for confirmation above 65,000.
Use 2x leverage max for futures. Spot: hold if you believe in uptrend.
#BTCUSDT #Bitcoin #MultiTimeframe #BinanceSquare
$BTC
1
121
$SHELL — So sánh nến tháng 7 và tuần vừa đóng
Hai timeframe đang cho thấy hai cấu trúc khác nhau của $SHELL
📊 Tháng 7: Open: 0.0209 Close: 0.0180 Thay đổi: -13.88% Low: 0.0174
📊 Tuần vừa đóng: Open: 0.0181 Close: 0.0211 Thay đổi: +16.57% Low: 0.0176
Tháng 7 kết thúc với mức đóng cửa thấp hơn giá mở tháng, trong khi tuần vừa qua ghi nhận phản ứng ngược lại từ vùng 0.017x.
Tuy nhiên nến tuần cũng từng chạm 0.0255 trước khi đóng tại 0.0211.
Dữ liệu cho thấy sự phục hồi trên timeframe ngắn hơn, trong khi cấu trúc tháng 7 đã hoàn thành vẫn ghi nhận một tháng giảm.
#SHELL #MultiTimeframe #Binance
$SHELL — So sánh nến tháng 7 và tuần vừa đóng
Hai timeframe đang cho thấy hai cấu trúc khác nhau của $SHELL
📊 Tháng 7: Open: 0.0209 Close: 0.0180 Thay đổi: -13.88% Low: 0.0174
📊 Tuần vừa đóng: Open: 0.0181 Close: 0.0211 Thay đổi: +16.57% Low: 0.0176
Tháng 7 kết thúc với mức đóng cửa thấp hơn giá mở tháng, trong khi tuần vừa qua ghi nhận phản ứng ngược lại từ vùng 0.017x.
Tuy nhiên nến tuần cũng từng chạm 0.0255 trước khi đóng tại 0.0211.
Dữ liệu cho thấy sự phục hồi trên timeframe ngắn hơn, trong khi cấu trúc tháng 7 đã hoàn thành vẫn ghi nhận một tháng giảm.
#SHELL #MultiTimeframe #Binance
Hai timeframe đang cho thấy hai cấu trúc khác nhau của $SHELL
📊 Tháng 7: Open: 0.0209 Close: 0.0180 Thay đổi: -13.88% Low: 0.0174
📊 Tuần vừa đóng: Open: 0.0181 Close: 0.0211 Thay đổi: +16.57% Low: 0.0176
Tháng 7 kết thúc với mức đóng cửa thấp hơn giá mở tháng, trong khi tuần vừa qua ghi nhận phản ứng ngược lại từ vùng 0.017x.
Tuy nhiên nến tuần cũng từng chạm 0.0255 trước khi đóng tại 0.0211.
Dữ liệu cho thấy sự phục hồi trên timeframe ngắn hơn, trong khi cấu trúc tháng 7 đã hoàn thành vẫn ghi nhận một tháng giảm.
#SHELL #MultiTimeframe #Binance
16
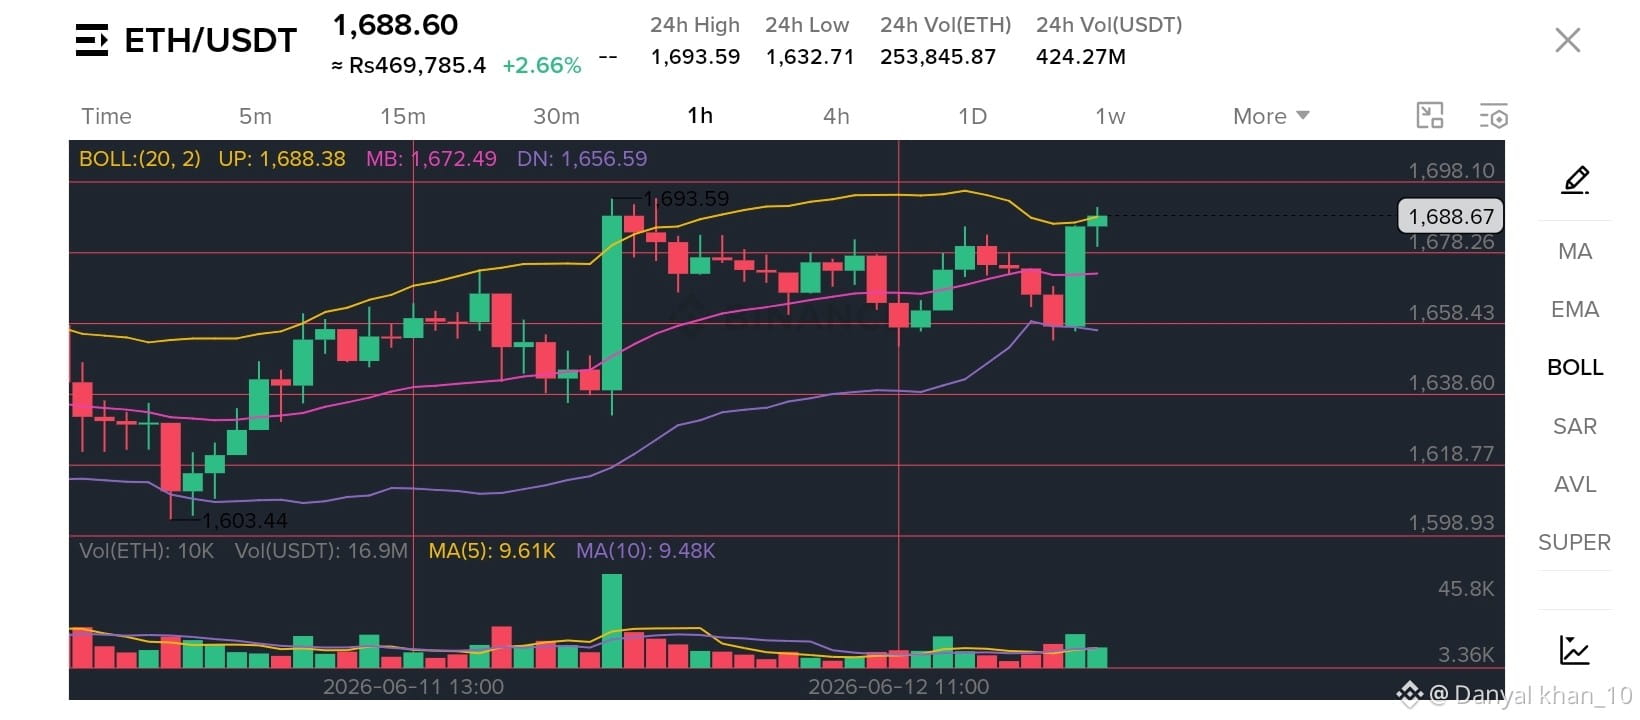
$ETH /USDT – 15m / 1h / 1D Analysis 💎
Current Price: $1,688.60 | +2.66%
24h High: $1,693.59 | 24h Low: $1,632.71
🔹 15m Chart
Bollinger Bands: UP 1,688 / MB 1,672 / DN 1,656
Price at upper band – testing resistance.
Volume: 10K ETH (above avg). Break above 1,693 = move to 1,700.
🔹 1h Chart
Trend: Bullish. Price above MB 1,672.
Support: 1,672 | Resistance: 1,693
Hold above 1,680 = continuation.
🔹 1D Chart (Daily)
Bollinger Bands: UP 1,688 / MB 1,672 / DN 1,656
Price breaking above upper band after consolidation.
Major resistance: 1,720 | Strong support: 1,650
📊 Volume (24h): ETH 253K | USDT 424M – healthy buying.
📅 Performance: +2.66% today | Down -20-40% in longer timeframes.
💡 Trade Idea:
✅ Short-term: Long above 1,693, SL 1,675, T1 1,710
✅ Long-term: Accumulate on dip to 1,650–1,660
Use 2-3% risk only. Spot preferred.
#ETHUSDT #Ethereum #MultiTimeframe #BinanceSquare
$ETH
{spot}(ETHUSDT)
$ETH /USDT – 15m / 1h / 1D Analysis 💎
Current Price: $1,688.60 | +2.66%
24h High: $1,693.59 | 24h Low: $1,632.71
🔹 15m Chart
Bollinger Bands: UP 1,688 / MB 1,672 / DN 1,656
Price at upper band – testing resistance.
Volume: 10K ETH (above avg). Break above 1,693 = move to 1,700.
🔹 1h Chart
Trend: Bullish. Price above MB 1,672.
Support: 1,672 | Resistance: 1,693
Hold above 1,680 = continuation.
🔹 1D Chart (Daily)
Bollinger Bands: UP 1,688 / MB 1,672 / DN 1,656
Price breaking above upper band after consolidation.
Major resistance: 1,720 | Strong support: 1,650
📊 Volume (24h): ETH 253K | USDT 424M – healthy buying.
📅 Performance: +2.66% today | Down -20-40% in longer timeframes.
💡 Trade Idea:
✅ Short-term: Long above 1,693, SL 1,675, T1 1,710
✅ Long-term: Accumulate on dip to 1,650–1,660
Use 2-3% risk only. Spot preferred.
#ETHUSDT #Ethereum #MultiTimeframe #BinanceSquare
$ETH
Current Price: $1,688.60 | +2.66%
24h High: $1,693.59 | 24h Low: $1,632.71
🔹 15m Chart
Bollinger Bands: UP 1,688 / MB 1,672 / DN 1,656
Price at upper band – testing resistance.
Volume: 10K ETH (above avg). Break above 1,693 = move to 1,700.
🔹 1h Chart
Trend: Bullish. Price above MB 1,672.
Support: 1,672 | Resistance: 1,693
Hold above 1,680 = continuation.
🔹 1D Chart (Daily)
Bollinger Bands: UP 1,688 / MB 1,672 / DN 1,656
Price breaking above upper band after consolidation.
Major resistance: 1,720 | Strong support: 1,650
📊 Volume (24h): ETH 253K | USDT 424M – healthy buying.
📅 Performance: +2.66% today | Down -20-40% in longer timeframes.
💡 Trade Idea:
✅ Short-term: Long above 1,693, SL 1,675, T1 1,710
✅ Long-term: Accumulate on dip to 1,650–1,660
Use 2-3% risk only. Spot preferred.
#ETHUSDT #Ethereum #MultiTimeframe #BinanceSquare
$ETH
1
73
·
--
Падение
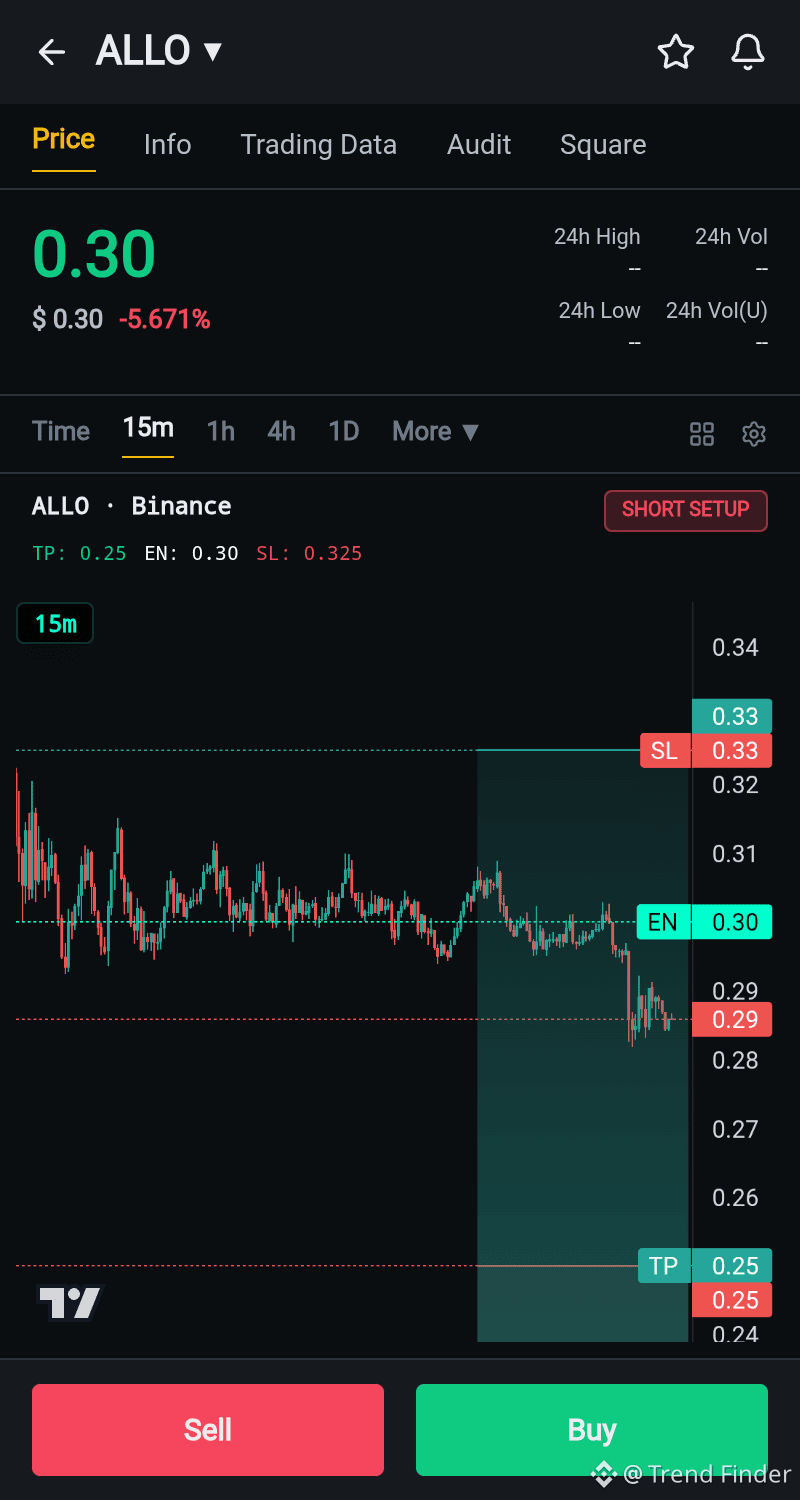
🚨 $ALLO shows strong multi-timeframe bearish signals. While 1D EMAs are bullish, price is correcting hard below 20-EMA. Daily MACD just crossed bearish with high ADX! 📉 4H, 1H, 15M charts confirm bearish momentum. Current price at critical 1D 50-EMA support.
We're eyeing a SHORT setup on a bounce to retest resistance around 0.30.
Entry: 0.30
SL: 0.325
TP1: 0.25 (1:2 RR)
TP2: 0.225 (1:3 RR)
Trade smart & follow the trend! #ALLO #TradingSignals #ShortSetup #MultiTimeframe
{future}(ALLOUSDT)
🚨 $ALLO shows strong multi-timeframe bearish signals. While 1D EMAs are bullish, price is correcting hard below 20-EMA. Daily MACD just crossed bearish with high ADX! 📉 4H, 1H, 15M charts confirm bearish momentum. Current price at critical 1D 50-EMA support.
We're eyeing a SHORT setup on a bounce to retest resistance around 0.30.
Entry: 0.30
SL: 0.325
TP1: 0.25 (1:2 RR)
TP2: 0.225 (1:3 RR)
Trade smart & follow the trend! #ALLO #TradingSignals #ShortSetup #MultiTimeframe
We're eyeing a SHORT setup on a bounce to retest resistance around 0.30.
Entry: 0.30
SL: 0.325
TP1: 0.25 (1:2 RR)
TP2: 0.225 (1:3 RR)
Trade smart & follow the trend! #ALLO #TradingSignals #ShortSetup #MultiTimeframe
1
372
$SHELL — August 20 overview: timeframes remain mixed
$SHELL is currently trading around 0.0209 USDT.
📊 Today: -0.48%
📊 Rolling 24H: +0.97%
📊 Rolling 7D: +7.18%
📊 Current week: nearly flat versus the weekly open
Key areas to monitor:
📍 0.0208
Today’s session low.
📍 0.0204–0.0206
Nearby support and close to the 24-hour weighted average.
📍 0.0214
Daily and rolling 24-hour high.
📍 0.0220
Rolling 7-day high and current weekly high.
Short-term data remains relatively balanced: the 7-day structure is still positive, while today’s session is trading close to its opening level.
More data is needed to determine whether $SHELL continues consolidating or begins expanding its current trading range.
#SHELL #MultiTimeframe #CryptoAnalysis #Binance
$SHELL — August 20 overview: timeframes remain mixed
$SHELL is currently trading around 0.0209 USDT.
📊 Today: -0.48%
📊 Rolling 24H: +0.97%
📊 Rolling 7D: +7.18%
📊 Current week: nearly flat versus the weekly open
Key areas to monitor:
📍 0.0208
Today’s session low.
📍 0.0204–0.0206
Nearby support and close to the 24-hour weighted average.
📍 0.0214
Daily and rolling 24-hour high.
📍 0.0220
Rolling 7-day high and current weekly high.
Short-term data remains relatively balanced: the 7-day structure is still positive, while today’s session is trading close to its opening level.
More data is needed to determine whether $SHELL continues consolidating or begins expanding its current trading range.
#SHELL #MultiTimeframe #CryptoAnalysis #Binance
$SHELL is currently trading around 0.0209 USDT.
📊 Today: -0.48%
📊 Rolling 24H: +0.97%
📊 Rolling 7D: +7.18%
📊 Current week: nearly flat versus the weekly open
Key areas to monitor:
📍 0.0208
Today’s session low.
📍 0.0204–0.0206
Nearby support and close to the 24-hour weighted average.
📍 0.0214
Daily and rolling 24-hour high.
📍 0.0220
Rolling 7-day high and current weekly high.
Short-term data remains relatively balanced: the 7-day structure is still positive, while today’s session is trading close to its opening level.
More data is needed to determine whether $SHELL continues consolidating or begins expanding its current trading range.
#SHELL #MultiTimeframe #CryptoAnalysis #Binance
91

#MultiTimeframe #MarketStructure
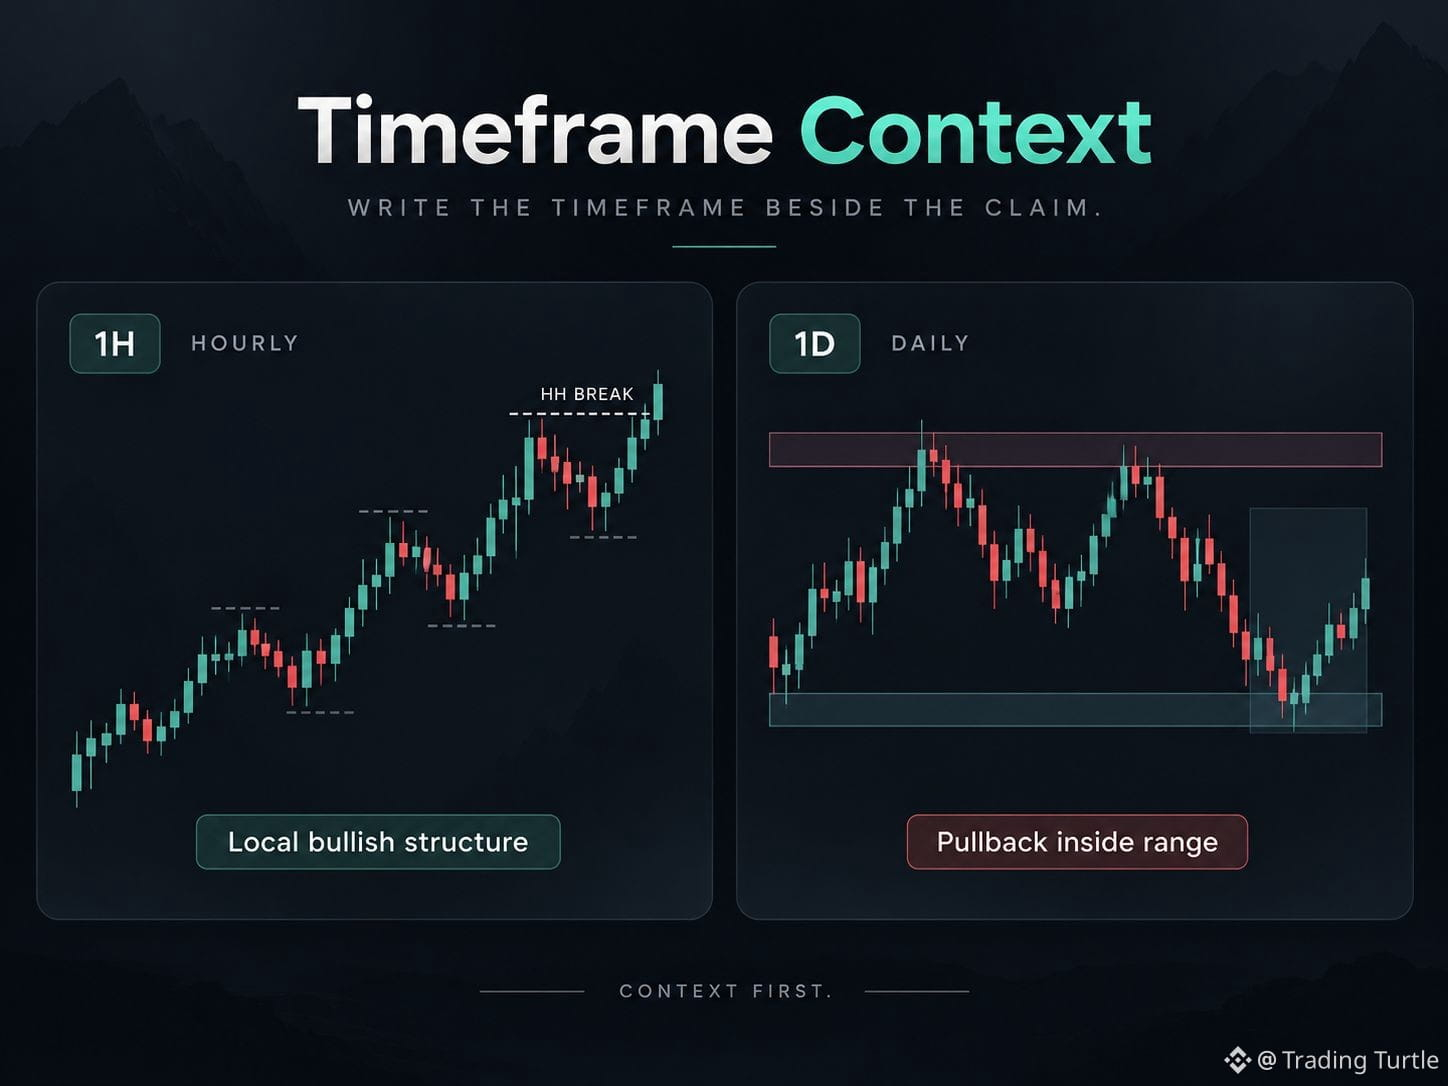
Timeframe context: An hourly chart can show a rising sequence while the daily chart is still pulling back inside a larger range. That is not automatically a contradiction: the candles describe different intervals.
Write the timeframe beside the claim. “The hourly swing high was broken” is more precise than “the trend reversed.”
Use the higher timeframe to describe context and the chosen analysis timeframe to test its own reference. Switching charts until one agrees with your prediction hides the disagreement instead of explaining it.
A higher timeframe provides context, not a guarantee that a lower-timeframe pattern will work.
#MultiTimeframe #MarketStructure
Timeframe context: An hourly chart can show a rising sequence while the daily chart is still pulling back inside a larger range. That is not automatically a contradiction: the candles describe different intervals.
Write the timeframe beside the claim. “The hourly swing high was broken” is more precise than “the trend reversed.”
Use the higher timeframe to describe context and the chosen analysis timeframe to test its own reference. Switching charts until one agrees with your prediction hides the disagreement instead of explaining it.
A higher timeframe provides context, not a guarantee that a lower-timeframe pattern will work.
Timeframe context: An hourly chart can show a rising sequence while the daily chart is still pulling back inside a larger range. That is not automatically a contradiction: the candles describe different intervals.
Write the timeframe beside the claim. “The hourly swing high was broken” is more precise than “the trend reversed.”
Use the higher timeframe to describe context and the chosen analysis timeframe to test its own reference. Switching charts until one agrees with your prediction hides the disagreement instead of explaining it.
A higher timeframe provides context, not a guarantee that a lower-timeframe pattern will work.
78
·
--
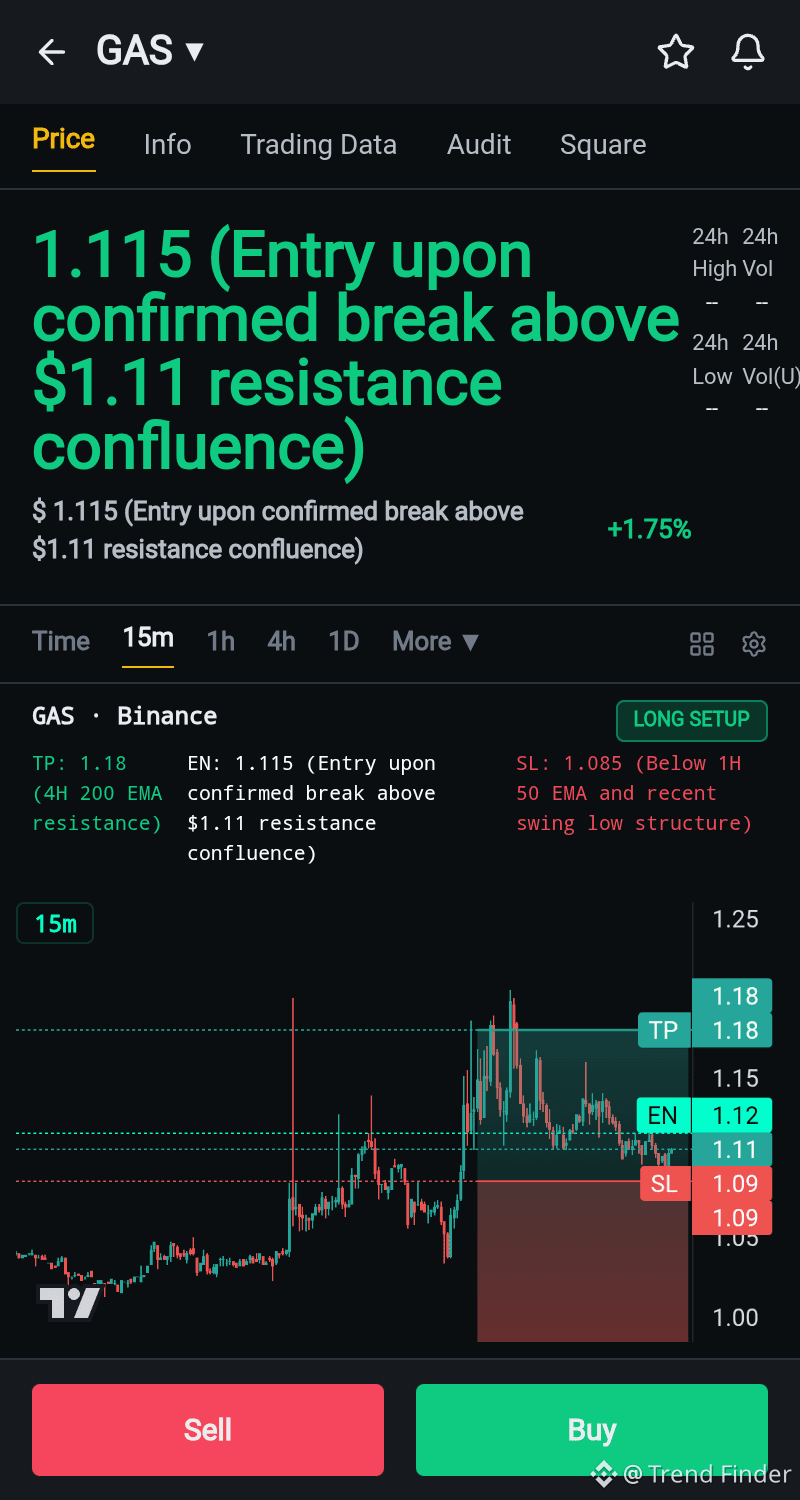
🔥 $GAS Alert! sees a multi-timeframe bullish shift despite macro trend! Daily MACD crossover + strong 4H momentum setup a potential LONG. We're looking for a breakout above 1.11. Target 1.18! 🚀 $GAS
#CryptoTrading #TradeSetup #Bullish #MultiTimeframe
{future}(GASUSDT)
🔥 $GAS Alert! sees a multi-timeframe bullish shift despite macro trend! Daily MACD crossover + strong 4H momentum setup a potential LONG. We're looking for a breakout above 1.11. Target 1.18! 🚀 $GAS
#CryptoTrading #TradeSetup #Bullish #MultiTimeframe
#CryptoTrading #TradeSetup #Bullish #MultiTimeframe
1
74
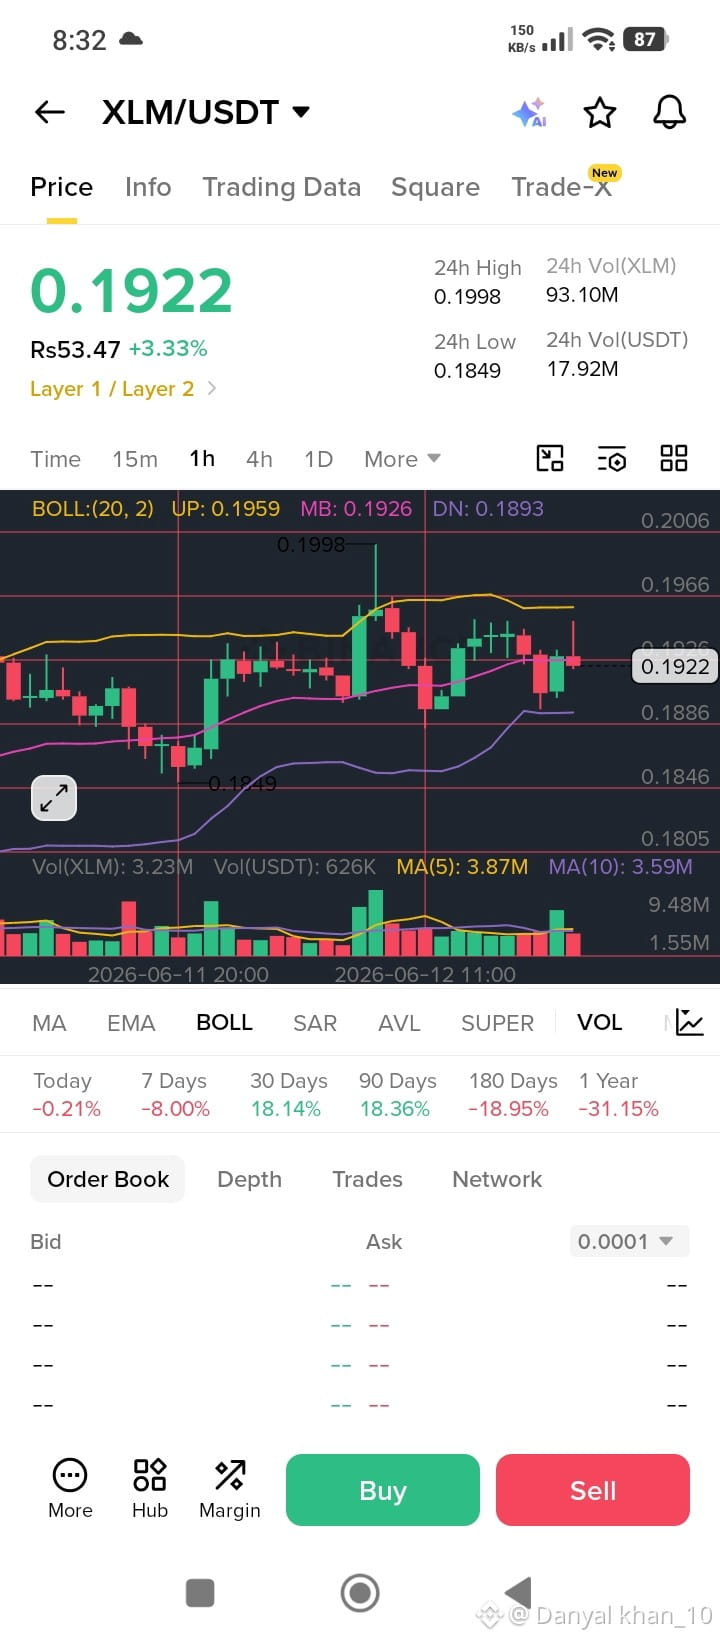
$XLM /USDT – 15m / 1h / 1D Analysis ⭐
Current Price: $0.1922 | +3.33%
24h High: $0.2006 | 24h Low: $0.1886
🔹 15m Chart
Bollinger Bands: UP 0.1959 / MB 0.1926 / DN 0.1893
Price near middle band – consolidating.
Volume: 3.23M XLM (below MA5) – low momentum.
🔹 1h Chart
Trend: Sideways to mild bullish. Price exactly at MB 0.1926.
Support: 0.1893 (DN) | Resistance: 0.1959 (UP)
Break either side = direction.
🔹 1D Chart (Daily)
Bollinger Bands: Price between MB and UP.
30-Day: +18.14% | 90-Day: +18.36% – healthy uptrend.
Major resistance: 0.2006 | Support: 0.1805
📊 Order Book: Data not fully visible, but 30-day trend is bullish.
💡 Trade Idea:
✅ Long above 0.1930, SL 0.1890, T1 0.1960, T2 0.2006
❌ Short only if breaks below 0.1880.
Patience required – low volatility right now.
#XLMUSDT #Stellar #MultiTimeframe
$XLM
{spot}(XLMUSDT)
$XLM /USDT – 15m / 1h / 1D Analysis ⭐
Current Price: $0.1922 | +3.33%
24h High: $0.2006 | 24h Low: $0.1886
🔹 15m Chart
Bollinger Bands: UP 0.1959 / MB 0.1926 / DN 0.1893
Price near middle band – consolidating.
Volume: 3.23M XLM (below MA5) – low momentum.
🔹 1h Chart
Trend: Sideways to mild bullish. Price exactly at MB 0.1926.
Support: 0.1893 (DN) | Resistance: 0.1959 (UP)
Break either side = direction.
🔹 1D Chart (Daily)
Bollinger Bands: Price between MB and UP.
30-Day: +18.14% | 90-Day: +18.36% – healthy uptrend.
Major resistance: 0.2006 | Support: 0.1805
📊 Order Book: Data not fully visible, but 30-day trend is bullish.
💡 Trade Idea:
✅ Long above 0.1930, SL 0.1890, T1 0.1960, T2 0.2006
❌ Short only if breaks below 0.1880.
Patience required – low volatility right now.
#XLMUSDT #Stellar #MultiTimeframe
$XLM
Current Price: $0.1922 | +3.33%
24h High: $0.2006 | 24h Low: $0.1886
🔹 15m Chart
Bollinger Bands: UP 0.1959 / MB 0.1926 / DN 0.1893
Price near middle band – consolidating.
Volume: 3.23M XLM (below MA5) – low momentum.
🔹 1h Chart
Trend: Sideways to mild bullish. Price exactly at MB 0.1926.
Support: 0.1893 (DN) | Resistance: 0.1959 (UP)
Break either side = direction.
🔹 1D Chart (Daily)
Bollinger Bands: Price between MB and UP.
30-Day: +18.14% | 90-Day: +18.36% – healthy uptrend.
Major resistance: 0.2006 | Support: 0.1805
📊 Order Book: Data not fully visible, but 30-day trend is bullish.
💡 Trade Idea:
✅ Long above 0.1930, SL 0.1890, T1 0.1960, T2 0.2006
❌ Short only if breaks below 0.1880.
Patience required – low volatility right now.
#XLMUSDT #Stellar #MultiTimeframe
$XLM
1
35
·
--
Падение
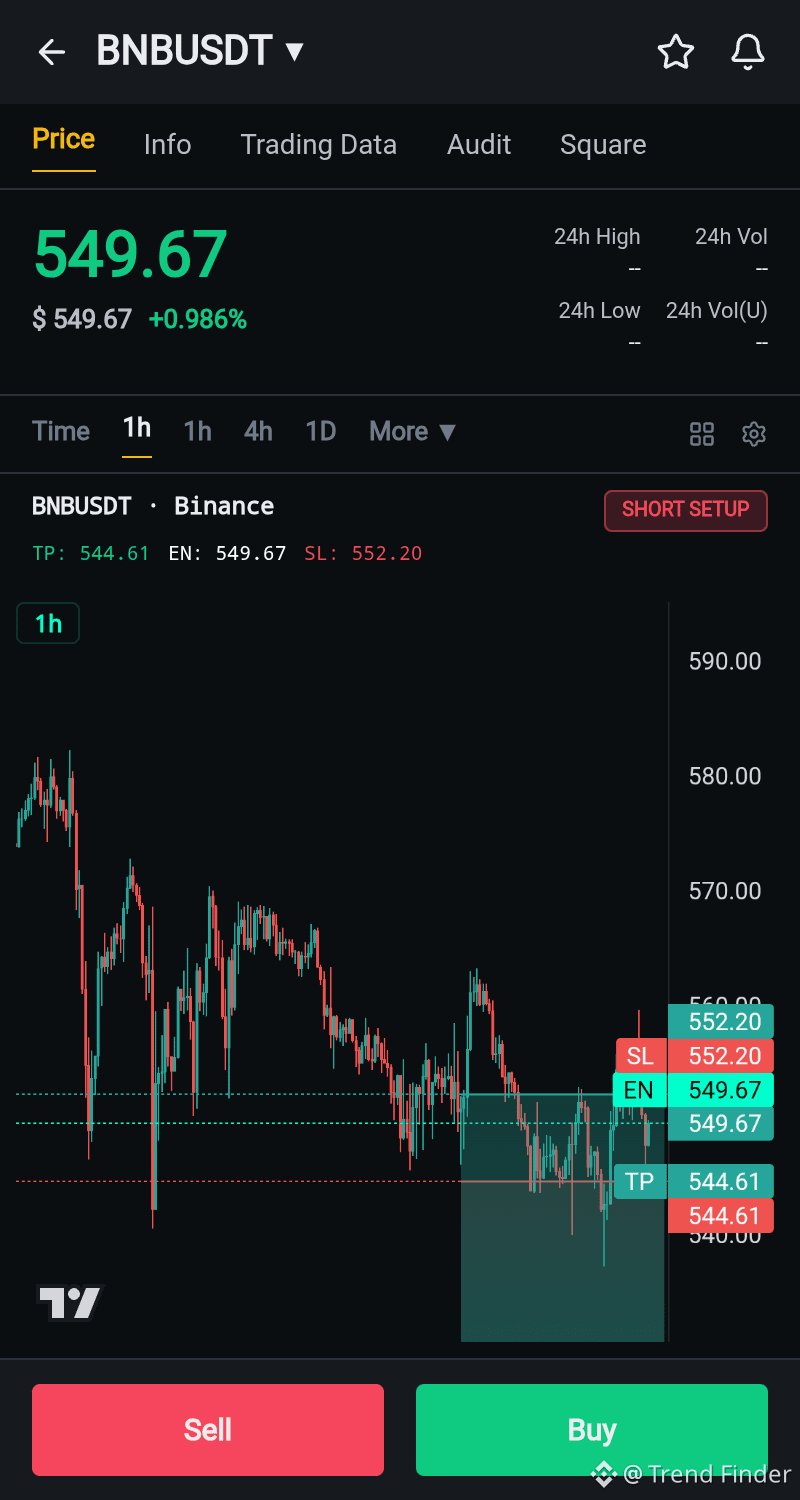
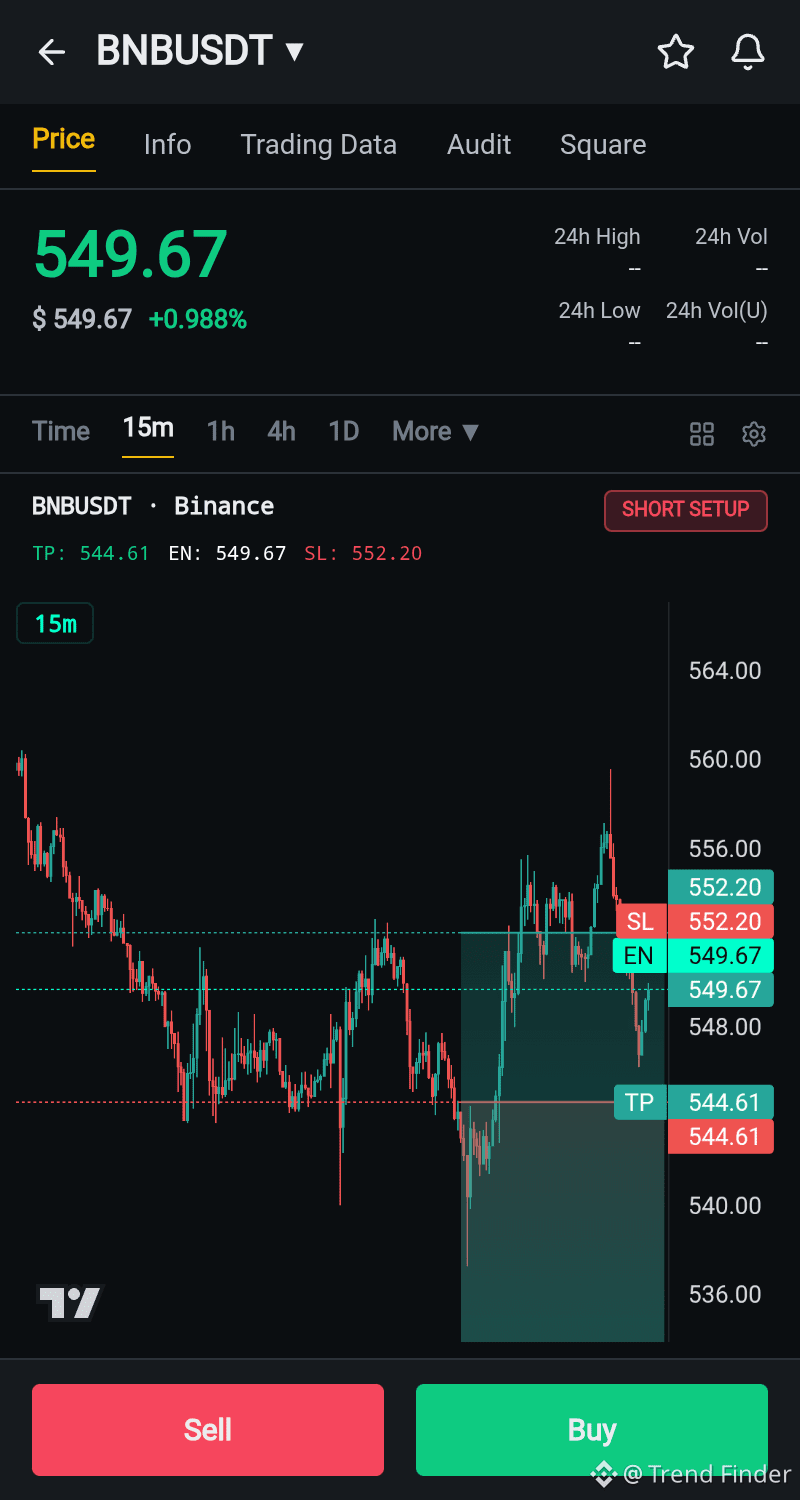
🚨 $BNB Deep Scan Alert! 📉 Macro trend is firmly #bearish across 1D & 4h timeframes, with price below all major EMAs. Current price 549.67 finding immediate resistance. Looking for continuation of the downtrend. Setup with tight SL & solid 1:2 / 1:3 RR. #BNB #CryptoTrading #ShortSetup #MultiTimeframe
{spot}(BNBUSDT)
🚨 $BNB Deep Scan Alert! 📉 Macro trend is firmly #bearish across 1D & 4h timeframes, with price below all major EMAs. Current price 549.67 finding immediate resistance. Looking for continuation of the downtrend. Setup with tight SL & solid 1:2 / 1:3 RR. #BNB #CryptoTrading #ShortSetup #MultiTimeframe
3
1
200
$SHELL — Các khung thời gian đang cho kết quả rất khác nhau
Dữ liệu Binance hiện cho thấy $SHELL có sự phân hóa rõ theo từng khoảng thời gian.
📊 Hôm nay theo UTC+7: +1.54% Price: 0.0198
📊 Rolling 24H: 0.00%
📊 Rolling 7D: +7.61%
📊 Tuần hiện tại: Open 0.0212 → 0.0198 Khoảng -6.60%
📊 Tháng 8 hiện tại: Open 0.0180 → 0.0198 +10.00%
Cùng một mức giá 0.0198 nhưng kết quả thay đổi tùy vào mốc bắt đầu của từng timeframe.
Đây cũng là lý do dữ liệu ngày, 24H, 7D, tuần và tháng không nên được dùng thay thế cho nhau khi mô tả diễn biến $SHELL
#SHELL #MultiTimeframe #CryptoAnalysis #Binance
$SHELL — Các khung thời gian đang cho kết quả rất khác nhau
Dữ liệu Binance hiện cho thấy $SHELL có sự phân hóa rõ theo từng khoảng thời gian.
📊 Hôm nay theo UTC+7: +1.54% Price: 0.0198
📊 Rolling 24H: 0.00%
📊 Rolling 7D: +7.61%
📊 Tuần hiện tại: Open 0.0212 → 0.0198 Khoảng -6.60%
📊 Tháng 8 hiện tại: Open 0.0180 → 0.0198 +10.00%
Cùng một mức giá 0.0198 nhưng kết quả thay đổi tùy vào mốc bắt đầu của từng timeframe.
Đây cũng là lý do dữ liệu ngày, 24H, 7D, tuần và tháng không nên được dùng thay thế cho nhau khi mô tả diễn biến $SHELL
#SHELL #MultiTimeframe #CryptoAnalysis #Binance
Dữ liệu Binance hiện cho thấy $SHELL có sự phân hóa rõ theo từng khoảng thời gian.
📊 Hôm nay theo UTC+7: +1.54% Price: 0.0198
📊 Rolling 24H: 0.00%
📊 Rolling 7D: +7.61%
📊 Tuần hiện tại: Open 0.0212 → 0.0198 Khoảng -6.60%
📊 Tháng 8 hiện tại: Open 0.0180 → 0.0198 +10.00%
Cùng một mức giá 0.0198 nhưng kết quả thay đổi tùy vào mốc bắt đầu của từng timeframe.
Đây cũng là lý do dữ liệu ngày, 24H, 7D, tuần và tháng không nên được dùng thay thế cho nhau khi mô tả diễn biến $SHELL
#SHELL #MultiTimeframe #CryptoAnalysis #Binance
35
$BNB /USDT – 15m / 1h / 1D Analysis 💼
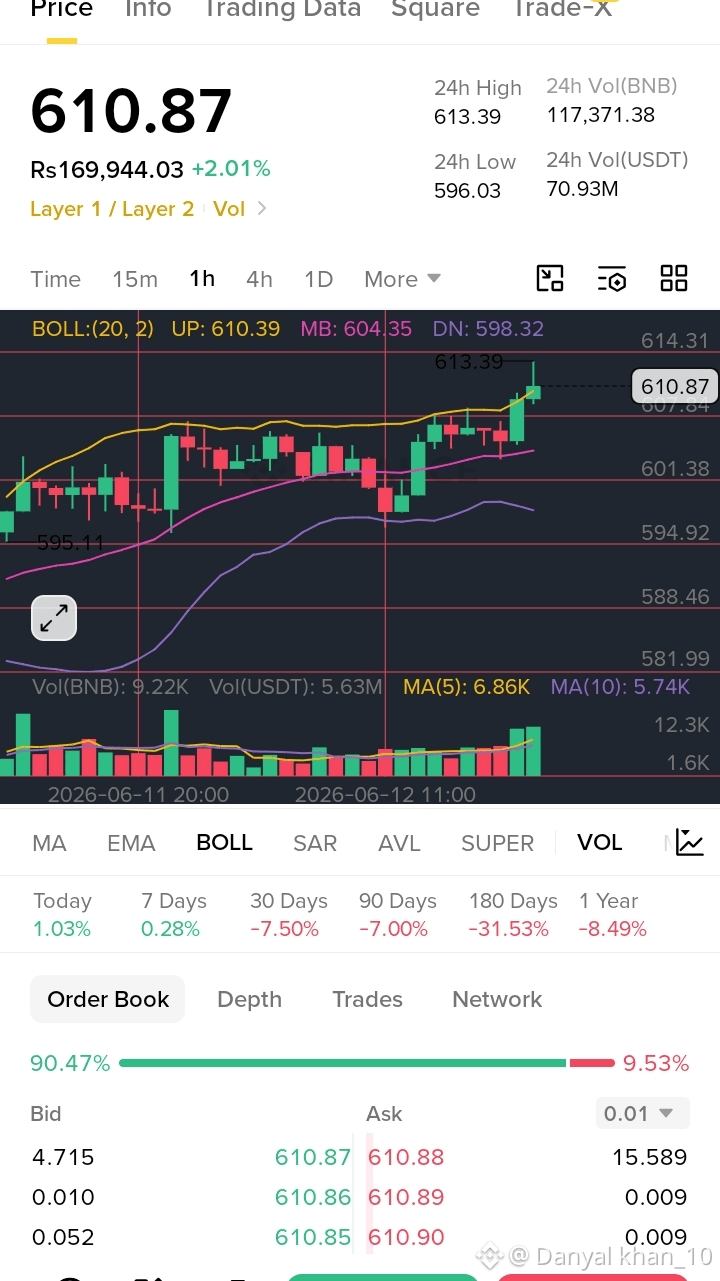
Current Price: $610.87 | +2.01%
24h High: $614.31 | 24h Low: $594.92
🔹 15m Chart
Bollinger Bands: UP 610.39 / MB 604.35 / DN 598.32
Price above upper band – overextended. Small pullback likely.
Support: 608 | Resistance: 614
🔹 1h Chart
Trend: Bullish. Price holding above MB 604.35.
Volume: 9.22K BNB (above MA5 & MA10) – healthy buying.
Break above 614 = next target 620.
🔹 1D Chart (Daily)
Bollinger Bands: Price breaking above upper band.
30-Day: -7.50% | 1 Year: -8.49% (range-bound overall).
Major resistance: 620 | Strong support: 598 (DN)
📊 Order Book: 90.5% Buy | 9.5% Sell – extremely bullish sentiment.
💡 Trade Idea:
✅ Short-term: Wait for dip to 605–608 for long entry.
🎯 Target: 614 / 620
🛑 Stop Loss: 598
⚠️ Don't chase at 610.87 – order book shows strong buying but price is extended.
Use 2x leverage max or spot only.
#BNBUSDT #BinanceCoin #MultiTimeframe
$BNB
{spot}(BNBUSDT)
$BNB /USDT – 15m / 1h / 1D Analysis 💼
Current Price: $610.87 | +2.01%
24h High: $614.31 | 24h Low: $594.92
🔹 15m Chart
Bollinger Bands: UP 610.39 / MB 604.35 / DN 598.32
Price above upper band – overextended. Small pullback likely.
Support: 608 | Resistance: 614
🔹 1h Chart
Trend: Bullish. Price holding above MB 604.35.
Volume: 9.22K BNB (above MA5 & MA10) – healthy buying.
Break above 614 = next target 620.
🔹 1D Chart (Daily)
Bollinger Bands: Price breaking above upper band.
30-Day: -7.50% | 1 Year: -8.49% (range-bound overall).
Major resistance: 620 | Strong support: 598 (DN)
📊 Order Book: 90.5% Buy | 9.5% Sell – extremely bullish sentiment.
💡 Trade Idea:
✅ Short-term: Wait for dip to 605–608 for long entry.
🎯 Target: 614 / 620
🛑 Stop Loss: 598
⚠️ Don't chase at 610.87 – order book shows strong buying but price is extended.
Use 2x leverage max or spot only.
#BNBUSDT #BinanceCoin #MultiTimeframe
$BNB
Current Price: $610.87 | +2.01%
24h High: $614.31 | 24h Low: $594.92
🔹 15m Chart
Bollinger Bands: UP 610.39 / MB 604.35 / DN 598.32
Price above upper band – overextended. Small pullback likely.
Support: 608 | Resistance: 614
🔹 1h Chart
Trend: Bullish. Price holding above MB 604.35.
Volume: 9.22K BNB (above MA5 & MA10) – healthy buying.
Break above 614 = next target 620.
🔹 1D Chart (Daily)
Bollinger Bands: Price breaking above upper band.
30-Day: -7.50% | 1 Year: -8.49% (range-bound overall).
Major resistance: 620 | Strong support: 598 (DN)
📊 Order Book: 90.5% Buy | 9.5% Sell – extremely bullish sentiment.
💡 Trade Idea:
✅ Short-term: Wait for dip to 605–608 for long entry.
🎯 Target: 614 / 620
🛑 Stop Loss: 598
⚠️ Don't chase at 610.87 – order book shows strong buying but price is extended.
Use 2x leverage max or spot only.
#BNBUSDT #BinanceCoin #MultiTimeframe
$BNB
2
33
Войдите, чтобы посмотреть больше материала
Присоединяйтесь к пользователям криптовалют по всему миру на Binance Square
⚡️ Получайте новейшую и полезную информацию о криптоактивах.
💬 Нам доверяет крупнейшая в мире криптобиржа.
👍 Получите достоверные аналитические данные от верифицированных создателей контента.
Эл. почта/номер телефона
В тренде
1
#CanBTCReboundAfterFallingBelow60K?
Просмотров: 88,137
477 обсуждают
2
#GlobalStocksFaceLongestLosingStreakSince2023
Просмотров: 43,509
483 обсуждают
3
#AnthropicPlungesTowardIPOPriceonDay2
Просмотров: 12,329
188 обсуждают
4
#GaoTengBitcoinETFListsOnHKEX
Просмотров: 33,714
385 обсуждают
5
#TradFiForBeginners
Просмотров: 995,952
5,797 обсуждают
6
#NvidiaBoardReportedlySplitOverHuang’sReturn
Просмотров: 385,950
2,571 обсуждают
7
#TetherBurns8BillionUSDTInPast20Days
Просмотров: 36,882
155 обсуждают
8
#BitcoinWalletSignatureFlawExploitableWithinSeconds
Просмотров: 10,573
74 обсуждают
9
#CanGTA6'sLaunchLiftTTWOShares?
Просмотров: 323,881
1,801 обсуждают
10
#HongKongProposesSFCLicensingForFourVirtualAssetServices
Просмотров: 1,981
36 обсуждают