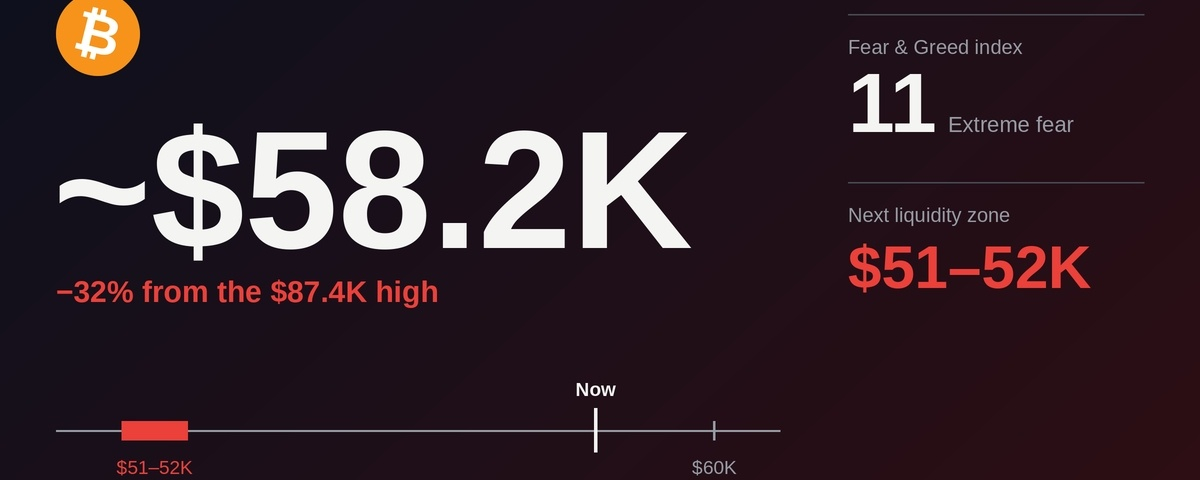

$BTC has slipped below the psychological $60,000 level and printed around $58.2K on Binance, down roughly 32% from the $87.4K daily high and about 53% below the all-time high of $126.2K. Here is what the data is showing 👀
🔹 Trend: bearish on every timeframe
Weekly: price is now below the 200-week moving average (around $68K), a key long-term line to reclaim.
Daily: below all major EMAs, with RSI at 17, a very rare oversold reading.
4H and 1H: a vertical drop, with a volume spike that looks like a capitulation candle.
🔹 Leverage: flushed, but not erased
Open interest on Binance BTC futures is around $8.3B, down more than 5% in 24 hours. Across Binance futures, open interest has dropped from its recent peak of roughly $46B to about $33B. Leverage is leaving the system, which is healthy, but the decline is not over.
🔹 Institutional flows: the pressure is coming from spot 🏛️
US spot Bitcoin ETFs keep bleeding. Outflows of hundreds of millions of dollars hit in a single day, and the monthly total is now in the billions. The institutional futures market tells the same story: open interest on CME Bitcoin futures fell about 9.5% in 24 hours to roughly $5.8B, one of the sharpest drops among the major venues. That suggests institutional players are reducing exposure. Meanwhile, Binance open interest has stayed flat while the price kept falling, which points to spot selling rather than leverage driving this latest leg down 👀 A return of ETF inflows would be one of the first signs the pressure is easing. (invezz) (coindoo)
🔹 Liquidity map: where the magnet sits
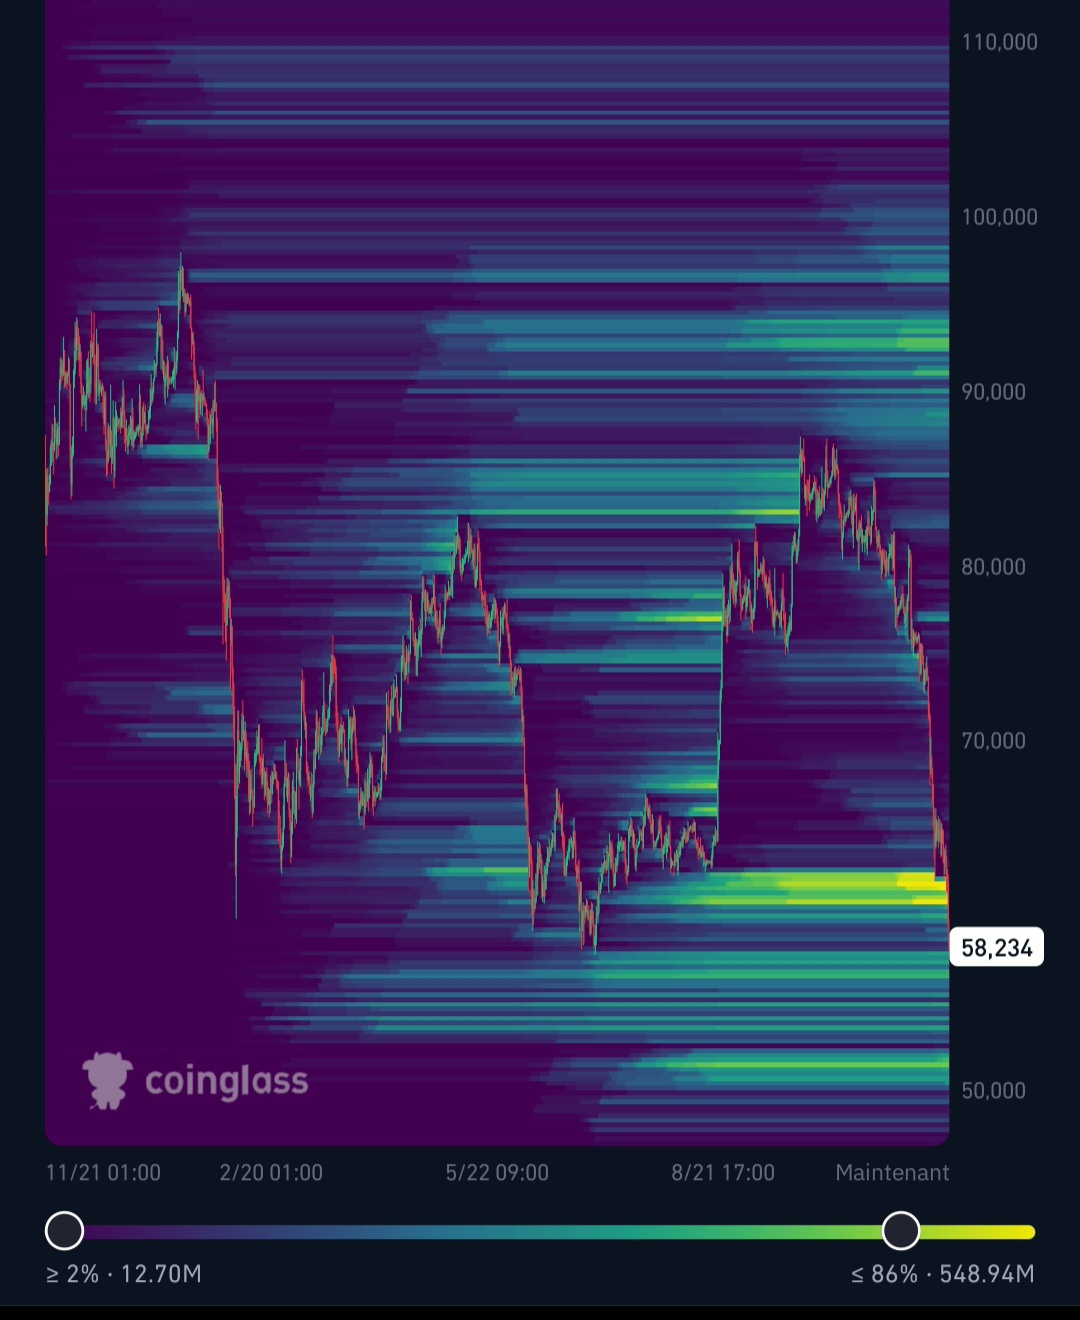
On the Binance BTCUSDT liquidation heatmap:
The dense band at $59K–$60.5K has just been swept.
A staircase of liquidity sits between $53K and $57K.
The brightest cluster below the price is at $51K–$52K.
The order book adds a warning: between $58K and $52K it looks thin, so a break can move fast.
🔹 Sentiment: extreme fear
The Fear & Greed Index is at 11, down from 64 a month ago. Extreme fear can mark bottoms, but it is a signal, not a floor.
📉 Key levels
Support: $57.8K (yearly low), $55K–$53K, then $51K–$52K.
Resistance: $60K, $61.2K–$62.2K, then $65.4K (4H EMA50).
👀 Scenarios
Bearish: a daily close below $57.8K opens the road toward the $51K–$52K liquidity zone.
Rebound: with RSI this stretched and fear this deep, a relief bounce is possible. But without a return of ETF inflows, it would likely stay a bounce inside a downtrend.
The next daily close will tell us a lot. Stay patient and manage your risk 🔹
Not financial advice.
#BTC #MultiTimeFrame #liquidity