
#dash
dash
Просмотров: 9.7M
36,135 обсуждают
Популярные
Новые

·
--
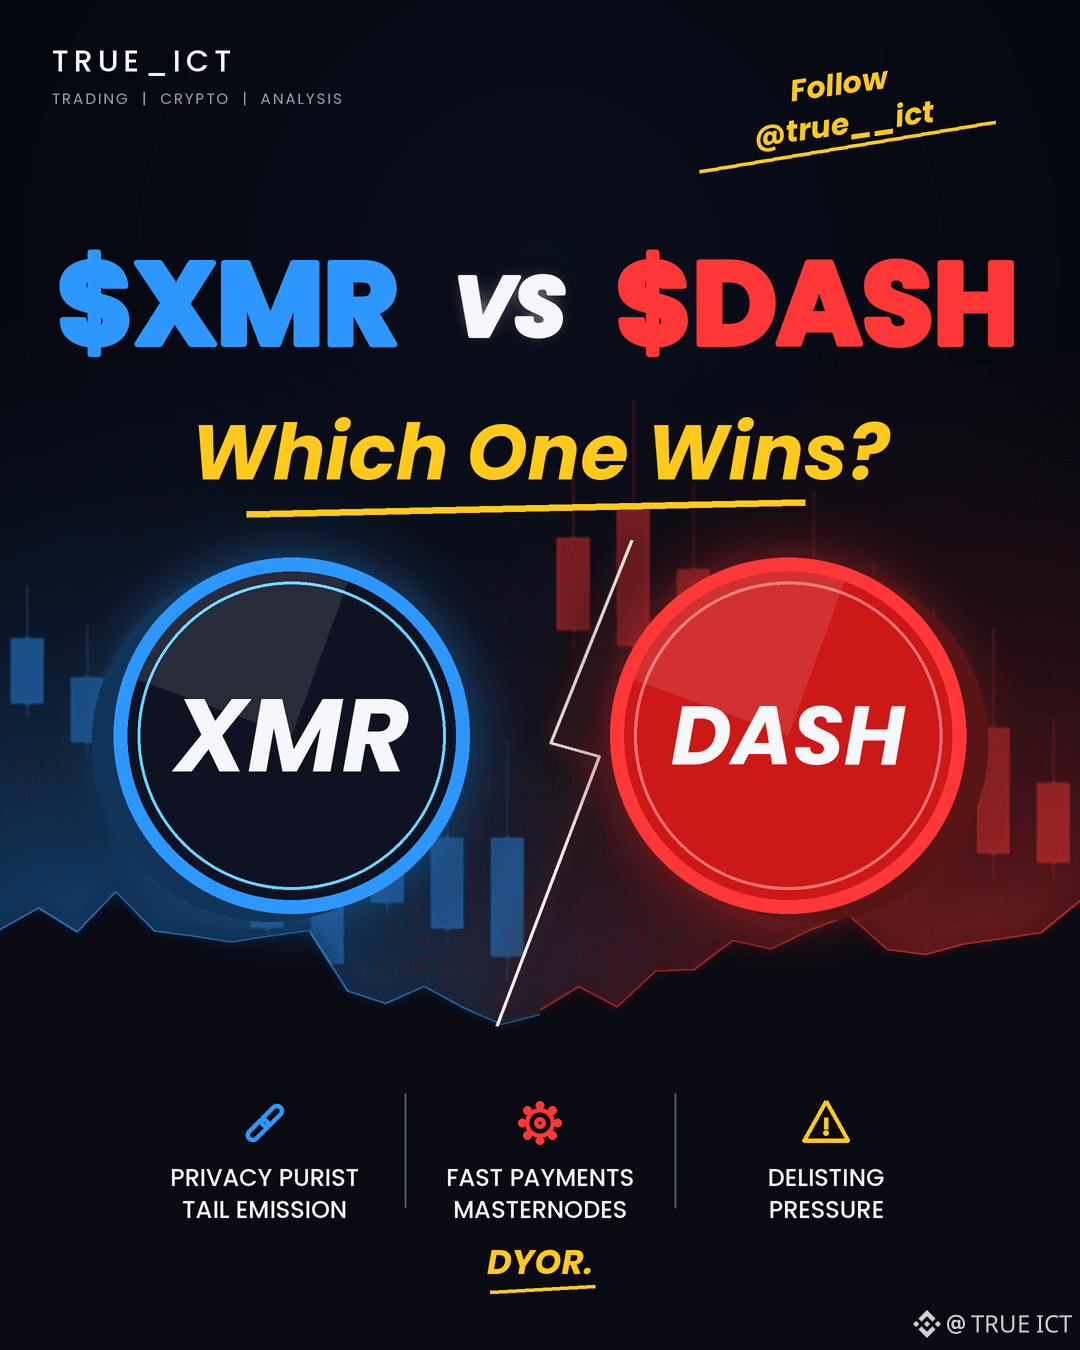
⚔️ $XMR vs $DASH: which one wins?
🔹 $XMR: private by default, with no hard supply cap thanks to tail emission.
🔹 $DASH: a payments-focused coin with masternodes, capped near 18.9M.
📊 XMR is the privacy purist pick. DASH leans on fast payments.
⚠️ Both face delisting pressure on regulated exchanges.
$XMR or $DASH? 👇
Not financial advice. DYOR.
#XMR #DASH #Binance
⚔️ $XMR vs $DASH : which one wins?
🔹 $XMR : private by default, with no hard supply cap thanks to tail emission.
🔹 $DASH : a payments-focused coin with masternodes, capped near 18.9M.
📊 XMR is the privacy purist pick. DASH leans on fast payments.
⚠️ Both face delisting pressure on regulated exchanges.
$XMR or $DASH ? 👇
Not financial advice. DYOR.
#XMR #DASH #Binance
🔹 $XMR : private by default, with no hard supply cap thanks to tail emission.
🔹 $DASH : a payments-focused coin with masternodes, capped near 18.9M.
📊 XMR is the privacy purist pick. DASH leans on fast payments.
⚠️ Both face delisting pressure on regulated exchanges.
$XMR or $DASH ? 👇
Not financial advice. DYOR.
#XMR #DASH #Binance
1
120

DASH, EIGEN and SYRUP Market Analysis: Oversold Conditions Meet a Crucial Test of Demand
DASH, EIGEN and SYRUP are drawing attention for very different reasons, yet their current market structures share one important theme: all three assets are navigating heavy recent selling pressure while traders watch for evidence of stabilization.
DASH represents the payments focused crypto segment, EIGEN remains connected to Ethereum restaking infrastructure, and SYRUP reflects growing interest in decentralized credit and real world asset related DeFi. Their latest market data shows that short term moves are mixed, but the broader trend remains fragile. In this environment, confirmation through volume, capital flow and trend recovery matters far more than a single intraday candle.
DASH: Payment Token Faces Continued Downside Momentum
DASH is trading near $36.76, down 2.03% from its 24 hour opening price. During the current session, DASH reached a high of $38.09 and a low of $36.29, showing that sellers remain active near the upper end of the intraday range.
The broader performance remains under pressure. DASH is down 12.35% over 7 days and 26.99% over 30 days. Its 6 period RSI stands at 29.94, placing the asset in oversold territory. This suggests that the recent decline has become stretched, but an oversold reading alone does not confirm that the trend has reversed.
The technical structure remains bearish. DASH trades below its 7 day moving average of $37.91, 25 day moving average of $44.76 and 99 day moving average of $49.49. The MACD remains bearish after a death cross 19 daily candles ago, while SuperTrend continues to indicate a downtrend.
DASH is currently 6.92% above its 7 day low of $34.38 and 14.17% below its 7 day high of $42.83. Daily volume is running at 0.85 times its 7 day average, while large order flow has shown a small net outflow. This points to cautious participation. For the DASH market structure to improve, traders will likely look for more sustained volume and evidence that the recent low area can hold during volatile sessions.
EIGEN: Restaking Narrative Faces Its Strongest Momentum Challenge
EIGEN is trading around $0.1253, down 1.42% from its 24 hour opening level. The token traded between $0.1240 and $0.1448 during the current session, highlighting sharp volatility as the market tested both sides of the range.
EIGEN has fallen 21.05% over 7 days and 47.24% over 30 days. The current price is only 1.70% above the 7 day low of $0.1232 and 50.02% below the 30 day high of $0.2507. This reflects a market that remains close to its recent downside range despite temporary intraday rebounds.
Its RSI is at 16.79, a deeply oversold reading. This means downside momentum has been unusually strong, and volatility can remain elevated when price trades near fresh range lows. The MACD is still bearish following a death cross 49 daily candles ago. EIGEN also trades below its 7 day, 25 day and 99 day moving averages, while SuperTrend remains pointed lower.
One important detail is volume. EIGEN volume is 1.59 times its 7 day average, showing that participation has increased during the latest session. However, large order flow remains negative, with a net outflow of 547,857.92 EIGEN. This combination indicates active trading, but it does not yet demonstrate that buyers have regained control.
For EIGEN, the key market signal is whether stronger volume can begin supporting price stability rather than accelerating volatility. The underlying restaking narrative remains important to the Ethereum ecosystem, but price action currently shows that traders are demanding clearer evidence of renewed demand.
SYRUP: Positive Capital Flow Brings a More Constructive Short Term Signal
SYRUP is trading near $0.0982, up 1.97% from its 24 hour opening level. It traded between $0.0928 and $0.1082 during the session, producing a wide range that reflects active interest near recent lows.
Despite the positive intraday move, SYRUP remains down 25.55% over 7 days and 49.72% over 30 days. Its price is only 5.82% above the 7 day and 30 day low of $0.0928, while it remains 53.19% below the 30 day high of $0.2098. This means SYRUP is still operating inside a weak broader structure.
The RSI is 25.20, keeping SYRUP in oversold territory. The MACD remains bearish after a death cross 42 daily candles ago, and price remains below its 7 day, 25 day and 99 day moving averages. SuperTrend also continues to indicate a downtrend.
However, SYRUP stands apart because of its latest capital flow. Large order activity shows a net inflow of 571,168.4 SYRUP, with a net inflow rate of 8.41%. Daily volume is also 1.10 times the 7 day average. This suggests that buying interest has appeared during the latest session, although it is too early to treat one period of positive flow as a confirmed reversal.
SYRUP’s next phase will depend on whether this inflow continues and whether price can maintain stability after its recent rebound. If participation fades quickly, the broader bearish trend may remain dominant. If demand remains consistent, traders may begin to reassess whether downside momentum is losing strength.
Market Perspective
DASH, EIGEN and SYRUP are all technically oversold, but each asset is showing a different market dynamic. DASH remains pressured by weak momentum and modest outflows. EIGEN has elevated volume but still faces meaningful selling pressure. SYRUP has shown the strongest short term capital flow signal, yet its broader trend remains bearish.
The current market favors disciplined analysis over emotional reactions. Oversold readings can create sharp rebounds, but they can also persist while a downtrend continues. Monitoring volume, capital flow, moving average recovery and the ability to hold above recent lows can provide a clearer picture of whether sentiment is truly shifting.
#Dash #EigenLayer #SYRUP #CryptoMarket #AltcoinAnalysis
$DASH
{spot}(DASHUSDT)
$EIGEN
{spot}(EIGENUSDT)
$SYRUP
{spot}(SYRUPUSDT)
DASH, EIGEN and SYRUP Market Analysis: Oversold Conditions Meet a Crucial Test of Demand
DASH, EIGEN and SYRUP are drawing attention for very different reasons, yet their current market structures share one important theme: all three assets are navigating heavy recent selling pressure while traders watch for evidence of stabilization.
DASH represents the payments focused crypto segment, EIGEN remains connected to Ethereum restaking infrastructure, and SYRUP reflects growing interest in decentralized credit and real world asset related DeFi. Their latest market data shows that short term moves are mixed, but the broader trend remains fragile. In this environment, confirmation through volume, capital flow and trend recovery matters far more than a single intraday candle.
DASH: Payment Token Faces Continued Downside Momentum
DASH is trading near $36.76, down 2.03% from its 24 hour opening price. During the current session, DASH reached a high of $38.09 and a low of $36.29, showing that sellers remain active near the upper end of the intraday range.
The broader performance remains under pressure. DASH is down 12.35% over 7 days and 26.99% over 30 days. Its 6 period RSI stands at 29.94, placing the asset in oversold territory. This suggests that the recent decline has become stretched, but an oversold reading alone does not confirm that the trend has reversed.
The technical structure remains bearish. DASH trades below its 7 day moving average of $37.91, 25 day moving average of $44.76 and 99 day moving average of $49.49. The MACD remains bearish after a death cross 19 daily candles ago, while SuperTrend continues to indicate a downtrend.
DASH is currently 6.92% above its 7 day low of $34.38 and 14.17% below its 7 day high of $42.83. Daily volume is running at 0.85 times its 7 day average, while large order flow has shown a small net outflow. This points to cautious participation. For the DASH market structure to improve, traders will likely look for more sustained volume and evidence that the recent low area can hold during volatile sessions.
EIGEN: Restaking Narrative Faces Its Strongest Momentum Challenge
EIGEN is trading around $0.1253, down 1.42% from its 24 hour opening level. The token traded between $0.1240 and $0.1448 during the current session, highlighting sharp volatility as the market tested both sides of the range.
EIGEN has fallen 21.05% over 7 days and 47.24% over 30 days. The current price is only 1.70% above the 7 day low of $0.1232 and 50.02% below the 30 day high of $0.2507. This reflects a market that remains close to its recent downside range despite temporary intraday rebounds.
Its RSI is at 16.79, a deeply oversold reading. This means downside momentum has been unusually strong, and volatility can remain elevated when price trades near fresh range lows. The MACD is still bearish following a death cross 49 daily candles ago. EIGEN also trades below its 7 day, 25 day and 99 day moving averages, while SuperTrend remains pointed lower.
One important detail is volume. EIGEN volume is 1.59 times its 7 day average, showing that participation has increased during the latest session. However, large order flow remains negative, with a net outflow of 547,857.92 EIGEN. This combination indicates active trading, but it does not yet demonstrate that buyers have regained control.
For EIGEN, the key market signal is whether stronger volume can begin supporting price stability rather than accelerating volatility. The underlying restaking narrative remains important to the Ethereum ecosystem, but price action currently shows that traders are demanding clearer evidence of renewed demand.
SYRUP: Positive Capital Flow Brings a More Constructive Short Term Signal
SYRUP is trading near $0.0982, up 1.97% from its 24 hour opening level. It traded between $0.0928 and $0.1082 during the session, producing a wide range that reflects active interest near recent lows.
Despite the positive intraday move, SYRUP remains down 25.55% over 7 days and 49.72% over 30 days. Its price is only 5.82% above the 7 day and 30 day low of $0.0928, while it remains 53.19% below the 30 day high of $0.2098. This means SYRUP is still operating inside a weak broader structure.
The RSI is 25.20, keeping SYRUP in oversold territory. The MACD remains bearish after a death cross 42 daily candles ago, and price remains below its 7 day, 25 day and 99 day moving averages. SuperTrend also continues to indicate a downtrend.
However, SYRUP stands apart because of its latest capital flow. Large order activity shows a net inflow of 571,168.4 SYRUP, with a net inflow rate of 8.41%. Daily volume is also 1.10 times the 7 day average. This suggests that buying interest has appeared during the latest session, although it is too early to treat one period of positive flow as a confirmed reversal.
SYRUP’s next phase will depend on whether this inflow continues and whether price can maintain stability after its recent rebound. If participation fades quickly, the broader bearish trend may remain dominant. If demand remains consistent, traders may begin to reassess whether downside momentum is losing strength.
Market Perspective
DASH, EIGEN and SYRUP are all technically oversold, but each asset is showing a different market dynamic. DASH remains pressured by weak momentum and modest outflows. EIGEN has elevated volume but still faces meaningful selling pressure. SYRUP has shown the strongest short term capital flow signal, yet its broader trend remains bearish.
The current market favors disciplined analysis over emotional reactions. Oversold readings can create sharp rebounds, but they can also persist while a downtrend continues. Monitoring volume, capital flow, moving average recovery and the ability to hold above recent lows can provide a clearer picture of whether sentiment is truly shifting.
#Dash #EigenLayer #SYRUP #CryptoMarket #AltcoinAnalysis
$DASH
$EIGEN
$SYRUP
DASH represents the payments focused crypto segment, EIGEN remains connected to Ethereum restaking infrastructure, and SYRUP reflects growing interest in decentralized credit and real world asset related DeFi. Their latest market data shows that short term moves are mixed, but the broader trend remains fragile. In this environment, confirmation through volume, capital flow and trend recovery matters far more than a single intraday candle.
DASH: Payment Token Faces Continued Downside Momentum
DASH is trading near $36.76, down 2.03% from its 24 hour opening price. During the current session, DASH reached a high of $38.09 and a low of $36.29, showing that sellers remain active near the upper end of the intraday range.
The broader performance remains under pressure. DASH is down 12.35% over 7 days and 26.99% over 30 days. Its 6 period RSI stands at 29.94, placing the asset in oversold territory. This suggests that the recent decline has become stretched, but an oversold reading alone does not confirm that the trend has reversed.
The technical structure remains bearish. DASH trades below its 7 day moving average of $37.91, 25 day moving average of $44.76 and 99 day moving average of $49.49. The MACD remains bearish after a death cross 19 daily candles ago, while SuperTrend continues to indicate a downtrend.
DASH is currently 6.92% above its 7 day low of $34.38 and 14.17% below its 7 day high of $42.83. Daily volume is running at 0.85 times its 7 day average, while large order flow has shown a small net outflow. This points to cautious participation. For the DASH market structure to improve, traders will likely look for more sustained volume and evidence that the recent low area can hold during volatile sessions.
EIGEN: Restaking Narrative Faces Its Strongest Momentum Challenge
EIGEN is trading around $0.1253, down 1.42% from its 24 hour opening level. The token traded between $0.1240 and $0.1448 during the current session, highlighting sharp volatility as the market tested both sides of the range.
EIGEN has fallen 21.05% over 7 days and 47.24% over 30 days. The current price is only 1.70% above the 7 day low of $0.1232 and 50.02% below the 30 day high of $0.2507. This reflects a market that remains close to its recent downside range despite temporary intraday rebounds.
Its RSI is at 16.79, a deeply oversold reading. This means downside momentum has been unusually strong, and volatility can remain elevated when price trades near fresh range lows. The MACD is still bearish following a death cross 49 daily candles ago. EIGEN also trades below its 7 day, 25 day and 99 day moving averages, while SuperTrend remains pointed lower.
One important detail is volume. EIGEN volume is 1.59 times its 7 day average, showing that participation has increased during the latest session. However, large order flow remains negative, with a net outflow of 547,857.92 EIGEN. This combination indicates active trading, but it does not yet demonstrate that buyers have regained control.
For EIGEN, the key market signal is whether stronger volume can begin supporting price stability rather than accelerating volatility. The underlying restaking narrative remains important to the Ethereum ecosystem, but price action currently shows that traders are demanding clearer evidence of renewed demand.
SYRUP: Positive Capital Flow Brings a More Constructive Short Term Signal
SYRUP is trading near $0.0982, up 1.97% from its 24 hour opening level. It traded between $0.0928 and $0.1082 during the session, producing a wide range that reflects active interest near recent lows.
Despite the positive intraday move, SYRUP remains down 25.55% over 7 days and 49.72% over 30 days. Its price is only 5.82% above the 7 day and 30 day low of $0.0928, while it remains 53.19% below the 30 day high of $0.2098. This means SYRUP is still operating inside a weak broader structure.
The RSI is 25.20, keeping SYRUP in oversold territory. The MACD remains bearish after a death cross 42 daily candles ago, and price remains below its 7 day, 25 day and 99 day moving averages. SuperTrend also continues to indicate a downtrend.
However, SYRUP stands apart because of its latest capital flow. Large order activity shows a net inflow of 571,168.4 SYRUP, with a net inflow rate of 8.41%. Daily volume is also 1.10 times the 7 day average. This suggests that buying interest has appeared during the latest session, although it is too early to treat one period of positive flow as a confirmed reversal.
SYRUP’s next phase will depend on whether this inflow continues and whether price can maintain stability after its recent rebound. If participation fades quickly, the broader bearish trend may remain dominant. If demand remains consistent, traders may begin to reassess whether downside momentum is losing strength.
Market Perspective
DASH, EIGEN and SYRUP are all technically oversold, but each asset is showing a different market dynamic. DASH remains pressured by weak momentum and modest outflows. EIGEN has elevated volume but still faces meaningful selling pressure. SYRUP has shown the strongest short term capital flow signal, yet its broader trend remains bearish.
The current market favors disciplined analysis over emotional reactions. Oversold readings can create sharp rebounds, but they can also persist while a downtrend continues. Monitoring volume, capital flow, moving average recovery and the ability to hold above recent lows can provide a clearer picture of whether sentiment is truly shifting.
#Dash #EigenLayer #SYRUP #CryptoMarket #AltcoinAnalysis
$DASH
$EIGEN
$SYRUP
1
29

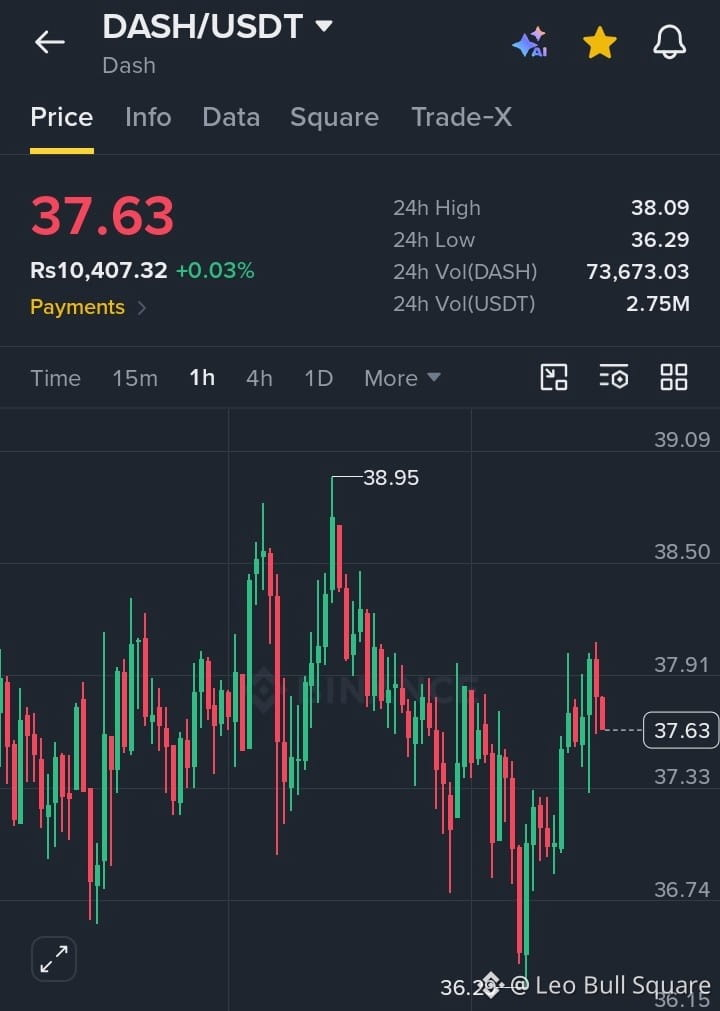
**🔥 $DASH /USDT – Bulls Fight Back After Sweeping $36.29 Support! 🚀** DASH is showing signs of recovery after a sharp liquidity sweep toward $36.29, with buyers pushing price back to $37.63 on the 1H chart. However, the $37.90–$38.09 resistance zone remains a critical hurdle. A confirmed BOS above $37.90 could trigger bullish continuation toward $38.50 and $38.95, while rejection may send price back toward $37.33 and $36.74 support. **Trade Setup:** Watch $37.50–$37.65 for a potential pullback entry after bullish confirmation, with SL below $37.30 and targets at $37.90, $38.50 and $38.95. Volume stands at $2.75M USDT, so watch for confirmation before entering. Don't chase the breakout—trade the structure! Follow for more technical setups.
#DASH
{spot}(DASHUSDT)
**🔥 $DASH /USDT – Bulls Fight Back After Sweeping $36.29 Support! 🚀** DASH is showing signs of recovery after a sharp liquidity sweep toward $36.29, with buyers pushing price back to $37.63 on the 1H chart. However, the $37.90–$38.09 resistance zone remains a critical hurdle. A confirmed BOS above $37.90 could trigger bullish continuation toward $38.50 and $38.95, while rejection may send price back toward $37.33 and $36.74 support. **Trade Setup:** Watch $37.50–$37.65 for a potential pullback entry after bullish confirmation, with SL below $37.30 and targets at $37.90, $38.50 and $38.95. Volume stands at $2.75M USDT, so watch for confirmation before entering. Don't chase the breakout—trade the structure! Follow for more technical setups.
#DASH
#DASH

follow for more
От Leo Bull Square
Gerich71:
thanks
1
12
101

·
--
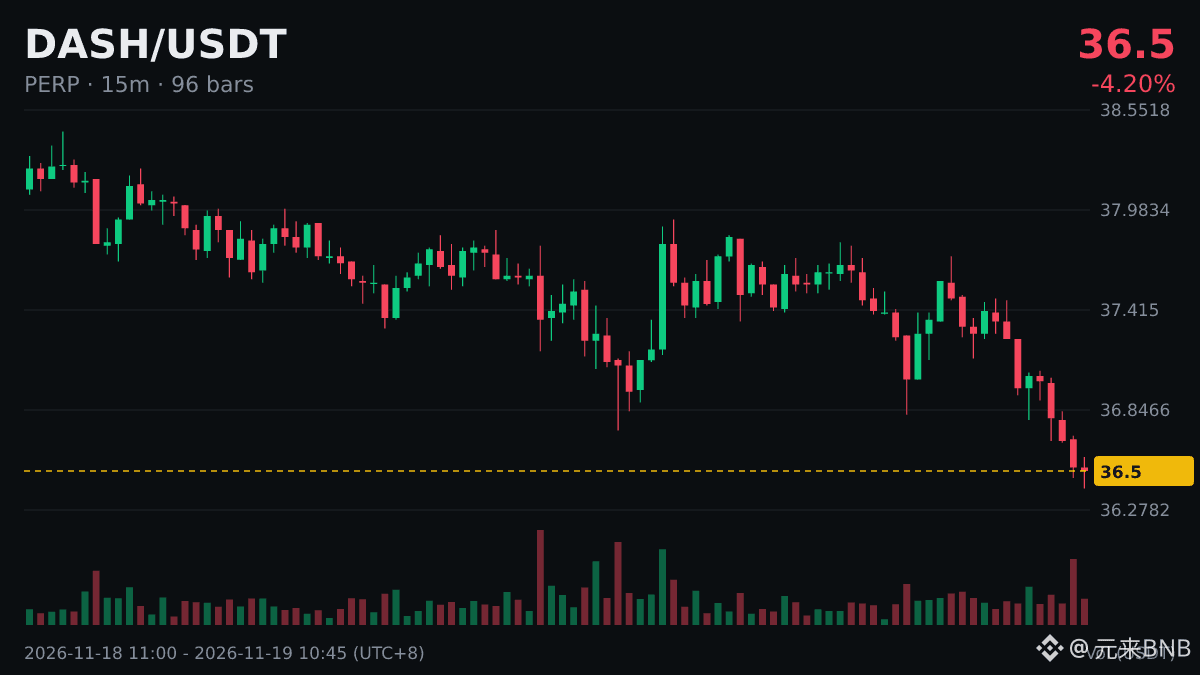
$DASH #DASH is down 4.07 percent at $36.49, breaking down below its whole 24 hour range. 📉
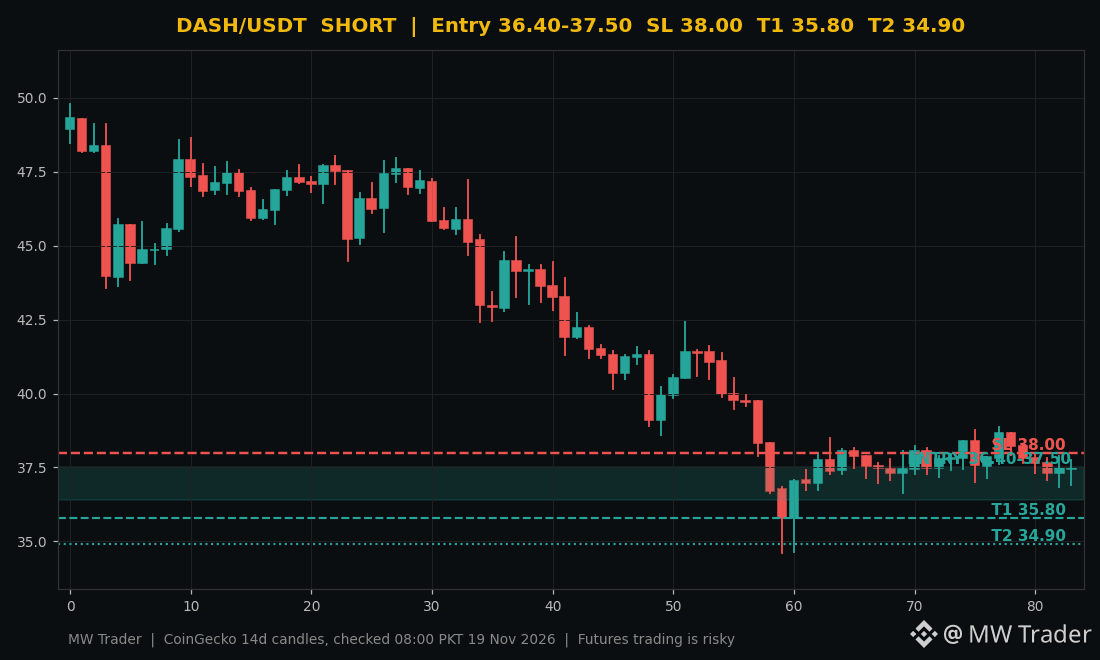
Dash ran from a 24 hour high of $38.39 to a low of $36.83, and the price now sits at $36.49, below its whole 24 hour range, while the last candle closed at $37.49, right inside the entry zone. 🔴 My plan is a short on the entry zone of $36.4 to $37.5, with a stop loss at $38.0, target 1 at $35.8 and target 2 at $34.9. The $36.83 low is already lost, and a clean hold under $36.4 opens the way to $35.8. I stay short only while price holds under $37.5. ⚠️
Does DASH hold under $36.4 and fall to $35.8, or reclaim $37.5 and squeeze the shorts? 🤔
Futures trading is risky, trade small, manage risk, do your own research.
Follow for more trades.
#Dash #Crypto #FuturesTrading #TradingSignals
$DASH #DASH is down 4.07 percent at $36.49, breaking down below its whole 24 hour range. 📉
Dash ran from a 24 hour high of $38.39 to a low of $36.83, and the price now sits at $36.49, below its whole 24 hour range, while the last candle closed at $37.49, right inside the entry zone. 🔴 My plan is a short on the entry zone of $36.4 to $37.5, with a stop loss at $38.0, target 1 at $35.8 and target 2 at $34.9. The $36.83 low is already lost, and a clean hold under $36.4 opens the way to $35.8. I stay short only while price holds under $37.5. ⚠️
Does DASH hold under $36.4 and fall to $35.8, or reclaim $37.5 and squeeze the shorts? 🤔
Futures trading is risky, trade small, manage risk, do your own research.
Follow for more trades.
#Dash #Crypto #FuturesTrading #TradingSignals
Dash ran from a 24 hour high of $38.39 to a low of $36.83, and the price now sits at $36.49, below its whole 24 hour range, while the last candle closed at $37.49, right inside the entry zone. 🔴 My plan is a short on the entry zone of $36.4 to $37.5, with a stop loss at $38.0, target 1 at $35.8 and target 2 at $34.9. The $36.83 low is already lost, and a clean hold under $36.4 opens the way to $35.8. I stay short only while price holds under $37.5. ⚠️
Does DASH hold under $36.4 and fall to $35.8, or reclaim $37.5 and squeeze the shorts? 🤔
Futures trading is risky, trade small, manage risk, do your own research.
Follow for more trades.
#Dash #Crypto #FuturesTrading #TradingSignals
10


·
--
$DASH 失守 24小时低点:现价 36.47,前低 36.73。
破位之后关注两件事:
· 前低 36.73 会不会从支撑变成压力(反抽过不去)
· 跌破时有没有量能放大,缩量跌破可能只是诱空
看多还是看空?
#DASH
$DASH 失守 24小时低点:现价 36.47,前低 36.73。
破位之后关注两件事:
· 前低 36.73 会不会从支撑变成压力(反抽过不去)
· 跌破时有没有量能放大,缩量跌破可能只是诱空
看多还是看空?
#DASH
破位之后关注两件事:
· 前低 36.73 会不会从支撑变成压力(反抽过不去)
· 跌破时有没有量能放大,缩量跌破可能只是诱空
看多还是看空?
#DASH
48

·
--
Падение
$DASH is showing strength from support, with buyers gradually taking control and momentum building for a potential continuation move.
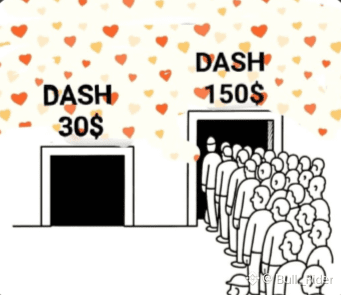
Entry: 30$
TP1: 45$
TP2: 60$
TP3: 90$
SL: 20$
Buy and Trade $DASH
#DASH
{future}(DASHUSDT)
$DASH is showing strength from support, with buyers gradually taking control and momentum building for a potential continuation move.
Entry: 30$
TP1: 45$
TP2: 60$
TP3: 90$
SL: 20$
Buy and Trade $DASH
#DASH
Entry: 30$
TP1: 45$
TP2: 60$
TP3: 90$
SL: 20$
Buy and Trade $DASH
#DASH
1
44



·
--
Рост
Купите $DASH на 5$ и забудьте на время
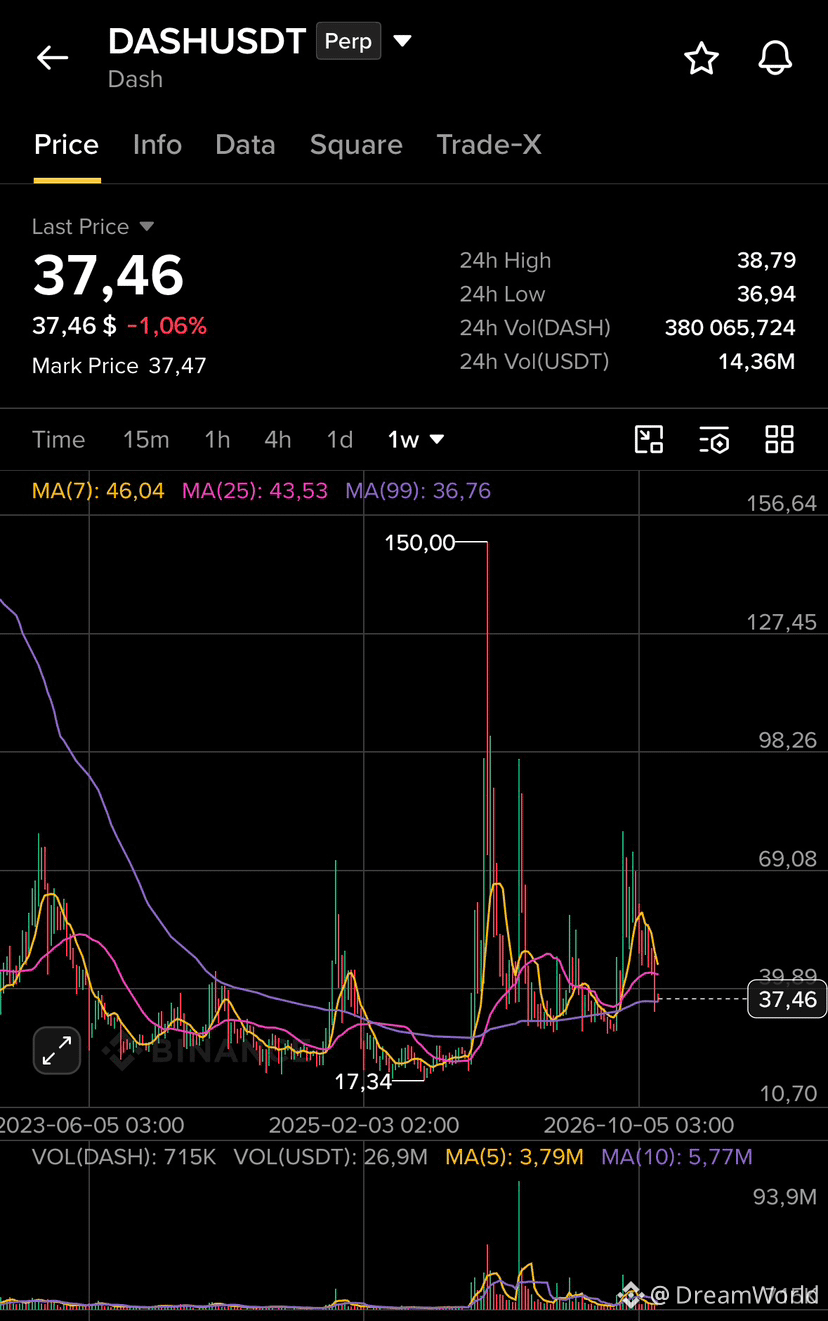
$DASH существует с 2014 года, это один из старейших платёжных проектов. Эмиссия ограничена: максимум около 18,9 млн монет, больше не будет. С пика 150$ цена упала до 37$, это минус 75%.
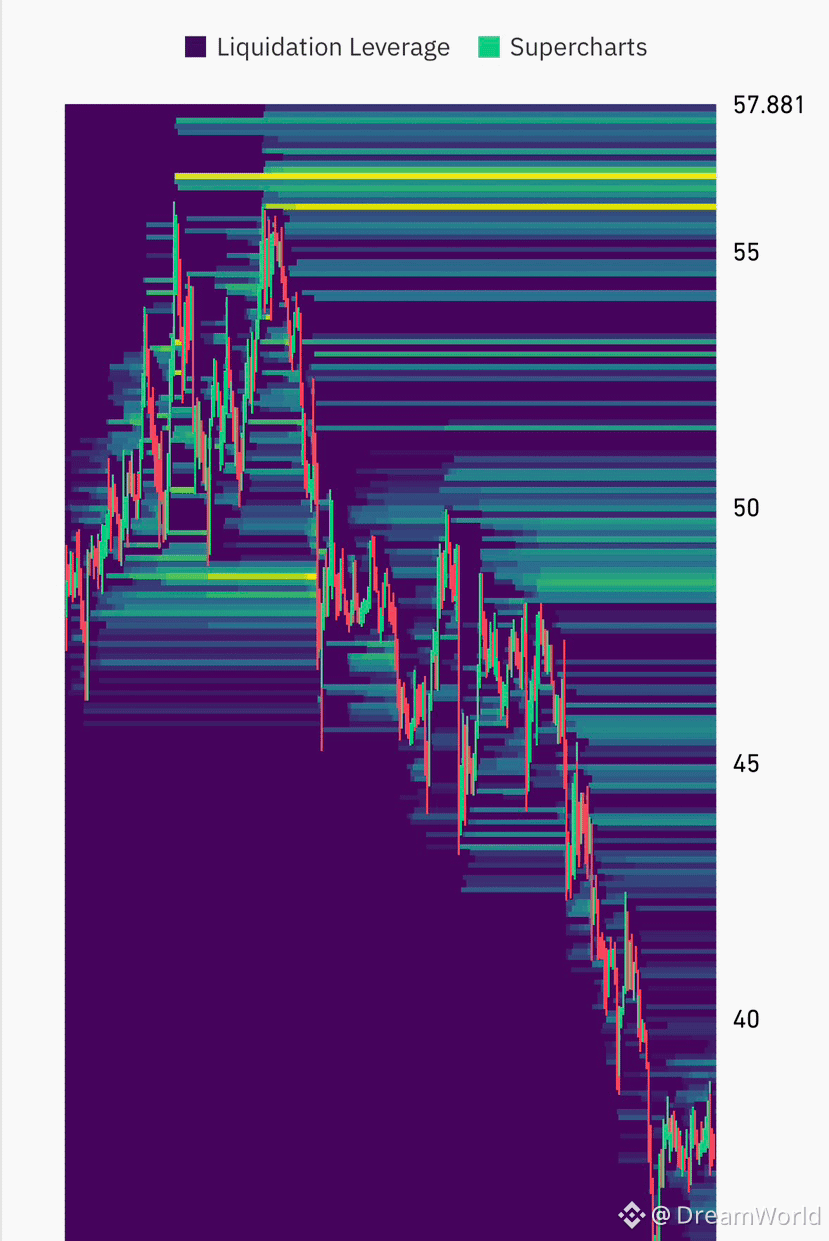
После такого слива 5$ это небольшая ставка на возможный отскок. Ближайшая зона интереса по карте ликвидаций около 48$, дальше 55$.
Вкладывайте только ту сумму, которую не жалко потерять. Это не финансовый совет, делайте свой ресёрч.
#DASH #Crypto
Купите $DASH на 5$ и забудьте на время
$DASH существует с 2014 года, это один из старейших платёжных проектов. Эмиссия ограничена: максимум около 18,9 млн монет, больше не будет. С пика 150$ цена упала до 37$, это минус 75%.
После такого слива 5$ это небольшая ставка на возможный отскок. Ближайшая зона интереса по карте ликвидаций около 48$, дальше 55$.
Вкладывайте только ту сумму, которую не жалко потерять. Это не финансовый совет, делайте свой ресёрч.
#DASH #Crypto
$DASH существует с 2014 года, это один из старейших платёжных проектов. Эмиссия ограничена: максимум около 18,9 млн монет, больше не будет. С пика 150$ цена упала до 37$, это минус 75%.
После такого слива 5$ это небольшая ставка на возможный отскок. Ближайшая зона интереса по карте ликвидаций около 48$, дальше 55$.
Вкладывайте только ту сумму, которую не жалко потерять. Это не финансовый совет, делайте свой ресёрч.
#DASH #Crypto
Stud_Fest:
Понаблюдаем за монетой, куда интереснее с этой монеты стейкинг через биржу. как платежный инструмент интересная
1
4
3k

$DASH: The Loud Auction Room: Why the Fastest Bidder Usually Overpays
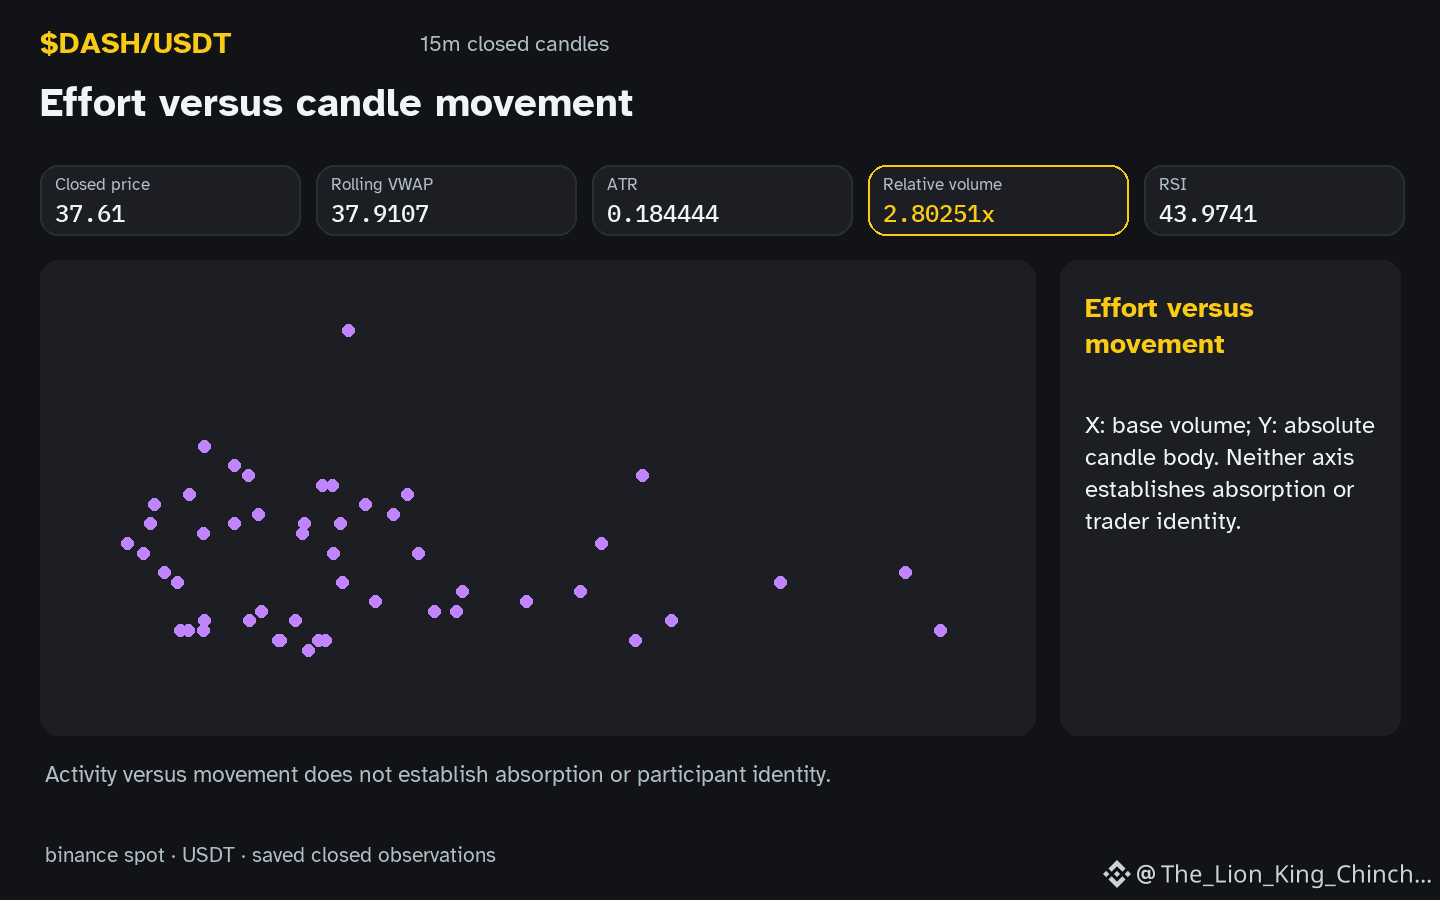
The hourly candle for $DASH is down with relative volume 2.80x baseline. Imagine a live auction where the fastest bidder shouts a price before others can react. That speed often leads to overpaying because the bidder cannot see the full order book. A breakout candle works similarly: a rapid price move on high volume may reflect a few aggressive market orders hitting thin limit layers, not broad conviction. The observation shows price inside the recorded range, hourly direction down, and volume above baseline. RSI reads 44.0. These facts describe only the saved snapshot, not a forecast. If the next closed candle reverts toward the range midpoint on lower relative volume, the auction analogy weakens. Conversely, a follow-through candle with sustained volume might support the idea of continued urgency. The mechanism is hypothetical; candles and volume alone cannot confirm motive, absorption, or causation. A useful reassessment is to watch whether subsequent candles maintain the same volume intensity or decay quickly.
Probabilistic market research, not a recommendation or guaranteed return.
Watchlist contrast: $ETH has hourly direction down and volume above its baseline; $MMT has hourly direction down and volume not above its baseline. This alone does not establish correlation.
The label or the mechanism behind it?
#DASH #ETH #MMT #CryptoEducation #CryptoLearning
$DASH : The Loud Auction Room: Why the Fastest Bidder Usually Overpays
The hourly candle for $DASH is down with relative volume 2.80x baseline. Imagine a live auction where the fastest bidder shouts a price before others can react. That speed often leads to overpaying because the bidder cannot see the full order book. A breakout candle works similarly: a rapid price move on high volume may reflect a few aggressive market orders hitting thin limit layers, not broad conviction. The observation shows price inside the recorded range, hourly direction down, and volume above baseline. RSI reads 44.0. These facts describe only the saved snapshot, not a forecast. If the next closed candle reverts toward the range midpoint on lower relative volume, the auction analogy weakens. Conversely, a follow-through candle with sustained volume might support the idea of continued urgency. The mechanism is hypothetical; candles and volume alone cannot confirm motive, absorption, or causation. A useful reassessment is to watch whether subsequent candles maintain the same volume intensity or decay quickly.
Probabilistic market research, not a recommendation or guaranteed return.
Watchlist contrast: $ETH has hourly direction down and volume above its baseline; $MMT has hourly direction down and volume not above its baseline. This alone does not establish correlation.
The label or the mechanism behind it?
#DASH #ETH #MMT #CryptoEducation #CryptoLearning
The hourly candle for $DASH is down with relative volume 2.80x baseline. Imagine a live auction where the fastest bidder shouts a price before others can react. That speed often leads to overpaying because the bidder cannot see the full order book. A breakout candle works similarly: a rapid price move on high volume may reflect a few aggressive market orders hitting thin limit layers, not broad conviction. The observation shows price inside the recorded range, hourly direction down, and volume above baseline. RSI reads 44.0. These facts describe only the saved snapshot, not a forecast. If the next closed candle reverts toward the range midpoint on lower relative volume, the auction analogy weakens. Conversely, a follow-through candle with sustained volume might support the idea of continued urgency. The mechanism is hypothetical; candles and volume alone cannot confirm motive, absorption, or causation. A useful reassessment is to watch whether subsequent candles maintain the same volume intensity or decay quickly.
Probabilistic market research, not a recommendation or guaranteed return.
Watchlist contrast: $ETH has hourly direction down and volume above its baseline; $MMT has hourly direction down and volume not above its baseline. This alone does not establish correlation.
The label or the mechanism behind it?
#DASH #ETH #MMT #CryptoEducation #CryptoLearning
42

·
--
🔴 $DASH SHORT · 4h
✅ Proven · Mitigation Block, Bearish
Entry 37.57
Target 34.38 (−8.5%)
Stop 41.886 (+11.5%)
Reward:risk 0.7
📊 All coins, 4h: 65% won of 304 · avg +1.4%
🪙 On DASH: 5 of 7 won
Automated chart-pattern signal. Not financial advice.
#DASH #CryptoSignals
🔴 $DASH SHORT · 4h
✅ Proven · Mitigation Block, Bearish
Entry 37.57
Target 34.38 (−8.5%)
Stop 41.886 (+11.5%)
Reward:risk 0.7
📊 All coins, 4h: 65% won of 304 · avg +1.4%
🪙 On DASH: 5 of 7 won
Automated chart-pattern signal. Not financial advice.
#DASH #CryptoSignals
✅ Proven · Mitigation Block, Bearish
Entry 37.57
Target 34.38 (−8.5%)
Stop 41.886 (+11.5%)
Reward:risk 0.7
📊 All coins, 4h: 65% won of 304 · avg +1.4%
🪙 On DASH: 5 of 7 won
Automated chart-pattern signal. Not financial advice.
#DASH #CryptoSignals
75
$DASH: Entry Quality or Invalidation Distance?
Does $DASH offer a clear entry?
The Tempting Shortcut
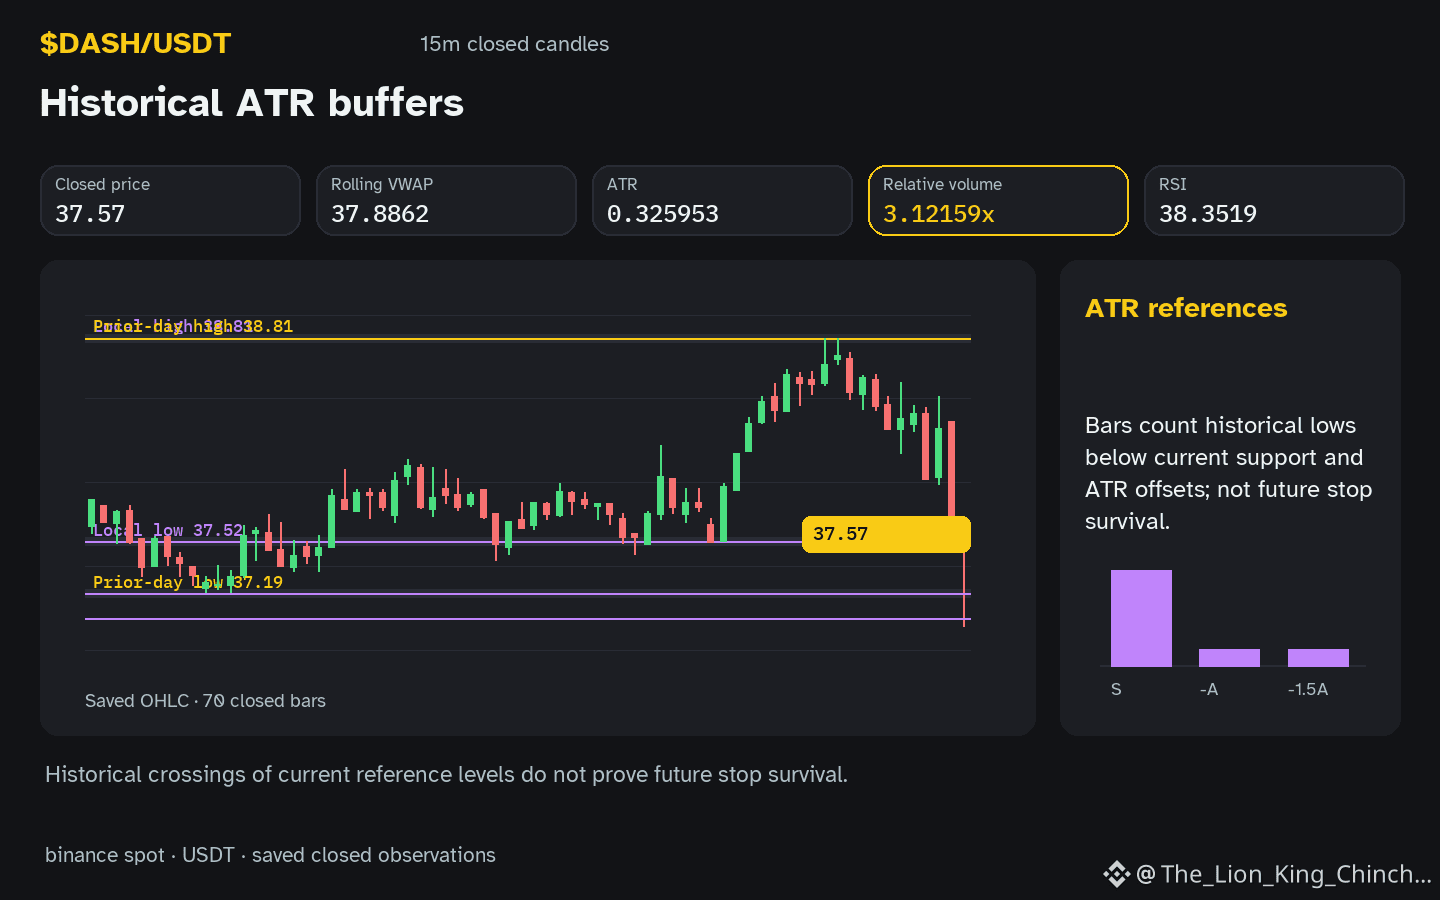
Traders often see price down hourly with 3.12x baseline volume. They assume failure and chase. This ignores execution reality.
A More Careful Interpretation
Think of a hypothetical plan. You want to buy near 37.52. But where do you exit if wrong? If your invalidation is tight at 37.19, your stop is small. Good. But can you actually fill at 37.57? High volume helps, but spread matters. In a thought experiment, chasing price below 37.52 feels urgent. Waiting for a candle close near 38.1194 offers better price. The trade-off is suffering without confirmation.
A Useful Next Observation
Self-check: Can you identify a level where the idea breaks? If your stop sits inside the noise of 0.325953, the trade is fragile. A counterexample exists: if price ticks through 38.81 on high volume, the downside bias weakens. Do not infer intent from one candle. Verify if relative volume sustains. Reassess only if a closed candle rejects 37.8862. If the market moves against you without a structural break, you were too close. Distance protects logic. Chase only when the invalidation is obvious and the entry is clean. Never confuse speed with clarity. The goal is survivability, not speed. Wait for the candle to confirm the level you respect.
Probabilistic market research, not a recommendation or guaranteed return.
#DASH #RiskManagement #CryptoLearning
$DASH : Entry Quality or Invalidation Distance?
Does $DASH offer a clear entry?
The Tempting Shortcut
Traders often see price down hourly with 3.12x baseline volume. They assume failure and chase. This ignores execution reality.
A More Careful Interpretation
Think of a hypothetical plan. You want to buy near 37.52. But where do you exit if wrong? If your invalidation is tight at 37.19, your stop is small. Good. But can you actually fill at 37.57? High volume helps, but spread matters. In a thought experiment, chasing price below 37.52 feels urgent. Waiting for a candle close near 38.1194 offers better price. The trade-off is suffering without confirmation.
A Useful Next Observation
Self-check: Can you identify a level where the idea breaks? If your stop sits inside the noise of 0.325953, the trade is fragile. A counterexample exists: if price ticks through 38.81 on high volume, the downside bias weakens. Do not infer intent from one candle. Verify if relative volume sustains. Reassess only if a closed candle rejects 37.8862. If the market moves against you without a structural break, you were too close. Distance protects logic. Chase only when the invalidation is obvious and the entry is clean. Never confuse speed with clarity. The goal is survivability, not speed. Wait for the candle to confirm the level you respect.
Probabilistic market research, not a recommendation or guaranteed return.
#DASH #RiskManagement #CryptoLearning
Does $DASH offer a clear entry?
The Tempting Shortcut
Traders often see price down hourly with 3.12x baseline volume. They assume failure and chase. This ignores execution reality.
A More Careful Interpretation
Think of a hypothetical plan. You want to buy near 37.52. But where do you exit if wrong? If your invalidation is tight at 37.19, your stop is small. Good. But can you actually fill at 37.57? High volume helps, but spread matters. In a thought experiment, chasing price below 37.52 feels urgent. Waiting for a candle close near 38.1194 offers better price. The trade-off is suffering without confirmation.
A Useful Next Observation
Self-check: Can you identify a level where the idea breaks? If your stop sits inside the noise of 0.325953, the trade is fragile. A counterexample exists: if price ticks through 38.81 on high volume, the downside bias weakens. Do not infer intent from one candle. Verify if relative volume sustains. Reassess only if a closed candle rejects 37.8862. If the market moves against you without a structural break, you were too close. Distance protects logic. Chase only when the invalidation is obvious and the entry is clean. Never confuse speed with clarity. The goal is survivability, not speed. Wait for the candle to confirm the level you respect.
Probabilistic market research, not a recommendation or guaranteed return.
#DASH #RiskManagement #CryptoLearning
56

·
--
Падение
🔴 $DASH /$USDT – SHORT SIGNAL 📉
⏱ Timeframe: 4H
💰 Chart Price: 37.75 USDT
📊 TRADE SETUP
🔻 Direction: SHORT
🎯 Entry Zone: 40.50 – 42.00
✅ Take Profit:
TP1: 37.00
TP2: 35.00
TP3: 33.50
🛑 Stop Loss: 43.00
📉 TECHNICAL ANALYSIS:
• Strong bearish market structure.
• Lower highs and lower lows.
• Sellers remain in control.
• Price is trading below major resistance zones.
• Watch for rejection around the entry zone.
⚠️ Wait for bearish confirmation before entering.
Do not chase the price.
💬 Are you bearish on DASH?
{future}(DASHUSDT)
#DASH #DASHUSDT #CryptoSignals #Binance #Trading
🔴 $DASH /$USDT – SHORT SIGNAL 📉
⏱ Timeframe: 4H
💰 Chart Price: 37.75 USDT
📊 TRADE SETUP
🔻 Direction: SHORT
🎯 Entry Zone: 40.50 – 42.00
✅ Take Profit:
TP1: 37.00
TP2: 35.00
TP3: 33.50
🛑 Stop Loss: 43.00
📉 TECHNICAL ANALYSIS:
• Strong bearish market structure.
• Lower highs and lower lows.
• Sellers remain in control.
• Price is trading below major resistance zones.
• Watch for rejection around the entry zone.
⚠️ Wait for bearish confirmation before entering.
Do not chase the price.
💬 Are you bearish on DASH?
#DASH #DASHUSDT #CryptoSignals #Binance #Trading
⏱ Timeframe: 4H
💰 Chart Price: 37.75 USDT
📊 TRADE SETUP
🔻 Direction: SHORT
🎯 Entry Zone: 40.50 – 42.00
✅ Take Profit:
TP1: 37.00
TP2: 35.00
TP3: 33.50
🛑 Stop Loss: 43.00
📉 TECHNICAL ANALYSIS:
• Strong bearish market structure.
• Lower highs and lower lows.
• Sellers remain in control.
• Price is trading below major resistance zones.
• Watch for rejection around the entry zone.
⚠️ Wait for bearish confirmation before entering.
Do not chase the price.
💬 Are you bearish on DASH?
#DASH #DASHUSDT #CryptoSignals #Binance #Trading
HupoHDM:
Ok напишешь мне когда он будет 17-19$ . Я тебе скажу что будет дальше.
1
2
308

·
--
$DASH +4.39% | $S +4.34% | $SOL +4.23%
#DASH is holding $38.51, up +4.39% on $2.0 M of volume. Its promise of digital cash keeps it in the spotlight.
#S trades at $0.0336, gaining +4.34% with $1.3 M changing hands. The modest turnover suggests a cautious rally.
#SOL sits at $73.68, climbing +4.23% on a hefty $215.8 M of volume. Strong hands are clearly backing the move. 👀
The spread between SOL’s massive volume and the smaller caps could hint at where liquidity will flow next.
#Write2Earn #Binance
$DASH +4.39% | $S +4.34% | $SOL +4.23%
#DASH is holding $38.51, up +4.39% on $2.0 M of volume. Its promise of digital cash keeps it in the spotlight.
#S trades at $0.0336, gaining +4.34% with $1.3 M changing hands. The modest turnover suggests a cautious rally.
#SOL sits at $73.68, climbing +4.23% on a hefty $215.8 M of volume. Strong hands are clearly backing the move. 👀
The spread between SOL’s massive volume and the smaller caps could hint at where liquidity will flow next.
#Write2Earn #Binance
#DASH is holding $38.51, up +4.39% on $2.0 M of volume. Its promise of digital cash keeps it in the spotlight.
#S trades at $0.0336, gaining +4.34% with $1.3 M changing hands. The modest turnover suggests a cautious rally.
#SOL sits at $73.68, climbing +4.23% on a hefty $215.8 M of volume. Strong hands are clearly backing the move. 👀
The spread between SOL’s massive volume and the smaller caps could hint at where liquidity will flow next.
#Write2Earn #Binance
2

·
--
$DASH is showing a clear downtrend, with sellers stepping in and pushing the price lower.
📍 @ 37.58 | Volume: 0.07M USD
RSI 47 | EMA20: 37.6941 USD
📈 Trade Plan:
📈 Entry: 37.5056 – 37.6544
🛑 Stop Loss: 37.9519
🎯 TP1: 37.3321
🎯 TP2: 37.0841
🎯 TP3: 36.8362
Waiting for confirmation, then riding the downtrend.
👉 $DASH 👈 Catch it
#DASH
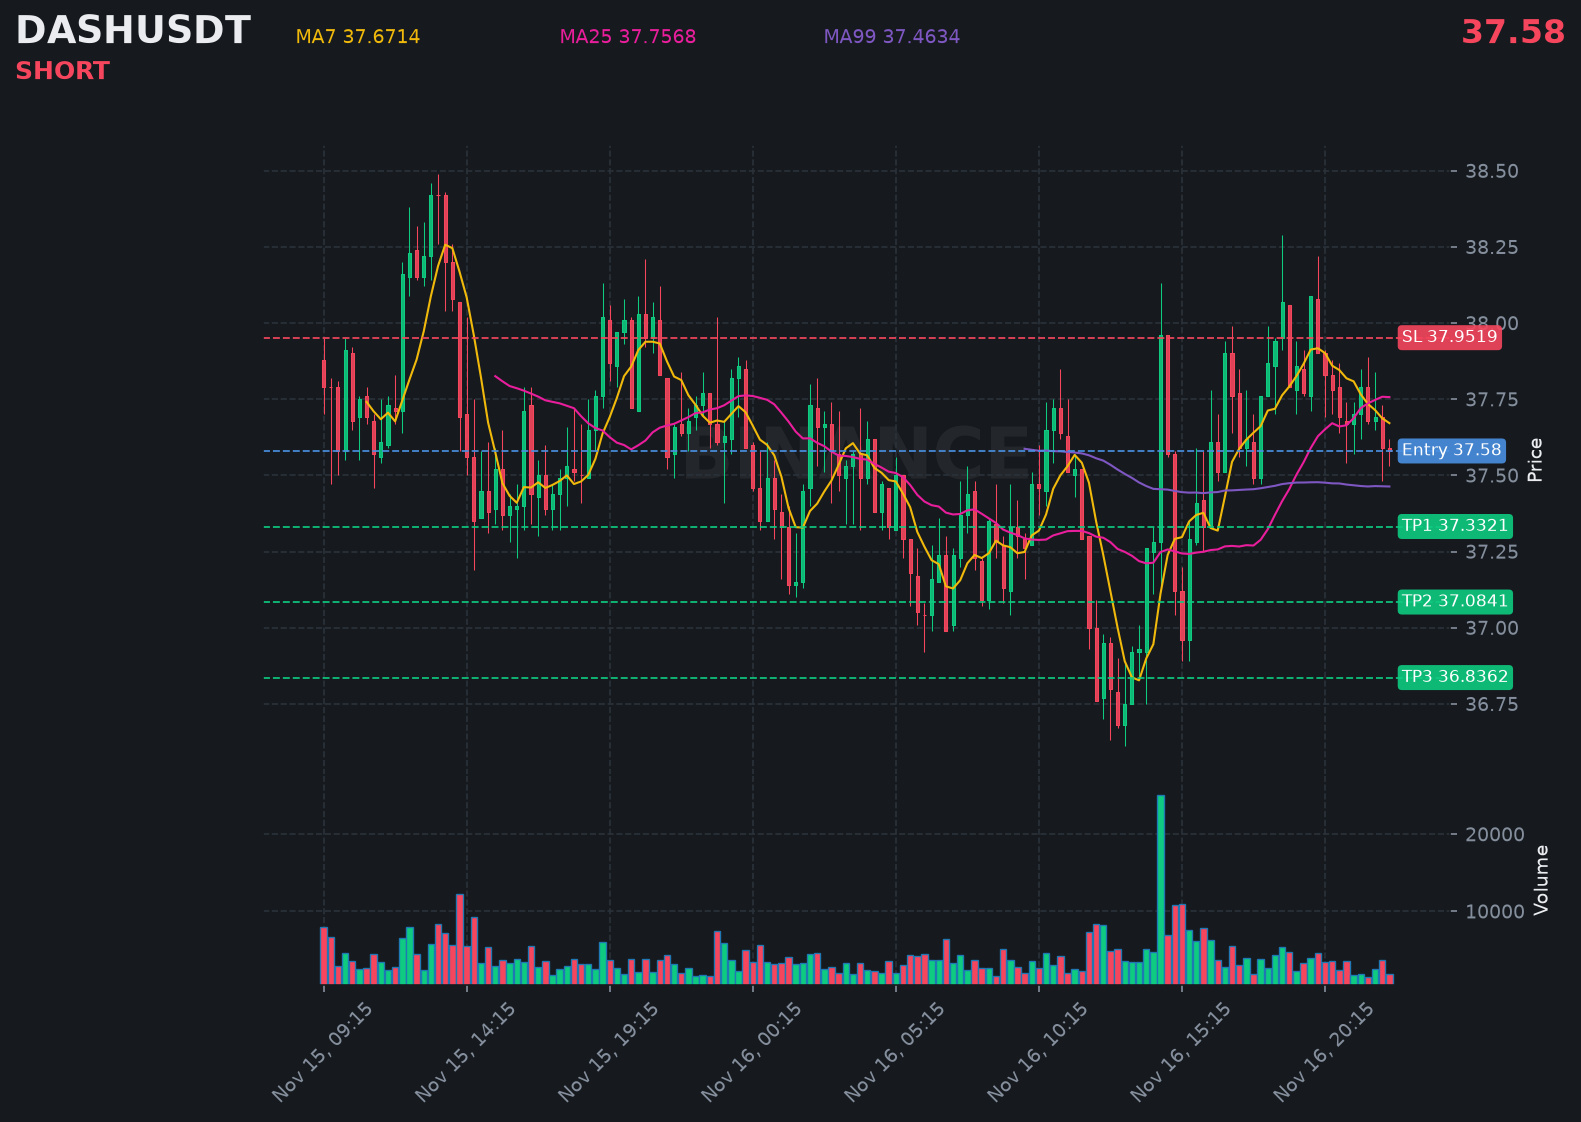
$DASH is showing a clear downtrend, with sellers stepping in and pushing the price lower.
📍 @ 37.58 | Volume: 0.07M USD
RSI 47 | EMA20: 37.6941 USD
📈 Trade Plan:
📈 Entry: 37.5056 – 37.6544
🛑 Stop Loss: 37.9519
🎯 TP1: 37.3321
🎯 TP2: 37.0841
🎯 TP3: 36.8362
Waiting for confirmation, then riding the downtrend.
👉 $DASH 👈 Catch it
#DASH
📍 @ 37.58 | Volume: 0.07M USD
RSI 47 | EMA20: 37.6941 USD
📈 Trade Plan:
📈 Entry: 37.5056 – 37.6544
🛑 Stop Loss: 37.9519
🎯 TP1: 37.3321
🎯 TP2: 37.0841
🎯 TP3: 36.8362
Waiting for confirmation, then riding the downtrend.
👉 $DASH 👈 Catch it
#DASH
119

·
--
Can $DASH clear the 37.8 resistance to align with its bullish intraday momentum? At 37.65, shorter timeframes are bullish, but the 4h trend remains bearish. Entry status is currently pending as price stays below that resistance level. Do you wait for the 4h trend to flip before trusting the shorter-term bullishness?
#DASH #CryptoAnalysis #PriceAction
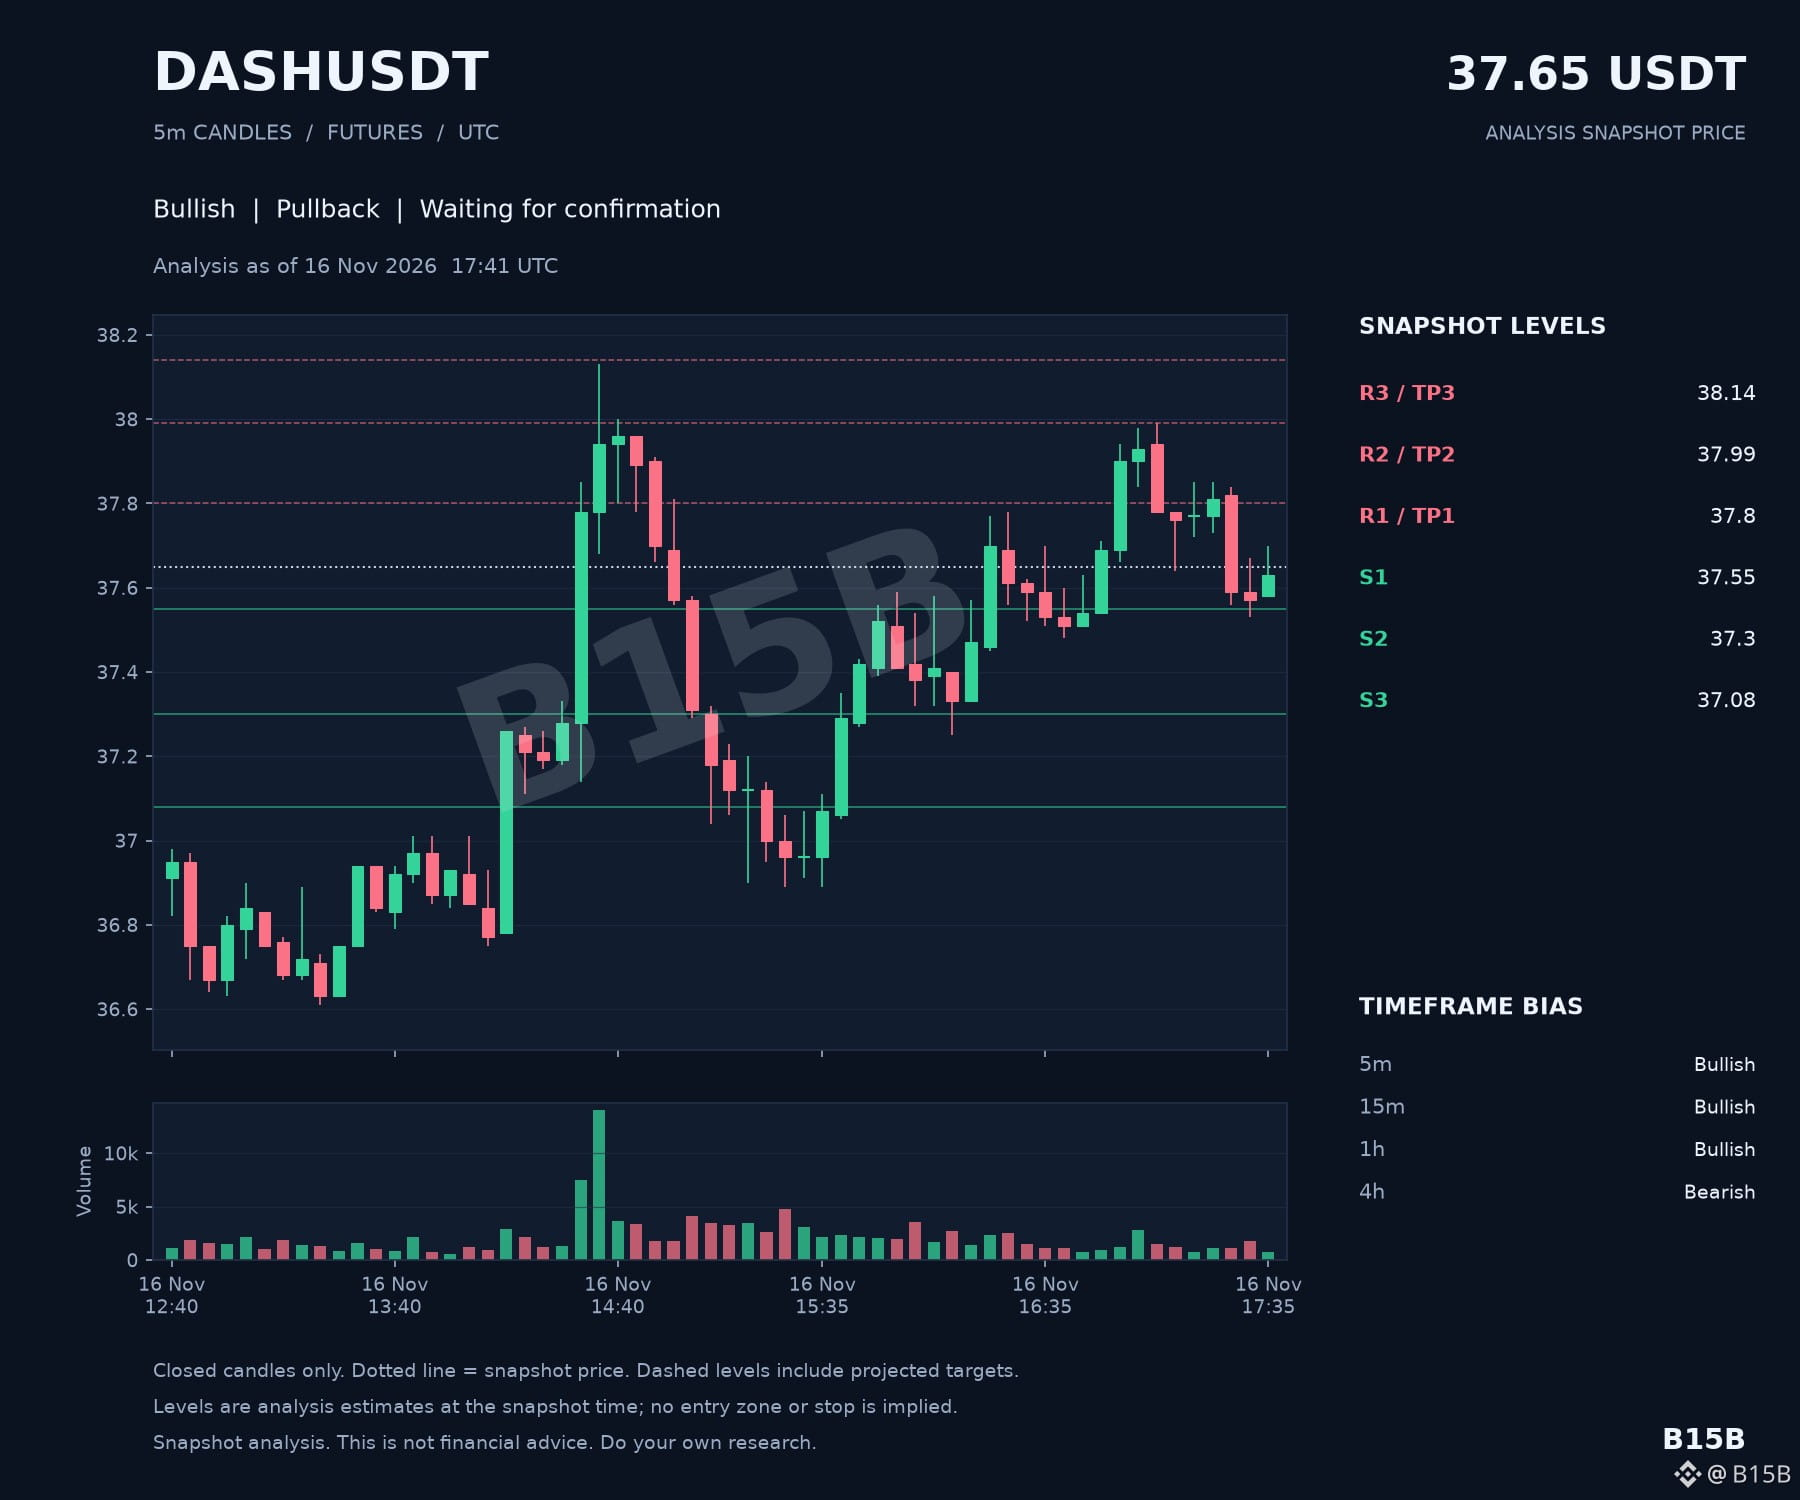
Can $DASH clear the 37.8 resistance to align with its bullish intraday momentum? At 37.65, shorter timeframes are bullish, but the 4h trend remains bearish. Entry status is currently pending as price stays below that resistance level. Do you wait for the 4h trend to flip before trusting the shorter-term bullishness?
#DASH #CryptoAnalysis #PriceAction
#DASH #CryptoAnalysis #PriceAction
13

·
--
#DASH ha 💯 chupado y fallado la puerta alcista de $48 múltiples veces PERO aún estamos manteniendo una actualización sólida!
PA parece seguir la misma estructura de bombeo y descarga una y otra vez, así que deberíamos tener un rebote y luego un sangrado lento de vuelta a la tendencia ascendente.
EVENTUALMENTE $48 se mantiene y enviamos a 1K! 🎯
NGL: esperaba que esta cosa escapara antes como lo hizo ZEC pero obviamente no podemos forzar el gráfico..
ASÍ QUE...
Sé paciente
Mantente atento
$DASH
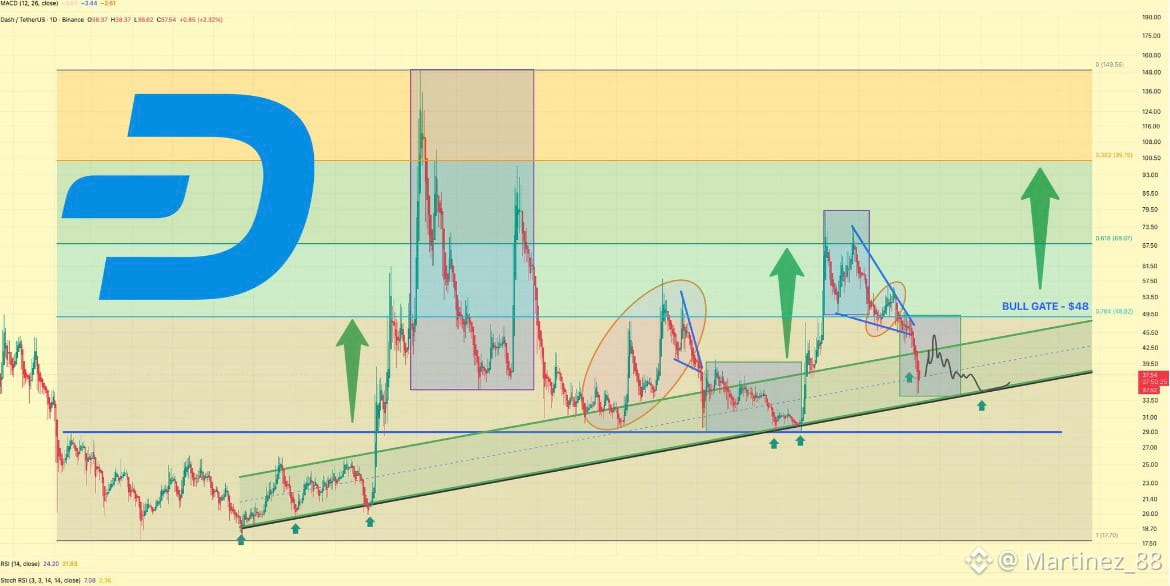
#DASH ha 💯 chupado y fallado la puerta alcista de $48 múltiples veces PERO aún estamos manteniendo una actualización sólida!
PA parece seguir la misma estructura de bombeo y descarga una y otra vez, así que deberíamos tener un rebote y luego un sangrado lento de vuelta a la tendencia ascendente.
EVENTUALMENTE $48 se mantiene y enviamos a 1K! 🎯
NGL: esperaba que esta cosa escapara antes como lo hizo ZEC pero obviamente no podemos forzar el gráfico..
ASÍ QUE...
Sé paciente
Mantente atento
$DASH
PA parece seguir la misma estructura de bombeo y descarga una y otra vez, así que deberíamos tener un rebote y luego un sangrado lento de vuelta a la tendencia ascendente.
EVENTUALMENTE $48 se mantiene y enviamos a 1K! 🎯
NGL: esperaba que esta cosa escapara antes como lo hizo ZEC pero obviamente no podemos forzar el gráfico..
ASÍ QUE...
Sé paciente
Mantente atento
$DASH
212

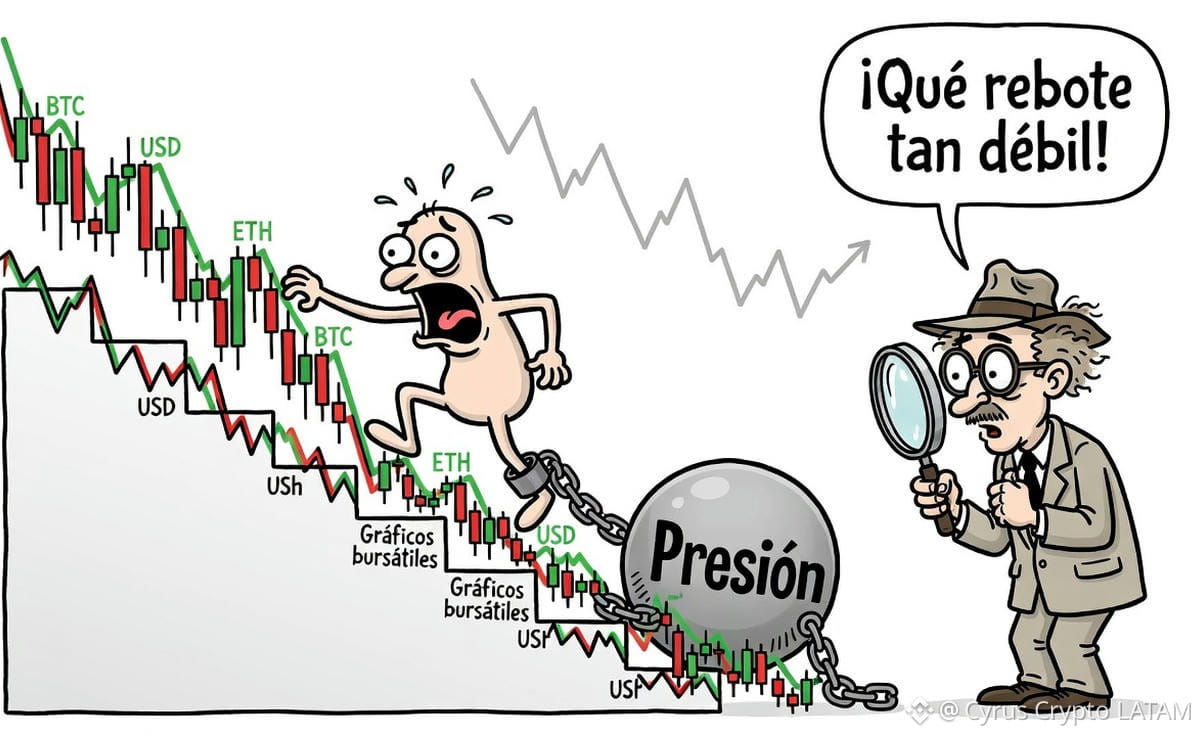
$DASH el 15 de noviembre: rebote limitado frente a una tendencia bajista
DASH subió frente al cierre previo, pero el rebote llega tras una semana de pérdidas, con el precio por debajo de sus principales promedios móviles y un volumen diario inferior al promedio de 30 días. El análisis identifica los niveles que pueden confirmar una recuperación o prolongar la presión, y distingue lo que muestran los datos de lo que aún no puede verificarse sobre derivados, adopción y catalizadores.
En las últimas 24 horas, DASH pasó del cierre previo de USD $37,26 a USD $37,76, una variación calculada de aproximadamente 1,34 %; el proveedor informa 1,35 %. La apertura fue de USD $37,16 y el rango diario estuvo entre USD $36,79 y USD $38,43.
#DASH es un activo asociado con una red de pagos, pero la información disponible no incluye indicadores para cuantificar el uso actual de ese servicio, los ingresos o comisiones del protocolo, el valor total bloqueado ni la demanda por aplicaciones. Esa ausencia impide evaluar si la capitalización refleja adopción o si depende principalmente de expectativas y actividad de mercado.
Recomendación: AGUANTAR (HOLD), con sesgo prudente. La metodología considera cinco señales: posición frente a las medias móviles, RSI, MACD, volumen relativo y relación con el VWAP. El precio está 1,29 % sobre el VWAP intradía, pero las señales principales son desfavorables: cotiza por debajo de las medias móviles suministradas, el MACD es bajista y el volumen diario está por debajo del promedio de 30 días. El RSI bajo puede ofrecer una condición táctica, pero no confirma por sí solo un giro.
Corto plazo: una estrategia táctica podría vigilar USD $36,79 como soporte y esperar una ruptura de USD $38,43 antes de considerar una entrada; la SMA-5 en USD $39,19 y el nivel de USD $39,97 son referencias técnicas, no objetivos garantizados. Un límite de pérdida bajo USD $36,79 debe considerarse junto al ATR de USD $3,52 y al tamaño de la posición, ya que el rango normal de fluctuación puede ser amplio.
{future}(DASHUSDT)
$DASH el 15 de noviembre: rebote limitado frente a una tendencia bajista
DASH subió frente al cierre previo, pero el rebote llega tras una semana de pérdidas, con el precio por debajo de sus principales promedios móviles y un volumen diario inferior al promedio de 30 días. El análisis identifica los niveles que pueden confirmar una recuperación o prolongar la presión, y distingue lo que muestran los datos de lo que aún no puede verificarse sobre derivados, adopción y catalizadores.
En las últimas 24 horas, DASH pasó del cierre previo de USD $37,26 a USD $37,76, una variación calculada de aproximadamente 1,34 %; el proveedor informa 1,35 %. La apertura fue de USD $37,16 y el rango diario estuvo entre USD $36,79 y USD $38,43.
#DASH es un activo asociado con una red de pagos, pero la información disponible no incluye indicadores para cuantificar el uso actual de ese servicio, los ingresos o comisiones del protocolo, el valor total bloqueado ni la demanda por aplicaciones. Esa ausencia impide evaluar si la capitalización refleja adopción o si depende principalmente de expectativas y actividad de mercado.
Recomendación: AGUANTAR (HOLD), con sesgo prudente. La metodología considera cinco señales: posición frente a las medias móviles, RSI, MACD, volumen relativo y relación con el VWAP. El precio está 1,29 % sobre el VWAP intradía, pero las señales principales son desfavorables: cotiza por debajo de las medias móviles suministradas, el MACD es bajista y el volumen diario está por debajo del promedio de 30 días. El RSI bajo puede ofrecer una condición táctica, pero no confirma por sí solo un giro.
Corto plazo: una estrategia táctica podría vigilar USD $36,79 como soporte y esperar una ruptura de USD $38,43 antes de considerar una entrada; la SMA-5 en USD $39,19 y el nivel de USD $39,97 son referencias técnicas, no objetivos garantizados. Un límite de pérdida bajo USD $36,79 debe considerarse junto al ATR de USD $3,52 y al tamaño de la posición, ya que el rango normal de fluctuación puede ser amplio.
DASH subió frente al cierre previo, pero el rebote llega tras una semana de pérdidas, con el precio por debajo de sus principales promedios móviles y un volumen diario inferior al promedio de 30 días. El análisis identifica los niveles que pueden confirmar una recuperación o prolongar la presión, y distingue lo que muestran los datos de lo que aún no puede verificarse sobre derivados, adopción y catalizadores.
En las últimas 24 horas, DASH pasó del cierre previo de USD $37,26 a USD $37,76, una variación calculada de aproximadamente 1,34 %; el proveedor informa 1,35 %. La apertura fue de USD $37,16 y el rango diario estuvo entre USD $36,79 y USD $38,43.
#DASH es un activo asociado con una red de pagos, pero la información disponible no incluye indicadores para cuantificar el uso actual de ese servicio, los ingresos o comisiones del protocolo, el valor total bloqueado ni la demanda por aplicaciones. Esa ausencia impide evaluar si la capitalización refleja adopción o si depende principalmente de expectativas y actividad de mercado.
Recomendación: AGUANTAR (HOLD), con sesgo prudente. La metodología considera cinco señales: posición frente a las medias móviles, RSI, MACD, volumen relativo y relación con el VWAP. El precio está 1,29 % sobre el VWAP intradía, pero las señales principales son desfavorables: cotiza por debajo de las medias móviles suministradas, el MACD es bajista y el volumen diario está por debajo del promedio de 30 días. El RSI bajo puede ofrecer una condición táctica, pero no confirma por sí solo un giro.
Corto plazo: una estrategia táctica podría vigilar USD $36,79 como soporte y esperar una ruptura de USD $38,43 antes de considerar una entrada; la SMA-5 en USD $39,19 y el nivel de USD $39,97 son referencias técnicas, no objetivos garantizados. Un límite de pérdida bajo USD $36,79 debe considerarse junto al ATR de USD $3,52 y al tamaño de la posición, ya que el rango normal de fluctuación puede ser amplio.
506

·
--
Падение
🔥 ¡DASH vuelve a estar en zona de ofertas!
DASH cotiza alrededor de los 36 dólares, un precio que me parece muy interesante para seguir acumulando.
La última vez que compramos a estos niveles, vimos cómo su precio subió hasta los 78 dólares, dejándonos una ganancia superior al 50%. 📈
Por eso ya tengo mis compras preparadas para seguir aprovechando posibles caídas y mejorar mi precio de costo.
Mi estrategia es sencilla: compras parciales, paciencia y aprovechar los precios bajos. Si baja más, compramos más; si sube, analizamos dónde tomar ganancias.
¡Las mejores oportunidades también aparecen cuando el mercado tiene miedo! 💰
#DASH #Criptomonedas #inversioninteligente #ComprasEnBajas #RIC $DASH
{spot}(DASHUSDT)
🔥 ¡DASH vuelve a estar en zona de ofertas!
DASH cotiza alrededor de los 36 dólares, un precio que me parece muy interesante para seguir acumulando.
La última vez que compramos a estos niveles, vimos cómo su precio subió hasta los 78 dólares, dejándonos una ganancia superior al 50%. 📈
Por eso ya tengo mis compras preparadas para seguir aprovechando posibles caídas y mejorar mi precio de costo.
Mi estrategia es sencilla: compras parciales, paciencia y aprovechar los precios bajos. Si baja más, compramos más; si sube, analizamos dónde tomar ganancias.
¡Las mejores oportunidades también aparecen cuando el mercado tiene miedo! 💰
#DASH #Criptomonedas #inversioninteligente #ComprasEnBajas #RIC $DASH
DASH cotiza alrededor de los 36 dólares, un precio que me parece muy interesante para seguir acumulando.
La última vez que compramos a estos niveles, vimos cómo su precio subió hasta los 78 dólares, dejándonos una ganancia superior al 50%. 📈
Por eso ya tengo mis compras preparadas para seguir aprovechando posibles caídas y mejorar mi precio de costo.
Mi estrategia es sencilla: compras parciales, paciencia y aprovechar los precios bajos. Si baja más, compramos más; si sube, analizamos dónde tomar ganancias.
¡Las mejores oportunidades también aparecen cuando el mercado tiene miedo! 💰
#DASH #Criptomonedas #inversioninteligente #ComprasEnBajas #RIC $DASH

2
816

·
--
Traders are watching whether $DASH can turn this retest into continuation.
$DASH – Price is trying to stabilize near support, and buyers are watching for continuation from this area.
Trading Plan LONG $DASH (max 10x)
🎯 Entry: 37.056 - 37.355
🛑 SL: 37.031
✅ TP1: 37.727
✅ TP2: 38.212
✅ TP3: 38.771
• Fresh 24h volatility is creating a cleaner setup
• Relative volume is keeping this chart active on watchlists
Would you long the retest on $DASH, or wait for a reclaim first?
Trade $DASH here 👇
#DASH #Crypto #PriceAction
Traders are watching whether $DASH can turn this retest into continuation.
$DASH – Price is trying to stabilize near support, and buyers are watching for continuation from this area.
Trading Plan LONG $DASH (max 10x)
🎯 Entry: 37.056 - 37.355
🛑 SL: 37.031
✅ TP1: 37.727
✅ TP2: 38.212
✅ TP3: 38.771
• Fresh 24h volatility is creating a cleaner setup
• Relative volume is keeping this chart active on watchlists
Would you long the retest on $DASH , or wait for a reclaim first?
Trade $DASH here 👇
#DASH #Crypto #PriceAction
$DASH – Price is trying to stabilize near support, and buyers are watching for continuation from this area.
Trading Plan LONG $DASH (max 10x)
🎯 Entry: 37.056 - 37.355
🛑 SL: 37.031
✅ TP1: 37.727
✅ TP2: 38.212
✅ TP3: 38.771
• Fresh 24h volatility is creating a cleaner setup
• Relative volume is keeping this chart active on watchlists
Would you long the retest on $DASH , or wait for a reclaim first?
Trade $DASH here 👇
#DASH #Crypto #PriceAction
70
Войдите, чтобы посмотреть больше материала
Присоединяйтесь к пользователям криптовалют по всему миру на Binance Square
⚡️ Получайте новейшую и полезную информацию о криптоактивах.
💬 Нам доверяет крупнейшая в мире криптобиржа.
👍 Получите достоверные аналитические данные от верифицированных создателей контента.
Эл. почта/номер телефона
В тренде
1
#IsAnthropic’s$1.5TMarketCapJustified?
Просмотров: 58,164
291 обсуждают
2
#BTCBelow$62KAmidHikeFearsAndShiftToAnthropic
Просмотров: 14,978
95 обсуждают
3
#NvidiaBoardReportedlySplitOverHuang’sReturn
Просмотров: 243,558
1,928 обсуждают
4
#CanGTA6'sLaunchLiftTTWOShares?
Просмотров: 193,788
1,368 обсуждают
5
#HongKongProposesSFCLicensingForFourVirtualAssetServices
Просмотров: 218
7 обсуждают
6
#BlackRockBitcoinETFRecordsLargestDailyOutflow
Просмотров: 12,242
133 обсуждают
7
#LedgerProbesTamperedWalletsInBerlinAndDubai
Просмотров: 22,444
292 обсуждают
8
#13FInstitutionsBitcoinSpotETPHoldingsHitRecord
Просмотров: 38,499
350 обсуждают
9
#BTCRemainsUnderPressureAfterHawkishFOMCMinutes
Просмотров: 412,538
2,618 обсуждают
10
#StrategySTRCPreferredSlips3.65%Below$100Par
Просмотров: 14,094
104 обсуждают