
Mukhtiar_Ali_55
11.7k Публикации

Mukhtiar_Ali_55
Отправить жалобу
Заблокировать пользователя
32 подписок(и/а)
433 подписчиков(а)
4.3K+ понравилось
Посты
Все
Цитирования
RAD, FF and PHA: Where Momentum Is Building and Where Caution Still MattersThe latest Binance spot market action across RAD, FF and PHA shows a market that is rewarding selective strength rather than lifting every altcoin equally. All three assets are positive during the current 24 hour session, but the quality of their moves is different. PHA is showing the strongest momentum and the clearest buyer control, FF is holding a constructive but more measured structure, while RAD has recovered from its lows but still needs to prove that it can reclaim the upper portion of its daily range.
This distinction matters because short term green candles alone do not tell the whole story. Price location, volume participation and the ability to hold gains near the session high often reveal more about current market conviction than percentage change by itself. In this group, PHA is currently leading on momentum, FF is showing relative stability, and RAD remains the more volatile infrastructure play with a wider intraday range.
RAD is currently trading around $0.220, up +2.80% from its 24 hour open of $0.214. During the session, RAD reached a high of $0.240 and a low of $0.211. The token is now 4.27% above the session low, which confirms that buyers have stepped in after early weakness. However, RAD is still 8.33% below the daily high, showing that the market has not yet fully recovered the selling pressure that appeared near $0.240.
RAD represents the Radworks ecosystem and remains linked to the infrastructure narrative. Infrastructure assets can attract rapid attention when the market rotates toward development tools, decentralized collaboration and ecosystem growth. At the same time, these assets can be highly reactive to liquidity conditions because their price action is often driven by momentum traders as much as long term positioning.
The current structure suggests that RAD has a positive recovery profile but not yet a complete momentum breakout profile. Its approximately $2.31M in 24 hour quote volume on Binance shows active participation, although the wide range between $0.211 and $0.240 highlights elevated volatility. Traders watching RAD will likely focus on whether the market can sustain higher lows and gradually reclaim the upper range. A rejection from the current zone could keep the token moving in a broad consolidation pattern.
FF, the token associated with Falcon Finance, is currently trading near $0.10025. It is up +0.87% from the 24 hour open of $0.09939, after trading between $0.09579 and $0.10309. The move may appear modest compared with PHA, but the positioning is constructive. FF is only 2.75% below its session high and remains 4.66% above the session low, showing that buyers have preserved most of the recovery after the dip.
That is an important difference. A token does not need to post the largest percentage gain to show healthy structure. FF is displaying a more balanced intraday profile, with price holding near the upper part of its range instead of falling back toward the lows. With approximately $2.28M in 24 hour quote volume on Binance, the token is seeing active turnover while maintaining a relatively controlled range.
FF is connected to the DeFi and stablecoin focused narrative, which means its performance can depend heavily on broader appetite for on chain yield, collateral efficiency and decentralized financial infrastructure. The current market behavior suggests cautious accumulation rather than aggressive speculation. For momentum to strengthen, the market would need to see continued demand without a sharp rise in selling volume near the session high. Until then, FF remains a token where patience and confirmation may matter more than chasing a small intraday move.
PHA is clearly the strongest performer in this comparison. It is trading near $0.0321, up +7.36% from the 24 hour open of $0.0299. PHA reached a high of $0.0327 and a low of $0.0295, and the current price is 8.81% above the session low. More importantly, it is only 1.83% below the daily high, showing that buyers are maintaining control near the top of the range.
PHA is associated with Phala Network and sits at the intersection of infrastructure, AI and decentralized computing narratives. These sectors can attract strong attention when the market seeks projects with technology focused utility rather than purely speculative appeal. PHA’s roughly $2.34M in 24 hour quote volume on Binance supports the view that this move is receiving meaningful participation instead of occurring in a thin trading environment.
Still, strong momentum brings its own risk. When a token trades close to its session high after a sharp advance, short term volatility can increase quickly if buyers pause or broader market sentiment weakens. PHA currently has the strongest structure among the three, but traders should distinguish between momentum continuation and emotional chasing. The next phase will depend on whether price can hold its gains while volume remains consistent.
The broader message from RAD, FF and PHA is clear. PHA is leading on current momentum, FF is showing controlled resilience, and RAD is recovering but remains further from confirming a stronger upside structure. These are different narratives with different volatility profiles, so treating them as identical trades can create unnecessary risk. In a selective altcoin market, the assets that hold close to their highs with stable volume often attract the most attention, but risk management remains essential when price moves become crowded.
$RAD
{spot}(RADUSDT)
$FF
{spot}(FFUSDT)
$PHA
{spot}(PHAUSDT)
RAD, FF and PHA: Where Momentum Is Building and Where Caution Still Matters
The latest Binance spot market action across RAD, FF and PHA shows a market that is rewarding selective strength rather than lifting every altcoin equally. All three assets are positive during the current 24 hour session, but the quality of their moves is different. PHA is showing the strongest momentum and the clearest buyer control, FF is holding a constructive but more measured structure, while RAD has recovered from its lows but still needs to prove that it can reclaim the upper portion of its daily range.
This distinction matters because short term green candles alone do not tell the whole story. Price location, volume participation and the ability to hold gains near the session high often reveal more about current market conviction than percentage change by itself. In this group, PHA is currently leading on momentum, FF is showing relative stability, and RAD remains the more volatile infrastructure play with a wider intraday range.
RAD is currently trading around $0.220, up +2.80% from its 24 hour open of $0.214. During the session, RAD reached a high of $0.240 and a low of $0.211. The token is now 4.27% above the session low, which confirms that buyers have stepped in after early weakness. However, RAD is still 8.33% below the daily high, showing that the market has not yet fully recovered the selling pressure that appeared near $0.240.
RAD represents the Radworks ecosystem and remains linked to the infrastructure narrative. Infrastructure assets can attract rapid attention when the market rotates toward development tools, decentralized collaboration and ecosystem growth. At the same time, these assets can be highly reactive to liquidity conditions because their price action is often driven by momentum traders as much as long term positioning.
The current structure suggests that RAD has a positive recovery profile but not yet a complete momentum breakout profile. Its approximately $2.31M in 24 hour quote volume on Binance shows active participation, although the wide range between $0.211 and $0.240 highlights elevated volatility. Traders watching RAD will likely focus on whether the market can sustain higher lows and gradually reclaim the upper range. A rejection from the current zone could keep the token moving in a broad consolidation pattern.
FF, the token associated with Falcon Finance, is currently trading near $0.10025. It is up +0.87% from the 24 hour open of $0.09939, after trading between $0.09579 and $0.10309. The move may appear modest compared with PHA, but the positioning is constructive. FF is only 2.75% below its session high and remains 4.66% above the session low, showing that buyers have preserved most of the recovery after the dip.
That is an important difference. A token does not need to post the largest percentage gain to show healthy structure. FF is displaying a more balanced intraday profile, with price holding near the upper part of its range instead of falling back toward the lows. With approximately $2.28M in 24 hour quote volume on Binance, the token is seeing active turnover while maintaining a relatively controlled range.
FF is connected to the DeFi and stablecoin focused narrative, which means its performance can depend heavily on broader appetite for on chain yield, collateral efficiency and decentralized financial infrastructure. The current market behavior suggests cautious accumulation rather than aggressive speculation. For momentum to strengthen, the market would need to see continued demand without a sharp rise in selling volume near the session high. Until then, FF remains a token where patience and confirmation may matter more than chasing a small intraday move.
PHA is clearly the strongest performer in this comparison. It is trading near $0.0321, up +7.36% from the 24 hour open of $0.0299. PHA reached a high of $0.0327 and a low of $0.0295, and the current price is 8.81% above the session low. More importantly, it is only 1.83% below the daily high, showing that buyers are maintaining control near the top of the range.
PHA is associated with Phala Network and sits at the intersection of infrastructure, AI and decentralized computing narratives. These sectors can attract strong attention when the market seeks projects with technology focused utility rather than purely speculative appeal. PHA’s roughly $2.34M in 24 hour quote volume on Binance supports the view that this move is receiving meaningful participation instead of occurring in a thin trading environment.
Still, strong momentum brings its own risk. When a token trades close to its session high after a sharp advance, short term volatility can increase quickly if buyers pause or broader market sentiment weakens. PHA currently has the strongest structure among the three, but traders should distinguish between momentum continuation and emotional chasing. The next phase will depend on whether price can hold its gains while volume remains consistent.
The broader message from RAD, FF and PHA is clear. PHA is leading on current momentum, FF is showing controlled resilience, and RAD is recovering but remains further from confirming a stronger upside structure. These are different narratives with different volatility profiles, so treating them as identical trades can create unnecessary risk. In a selective altcoin market, the assets that hold close to their highs with stable volume often attract the most attention, but risk management remains essential when price moves become crowded.
$RAD
$FF
$PHA
This distinction matters because short term green candles alone do not tell the whole story. Price location, volume participation and the ability to hold gains near the session high often reveal more about current market conviction than percentage change by itself. In this group, PHA is currently leading on momentum, FF is showing relative stability, and RAD remains the more volatile infrastructure play with a wider intraday range.
RAD is currently trading around $0.220, up +2.80% from its 24 hour open of $0.214. During the session, RAD reached a high of $0.240 and a low of $0.211. The token is now 4.27% above the session low, which confirms that buyers have stepped in after early weakness. However, RAD is still 8.33% below the daily high, showing that the market has not yet fully recovered the selling pressure that appeared near $0.240.
RAD represents the Radworks ecosystem and remains linked to the infrastructure narrative. Infrastructure assets can attract rapid attention when the market rotates toward development tools, decentralized collaboration and ecosystem growth. At the same time, these assets can be highly reactive to liquidity conditions because their price action is often driven by momentum traders as much as long term positioning.
The current structure suggests that RAD has a positive recovery profile but not yet a complete momentum breakout profile. Its approximately $2.31M in 24 hour quote volume on Binance shows active participation, although the wide range between $0.211 and $0.240 highlights elevated volatility. Traders watching RAD will likely focus on whether the market can sustain higher lows and gradually reclaim the upper range. A rejection from the current zone could keep the token moving in a broad consolidation pattern.
FF, the token associated with Falcon Finance, is currently trading near $0.10025. It is up +0.87% from the 24 hour open of $0.09939, after trading between $0.09579 and $0.10309. The move may appear modest compared with PHA, but the positioning is constructive. FF is only 2.75% below its session high and remains 4.66% above the session low, showing that buyers have preserved most of the recovery after the dip.
That is an important difference. A token does not need to post the largest percentage gain to show healthy structure. FF is displaying a more balanced intraday profile, with price holding near the upper part of its range instead of falling back toward the lows. With approximately $2.28M in 24 hour quote volume on Binance, the token is seeing active turnover while maintaining a relatively controlled range.
FF is connected to the DeFi and stablecoin focused narrative, which means its performance can depend heavily on broader appetite for on chain yield, collateral efficiency and decentralized financial infrastructure. The current market behavior suggests cautious accumulation rather than aggressive speculation. For momentum to strengthen, the market would need to see continued demand without a sharp rise in selling volume near the session high. Until then, FF remains a token where patience and confirmation may matter more than chasing a small intraday move.
PHA is clearly the strongest performer in this comparison. It is trading near $0.0321, up +7.36% from the 24 hour open of $0.0299. PHA reached a high of $0.0327 and a low of $0.0295, and the current price is 8.81% above the session low. More importantly, it is only 1.83% below the daily high, showing that buyers are maintaining control near the top of the range.
PHA is associated with Phala Network and sits at the intersection of infrastructure, AI and decentralized computing narratives. These sectors can attract strong attention when the market seeks projects with technology focused utility rather than purely speculative appeal. PHA’s roughly $2.34M in 24 hour quote volume on Binance supports the view that this move is receiving meaningful participation instead of occurring in a thin trading environment.
Still, strong momentum brings its own risk. When a token trades close to its session high after a sharp advance, short term volatility can increase quickly if buyers pause or broader market sentiment weakens. PHA currently has the strongest structure among the three, but traders should distinguish between momentum continuation and emotional chasing. The next phase will depend on whether price can hold its gains while volume remains consistent.
The broader message from RAD, FF and PHA is clear. PHA is leading on current momentum, FF is showing controlled resilience, and RAD is recovering but remains further from confirming a stronger upside structure. These are different narratives with different volatility profiles, so treating them as identical trades can create unnecessary risk. In a selective altcoin market, the assets that hold close to their highs with stable volume often attract the most attention, but risk management remains essential when price moves become crowded.
$RAD
$FF
$PHA
3
FET, ETHFI and CAKE: Three Different Narratives, One Market LessonThe latest Binance spot data shows a clear divergence across FET, ETHFI and CAKE. While FET and CAKE are holding constructive intraday momentum, ETHFI is facing visible selling pressure after failing to sustain the upper end of its daily range. This is exactly why traders should avoid treating the altcoin market as one single trade. Capital is moving selectively, and each token is reacting to a different narrative, liquidity profile and level of market confidence.
FET is currently trading near $0.1332, up 1.06% from its 24 hour open of $0.1318. The session range has remained relatively controlled, with a low of $0.1278 and a high of $0.1338. What stands out is that FET is trading only 0.45% below its daily high, showing that buyers have been able to absorb selling pressure near the top of the range rather than allowing a sharp pullback.
That matters because FET remains closely tied to the artificial intelligence narrative, one of the most watched themes in the crypto market. AI related tokens can attract rapid attention when broader risk appetite improves, but they can also experience sharp reversals when volume fades. The current price structure suggests that FET has maintained short term demand, yet sustained strength will depend on whether buyers can continue defending the recent higher range instead of allowing price to slip back toward the session low.
The key takeaway for FET is not just the green percentage. It is the positioning near the daily high combined with roughly $5.00M in 24 hour quote volume on Binance spot. That indicates active participation, although traders should remain aware that AI tokens often react quickly to broader sentiment shifts in Bitcoin, Ethereum and the technology narrative across global markets.
ETHFI is showing the opposite side of the market. It is currently trading around $0.4743, down 4.41% from its 24 hour open of $0.4962. The token reached a high of $0.5008 before falling to a low of $0.4685, and the current price is only 1.24% above that daily low. This tells a more cautious story. Sellers have had control for much of the session, and the market has not yet demonstrated a strong recovery from the lower range.
ETHFI remains connected to the liquid staking and restaking ecosystem, a sector that can see major interest when Ethereum based yield narratives gain momentum. However, the current session reflects a market that is demanding confirmation rather than simply rewarding the narrative. The decline is not proof of a long term trend by itself, but it does show that short term participants are reducing exposure or waiting for stronger demand before re engaging.
For ETHFI, the important question is whether the token can stabilize above the session low and begin building a base, or whether continued weakness invites another round of risk reduction. Volume has remained active at roughly $2.59M in 24 hour quote volume, which means the move is not occurring in an empty market. Active volume during a decline can represent both selling pressure and potential accumulation, so price behavior around the lower range will remain more important than headlines alone.
CAKE is currently trading near $1.619, up 1.50% from its 24 hour open of $1.595. The token has traded between $1.554 and $1.624 during the session, placing it just 0.31% below the daily high. This is a constructive short term signal because CAKE has recovered from the lower end of the range and is now testing the upper boundary with buyers still engaged.
As the token associated with PancakeSwap, CAKE is influenced by activity across decentralized trading, liquidity incentives and the broader BNB Chain ecosystem. Unlike purely narrative driven tokens, CAKE often benefits when DeFi participation, trading volumes and on chain activity strengthen. Its current move reflects renewed interest, but the market still needs to see whether that interest can translate into sustained volume rather than a brief intraday push.
The contrast between these three assets is important. FET is holding close to its high with AI narrative support. CAKE is also near its high, supported by renewed DeFi attention and a stronger intraday structure. ETHFI, meanwhile, is trading near its low and remains the most vulnerable of the three in the current session.
For traders watching this group, the broader lesson is simple. Strong narratives can attract attention, but price location inside the daily range reveals who currently has control. FET and CAKE are showing buyers defending momentum. ETHFI is showing a market still searching for stability. Conditions can change quickly, especially in altcoins, so disciplined risk management and confirmation from volume remain essential.
$FET
{spot}(FETUSDT)
$ETHFI
{spot}(ETHFIUSDT)
$CAKE
{spot}(CAKEUSDT)
FET, ETHFI and CAKE: Three Different Narratives, One Market Lesson
The latest Binance spot data shows a clear divergence across FET, ETHFI and CAKE. While FET and CAKE are holding constructive intraday momentum, ETHFI is facing visible selling pressure after failing to sustain the upper end of its daily range. This is exactly why traders should avoid treating the altcoin market as one single trade. Capital is moving selectively, and each token is reacting to a different narrative, liquidity profile and level of market confidence.
FET is currently trading near $0.1332, up 1.06% from its 24 hour open of $0.1318. The session range has remained relatively controlled, with a low of $0.1278 and a high of $0.1338. What stands out is that FET is trading only 0.45% below its daily high, showing that buyers have been able to absorb selling pressure near the top of the range rather than allowing a sharp pullback.
That matters because FET remains closely tied to the artificial intelligence narrative, one of the most watched themes in the crypto market. AI related tokens can attract rapid attention when broader risk appetite improves, but they can also experience sharp reversals when volume fades. The current price structure suggests that FET has maintained short term demand, yet sustained strength will depend on whether buyers can continue defending the recent higher range instead of allowing price to slip back toward the session low.
The key takeaway for FET is not just the green percentage. It is the positioning near the daily high combined with roughly $5.00M in 24 hour quote volume on Binance spot. That indicates active participation, although traders should remain aware that AI tokens often react quickly to broader sentiment shifts in Bitcoin, Ethereum and the technology narrative across global markets.
ETHFI is showing the opposite side of the market. It is currently trading around $0.4743, down 4.41% from its 24 hour open of $0.4962. The token reached a high of $0.5008 before falling to a low of $0.4685, and the current price is only 1.24% above that daily low. This tells a more cautious story. Sellers have had control for much of the session, and the market has not yet demonstrated a strong recovery from the lower range.
ETHFI remains connected to the liquid staking and restaking ecosystem, a sector that can see major interest when Ethereum based yield narratives gain momentum. However, the current session reflects a market that is demanding confirmation rather than simply rewarding the narrative. The decline is not proof of a long term trend by itself, but it does show that short term participants are reducing exposure or waiting for stronger demand before re engaging.
For ETHFI, the important question is whether the token can stabilize above the session low and begin building a base, or whether continued weakness invites another round of risk reduction. Volume has remained active at roughly $2.59M in 24 hour quote volume, which means the move is not occurring in an empty market. Active volume during a decline can represent both selling pressure and potential accumulation, so price behavior around the lower range will remain more important than headlines alone.
CAKE is currently trading near $1.619, up 1.50% from its 24 hour open of $1.595. The token has traded between $1.554 and $1.624 during the session, placing it just 0.31% below the daily high. This is a constructive short term signal because CAKE has recovered from the lower end of the range and is now testing the upper boundary with buyers still engaged.
As the token associated with PancakeSwap, CAKE is influenced by activity across decentralized trading, liquidity incentives and the broader BNB Chain ecosystem. Unlike purely narrative driven tokens, CAKE often benefits when DeFi participation, trading volumes and on chain activity strengthen. Its current move reflects renewed interest, but the market still needs to see whether that interest can translate into sustained volume rather than a brief intraday push.
The contrast between these three assets is important. FET is holding close to its high with AI narrative support. CAKE is also near its high, supported by renewed DeFi attention and a stronger intraday structure. ETHFI, meanwhile, is trading near its low and remains the most vulnerable of the three in the current session.
For traders watching this group, the broader lesson is simple. Strong narratives can attract attention, but price location inside the daily range reveals who currently has control. FET and CAKE are showing buyers defending momentum. ETHFI is showing a market still searching for stability. Conditions can change quickly, especially in altcoins, so disciplined risk management and confirmation from volume remain essential.
$FET
$ETHFI
$CAKE
FET is currently trading near $0.1332, up 1.06% from its 24 hour open of $0.1318. The session range has remained relatively controlled, with a low of $0.1278 and a high of $0.1338. What stands out is that FET is trading only 0.45% below its daily high, showing that buyers have been able to absorb selling pressure near the top of the range rather than allowing a sharp pullback.
That matters because FET remains closely tied to the artificial intelligence narrative, one of the most watched themes in the crypto market. AI related tokens can attract rapid attention when broader risk appetite improves, but they can also experience sharp reversals when volume fades. The current price structure suggests that FET has maintained short term demand, yet sustained strength will depend on whether buyers can continue defending the recent higher range instead of allowing price to slip back toward the session low.
The key takeaway for FET is not just the green percentage. It is the positioning near the daily high combined with roughly $5.00M in 24 hour quote volume on Binance spot. That indicates active participation, although traders should remain aware that AI tokens often react quickly to broader sentiment shifts in Bitcoin, Ethereum and the technology narrative across global markets.
ETHFI is showing the opposite side of the market. It is currently trading around $0.4743, down 4.41% from its 24 hour open of $0.4962. The token reached a high of $0.5008 before falling to a low of $0.4685, and the current price is only 1.24% above that daily low. This tells a more cautious story. Sellers have had control for much of the session, and the market has not yet demonstrated a strong recovery from the lower range.
ETHFI remains connected to the liquid staking and restaking ecosystem, a sector that can see major interest when Ethereum based yield narratives gain momentum. However, the current session reflects a market that is demanding confirmation rather than simply rewarding the narrative. The decline is not proof of a long term trend by itself, but it does show that short term participants are reducing exposure or waiting for stronger demand before re engaging.
For ETHFI, the important question is whether the token can stabilize above the session low and begin building a base, or whether continued weakness invites another round of risk reduction. Volume has remained active at roughly $2.59M in 24 hour quote volume, which means the move is not occurring in an empty market. Active volume during a decline can represent both selling pressure and potential accumulation, so price behavior around the lower range will remain more important than headlines alone.
CAKE is currently trading near $1.619, up 1.50% from its 24 hour open of $1.595. The token has traded between $1.554 and $1.624 during the session, placing it just 0.31% below the daily high. This is a constructive short term signal because CAKE has recovered from the lower end of the range and is now testing the upper boundary with buyers still engaged.
As the token associated with PancakeSwap, CAKE is influenced by activity across decentralized trading, liquidity incentives and the broader BNB Chain ecosystem. Unlike purely narrative driven tokens, CAKE often benefits when DeFi participation, trading volumes and on chain activity strengthen. Its current move reflects renewed interest, but the market still needs to see whether that interest can translate into sustained volume rather than a brief intraday push.
The contrast between these three assets is important. FET is holding close to its high with AI narrative support. CAKE is also near its high, supported by renewed DeFi attention and a stronger intraday structure. ETHFI, meanwhile, is trading near its low and remains the most vulnerable of the three in the current session.
For traders watching this group, the broader lesson is simple. Strong narratives can attract attention, but price location inside the daily range reveals who currently has control. FET and CAKE are showing buyers defending momentum. ETHFI is showing a market still searching for stability. Conditions can change quickly, especially in altcoins, so disciplined risk management and confirmation from volume remain essential.
$FET
$ETHFI
$CAKE
20
MARSCOIN, ONE and MEGA: Three Different Market Signals in a Selective Crypto EnvironmentThe latest spot market activity across MARSCOIN, ONE, and MEGA shows a market where attention is moving selectively rather than broadly. All three assets are active, but their price structures tell very different stories. MARSCOIN is showing modest upward momentum with solid price retention near the daily high. ONE has experienced the widest relative volatility but is currently back at its opening level. MEGA is trading with a measured positive bias and a comparatively controlled intraday range.
This distinction matters because the headline percentage move is only one part of the story. Traders are also watching how each asset behaves after testing highs and lows, whether volume supports the move, and whether buyers can retain control when short term profit taking appears. In a fast moving market, price retention and liquidity often reveal more than a single green candle.
MARSCOIN is trading around $0.0337, up +0.60% from its 24 hour open of $0.0335. The asset reached a high of $0.0343 and a low of $0.0313, creating a 9.58% trading range. MARSCOIN is currently only 1.75% below its session high, which suggests that buyers have retained most of the recovery after price explored lower levels earlier in the session.
The market has generated approximately $2.81M in quoted 24 hour volume, showing that current price action is supported by active participation. MARSCOIN’s ability to remain above the daily open and close to the session high is the strongest short term feature of its structure. It does not guarantee continuation, but it indicates that the upside move has not been immediately rejected.
At the same time, the nearly 10% daily range confirms that the market remains volatile. This is a setting where sudden expansions can attract momentum traders, but it can also produce rapid reversals if liquidity slows. The most relevant observation is whether MARSCOIN can keep holding above its opening price while volume remains consistent. Stable consolidation near the upper range would show a more orderly market than a sharp move followed by immediate selling pressure.
Harmony, trading under the ticker ONE, is currently priced around $0.001307, unchanged from its 24 hour open of $0.001307. ONE reached a high of $0.001438 and a low of $0.001274, producing the widest relative range among the three assets at 12.87%. Although the price is flat over the session, the path has been far from quiet.
ONE is currently 9.11% below its daily high, showing that sellers became active after the earlier upside test. The market traded through a meaningful intraday range and then returned to the opening level, which reflects a balance between buyers and sellers rather than a decisive directional trend. With roughly $2.70M in quoted 24 hour volume, the price movement is occurring within an active market.
ONE remains tied to the broader Layer 1 narrative, where investor attention often depends on ecosystem development, network usage, and wider appetite for higher beta assets. The current price behavior highlights caution. Buyers have shown interest near the session low, but they have not yet been able to maintain control near the high. The next phase will depend on whether price can establish a tighter, more stable structure or whether the broad range continues to dominate short term trading.
MEGA is trading near $0.04981, up +0.59% from its 24 hour open of $0.04952. It traded between $0.04845 and $0.05101, resulting in a 5.28% range. MEGA is currently 2.35% below the session high, which places it near the upper portion of its daily structure.
This is a comparatively controlled setup. MEGA has moved above the opening price, retained that gain, and stayed closer to the daily high than the low. Its quoted 24 hour volume is around $2.64M, confirming ongoing market participation. While the percentage move is modest, the quality of the structure is more important than the headline number. A measured rise with contained volatility can show a steadier balance of demand than a sharp spike that quickly fades.
MEGA’s market position is connected to blockchain infrastructure and Layer 1 themes, areas that can receive increased attention when traders begin focusing on network scalability and ecosystem growth. For now, the asset is showing a cautious positive tone. The key question is whether buyers can maintain the current range position if the broader crypto market becomes more volatile.
Across the three assets, the live structure is clear. MARSCOIN is displaying the strongest short term price retention. ONE is showing the highest intraday volatility but lacks a clear net directional move. MEGA is presenting the most orderly positive structure, with price holding above its opening level and close to the daily high.
The market is rewarding selectivity. Momentum may bring attention, but sustainable moves depend on liquidity, volume consistency, and the ability to retain gains after volatility increases. These current readings are a snapshot of active market conditions, not a guarantee of what comes next. Responsible traders will continue watching volume, range behavior, and broader market sentiment before reacting to short term price movement.
#MarsCoin #HarmonyONE #MEGA #CryptoMarket #Altcoins
$MARSCOIN
{spot}(MARSCOINUSDT)
$ONE
{spot}(ONEUSDT)
$MEGA
{spot}(MEGAUSDT)
MARSCOIN, ONE and MEGA: Three Different Market Signals in a Selective Crypto Environment
The latest spot market activity across MARSCOIN, ONE, and MEGA shows a market where attention is moving selectively rather than broadly. All three assets are active, but their price structures tell very different stories. MARSCOIN is showing modest upward momentum with solid price retention near the daily high. ONE has experienced the widest relative volatility but is currently back at its opening level. MEGA is trading with a measured positive bias and a comparatively controlled intraday range.
This distinction matters because the headline percentage move is only one part of the story. Traders are also watching how each asset behaves after testing highs and lows, whether volume supports the move, and whether buyers can retain control when short term profit taking appears. In a fast moving market, price retention and liquidity often reveal more than a single green candle.
MARSCOIN is trading around $0.0337, up +0.60% from its 24 hour open of $0.0335. The asset reached a high of $0.0343 and a low of $0.0313, creating a 9.58% trading range. MARSCOIN is currently only 1.75% below its session high, which suggests that buyers have retained most of the recovery after price explored lower levels earlier in the session.
The market has generated approximately $2.81M in quoted 24 hour volume, showing that current price action is supported by active participation. MARSCOIN’s ability to remain above the daily open and close to the session high is the strongest short term feature of its structure. It does not guarantee continuation, but it indicates that the upside move has not been immediately rejected.
At the same time, the nearly 10% daily range confirms that the market remains volatile. This is a setting where sudden expansions can attract momentum traders, but it can also produce rapid reversals if liquidity slows. The most relevant observation is whether MARSCOIN can keep holding above its opening price while volume remains consistent. Stable consolidation near the upper range would show a more orderly market than a sharp move followed by immediate selling pressure.
Harmony, trading under the ticker ONE, is currently priced around $0.001307, unchanged from its 24 hour open of $0.001307. ONE reached a high of $0.001438 and a low of $0.001274, producing the widest relative range among the three assets at 12.87%. Although the price is flat over the session, the path has been far from quiet.
ONE is currently 9.11% below its daily high, showing that sellers became active after the earlier upside test. The market traded through a meaningful intraday range and then returned to the opening level, which reflects a balance between buyers and sellers rather than a decisive directional trend. With roughly $2.70M in quoted 24 hour volume, the price movement is occurring within an active market.
ONE remains tied to the broader Layer 1 narrative, where investor attention often depends on ecosystem development, network usage, and wider appetite for higher beta assets. The current price behavior highlights caution. Buyers have shown interest near the session low, but they have not yet been able to maintain control near the high. The next phase will depend on whether price can establish a tighter, more stable structure or whether the broad range continues to dominate short term trading.
MEGA is trading near $0.04981, up +0.59% from its 24 hour open of $0.04952. It traded between $0.04845 and $0.05101, resulting in a 5.28% range. MEGA is currently 2.35% below the session high, which places it near the upper portion of its daily structure.
This is a comparatively controlled setup. MEGA has moved above the opening price, retained that gain, and stayed closer to the daily high than the low. Its quoted 24 hour volume is around $2.64M, confirming ongoing market participation. While the percentage move is modest, the quality of the structure is more important than the headline number. A measured rise with contained volatility can show a steadier balance of demand than a sharp spike that quickly fades.
MEGA’s market position is connected to blockchain infrastructure and Layer 1 themes, areas that can receive increased attention when traders begin focusing on network scalability and ecosystem growth. For now, the asset is showing a cautious positive tone. The key question is whether buyers can maintain the current range position if the broader crypto market becomes more volatile.
Across the three assets, the live structure is clear. MARSCOIN is displaying the strongest short term price retention. ONE is showing the highest intraday volatility but lacks a clear net directional move. MEGA is presenting the most orderly positive structure, with price holding above its opening level and close to the daily high.
The market is rewarding selectivity. Momentum may bring attention, but sustainable moves depend on liquidity, volume consistency, and the ability to retain gains after volatility increases. These current readings are a snapshot of active market conditions, not a guarantee of what comes next. Responsible traders will continue watching volume, range behavior, and broader market sentiment before reacting to short term price movement.
#MarsCoin #HarmonyONE #MEGA #CryptoMarket #Altcoins
$MARSCOIN
$ONE
$MEGA
This distinction matters because the headline percentage move is only one part of the story. Traders are also watching how each asset behaves after testing highs and lows, whether volume supports the move, and whether buyers can retain control when short term profit taking appears. In a fast moving market, price retention and liquidity often reveal more than a single green candle.
MARSCOIN is trading around $0.0337, up +0.60% from its 24 hour open of $0.0335. The asset reached a high of $0.0343 and a low of $0.0313, creating a 9.58% trading range. MARSCOIN is currently only 1.75% below its session high, which suggests that buyers have retained most of the recovery after price explored lower levels earlier in the session.
The market has generated approximately $2.81M in quoted 24 hour volume, showing that current price action is supported by active participation. MARSCOIN’s ability to remain above the daily open and close to the session high is the strongest short term feature of its structure. It does not guarantee continuation, but it indicates that the upside move has not been immediately rejected.
At the same time, the nearly 10% daily range confirms that the market remains volatile. This is a setting where sudden expansions can attract momentum traders, but it can also produce rapid reversals if liquidity slows. The most relevant observation is whether MARSCOIN can keep holding above its opening price while volume remains consistent. Stable consolidation near the upper range would show a more orderly market than a sharp move followed by immediate selling pressure.
Harmony, trading under the ticker ONE, is currently priced around $0.001307, unchanged from its 24 hour open of $0.001307. ONE reached a high of $0.001438 and a low of $0.001274, producing the widest relative range among the three assets at 12.87%. Although the price is flat over the session, the path has been far from quiet.
ONE is currently 9.11% below its daily high, showing that sellers became active after the earlier upside test. The market traded through a meaningful intraday range and then returned to the opening level, which reflects a balance between buyers and sellers rather than a decisive directional trend. With roughly $2.70M in quoted 24 hour volume, the price movement is occurring within an active market.
ONE remains tied to the broader Layer 1 narrative, where investor attention often depends on ecosystem development, network usage, and wider appetite for higher beta assets. The current price behavior highlights caution. Buyers have shown interest near the session low, but they have not yet been able to maintain control near the high. The next phase will depend on whether price can establish a tighter, more stable structure or whether the broad range continues to dominate short term trading.
MEGA is trading near $0.04981, up +0.59% from its 24 hour open of $0.04952. It traded between $0.04845 and $0.05101, resulting in a 5.28% range. MEGA is currently 2.35% below the session high, which places it near the upper portion of its daily structure.
This is a comparatively controlled setup. MEGA has moved above the opening price, retained that gain, and stayed closer to the daily high than the low. Its quoted 24 hour volume is around $2.64M, confirming ongoing market participation. While the percentage move is modest, the quality of the structure is more important than the headline number. A measured rise with contained volatility can show a steadier balance of demand than a sharp spike that quickly fades.
MEGA’s market position is connected to blockchain infrastructure and Layer 1 themes, areas that can receive increased attention when traders begin focusing on network scalability and ecosystem growth. For now, the asset is showing a cautious positive tone. The key question is whether buyers can maintain the current range position if the broader crypto market becomes more volatile.
Across the three assets, the live structure is clear. MARSCOIN is displaying the strongest short term price retention. ONE is showing the highest intraday volatility but lacks a clear net directional move. MEGA is presenting the most orderly positive structure, with price holding above its opening level and close to the daily high.
The market is rewarding selectivity. Momentum may bring attention, but sustainable moves depend on liquidity, volume consistency, and the ability to retain gains after volatility increases. These current readings are a snapshot of active market conditions, not a guarantee of what comes next. Responsible traders will continue watching volume, range behavior, and broader market sentiment before reacting to short term price movement.
#MarsCoin #HarmonyONE #MEGA #CryptoMarket #Altcoins
$MARSCOIN
$ONE
$MEGA
23
FIL, NOM and REQ: Stability, Momentum and Volatility Define the Current MarketThe latest market activity across Filecoin, Nomina, and Request Network presents three very different trading structures. FIL is showing controlled strength near the top of its daily range, NOM is gaining momentum with elevated volatility, and REQ is attracting attention through a strong percentage move but also carrying the highest short term risk profile. For traders watching real time market conditions, this is a clear example of why percentage gains alone never tell the full story.
The most important factors are price retention, intraday range, liquidity, and whether buyers can maintain control after an initial move. A token that rises sharply but loses a large part of its gains may be experiencing short term speculation. A token that moves more slowly but stays near its session high can reveal steadier demand. In the current session, FIL, NOM, and REQ each represent a different version of this market behavior.
Filecoin is trading around $0.6126, up +0.29% from its 24 hour open of $0.6108. FIL reached a high of $0.6154 and a low of $0.5886, producing a 4.55% daily range. The key detail is that FIL is only 0.45% below its session high, which shows that buyers have retained most of the day’s recovery.
This is a relatively controlled price structure. FIL tested lower levels, found demand, and moved back toward the upper end of its daily range without excessive volatility. The quoted 24 hour trading volume is above $5.01M, indicating active market participation rather than a low liquidity drift.
Filecoin remains relevant because it is closely tied to the decentralized storage narrative. As blockchain infrastructure evolves, storage, data availability, and decentralized computing remain important themes for the sector. However, a strong narrative does not automatically produce a sustained trend. What the current price action shows is that FIL has maintained a narrow positive bias, but it still needs ongoing participation to convert that stability into stronger momentum.
The constructive observation is that FIL is holding close to its session high. The risk is that the overall gain remains modest, which means buyers have not yet created a major expansion. For market participants, the key signal is whether price can continue to absorb supply near the current high while volume remains consistent.
Nomina is trading near $0.001264, up +1.85% from its 24 hour open of $0.001241. NOM recorded a high of $0.001357 and a low of $0.001220, resulting in an 11.23% daily range. The token is currently 6.85% below its session high, which suggests buyers have made progress but sellers are still actively taking part after the early upside move.
NOM’s structure is more volatile than FIL’s. Its session range is more than twice as wide, showing that the market is reacting with greater sensitivity to changing liquidity. With over $2.77M in quoted 24 hour trading activity, NOM is seeing meaningful participation, but the volatility makes price retention especially important.
The current move above the daily open shows that buyers have a short term advantage. Still, the gap from the session high indicates that the market has not fully maintained its initial momentum. This is the kind of setup where traders often watch whether consolidation becomes orderly or whether price continues to swing sharply as short term participants react to every move.
NOM’s market behavior can attract attention because low priced assets often create visible percentage changes quickly. However, the focus should remain on the quality of the move. Sustained demand, improving liquidity, and the ability to hold above the opening level matter more than a brief spike. Higher volatility can create opportunity, but it also increases the chance of sudden reversals.
Request Network is trading around $0.0443, up +4.48% from its 24 hour open of $0.0424. REQ reached a high of $0.0647 and a low of $0.0412, producing a 57.04% daily range. This is the largest range among the three assets by a significant margin. While REQ remains above its opening level, it is currently 31.53% below the session high, which reveals substantial selling pressure after the earlier surge.
REQ’s current structure is the most attention grabbing but also the most complex. The quoted 24 hour trading volume exceeds $2.78M, confirming that the move has attracted real activity. However, the large distance from the session high shows that the market has already experienced aggressive profit taking or supply pressure.
This does not mean the move has failed. REQ remains positive on the day, and buyers are still holding the price above the open. But the wide range shows that sentiment is highly active and potentially unstable. In situations like this, the market usually needs time to establish whether the move can develop into a stable consolidation or whether volatility remains dominant.
The broader picture is straightforward. FIL is showing the most stable structure and strongest price retention. NOM is delivering positive momentum with higher volatility. REQ is producing the largest percentage gain, but its wide range and pullback from the high make it the most volatile and speculative structure in the group.
The current data shows a market that is rewarding selectivity. Strong moves can generate attention, but durable momentum depends on liquidity, volume consistency, and buyer conviction after the first wave of excitement. Watching how these assets behave near their daily highs and how they respond to profit taking may provide more useful context than reacting to isolated green candles.
#Filecoin #Nomina #RequestNetwork #CryptoMarket #Altcoins
$FIL
{spot}(FILUSDT)
$NOM
{spot}(NOMUSDT)
$REQ
{spot}(REQUSDT)
FIL, NOM and REQ: Stability, Momentum and Volatility Define the Current Market
The latest market activity across Filecoin, Nomina, and Request Network presents three very different trading structures. FIL is showing controlled strength near the top of its daily range, NOM is gaining momentum with elevated volatility, and REQ is attracting attention through a strong percentage move but also carrying the highest short term risk profile. For traders watching real time market conditions, this is a clear example of why percentage gains alone never tell the full story.
The most important factors are price retention, intraday range, liquidity, and whether buyers can maintain control after an initial move. A token that rises sharply but loses a large part of its gains may be experiencing short term speculation. A token that moves more slowly but stays near its session high can reveal steadier demand. In the current session, FIL, NOM, and REQ each represent a different version of this market behavior.
Filecoin is trading around $0.6126, up +0.29% from its 24 hour open of $0.6108. FIL reached a high of $0.6154 and a low of $0.5886, producing a 4.55% daily range. The key detail is that FIL is only 0.45% below its session high, which shows that buyers have retained most of the day’s recovery.
This is a relatively controlled price structure. FIL tested lower levels, found demand, and moved back toward the upper end of its daily range without excessive volatility. The quoted 24 hour trading volume is above $5.01M, indicating active market participation rather than a low liquidity drift.
Filecoin remains relevant because it is closely tied to the decentralized storage narrative. As blockchain infrastructure evolves, storage, data availability, and decentralized computing remain important themes for the sector. However, a strong narrative does not automatically produce a sustained trend. What the current price action shows is that FIL has maintained a narrow positive bias, but it still needs ongoing participation to convert that stability into stronger momentum.
The constructive observation is that FIL is holding close to its session high. The risk is that the overall gain remains modest, which means buyers have not yet created a major expansion. For market participants, the key signal is whether price can continue to absorb supply near the current high while volume remains consistent.
Nomina is trading near $0.001264, up +1.85% from its 24 hour open of $0.001241. NOM recorded a high of $0.001357 and a low of $0.001220, resulting in an 11.23% daily range. The token is currently 6.85% below its session high, which suggests buyers have made progress but sellers are still actively taking part after the early upside move.
NOM’s structure is more volatile than FIL’s. Its session range is more than twice as wide, showing that the market is reacting with greater sensitivity to changing liquidity. With over $2.77M in quoted 24 hour trading activity, NOM is seeing meaningful participation, but the volatility makes price retention especially important.
The current move above the daily open shows that buyers have a short term advantage. Still, the gap from the session high indicates that the market has not fully maintained its initial momentum. This is the kind of setup where traders often watch whether consolidation becomes orderly or whether price continues to swing sharply as short term participants react to every move.
NOM’s market behavior can attract attention because low priced assets often create visible percentage changes quickly. However, the focus should remain on the quality of the move. Sustained demand, improving liquidity, and the ability to hold above the opening level matter more than a brief spike. Higher volatility can create opportunity, but it also increases the chance of sudden reversals.
Request Network is trading around $0.0443, up +4.48% from its 24 hour open of $0.0424. REQ reached a high of $0.0647 and a low of $0.0412, producing a 57.04% daily range. This is the largest range among the three assets by a significant margin. While REQ remains above its opening level, it is currently 31.53% below the session high, which reveals substantial selling pressure after the earlier surge.
REQ’s current structure is the most attention grabbing but also the most complex. The quoted 24 hour trading volume exceeds $2.78M, confirming that the move has attracted real activity. However, the large distance from the session high shows that the market has already experienced aggressive profit taking or supply pressure.
This does not mean the move has failed. REQ remains positive on the day, and buyers are still holding the price above the open. But the wide range shows that sentiment is highly active and potentially unstable. In situations like this, the market usually needs time to establish whether the move can develop into a stable consolidation or whether volatility remains dominant.
The broader picture is straightforward. FIL is showing the most stable structure and strongest price retention. NOM is delivering positive momentum with higher volatility. REQ is producing the largest percentage gain, but its wide range and pullback from the high make it the most volatile and speculative structure in the group.
The current data shows a market that is rewarding selectivity. Strong moves can generate attention, but durable momentum depends on liquidity, volume consistency, and buyer conviction after the first wave of excitement. Watching how these assets behave near their daily highs and how they respond to profit taking may provide more useful context than reacting to isolated green candles.
#Filecoin #Nomina #RequestNetwork #CryptoMarket #Altcoins
$FIL
$NOM
$REQ
The most important factors are price retention, intraday range, liquidity, and whether buyers can maintain control after an initial move. A token that rises sharply but loses a large part of its gains may be experiencing short term speculation. A token that moves more slowly but stays near its session high can reveal steadier demand. In the current session, FIL, NOM, and REQ each represent a different version of this market behavior.
Filecoin is trading around $0.6126, up +0.29% from its 24 hour open of $0.6108. FIL reached a high of $0.6154 and a low of $0.5886, producing a 4.55% daily range. The key detail is that FIL is only 0.45% below its session high, which shows that buyers have retained most of the day’s recovery.
This is a relatively controlled price structure. FIL tested lower levels, found demand, and moved back toward the upper end of its daily range without excessive volatility. The quoted 24 hour trading volume is above $5.01M, indicating active market participation rather than a low liquidity drift.
Filecoin remains relevant because it is closely tied to the decentralized storage narrative. As blockchain infrastructure evolves, storage, data availability, and decentralized computing remain important themes for the sector. However, a strong narrative does not automatically produce a sustained trend. What the current price action shows is that FIL has maintained a narrow positive bias, but it still needs ongoing participation to convert that stability into stronger momentum.
The constructive observation is that FIL is holding close to its session high. The risk is that the overall gain remains modest, which means buyers have not yet created a major expansion. For market participants, the key signal is whether price can continue to absorb supply near the current high while volume remains consistent.
Nomina is trading near $0.001264, up +1.85% from its 24 hour open of $0.001241. NOM recorded a high of $0.001357 and a low of $0.001220, resulting in an 11.23% daily range. The token is currently 6.85% below its session high, which suggests buyers have made progress but sellers are still actively taking part after the early upside move.
NOM’s structure is more volatile than FIL’s. Its session range is more than twice as wide, showing that the market is reacting with greater sensitivity to changing liquidity. With over $2.77M in quoted 24 hour trading activity, NOM is seeing meaningful participation, but the volatility makes price retention especially important.
The current move above the daily open shows that buyers have a short term advantage. Still, the gap from the session high indicates that the market has not fully maintained its initial momentum. This is the kind of setup where traders often watch whether consolidation becomes orderly or whether price continues to swing sharply as short term participants react to every move.
NOM’s market behavior can attract attention because low priced assets often create visible percentage changes quickly. However, the focus should remain on the quality of the move. Sustained demand, improving liquidity, and the ability to hold above the opening level matter more than a brief spike. Higher volatility can create opportunity, but it also increases the chance of sudden reversals.
Request Network is trading around $0.0443, up +4.48% from its 24 hour open of $0.0424. REQ reached a high of $0.0647 and a low of $0.0412, producing a 57.04% daily range. This is the largest range among the three assets by a significant margin. While REQ remains above its opening level, it is currently 31.53% below the session high, which reveals substantial selling pressure after the earlier surge.
REQ’s current structure is the most attention grabbing but also the most complex. The quoted 24 hour trading volume exceeds $2.78M, confirming that the move has attracted real activity. However, the large distance from the session high shows that the market has already experienced aggressive profit taking or supply pressure.
This does not mean the move has failed. REQ remains positive on the day, and buyers are still holding the price above the open. But the wide range shows that sentiment is highly active and potentially unstable. In situations like this, the market usually needs time to establish whether the move can develop into a stable consolidation or whether volatility remains dominant.
The broader picture is straightforward. FIL is showing the most stable structure and strongest price retention. NOM is delivering positive momentum with higher volatility. REQ is producing the largest percentage gain, but its wide range and pullback from the high make it the most volatile and speculative structure in the group.
The current data shows a market that is rewarding selectivity. Strong moves can generate attention, but durable momentum depends on liquidity, volume consistency, and buyer conviction after the first wave of excitement. Watching how these assets behave near their daily highs and how they respond to profit taking may provide more useful context than reacting to isolated green candles.
#Filecoin #Nomina #RequestNetwork #CryptoMarket #Altcoins
$FIL
$NOM
$REQ
13
ERA, APT and TRUMP: Three Different Market Stories, One Important Test for LiquidityThe latest spot market activity across ERA, APT, and TRUMP shows that crypto liquidity is moving selectively rather than uniformly. All three assets are trading above their 24 hour opening levels, but the quality of their moves is very different. ERA is delivering the strongest momentum with elevated volatility, APT is showing a more controlled recovery near its session high, and TRUMP is holding a stable short term structure while remaining highly sensitive to narrative driven attention.
For traders watching the market, this is not simply a story of green candles. The more meaningful question is whether buyers can retain control after the initial move, whether volume remains consistent, and whether price action continues to hold firm as the market tests the upper end of each range. Momentum can attract attention quickly, but price retention is what reveals whether that attention has depth.
Caldera, trading under the ticker ERA, is currently priced around $0.0741, up +6.31% from its 24 hour open of $0.0697. The asset reached a high of $0.0783 and a low of $0.0665, creating a 17.74% trading range. ERA is currently 5.36% below its session high, meaning buyers have retained a meaningful part of the advance despite the sharp intraday swings.
ERA is the strongest performer of this group in percentage terms, and its price action reflects increased market participation. With roughly $3.89M in quoted 24 hour volume, the move is supported by active trading rather than a thin isolated spike. However, the wide range also highlights the risk side of the structure. A 17.74% session range confirms that both buyers and sellers have been highly active, and conditions can change quickly if volume fades.
The constructive signal is that ERA remains well above its opening price after testing the lower end of the range. This suggests buyers have been willing to absorb supply on pullbacks. The more cautious signal is that the asset has not yet reclaimed the session high. For momentum to remain healthy, the market would need to show orderly consolidation and sustained participation rather than sudden bursts followed by aggressive profit taking.
Aptos is trading around $0.4590, up +0.75% from its 24 hour open of $0.4556. APT traded between $0.4471 and $0.4708, producing a 5.30% range. It is currently only 2.51% below the session high, showing a more stable and controlled structure than ERA.
APT’s latest price action is notable because it has retained its gains while avoiding the extreme volatility seen in higher beta assets. Its quoted 24 hour volume stands near $3.88M, which confirms continued participation around the current price. The market tested lower levels during the session, recovered, and is now trading closer to the upper end of its range.
Aptos remains an important Layer 1 asset to monitor because broader sentiment around scalable networks, ecosystem growth, decentralized finance, and onchain applications can influence its liquidity. The current setup shows modest bullish momentum, but it is still a measured move rather than a major breakout. That makes confirmation especially important. If buyers continue to defend the current structure and volume remains steady, market confidence may strengthen. If price loses the daily open, it would show that sellers are still capable of limiting upside progress.
OFFICIAL TRUMP is trading near $0.950, up +0.21% from its 24 hour open of $0.948. The token reached a high of $0.959 and a low of $0.917, creating a 4.58% range. TRUMP is trading only 0.94% below its session high, which indicates that buyers have maintained a narrow advantage during the latest session.
The current TRUMP structure is more stable than its meme token classification might suggest, but traders should remain aware that this type of asset can react strongly to public attention, social momentum, headlines, and broader risk appetite. Its approximately $5.79M in quoted 24 hour volume confirms ongoing liquidity, yet the token’s behavior can still shift quickly when sentiment changes.
The positive element is that TRUMP is holding near the top of its daily range and remains above the opening level. The risk is that meme focused assets can experience sudden changes in demand that are not always visible through technical structure alone. For that reason, a stable price near the session high should be viewed as a current observation, not a guarantee of continued upside.
The broader market message is clear. ERA is the momentum leader, but it also carries the highest volatility. APT is displaying a steadier recovery profile, with buyers holding price close to the session high. TRUMP is showing controlled short term strength, though its narrative sensitivity makes risk management particularly important.
This is the kind of market where patience matters. Watching price retention, liquidity, and broader crypto sentiment can provide more useful context than reacting to a single percentage move. Strong moves can continue, consolidate, or reverse, and the market will ultimately decide based on participation and demand.
#Caldera #Aptos #OfficialTrump #CryptoMarket #Altcoins
$ERA
{spot}(ERAUSDT)
$APT
{spot}(APTUSDT)
$TRUMP
{spot}(TRUMPUSDT)
ERA, APT and TRUMP: Three Different Market Stories, One Important Test for Liquidity
The latest spot market activity across ERA, APT, and TRUMP shows that crypto liquidity is moving selectively rather than uniformly. All three assets are trading above their 24 hour opening levels, but the quality of their moves is very different. ERA is delivering the strongest momentum with elevated volatility, APT is showing a more controlled recovery near its session high, and TRUMP is holding a stable short term structure while remaining highly sensitive to narrative driven attention.
For traders watching the market, this is not simply a story of green candles. The more meaningful question is whether buyers can retain control after the initial move, whether volume remains consistent, and whether price action continues to hold firm as the market tests the upper end of each range. Momentum can attract attention quickly, but price retention is what reveals whether that attention has depth.
Caldera, trading under the ticker ERA, is currently priced around $0.0741, up +6.31% from its 24 hour open of $0.0697. The asset reached a high of $0.0783 and a low of $0.0665, creating a 17.74% trading range. ERA is currently 5.36% below its session high, meaning buyers have retained a meaningful part of the advance despite the sharp intraday swings.
ERA is the strongest performer of this group in percentage terms, and its price action reflects increased market participation. With roughly $3.89M in quoted 24 hour volume, the move is supported by active trading rather than a thin isolated spike. However, the wide range also highlights the risk side of the structure. A 17.74% session range confirms that both buyers and sellers have been highly active, and conditions can change quickly if volume fades.
The constructive signal is that ERA remains well above its opening price after testing the lower end of the range. This suggests buyers have been willing to absorb supply on pullbacks. The more cautious signal is that the asset has not yet reclaimed the session high. For momentum to remain healthy, the market would need to show orderly consolidation and sustained participation rather than sudden bursts followed by aggressive profit taking.
Aptos is trading around $0.4590, up +0.75% from its 24 hour open of $0.4556. APT traded between $0.4471 and $0.4708, producing a 5.30% range. It is currently only 2.51% below the session high, showing a more stable and controlled structure than ERA.
APT’s latest price action is notable because it has retained its gains while avoiding the extreme volatility seen in higher beta assets. Its quoted 24 hour volume stands near $3.88M, which confirms continued participation around the current price. The market tested lower levels during the session, recovered, and is now trading closer to the upper end of its range.
Aptos remains an important Layer 1 asset to monitor because broader sentiment around scalable networks, ecosystem growth, decentralized finance, and onchain applications can influence its liquidity. The current setup shows modest bullish momentum, but it is still a measured move rather than a major breakout. That makes confirmation especially important. If buyers continue to defend the current structure and volume remains steady, market confidence may strengthen. If price loses the daily open, it would show that sellers are still capable of limiting upside progress.
OFFICIAL TRUMP is trading near $0.950, up +0.21% from its 24 hour open of $0.948. The token reached a high of $0.959 and a low of $0.917, creating a 4.58% range. TRUMP is trading only 0.94% below its session high, which indicates that buyers have maintained a narrow advantage during the latest session.
The current TRUMP structure is more stable than its meme token classification might suggest, but traders should remain aware that this type of asset can react strongly to public attention, social momentum, headlines, and broader risk appetite. Its approximately $5.79M in quoted 24 hour volume confirms ongoing liquidity, yet the token’s behavior can still shift quickly when sentiment changes.
The positive element is that TRUMP is holding near the top of its daily range and remains above the opening level. The risk is that meme focused assets can experience sudden changes in demand that are not always visible through technical structure alone. For that reason, a stable price near the session high should be viewed as a current observation, not a guarantee of continued upside.
The broader market message is clear. ERA is the momentum leader, but it also carries the highest volatility. APT is displaying a steadier recovery profile, with buyers holding price close to the session high. TRUMP is showing controlled short term strength, though its narrative sensitivity makes risk management particularly important.
This is the kind of market where patience matters. Watching price retention, liquidity, and broader crypto sentiment can provide more useful context than reacting to a single percentage move. Strong moves can continue, consolidate, or reverse, and the market will ultimately decide based on participation and demand.
#Caldera #Aptos #OfficialTrump #CryptoMarket #Altcoins
$ERA
$APT
$TRUMP
For traders watching the market, this is not simply a story of green candles. The more meaningful question is whether buyers can retain control after the initial move, whether volume remains consistent, and whether price action continues to hold firm as the market tests the upper end of each range. Momentum can attract attention quickly, but price retention is what reveals whether that attention has depth.
Caldera, trading under the ticker ERA, is currently priced around $0.0741, up +6.31% from its 24 hour open of $0.0697. The asset reached a high of $0.0783 and a low of $0.0665, creating a 17.74% trading range. ERA is currently 5.36% below its session high, meaning buyers have retained a meaningful part of the advance despite the sharp intraday swings.
ERA is the strongest performer of this group in percentage terms, and its price action reflects increased market participation. With roughly $3.89M in quoted 24 hour volume, the move is supported by active trading rather than a thin isolated spike. However, the wide range also highlights the risk side of the structure. A 17.74% session range confirms that both buyers and sellers have been highly active, and conditions can change quickly if volume fades.
The constructive signal is that ERA remains well above its opening price after testing the lower end of the range. This suggests buyers have been willing to absorb supply on pullbacks. The more cautious signal is that the asset has not yet reclaimed the session high. For momentum to remain healthy, the market would need to show orderly consolidation and sustained participation rather than sudden bursts followed by aggressive profit taking.
Aptos is trading around $0.4590, up +0.75% from its 24 hour open of $0.4556. APT traded between $0.4471 and $0.4708, producing a 5.30% range. It is currently only 2.51% below the session high, showing a more stable and controlled structure than ERA.
APT’s latest price action is notable because it has retained its gains while avoiding the extreme volatility seen in higher beta assets. Its quoted 24 hour volume stands near $3.88M, which confirms continued participation around the current price. The market tested lower levels during the session, recovered, and is now trading closer to the upper end of its range.
Aptos remains an important Layer 1 asset to monitor because broader sentiment around scalable networks, ecosystem growth, decentralized finance, and onchain applications can influence its liquidity. The current setup shows modest bullish momentum, but it is still a measured move rather than a major breakout. That makes confirmation especially important. If buyers continue to defend the current structure and volume remains steady, market confidence may strengthen. If price loses the daily open, it would show that sellers are still capable of limiting upside progress.
OFFICIAL TRUMP is trading near $0.950, up +0.21% from its 24 hour open of $0.948. The token reached a high of $0.959 and a low of $0.917, creating a 4.58% range. TRUMP is trading only 0.94% below its session high, which indicates that buyers have maintained a narrow advantage during the latest session.
The current TRUMP structure is more stable than its meme token classification might suggest, but traders should remain aware that this type of asset can react strongly to public attention, social momentum, headlines, and broader risk appetite. Its approximately $5.79M in quoted 24 hour volume confirms ongoing liquidity, yet the token’s behavior can still shift quickly when sentiment changes.
The positive element is that TRUMP is holding near the top of its daily range and remains above the opening level. The risk is that meme focused assets can experience sudden changes in demand that are not always visible through technical structure alone. For that reason, a stable price near the session high should be viewed as a current observation, not a guarantee of continued upside.
The broader market message is clear. ERA is the momentum leader, but it also carries the highest volatility. APT is displaying a steadier recovery profile, with buyers holding price close to the session high. TRUMP is showing controlled short term strength, though its narrative sensitivity makes risk management particularly important.
This is the kind of market where patience matters. Watching price retention, liquidity, and broader crypto sentiment can provide more useful context than reacting to a single percentage move. Strong moves can continue, consolidate, or reverse, and the market will ultimately decide based on participation and demand.
#Caldera #Aptos #OfficialTrump #CryptoMarket #Altcoins
$ERA
$APT
$TRUMP
17
INIT, ZRO and QNT: Infrastructure Tokens Show Three Different Market SignalsThe latest spot market activity across INIT, ZRO, and QNT presents a useful picture of how selective capital is behaving in the infrastructure segment. Each asset has a distinct narrative, but the more immediate story is visible in the price structure. INIT is experiencing pressure after a volatile session, ZRO is showing the strongest momentum and price retention, while QNT is holding a more neutral and orderly structure.
This matters because markets rarely move with equal conviction across every project. Even within the infrastructure category, liquidity, narrative attention, trader positioning, and the ability to retain gains can create very different outcomes. Looking only at whether an asset is green or red can miss the more important signal: how price behaves within its full trading range.
Initia is trading at $0.10278, down -2.74% from its 24 hour open of $0.10568. The asset reached a high of $0.11313 and a low of $0.10046, creating a 12.61% session range. INIT is currently trading 9.15% below its daily high, which shows that sellers have been active after the market tested higher levels.
The positive aspect is that INIT remains above its session low, suggesting that buyers have appeared after the decline. However, the price is still below the opening level, so the market has not yet demonstrated a sustained recovery. Its more than $5.92M in 24 hour quoted volume confirms that this is an actively traded move rather than a low liquidity fluctuation.
INIT sits within the broader Layer 1 and Layer 2 infrastructure conversation, an area that can attract sharp interest when market participants are looking for scalability and ecosystem growth narratives. Yet the current technical picture calls for discipline. A 12.61% daily range signals that volatility is high, and sharp range conditions can produce quick reversals in either direction. The key market observation is whether buyers can stabilize the price after the pullback and regain consistent participation, rather than relying on a short lived bounce.
LayerZero is trading at $1.458, up +5.12% from its 24 hour open of $1.387. ZRO reached a high of $1.484 and a low of $1.359, resulting in a 9.20% daily range. The asset is trading just 1.75% below its session high, making it the strongest price retention story in this group.
This structure stands out. ZRO has not only moved higher from its opening level, it has also held most of that advance near the top of its intraday range. That suggests buyers have been able to absorb selling pressure after the initial upward move. The market has recorded more than $6.54M in 24 hour quoted volume, showing that the session has meaningful participation behind it.
LayerZero remains closely associated with cross chain communication and interoperability infrastructure. That role can become more visible when the market focuses on applications and networks that need to move assets and information across multiple blockchain ecosystems. In the current session, the key signal is not a future forecast. It is that ZRO is displaying relative strength compared with INIT and QNT. Sustained volume and orderly consolidation would be more meaningful than a sudden spike, while failure to retain the current gains would show that the rally remains vulnerable to profit taking.
Quant is trading at $154.70, up +0.25% from its 24 hour open of $154.32. QNT reached a high of $162.00 and a low of $152.08, producing a 6.52% daily range. The asset is currently 4.51% below its session high and remains above its daily open, indicating a balanced market where buyers have maintained a narrow advantage.
QNT’s price structure is less dramatic than INIT or ZRO, but that can be valuable context. It has remained comparatively controlled after testing both the upper and lower boundaries of the session. With more than $7.29M in 24 hour quoted volume, the market is active and liquid enough for price discovery to remain meaningful.
Quant is typically associated with interoperability and enterprise oriented blockchain infrastructure. Its current market behavior suggests that neither buyers nor sellers have established a decisive control of the session. The modest gain shows resilience, while the gap from the session high indicates that the market is still meeting supply on upward attempts. This type of structure often places attention on whether volume increases and whether the asset can retain stability as the wider crypto market changes.
The broader market message is clear. INIT is navigating a volatile pullback and needs stronger price retention. ZRO is leading on momentum, with buyers holding the asset close to its session high. QNT is moving with a steadier profile, remaining marginally positive while trading inside a defined range.
For market participants, the most valuable focus is confirmation. INIT needs to demonstrate whether demand can absorb the current selling pressure. ZRO needs to show whether its gains can remain supported after a strong move. QNT needs to establish whether its controlled range develops into stronger participation or continued consolidation.
Crypto markets can react rapidly to shifts in liquidity and sentiment. The current data provides a live snapshot, not a certainty about what comes next. Observing volume, range behavior, and price retention remains more useful than reacting emotionally to isolated percentage moves.
#Initia #LayerZero #Quant #CryptoMarket #Blockchain
$INIT
{spot}(INITUSDT)
$ZRO
{spot}(ZROUSDT)
$QNT
{spot}(QNTUSDT)
INIT, ZRO and QNT: Infrastructure Tokens Show Three Different Market Signals
The latest spot market activity across INIT, ZRO, and QNT presents a useful picture of how selective capital is behaving in the infrastructure segment. Each asset has a distinct narrative, but the more immediate story is visible in the price structure. INIT is experiencing pressure after a volatile session, ZRO is showing the strongest momentum and price retention, while QNT is holding a more neutral and orderly structure.
This matters because markets rarely move with equal conviction across every project. Even within the infrastructure category, liquidity, narrative attention, trader positioning, and the ability to retain gains can create very different outcomes. Looking only at whether an asset is green or red can miss the more important signal: how price behaves within its full trading range.
Initia is trading at $0.10278, down -2.74% from its 24 hour open of $0.10568. The asset reached a high of $0.11313 and a low of $0.10046, creating a 12.61% session range. INIT is currently trading 9.15% below its daily high, which shows that sellers have been active after the market tested higher levels.
The positive aspect is that INIT remains above its session low, suggesting that buyers have appeared after the decline. However, the price is still below the opening level, so the market has not yet demonstrated a sustained recovery. Its more than $5.92M in 24 hour quoted volume confirms that this is an actively traded move rather than a low liquidity fluctuation.
INIT sits within the broader Layer 1 and Layer 2 infrastructure conversation, an area that can attract sharp interest when market participants are looking for scalability and ecosystem growth narratives. Yet the current technical picture calls for discipline. A 12.61% daily range signals that volatility is high, and sharp range conditions can produce quick reversals in either direction. The key market observation is whether buyers can stabilize the price after the pullback and regain consistent participation, rather than relying on a short lived bounce.
LayerZero is trading at $1.458, up +5.12% from its 24 hour open of $1.387. ZRO reached a high of $1.484 and a low of $1.359, resulting in a 9.20% daily range. The asset is trading just 1.75% below its session high, making it the strongest price retention story in this group.
This structure stands out. ZRO has not only moved higher from its opening level, it has also held most of that advance near the top of its intraday range. That suggests buyers have been able to absorb selling pressure after the initial upward move. The market has recorded more than $6.54M in 24 hour quoted volume, showing that the session has meaningful participation behind it.
LayerZero remains closely associated with cross chain communication and interoperability infrastructure. That role can become more visible when the market focuses on applications and networks that need to move assets and information across multiple blockchain ecosystems. In the current session, the key signal is not a future forecast. It is that ZRO is displaying relative strength compared with INIT and QNT. Sustained volume and orderly consolidation would be more meaningful than a sudden spike, while failure to retain the current gains would show that the rally remains vulnerable to profit taking.
Quant is trading at $154.70, up +0.25% from its 24 hour open of $154.32. QNT reached a high of $162.00 and a low of $152.08, producing a 6.52% daily range. The asset is currently 4.51% below its session high and remains above its daily open, indicating a balanced market where buyers have maintained a narrow advantage.
QNT’s price structure is less dramatic than INIT or ZRO, but that can be valuable context. It has remained comparatively controlled after testing both the upper and lower boundaries of the session. With more than $7.29M in 24 hour quoted volume, the market is active and liquid enough for price discovery to remain meaningful.
Quant is typically associated with interoperability and enterprise oriented blockchain infrastructure. Its current market behavior suggests that neither buyers nor sellers have established a decisive control of the session. The modest gain shows resilience, while the gap from the session high indicates that the market is still meeting supply on upward attempts. This type of structure often places attention on whether volume increases and whether the asset can retain stability as the wider crypto market changes.
The broader market message is clear. INIT is navigating a volatile pullback and needs stronger price retention. ZRO is leading on momentum, with buyers holding the asset close to its session high. QNT is moving with a steadier profile, remaining marginally positive while trading inside a defined range.
For market participants, the most valuable focus is confirmation. INIT needs to demonstrate whether demand can absorb the current selling pressure. ZRO needs to show whether its gains can remain supported after a strong move. QNT needs to establish whether its controlled range develops into stronger participation or continued consolidation.
Crypto markets can react rapidly to shifts in liquidity and sentiment. The current data provides a live snapshot, not a certainty about what comes next. Observing volume, range behavior, and price retention remains more useful than reacting emotionally to isolated percentage moves.
#Initia #LayerZero #Quant #CryptoMarket #Blockchain
$INIT
$ZRO
$QNT
This matters because markets rarely move with equal conviction across every project. Even within the infrastructure category, liquidity, narrative attention, trader positioning, and the ability to retain gains can create very different outcomes. Looking only at whether an asset is green or red can miss the more important signal: how price behaves within its full trading range.
Initia is trading at $0.10278, down -2.74% from its 24 hour open of $0.10568. The asset reached a high of $0.11313 and a low of $0.10046, creating a 12.61% session range. INIT is currently trading 9.15% below its daily high, which shows that sellers have been active after the market tested higher levels.
The positive aspect is that INIT remains above its session low, suggesting that buyers have appeared after the decline. However, the price is still below the opening level, so the market has not yet demonstrated a sustained recovery. Its more than $5.92M in 24 hour quoted volume confirms that this is an actively traded move rather than a low liquidity fluctuation.
INIT sits within the broader Layer 1 and Layer 2 infrastructure conversation, an area that can attract sharp interest when market participants are looking for scalability and ecosystem growth narratives. Yet the current technical picture calls for discipline. A 12.61% daily range signals that volatility is high, and sharp range conditions can produce quick reversals in either direction. The key market observation is whether buyers can stabilize the price after the pullback and regain consistent participation, rather than relying on a short lived bounce.
LayerZero is trading at $1.458, up +5.12% from its 24 hour open of $1.387. ZRO reached a high of $1.484 and a low of $1.359, resulting in a 9.20% daily range. The asset is trading just 1.75% below its session high, making it the strongest price retention story in this group.
This structure stands out. ZRO has not only moved higher from its opening level, it has also held most of that advance near the top of its intraday range. That suggests buyers have been able to absorb selling pressure after the initial upward move. The market has recorded more than $6.54M in 24 hour quoted volume, showing that the session has meaningful participation behind it.
LayerZero remains closely associated with cross chain communication and interoperability infrastructure. That role can become more visible when the market focuses on applications and networks that need to move assets and information across multiple blockchain ecosystems. In the current session, the key signal is not a future forecast. It is that ZRO is displaying relative strength compared with INIT and QNT. Sustained volume and orderly consolidation would be more meaningful than a sudden spike, while failure to retain the current gains would show that the rally remains vulnerable to profit taking.
Quant is trading at $154.70, up +0.25% from its 24 hour open of $154.32. QNT reached a high of $162.00 and a low of $152.08, producing a 6.52% daily range. The asset is currently 4.51% below its session high and remains above its daily open, indicating a balanced market where buyers have maintained a narrow advantage.
QNT’s price structure is less dramatic than INIT or ZRO, but that can be valuable context. It has remained comparatively controlled after testing both the upper and lower boundaries of the session. With more than $7.29M in 24 hour quoted volume, the market is active and liquid enough for price discovery to remain meaningful.
Quant is typically associated with interoperability and enterprise oriented blockchain infrastructure. Its current market behavior suggests that neither buyers nor sellers have established a decisive control of the session. The modest gain shows resilience, while the gap from the session high indicates that the market is still meeting supply on upward attempts. This type of structure often places attention on whether volume increases and whether the asset can retain stability as the wider crypto market changes.
The broader market message is clear. INIT is navigating a volatile pullback and needs stronger price retention. ZRO is leading on momentum, with buyers holding the asset close to its session high. QNT is moving with a steadier profile, remaining marginally positive while trading inside a defined range.
For market participants, the most valuable focus is confirmation. INIT needs to demonstrate whether demand can absorb the current selling pressure. ZRO needs to show whether its gains can remain supported after a strong move. QNT needs to establish whether its controlled range develops into stronger participation or continued consolidation.
Crypto markets can react rapidly to shifts in liquidity and sentiment. The current data provides a live snapshot, not a certainty about what comes next. Observing volume, range behavior, and price retention remains more useful than reacting emotionally to isolated percentage moves.
#Initia #LayerZero #Quant #CryptoMarket #Blockchain
$INIT
$ZRO
$QNT
13
WLD, TAO and INJ: AI Narratives Meet a Cautious MarketThe latest market structure across WLD, TAO, and INJ shows that the artificial intelligence and blockchain narrative remains active, but price action is becoming more selective. These are not identical assets and they should not be viewed through the same lens. WLD represents the intersection of digital identity and AI focused infrastructure, TAO is closely associated with decentralized machine intelligence, and INJ connects decentralized finance, trading infrastructure, and real world asset narratives.
In the current session, all three tokens are trading slightly below their 24 hour opening levels. However, the declines are measured rather than disorderly. This suggests a market that is reassessing momentum, not necessarily abandoning the broader themes behind these assets. For traders, the important question is not simply whether the candles are red or green. It is whether buyers can defend key areas of the daily range, whether liquidity remains consistent, and whether price can retain strength after testing higher levels.
Worldcoin is trading around $0.2645, down -0.30% from its 24 hour open of $0.2653. WLD reached a high of $0.2717 and a low of $0.2591, creating a 4.86% intraday range. The current price is 2.65% below the session high, which reflects modest selling after the market tested higher levels.
WLD’s structure is relatively controlled compared with many lower liquidity narrative tokens. The asset has traded within a defined range while generating more than $9.55M in quoted 24 hour volume. That level of activity indicates that the market remains engaged, even though buyers have not yet been able to sustain a move near the session high.
The Worldcoin narrative continues to attract attention because it sits within the evolving conversation around AI, digital identity, privacy, and access to online economic systems. Those themes can create sudden bursts of market interest, especially when AI related tokens become active across the wider market. At the same time, narrative strength must be supported by real demand and steady liquidity. WLD is currently showing a balanced structure where neither buyers nor sellers have established a decisive advantage.
Bittensor is trading near $192.30, down only -0.05% from its 24 hour open of $192.40. TAO reached a high of $196.20 and a low of $185.70, producing a 5.65% range. It is currently 1.99% below the session high, making it the asset with the strongest price retention in this group.
TAO’s ability to remain close to its opening price after moving through a meaningful range suggests that the market is still actively absorbing supply and demand. With approximately $9.43M in quoted 24 hour volume, TAO is showing continued participation rather than a thin or isolated move. The session low was tested, but buyers were able to bring price back toward the upper half of the range.
TAO is often watched as one of the leading tokens connected to decentralized AI infrastructure. That position makes it especially sensitive to shifts in sentiment around AI adoption, network growth, and higher beta crypto liquidity. The current data does not establish a future direction, but it does show a comparatively resilient structure. The key observation is whether price can continue to hold near the daily open while participation remains stable.
Injective is trading around $6.884, down -1.08% from its 24 hour open of $6.959. INJ recorded a high of $7.060 and a low of $6.603, resulting in a 6.92% range, the widest among the three assets. The current price is 2.49% below the session high, showing that sellers have had a slightly stronger influence after the attempt to move above $7.
INJ remains a closely monitored token because of its position across decentralized trading, Layer 1 infrastructure, DeFi, AI related narratives, and real world asset discussions. Its broader appeal can create strong liquidity when market attention returns, but its wider session range also confirms that volatility remains elevated.
The positive aspect is that INJ remains above its daily low, showing that demand has appeared after the decline. The more cautious aspect is that the market has not yet reclaimed its opening level. For INJ, sustained buying activity and a more stable range would matter more than a brief price spike. Volatility can create visibility, but consistency is what builds durable market confidence.
The bigger picture is straightforward. WLD is consolidating in a controlled range after testing higher prices. TAO is showing the most balanced structure and strongest retention near its session high. INJ is facing the most visible selling pressure, but it remains inside an active and liquid daily range.
This is a reminder that crypto markets reward selectivity. AI and infrastructure narratives can bring significant attention, but price performance ultimately depends on liquidity, volume, broader market conditions, and the ability of buyers to hold gains. Monitoring confirmation is more useful than reacting emotionally to short term fluctuations.
#Bittensor #Injective #AIcrypto #CryptoMarket
$WLD
{spot}(WLDUSDT)
$TAO
{spot}(TAOUSDT)
$INJ
{spot}(INJUSDT)
WLD, TAO and INJ: AI Narratives Meet a Cautious Market
The latest market structure across WLD, TAO, and INJ shows that the artificial intelligence and blockchain narrative remains active, but price action is becoming more selective. These are not identical assets and they should not be viewed through the same lens. WLD represents the intersection of digital identity and AI focused infrastructure, TAO is closely associated with decentralized machine intelligence, and INJ connects decentralized finance, trading infrastructure, and real world asset narratives.
In the current session, all three tokens are trading slightly below their 24 hour opening levels. However, the declines are measured rather than disorderly. This suggests a market that is reassessing momentum, not necessarily abandoning the broader themes behind these assets. For traders, the important question is not simply whether the candles are red or green. It is whether buyers can defend key areas of the daily range, whether liquidity remains consistent, and whether price can retain strength after testing higher levels.
Worldcoin is trading around $0.2645, down -0.30% from its 24 hour open of $0.2653. WLD reached a high of $0.2717 and a low of $0.2591, creating a 4.86% intraday range. The current price is 2.65% below the session high, which reflects modest selling after the market tested higher levels.
WLD’s structure is relatively controlled compared with many lower liquidity narrative tokens. The asset has traded within a defined range while generating more than $9.55M in quoted 24 hour volume. That level of activity indicates that the market remains engaged, even though buyers have not yet been able to sustain a move near the session high.
The Worldcoin narrative continues to attract attention because it sits within the evolving conversation around AI, digital identity, privacy, and access to online economic systems. Those themes can create sudden bursts of market interest, especially when AI related tokens become active across the wider market. At the same time, narrative strength must be supported by real demand and steady liquidity. WLD is currently showing a balanced structure where neither buyers nor sellers have established a decisive advantage.
Bittensor is trading near $192.30, down only -0.05% from its 24 hour open of $192.40. TAO reached a high of $196.20 and a low of $185.70, producing a 5.65% range. It is currently 1.99% below the session high, making it the asset with the strongest price retention in this group.
TAO’s ability to remain close to its opening price after moving through a meaningful range suggests that the market is still actively absorbing supply and demand. With approximately $9.43M in quoted 24 hour volume, TAO is showing continued participation rather than a thin or isolated move. The session low was tested, but buyers were able to bring price back toward the upper half of the range.
TAO is often watched as one of the leading tokens connected to decentralized AI infrastructure. That position makes it especially sensitive to shifts in sentiment around AI adoption, network growth, and higher beta crypto liquidity. The current data does not establish a future direction, but it does show a comparatively resilient structure. The key observation is whether price can continue to hold near the daily open while participation remains stable.
Injective is trading around $6.884, down -1.08% from its 24 hour open of $6.959. INJ recorded a high of $7.060 and a low of $6.603, resulting in a 6.92% range, the widest among the three assets. The current price is 2.49% below the session high, showing that sellers have had a slightly stronger influence after the attempt to move above $7.
INJ remains a closely monitored token because of its position across decentralized trading, Layer 1 infrastructure, DeFi, AI related narratives, and real world asset discussions. Its broader appeal can create strong liquidity when market attention returns, but its wider session range also confirms that volatility remains elevated.
The positive aspect is that INJ remains above its daily low, showing that demand has appeared after the decline. The more cautious aspect is that the market has not yet reclaimed its opening level. For INJ, sustained buying activity and a more stable range would matter more than a brief price spike. Volatility can create visibility, but consistency is what builds durable market confidence.
The bigger picture is straightforward. WLD is consolidating in a controlled range after testing higher prices. TAO is showing the most balanced structure and strongest retention near its session high. INJ is facing the most visible selling pressure, but it remains inside an active and liquid daily range.
This is a reminder that crypto markets reward selectivity. AI and infrastructure narratives can bring significant attention, but price performance ultimately depends on liquidity, volume, broader market conditions, and the ability of buyers to hold gains. Monitoring confirmation is more useful than reacting emotionally to short term fluctuations.
#Bittensor #Injective #AIcrypto #CryptoMarket
$WLD
$TAO
$INJ
In the current session, all three tokens are trading slightly below their 24 hour opening levels. However, the declines are measured rather than disorderly. This suggests a market that is reassessing momentum, not necessarily abandoning the broader themes behind these assets. For traders, the important question is not simply whether the candles are red or green. It is whether buyers can defend key areas of the daily range, whether liquidity remains consistent, and whether price can retain strength after testing higher levels.
Worldcoin is trading around $0.2645, down -0.30% from its 24 hour open of $0.2653. WLD reached a high of $0.2717 and a low of $0.2591, creating a 4.86% intraday range. The current price is 2.65% below the session high, which reflects modest selling after the market tested higher levels.
WLD’s structure is relatively controlled compared with many lower liquidity narrative tokens. The asset has traded within a defined range while generating more than $9.55M in quoted 24 hour volume. That level of activity indicates that the market remains engaged, even though buyers have not yet been able to sustain a move near the session high.
The Worldcoin narrative continues to attract attention because it sits within the evolving conversation around AI, digital identity, privacy, and access to online economic systems. Those themes can create sudden bursts of market interest, especially when AI related tokens become active across the wider market. At the same time, narrative strength must be supported by real demand and steady liquidity. WLD is currently showing a balanced structure where neither buyers nor sellers have established a decisive advantage.
Bittensor is trading near $192.30, down only -0.05% from its 24 hour open of $192.40. TAO reached a high of $196.20 and a low of $185.70, producing a 5.65% range. It is currently 1.99% below the session high, making it the asset with the strongest price retention in this group.
TAO’s ability to remain close to its opening price after moving through a meaningful range suggests that the market is still actively absorbing supply and demand. With approximately $9.43M in quoted 24 hour volume, TAO is showing continued participation rather than a thin or isolated move. The session low was tested, but buyers were able to bring price back toward the upper half of the range.
TAO is often watched as one of the leading tokens connected to decentralized AI infrastructure. That position makes it especially sensitive to shifts in sentiment around AI adoption, network growth, and higher beta crypto liquidity. The current data does not establish a future direction, but it does show a comparatively resilient structure. The key observation is whether price can continue to hold near the daily open while participation remains stable.
Injective is trading around $6.884, down -1.08% from its 24 hour open of $6.959. INJ recorded a high of $7.060 and a low of $6.603, resulting in a 6.92% range, the widest among the three assets. The current price is 2.49% below the session high, showing that sellers have had a slightly stronger influence after the attempt to move above $7.
INJ remains a closely monitored token because of its position across decentralized trading, Layer 1 infrastructure, DeFi, AI related narratives, and real world asset discussions. Its broader appeal can create strong liquidity when market attention returns, but its wider session range also confirms that volatility remains elevated.
The positive aspect is that INJ remains above its daily low, showing that demand has appeared after the decline. The more cautious aspect is that the market has not yet reclaimed its opening level. For INJ, sustained buying activity and a more stable range would matter more than a brief price spike. Volatility can create visibility, but consistency is what builds durable market confidence.
The bigger picture is straightforward. WLD is consolidating in a controlled range after testing higher prices. TAO is showing the most balanced structure and strongest retention near its session high. INJ is facing the most visible selling pressure, but it remains inside an active and liquid daily range.
This is a reminder that crypto markets reward selectivity. AI and infrastructure narratives can bring significant attention, but price performance ultimately depends on liquidity, volume, broader market conditions, and the ability of buyers to hold gains. Monitoring confirmation is more useful than reacting emotionally to short term fluctuations.
#Bittensor #Injective #AIcrypto #CryptoMarket
$WLD
$TAO
$INJ
21
HUMA, ICP and XPL: Momentum Is Building, but Market Structure Still MattersThe latest spot market data shows an active session for HUMA, ICP, and XPL, with all three assets trading above their 24 hour opening prices. However, the nature of each move is different. HUMA is leading on percentage momentum and volatility, ICP is showing strong price retention near its session high, while XPL is moving in a more controlled upward structure. This combination makes the group worth watching, but it also reinforces an important market principle: a green candle attracts attention, while sustained liquidity and price retention determine whether momentum has depth.
Huma Finance is trading around $0.00994, up +54.83% from its 24 hour open of $0.00642. It reached a high of $0.01055 and a low of $0.00624, creating a wide 69.07% range. The current price is only 5.78% below the session high, which shows that buyers have retained a meaningful portion of the upside after a highly volatile move.
HUMA’s price behavior reflects a market where attention and liquidity have increased sharply. The quoted 24 hour trading volume is above $10.83M, confirming that the move is supported by active participation rather than a quiet price drift. At the same time, a 69.07% range means that the market has experienced significant two way volatility. This is a setting where rapid gains can be followed by equally rapid retracements if enthusiasm fades or broader market conditions soften.
The constructive signal for HUMA is its ability to remain well above the opening price and relatively close to the daily high. The key risk is that such an extended move can attract short term speculation. For the trend to remain orderly, the market would need to show continued demand during consolidation rather than only responding to sudden bursts of activity. Traders following HUMA should watch whether volume remains consistent and whether price can maintain stability after its sharp expansion.
Internet Computer is trading near $2.540, up +14.36% from its 24 hour open of $2.221. ICP reached a high of $2.560 and a low of $2.198, producing a 16.47% daily range. The price is only 0.78% below the session high, making ICP the strongest asset in this group in terms of price retention.
This is a notable structure because ICP has not only advanced from its opening level, it has also held close to the peak of its current trading range. That suggests buyers have been able to absorb selling pressure following the move higher. The 24 hour quoted volume is above $10.83M, indicating meaningful market participation as the asset trades near the upper end of the session.
ICP remains relevant to market participants because of its role as a Layer 1 blockchain focused on decentralized compute infrastructure and onchain applications. In the current session, the technical story is more important than broad narratives. Buyers are clearly defending the advance, but the market still needs to demonstrate whether that demand can continue after the first wave of momentum. Holding near the daily high can support confidence, but price action can change quickly if volume slows or wider crypto sentiment turns cautious.
Plasma is trading around $0.04558, up +2.17% from its 24 hour open of $0.04461. XPL recorded a high of $0.04593 and a low of $0.04232, forming an 8.53% range. The current price is only 0.76% below the session high, showing a stable structure with modest positive momentum.
XPL is not matching HUMA’s aggressive percentage expansion or ICP’s stronger gain, but its market behavior is arguably more controlled. The asset recovered from its session low, moved above the daily open, and is now trading close to the high of the range. Its quoted 24 hour volume is above $11.99M, which indicates active market interest around the current level.
A controlled advance can sometimes be more sustainable than an immediate vertical spike, but this depends on ongoing liquidity and the broader crypto market environment. XPL’s current setup suggests that buyers are present and have maintained pressure near the upper range. The next important observation is whether that strength can continue without sharp volatility or whether the market begins to rotate lower after testing the session high.
The broader message across HUMA, ICP, and XPL is straightforward. HUMA is delivering the highest momentum alongside the highest volatility. ICP is showing the strongest ability to hold close to its session peak. XPL is moving higher at a more measured pace while maintaining a constructive position near its high.
These are encouraging short term structures, but no asset moves in a straight line. A strong session can develop into consolidation, continuation, or reversal depending on liquidity, market sentiment, and how buyers react after volatility increases. Monitoring volume, price retention, and the response around each session high remains more useful than reacting emotionally to percentage gains alone.
HumaFinance #InternetComputer #Plasma #CryptoMarket #Altcoins
$HUMA
{spot}(HUMAUSDT)
$ICP
{spot}(ICPUSDT)
$XPL
{spot}(XPLUSDT)
HUMA, ICP and XPL: Momentum Is Building, but Market Structure Still Matters
The latest spot market data shows an active session for HUMA, ICP, and XPL, with all three assets trading above their 24 hour opening prices. However, the nature of each move is different. HUMA is leading on percentage momentum and volatility, ICP is showing strong price retention near its session high, while XPL is moving in a more controlled upward structure. This combination makes the group worth watching, but it also reinforces an important market principle: a green candle attracts attention, while sustained liquidity and price retention determine whether momentum has depth.
Huma Finance is trading around $0.00994, up +54.83% from its 24 hour open of $0.00642. It reached a high of $0.01055 and a low of $0.00624, creating a wide 69.07% range. The current price is only 5.78% below the session high, which shows that buyers have retained a meaningful portion of the upside after a highly volatile move.
HUMA’s price behavior reflects a market where attention and liquidity have increased sharply. The quoted 24 hour trading volume is above $10.83M, confirming that the move is supported by active participation rather than a quiet price drift. At the same time, a 69.07% range means that the market has experienced significant two way volatility. This is a setting where rapid gains can be followed by equally rapid retracements if enthusiasm fades or broader market conditions soften.
The constructive signal for HUMA is its ability to remain well above the opening price and relatively close to the daily high. The key risk is that such an extended move can attract short term speculation. For the trend to remain orderly, the market would need to show continued demand during consolidation rather than only responding to sudden bursts of activity. Traders following HUMA should watch whether volume remains consistent and whether price can maintain stability after its sharp expansion.
Internet Computer is trading near $2.540, up +14.36% from its 24 hour open of $2.221. ICP reached a high of $2.560 and a low of $2.198, producing a 16.47% daily range. The price is only 0.78% below the session high, making ICP the strongest asset in this group in terms of price retention.
This is a notable structure because ICP has not only advanced from its opening level, it has also held close to the peak of its current trading range. That suggests buyers have been able to absorb selling pressure following the move higher. The 24 hour quoted volume is above $10.83M, indicating meaningful market participation as the asset trades near the upper end of the session.
ICP remains relevant to market participants because of its role as a Layer 1 blockchain focused on decentralized compute infrastructure and onchain applications. In the current session, the technical story is more important than broad narratives. Buyers are clearly defending the advance, but the market still needs to demonstrate whether that demand can continue after the first wave of momentum. Holding near the daily high can support confidence, but price action can change quickly if volume slows or wider crypto sentiment turns cautious.
Plasma is trading around $0.04558, up +2.17% from its 24 hour open of $0.04461. XPL recorded a high of $0.04593 and a low of $0.04232, forming an 8.53% range. The current price is only 0.76% below the session high, showing a stable structure with modest positive momentum.
XPL is not matching HUMA’s aggressive percentage expansion or ICP’s stronger gain, but its market behavior is arguably more controlled. The asset recovered from its session low, moved above the daily open, and is now trading close to the high of the range. Its quoted 24 hour volume is above $11.99M, which indicates active market interest around the current level.
A controlled advance can sometimes be more sustainable than an immediate vertical spike, but this depends on ongoing liquidity and the broader crypto market environment. XPL’s current setup suggests that buyers are present and have maintained pressure near the upper range. The next important observation is whether that strength can continue without sharp volatility or whether the market begins to rotate lower after testing the session high.
The broader message across HUMA, ICP, and XPL is straightforward. HUMA is delivering the highest momentum alongside the highest volatility. ICP is showing the strongest ability to hold close to its session peak. XPL is moving higher at a more measured pace while maintaining a constructive position near its high.
These are encouraging short term structures, but no asset moves in a straight line. A strong session can develop into consolidation, continuation, or reversal depending on liquidity, market sentiment, and how buyers react after volatility increases. Monitoring volume, price retention, and the response around each session high remains more useful than reacting emotionally to percentage gains alone.
HumaFinance #InternetComputer #Plasma #CryptoMarket #Altcoins
$HUMA
$ICP
$XPL
Huma Finance is trading around $0.00994, up +54.83% from its 24 hour open of $0.00642. It reached a high of $0.01055 and a low of $0.00624, creating a wide 69.07% range. The current price is only 5.78% below the session high, which shows that buyers have retained a meaningful portion of the upside after a highly volatile move.
HUMA’s price behavior reflects a market where attention and liquidity have increased sharply. The quoted 24 hour trading volume is above $10.83M, confirming that the move is supported by active participation rather than a quiet price drift. At the same time, a 69.07% range means that the market has experienced significant two way volatility. This is a setting where rapid gains can be followed by equally rapid retracements if enthusiasm fades or broader market conditions soften.
The constructive signal for HUMA is its ability to remain well above the opening price and relatively close to the daily high. The key risk is that such an extended move can attract short term speculation. For the trend to remain orderly, the market would need to show continued demand during consolidation rather than only responding to sudden bursts of activity. Traders following HUMA should watch whether volume remains consistent and whether price can maintain stability after its sharp expansion.
Internet Computer is trading near $2.540, up +14.36% from its 24 hour open of $2.221. ICP reached a high of $2.560 and a low of $2.198, producing a 16.47% daily range. The price is only 0.78% below the session high, making ICP the strongest asset in this group in terms of price retention.
This is a notable structure because ICP has not only advanced from its opening level, it has also held close to the peak of its current trading range. That suggests buyers have been able to absorb selling pressure following the move higher. The 24 hour quoted volume is above $10.83M, indicating meaningful market participation as the asset trades near the upper end of the session.
ICP remains relevant to market participants because of its role as a Layer 1 blockchain focused on decentralized compute infrastructure and onchain applications. In the current session, the technical story is more important than broad narratives. Buyers are clearly defending the advance, but the market still needs to demonstrate whether that demand can continue after the first wave of momentum. Holding near the daily high can support confidence, but price action can change quickly if volume slows or wider crypto sentiment turns cautious.
Plasma is trading around $0.04558, up +2.17% from its 24 hour open of $0.04461. XPL recorded a high of $0.04593 and a low of $0.04232, forming an 8.53% range. The current price is only 0.76% below the session high, showing a stable structure with modest positive momentum.
XPL is not matching HUMA’s aggressive percentage expansion or ICP’s stronger gain, but its market behavior is arguably more controlled. The asset recovered from its session low, moved above the daily open, and is now trading close to the high of the range. Its quoted 24 hour volume is above $11.99M, which indicates active market interest around the current level.
A controlled advance can sometimes be more sustainable than an immediate vertical spike, but this depends on ongoing liquidity and the broader crypto market environment. XPL’s current setup suggests that buyers are present and have maintained pressure near the upper range. The next important observation is whether that strength can continue without sharp volatility or whether the market begins to rotate lower after testing the session high.
The broader message across HUMA, ICP, and XPL is straightforward. HUMA is delivering the highest momentum alongside the highest volatility. ICP is showing the strongest ability to hold close to its session peak. XPL is moving higher at a more measured pace while maintaining a constructive position near its high.
These are encouraging short term structures, but no asset moves in a straight line. A strong session can develop into consolidation, continuation, or reversal depending on liquidity, market sentiment, and how buyers react after volatility increases. Monitoring volume, price retention, and the response around each session high remains more useful than reacting emotionally to percentage gains alone.
HumaFinance #InternetComputer #Plasma #CryptoMarket #Altcoins
$HUMA
$ICP
$XPL
19
SUI, LINK and AVAX: Three Major Infrastructure Narratives Facing a Key Market Test
The latest market action across SUI, LINK, and AVAX shows a cautious tone developing among major infrastructure focused crypto assets. All three are trading modestly below their latest 24 hour opening prices, but the percentage moves remain contained. This suggests that the market is not experiencing a broad panic driven selloff. Instead, traders appear selective, liquidity is being carefully allocated, and each asset is being tested on its own ability to retain attention during a softer session.
The key lesson in this environment is simple. Red candles alone do not define a market trend. What matters is whether selling remains controlled, whether buyers defend lower areas, whether volume stays healthy, and whether price can recover after pressure appears. SUI, LINK, and AVAX each offer a different lens into the current market.
SUI is currently trading around $0.7220, down -0.78% from its 24 hour open of $0.7277. It reached a high of $0.7401 and a low of $0.7081, creating a 4.52% range. The token is trading 2.45% below its session high, which indicates that sellers have pushed price lower after an early attempt to move upward, but the decline is still relatively controlled within the daily range.
SUI remains closely watched because it represents a newer generation Layer 1 network focused on speed, scalability, and a smoother onchain user experience. Its market profile tends to be sensitive to broader altcoin liquidity and ecosystem related interest. When traders become more willing to take risk, high beta Layer 1 assets can often attract fast attention. When sentiment becomes cautious, those same assets can experience sharper short term swings.
The current SUI structure shows a market looking for fresh confirmation. Buyers defended the $0.7081 session low, which is a constructive sign, but the price still needs to demonstrate that demand can return as it approaches higher areas of the range. The latest quoted volume of more than $17M also confirms that this is an actively traded market, not a low liquidity move. For now, SUI is in a phase where price retention and participation matter more than isolated intraday spikes.
$SUI
{spot}(SUIUSDT)
$LINK
{spot}(LINKUSDT)
$AVAX
{spot}(AVAXUSDT)
SUI, LINK and AVAX: Three Major Infrastructure Narratives Facing a Key Market Test
The latest market action across SUI, LINK, and AVAX shows a cautious tone developing among major infrastructure focused crypto assets. All three are trading modestly below their latest 24 hour opening prices, but the percentage moves remain contained. This suggests that the market is not experiencing a broad panic driven selloff. Instead, traders appear selective, liquidity is being carefully allocated, and each asset is being tested on its own ability to retain attention during a softer session.
The key lesson in this environment is simple. Red candles alone do not define a market trend. What matters is whether selling remains controlled, whether buyers defend lower areas, whether volume stays healthy, and whether price can recover after pressure appears. SUI, LINK, and AVAX each offer a different lens into the current market.
SUI is currently trading around $0.7220, down -0.78% from its 24 hour open of $0.7277. It reached a high of $0.7401 and a low of $0.7081, creating a 4.52% range. The token is trading 2.45% below its session high, which indicates that sellers have pushed price lower after an early attempt to move upward, but the decline is still relatively controlled within the daily range.
SUI remains closely watched because it represents a newer generation Layer 1 network focused on speed, scalability, and a smoother onchain user experience. Its market profile tends to be sensitive to broader altcoin liquidity and ecosystem related interest. When traders become more willing to take risk, high beta Layer 1 assets can often attract fast attention. When sentiment becomes cautious, those same assets can experience sharper short term swings.
The current SUI structure shows a market looking for fresh confirmation. Buyers defended the $0.7081 session low, which is a constructive sign, but the price still needs to demonstrate that demand can return as it approaches higher areas of the range. The latest quoted volume of more than $17M also confirms that this is an actively traded market, not a low liquidity move. For now, SUI is in a phase where price retention and participation matter more than isolated intraday spikes.
$SUI
$LINK
$AVAX
The key lesson in this environment is simple. Red candles alone do not define a market trend. What matters is whether selling remains controlled, whether buyers defend lower areas, whether volume stays healthy, and whether price can recover after pressure appears. SUI, LINK, and AVAX each offer a different lens into the current market.
SUI is currently trading around $0.7220, down -0.78% from its 24 hour open of $0.7277. It reached a high of $0.7401 and a low of $0.7081, creating a 4.52% range. The token is trading 2.45% below its session high, which indicates that sellers have pushed price lower after an early attempt to move upward, but the decline is still relatively controlled within the daily range.
SUI remains closely watched because it represents a newer generation Layer 1 network focused on speed, scalability, and a smoother onchain user experience. Its market profile tends to be sensitive to broader altcoin liquidity and ecosystem related interest. When traders become more willing to take risk, high beta Layer 1 assets can often attract fast attention. When sentiment becomes cautious, those same assets can experience sharper short term swings.
The current SUI structure shows a market looking for fresh confirmation. Buyers defended the $0.7081 session low, which is a constructive sign, but the price still needs to demonstrate that demand can return as it approaches higher areas of the range. The latest quoted volume of more than $17M also confirms that this is an actively traded market, not a low liquidity move. For now, SUI is in a phase where price retention and participation matter more than isolated intraday spikes.
$SUI
$LINK
$AVAX
6
ASTER, XAUT and RARE: Momentum, Stability and Volatility Are Moving on Different Tracks
The latest market action across ASTER, XAUT, and RARE highlights how selective crypto participation has become. These three assets are all trading above their 24 hour opening levels, yet the quality and character of each move are significantly different. ASTER is showing strong directional momentum, XAUT is holding a measured and defensive structure, while RARE is capturing attention through an aggressive move accompanied by very high volatility.
This is a market where the percentage gain alone does not tell the full story. The ability to hold near session highs, the size of the intraday range, and how price behaves after an expansion are all critical signals for traders watching liquidity and market conviction.
ASTER is currently trading at $0.5720, up +7.97% from its 24 hour open of $0.5298. The asset moved between $0.4894 and $0.5768, creating a 17.86% range. ASTER is trading only 0.83% below its session high, which indicates that buyers have largely retained control after a volatile move higher.
That price structure is notable because it suggests the market has absorbed selling pressure rather than immediately rejecting the upside. When an asset advances strongly and remains close to the top of its range, attention often shifts toward whether buyers can sustain participation after the initial impulse. The key is not simply reaching a new intraday high. It is whether the market can maintain orderly demand as traders assess profits and fresh liquidity enters the order book.
ASTER’s elevated range also means risk is elevated. A 17.86% session range shows active two way trading, where rapid reversals remain possible. The constructive element is the price location near the daily high. The risk element is that a fast move can attract short term speculation, making sentiment sensitive to any reduction in volume or broader market weakness. Market participants should watch whether price remains supported above its daily open and whether activity stays consistent during consolidation.
XAUT, which represents Tether Gold, is trading at $3,843.31, up +0.06% from its 24 hour open of $3,841.12. It recorded a high of $3,883.36 and a low of $3,821.25, resulting in a much narrower 1.63% daily range. The current price sits 1.03% below the session high, reflecting a relatively contained market structure compared with ASTER and RARE.
XAUT offers a different type of market exposure. Its behavior is closely connected to gold market sentiment rather than the high beta conditions often seen in altcoins. This can make it relevant during periods when market participants are balancing growth oriented risk with demand for assets linked to traditional stores of value. The current data shows that XAUT is holding close to its opening level, with neither buyers nor sellers producing a decisive directional break.
The narrow range is not necessarily a sign of weakness. It can reflect a stable auction between supply and demand, particularly for an asset tied to the gold market. For traders, the important observation is that XAUT is moving with far less intraday volatility than the other two assets. That relative stability can become especially noticeable when speculative tokens experience sharp expansions or abrupt reversals.
RARE is trading at $0.01471, up +11.36% from its 24 hour open of $0.01321. It reached a high of $0.01834 and a low of $0.01138, generating a 61.16% range during the session. This is by far the most volatile structure in the group. Although RARE remains above its daily open, it is currently 19.79% below the session high, showing that sellers have been active after the initial expansion.
RARE’s market behavior reflects the intensity often seen in lower priced, narrative sensitive tokens. Its trading volume is substantial, with more than $19M in quoted 24 hour activity, but a broad range such as this also reveals a highly contested market. Buyers were able to drive price sharply higher, while sellers were able to pull it back meaningfully from the peak. That is a classic sign of strong interest combined with elevated uncertainty.
The immediate question for RARE is whether it can establish stability after the large intraday swing. If buyers defend the price above the daily open and volatility begins to compress, market confidence may improve. If sharp rebounds continue to face rapid selling, the token may remain highly speculative and difficult to read on a short term basis. In high range conditions, disciplined risk management matters more than excitement around a headline percentage gain.
The broader picture is clear. ASTER is displaying strong upward momentum and is holding close to its session high. XAUT is providing the most stable and controlled price structure, reflecting its gold linked market profile. RARE is delivering the strongest percentage gain, but also carries the highest volatility and the clearest evidence of active profit taking.
The market is rewarding selectivity. Momentum can attract attention, stability can offer balance, and volatility can create opportunity as well as risk. Watching price retention, volume consistency, and broader market conditions remains more valuable than reacting to isolated green candles.
$ASTER
{spot}(ASTERUSDT)
$XAUT
{spot}(XAUTUSDT)
$RARE
{spot}(RAREUSDT)
ASTER, XAUT and RARE: Momentum, Stability and Volatility Are Moving on Different Tracks
The latest market action across ASTER, XAUT, and RARE highlights how selective crypto participation has become. These three assets are all trading above their 24 hour opening levels, yet the quality and character of each move are significantly different. ASTER is showing strong directional momentum, XAUT is holding a measured and defensive structure, while RARE is capturing attention through an aggressive move accompanied by very high volatility.
This is a market where the percentage gain alone does not tell the full story. The ability to hold near session highs, the size of the intraday range, and how price behaves after an expansion are all critical signals for traders watching liquidity and market conviction.
ASTER is currently trading at $0.5720, up +7.97% from its 24 hour open of $0.5298. The asset moved between $0.4894 and $0.5768, creating a 17.86% range. ASTER is trading only 0.83% below its session high, which indicates that buyers have largely retained control after a volatile move higher.
That price structure is notable because it suggests the market has absorbed selling pressure rather than immediately rejecting the upside. When an asset advances strongly and remains close to the top of its range, attention often shifts toward whether buyers can sustain participation after the initial impulse. The key is not simply reaching a new intraday high. It is whether the market can maintain orderly demand as traders assess profits and fresh liquidity enters the order book.
ASTER’s elevated range also means risk is elevated. A 17.86% session range shows active two way trading, where rapid reversals remain possible. The constructive element is the price location near the daily high. The risk element is that a fast move can attract short term speculation, making sentiment sensitive to any reduction in volume or broader market weakness. Market participants should watch whether price remains supported above its daily open and whether activity stays consistent during consolidation.
XAUT, which represents Tether Gold, is trading at $3,843.31, up +0.06% from its 24 hour open of $3,841.12. It recorded a high of $3,883.36 and a low of $3,821.25, resulting in a much narrower 1.63% daily range. The current price sits 1.03% below the session high, reflecting a relatively contained market structure compared with ASTER and RARE.
XAUT offers a different type of market exposure. Its behavior is closely connected to gold market sentiment rather than the high beta conditions often seen in altcoins. This can make it relevant during periods when market participants are balancing growth oriented risk with demand for assets linked to traditional stores of value. The current data shows that XAUT is holding close to its opening level, with neither buyers nor sellers producing a decisive directional break.
The narrow range is not necessarily a sign of weakness. It can reflect a stable auction between supply and demand, particularly for an asset tied to the gold market. For traders, the important observation is that XAUT is moving with far less intraday volatility than the other two assets. That relative stability can become especially noticeable when speculative tokens experience sharp expansions or abrupt reversals.
RARE is trading at $0.01471, up +11.36% from its 24 hour open of $0.01321. It reached a high of $0.01834 and a low of $0.01138, generating a 61.16% range during the session. This is by far the most volatile structure in the group. Although RARE remains above its daily open, it is currently 19.79% below the session high, showing that sellers have been active after the initial expansion.
RARE’s market behavior reflects the intensity often seen in lower priced, narrative sensitive tokens. Its trading volume is substantial, with more than $19M in quoted 24 hour activity, but a broad range such as this also reveals a highly contested market. Buyers were able to drive price sharply higher, while sellers were able to pull it back meaningfully from the peak. That is a classic sign of strong interest combined with elevated uncertainty.
The immediate question for RARE is whether it can establish stability after the large intraday swing. If buyers defend the price above the daily open and volatility begins to compress, market confidence may improve. If sharp rebounds continue to face rapid selling, the token may remain highly speculative and difficult to read on a short term basis. In high range conditions, disciplined risk management matters more than excitement around a headline percentage gain.
The broader picture is clear. ASTER is displaying strong upward momentum and is holding close to its session high. XAUT is providing the most stable and controlled price structure, reflecting its gold linked market profile. RARE is delivering the strongest percentage gain, but also carries the highest volatility and the clearest evidence of active profit taking.
The market is rewarding selectivity. Momentum can attract attention, stability can offer balance, and volatility can create opportunity as well as risk. Watching price retention, volume consistency, and broader market conditions remains more valuable than reacting to isolated green candles.
$ASTER
$XAUT
$RARE
This is a market where the percentage gain alone does not tell the full story. The ability to hold near session highs, the size of the intraday range, and how price behaves after an expansion are all critical signals for traders watching liquidity and market conviction.
ASTER is currently trading at $0.5720, up +7.97% from its 24 hour open of $0.5298. The asset moved between $0.4894 and $0.5768, creating a 17.86% range. ASTER is trading only 0.83% below its session high, which indicates that buyers have largely retained control after a volatile move higher.
That price structure is notable because it suggests the market has absorbed selling pressure rather than immediately rejecting the upside. When an asset advances strongly and remains close to the top of its range, attention often shifts toward whether buyers can sustain participation after the initial impulse. The key is not simply reaching a new intraday high. It is whether the market can maintain orderly demand as traders assess profits and fresh liquidity enters the order book.
ASTER’s elevated range also means risk is elevated. A 17.86% session range shows active two way trading, where rapid reversals remain possible. The constructive element is the price location near the daily high. The risk element is that a fast move can attract short term speculation, making sentiment sensitive to any reduction in volume or broader market weakness. Market participants should watch whether price remains supported above its daily open and whether activity stays consistent during consolidation.
XAUT, which represents Tether Gold, is trading at $3,843.31, up +0.06% from its 24 hour open of $3,841.12. It recorded a high of $3,883.36 and a low of $3,821.25, resulting in a much narrower 1.63% daily range. The current price sits 1.03% below the session high, reflecting a relatively contained market structure compared with ASTER and RARE.
XAUT offers a different type of market exposure. Its behavior is closely connected to gold market sentiment rather than the high beta conditions often seen in altcoins. This can make it relevant during periods when market participants are balancing growth oriented risk with demand for assets linked to traditional stores of value. The current data shows that XAUT is holding close to its opening level, with neither buyers nor sellers producing a decisive directional break.
The narrow range is not necessarily a sign of weakness. It can reflect a stable auction between supply and demand, particularly for an asset tied to the gold market. For traders, the important observation is that XAUT is moving with far less intraday volatility than the other two assets. That relative stability can become especially noticeable when speculative tokens experience sharp expansions or abrupt reversals.
RARE is trading at $0.01471, up +11.36% from its 24 hour open of $0.01321. It reached a high of $0.01834 and a low of $0.01138, generating a 61.16% range during the session. This is by far the most volatile structure in the group. Although RARE remains above its daily open, it is currently 19.79% below the session high, showing that sellers have been active after the initial expansion.
RARE’s market behavior reflects the intensity often seen in lower priced, narrative sensitive tokens. Its trading volume is substantial, with more than $19M in quoted 24 hour activity, but a broad range such as this also reveals a highly contested market. Buyers were able to drive price sharply higher, while sellers were able to pull it back meaningfully from the peak. That is a classic sign of strong interest combined with elevated uncertainty.
The immediate question for RARE is whether it can establish stability after the large intraday swing. If buyers defend the price above the daily open and volatility begins to compress, market confidence may improve. If sharp rebounds continue to face rapid selling, the token may remain highly speculative and difficult to read on a short term basis. In high range conditions, disciplined risk management matters more than excitement around a headline percentage gain.
The broader picture is clear. ASTER is displaying strong upward momentum and is holding close to its session high. XAUT is providing the most stable and controlled price structure, reflecting its gold linked market profile. RARE is delivering the strongest percentage gain, but also carries the highest volatility and the clearest evidence of active profit taking.
The market is rewarding selectivity. Momentum can attract attention, stability can offer balance, and volatility can create opportunity as well as risk. Watching price retention, volume consistency, and broader market conditions remains more valuable than reacting to isolated green candles.
$ASTER
$XAUT
$RARE
9
HYPE, DOGE and TRX: Momentum, Attention and Stability Are Telling Different Stories
The latest market structure across HYPE, DOGE, and TRX shows how selective crypto liquidity has become. All three assets are trading above their respective 24 hour opens, but the character of their moves is very different. HYPE is attracting the strongest momentum and widest volatility, DOGE is showing a measured recovery driven by its high visibility meme market profile, and TRX is maintaining a slower but more stable structure.
This is an important distinction for anyone following the market closely. A green percentage alone does not tell the full story. The range, volume, behavior near the session high, and ability to retain gains often reveal more about market conviction than the headline move itself.
Hyperliquid is trading at $68.86, up +2.08% from its 24 hour open of $67.46. The asset reached a high of $69.27 and a low of $64.84, producing a 6.83% intraday range. That makes HYPE the most active and volatile of the three assets in the current session.
The move above the daily open suggests that buyers have maintained control after the market tested lower levels. More importantly, HYPE is trading close to the session high, which indicates that the recovery has not been immediately rejected. This is generally a stronger short term structure than an asset that spikes early and then gives back most of its gains.
HYPE continues to receive attention because it sits at the intersection of decentralized trading infrastructure, onchain liquidity, and the growing interest in derivatives focused ecosystems. That narrative can attract strong participation when market sentiment is constructive, but it can also create rapid swings when traders take profit or liquidity changes direction.
The main point to watch is whether HYPE can hold above its opening level while maintaining participation. A stable consolidation near the higher end of the range may show that buyers are still willing to support the move. However, the wide 6.83% range is also a reminder that volatility is elevated. Fast moves can bring strong engagement, but they also demand careful risk management.
Dogecoin is trading at $0.05936, up +0.99% from its 24 hour open of $0.05878. DOGE reached a high of $0.06012 and a low of $0.05800, creating a 3.66% range during the session. The price is currently above the daily open and closer to the upper half of its range, which shows that buyers have recovered some control after the early low.
DOGE remains one of the most recognizable assets in crypto because of its large community, deep liquidity, and ability to attract attention when meme coin activity increases. Its price behavior often reacts quickly to shifts in market sentiment, social engagement, and wider risk appetite. That makes DOGE an important asset to monitor when traders want to understand whether speculative interest is returning to the market.
The current DOGE structure is constructive but still measured. The gain is positive, yet the market has not moved aggressively beyond the session high. For momentum to strengthen, buyers would need to show consistent demand rather than a brief reaction from lower prices. If DOGE can retain its position above the daily open while volume improves, market attention may increase. If the price falls back toward the lower range, it would suggest that sellers are still active and the recovery remains fragile.
TRX is trading at $0.3056, up +0.33% from its 24 hour open of $0.3046. It reached a high of $0.3074 and a low of $0.3023, forming a narrow 1.69% range. Compared with HYPE and DOGE, TRX is displaying the most controlled price action in the group.
This tighter range can be interpreted as a sign of relative stability rather than lack of interest. TRX is holding above its daily open, but without the sharp volatility seen in HYPE or the more sentiment driven movement in DOGE. That makes its current structure different. It is showing a slower, more orderly battle between buyers and sellers.
TRX remains closely watched due to its role in blockchain transfers, stablecoin activity, and the wider TRON ecosystem. When the asset trades within a contained range, market participants often watch for whether volume begins to rise before price expands. A narrow range can eventually lead to a stronger directional move, but direction should be confirmed by sustained market participation rather than assumed.
The broader market picture is clear. HYPE is leading on momentum and volatility. DOGE is showing a positive recovery but still needs stronger follow through. TRX is offering the most stable structure, with a modest gain and limited intraday fluctuations.
These three assets represent different styles of crypto market behavior. HYPE reflects higher beta participation and active volatility. DOGE reflects community driven liquidity and speculative attention. TRX reflects a steadier structure tied to its established ecosystem role. None of these signals guarantees what happens next, but each provides useful context for traders observing where capital, volume, and attention are moving.
$HYPE
{spot}(HYPEUSDT)
$DOGE
{spot}(DOGEUSDT)
$TRX
{spot}(TRXUSDT)
HYPE, DOGE and TRX: Momentum, Attention and Stability Are Telling Different Stories
The latest market structure across HYPE, DOGE, and TRX shows how selective crypto liquidity has become. All three assets are trading above their respective 24 hour opens, but the character of their moves is very different. HYPE is attracting the strongest momentum and widest volatility, DOGE is showing a measured recovery driven by its high visibility meme market profile, and TRX is maintaining a slower but more stable structure.
This is an important distinction for anyone following the market closely. A green percentage alone does not tell the full story. The range, volume, behavior near the session high, and ability to retain gains often reveal more about market conviction than the headline move itself.
Hyperliquid is trading at $68.86, up +2.08% from its 24 hour open of $67.46. The asset reached a high of $69.27 and a low of $64.84, producing a 6.83% intraday range. That makes HYPE the most active and volatile of the three assets in the current session.
The move above the daily open suggests that buyers have maintained control after the market tested lower levels. More importantly, HYPE is trading close to the session high, which indicates that the recovery has not been immediately rejected. This is generally a stronger short term structure than an asset that spikes early and then gives back most of its gains.
HYPE continues to receive attention because it sits at the intersection of decentralized trading infrastructure, onchain liquidity, and the growing interest in derivatives focused ecosystems. That narrative can attract strong participation when market sentiment is constructive, but it can also create rapid swings when traders take profit or liquidity changes direction.
The main point to watch is whether HYPE can hold above its opening level while maintaining participation. A stable consolidation near the higher end of the range may show that buyers are still willing to support the move. However, the wide 6.83% range is also a reminder that volatility is elevated. Fast moves can bring strong engagement, but they also demand careful risk management.
Dogecoin is trading at $0.05936, up +0.99% from its 24 hour open of $0.05878. DOGE reached a high of $0.06012 and a low of $0.05800, creating a 3.66% range during the session. The price is currently above the daily open and closer to the upper half of its range, which shows that buyers have recovered some control after the early low.
DOGE remains one of the most recognizable assets in crypto because of its large community, deep liquidity, and ability to attract attention when meme coin activity increases. Its price behavior often reacts quickly to shifts in market sentiment, social engagement, and wider risk appetite. That makes DOGE an important asset to monitor when traders want to understand whether speculative interest is returning to the market.
The current DOGE structure is constructive but still measured. The gain is positive, yet the market has not moved aggressively beyond the session high. For momentum to strengthen, buyers would need to show consistent demand rather than a brief reaction from lower prices. If DOGE can retain its position above the daily open while volume improves, market attention may increase. If the price falls back toward the lower range, it would suggest that sellers are still active and the recovery remains fragile.
TRX is trading at $0.3056, up +0.33% from its 24 hour open of $0.3046. It reached a high of $0.3074 and a low of $0.3023, forming a narrow 1.69% range. Compared with HYPE and DOGE, TRX is displaying the most controlled price action in the group.
This tighter range can be interpreted as a sign of relative stability rather than lack of interest. TRX is holding above its daily open, but without the sharp volatility seen in HYPE or the more sentiment driven movement in DOGE. That makes its current structure different. It is showing a slower, more orderly battle between buyers and sellers.
TRX remains closely watched due to its role in blockchain transfers, stablecoin activity, and the wider TRON ecosystem. When the asset trades within a contained range, market participants often watch for whether volume begins to rise before price expands. A narrow range can eventually lead to a stronger directional move, but direction should be confirmed by sustained market participation rather than assumed.
The broader market picture is clear. HYPE is leading on momentum and volatility. DOGE is showing a positive recovery but still needs stronger follow through. TRX is offering the most stable structure, with a modest gain and limited intraday fluctuations.
These three assets represent different styles of crypto market behavior. HYPE reflects higher beta participation and active volatility. DOGE reflects community driven liquidity and speculative attention. TRX reflects a steadier structure tied to its established ecosystem role. None of these signals guarantees what happens next, but each provides useful context for traders observing where capital, volume, and attention are moving.
$HYPE
$DOGE
$TRX
This is an important distinction for anyone following the market closely. A green percentage alone does not tell the full story. The range, volume, behavior near the session high, and ability to retain gains often reveal more about market conviction than the headline move itself.
Hyperliquid is trading at $68.86, up +2.08% from its 24 hour open of $67.46. The asset reached a high of $69.27 and a low of $64.84, producing a 6.83% intraday range. That makes HYPE the most active and volatile of the three assets in the current session.
The move above the daily open suggests that buyers have maintained control after the market tested lower levels. More importantly, HYPE is trading close to the session high, which indicates that the recovery has not been immediately rejected. This is generally a stronger short term structure than an asset that spikes early and then gives back most of its gains.
HYPE continues to receive attention because it sits at the intersection of decentralized trading infrastructure, onchain liquidity, and the growing interest in derivatives focused ecosystems. That narrative can attract strong participation when market sentiment is constructive, but it can also create rapid swings when traders take profit or liquidity changes direction.
The main point to watch is whether HYPE can hold above its opening level while maintaining participation. A stable consolidation near the higher end of the range may show that buyers are still willing to support the move. However, the wide 6.83% range is also a reminder that volatility is elevated. Fast moves can bring strong engagement, but they also demand careful risk management.
Dogecoin is trading at $0.05936, up +0.99% from its 24 hour open of $0.05878. DOGE reached a high of $0.06012 and a low of $0.05800, creating a 3.66% range during the session. The price is currently above the daily open and closer to the upper half of its range, which shows that buyers have recovered some control after the early low.
DOGE remains one of the most recognizable assets in crypto because of its large community, deep liquidity, and ability to attract attention when meme coin activity increases. Its price behavior often reacts quickly to shifts in market sentiment, social engagement, and wider risk appetite. That makes DOGE an important asset to monitor when traders want to understand whether speculative interest is returning to the market.
The current DOGE structure is constructive but still measured. The gain is positive, yet the market has not moved aggressively beyond the session high. For momentum to strengthen, buyers would need to show consistent demand rather than a brief reaction from lower prices. If DOGE can retain its position above the daily open while volume improves, market attention may increase. If the price falls back toward the lower range, it would suggest that sellers are still active and the recovery remains fragile.
TRX is trading at $0.3056, up +0.33% from its 24 hour open of $0.3046. It reached a high of $0.3074 and a low of $0.3023, forming a narrow 1.69% range. Compared with HYPE and DOGE, TRX is displaying the most controlled price action in the group.
This tighter range can be interpreted as a sign of relative stability rather than lack of interest. TRX is holding above its daily open, but without the sharp volatility seen in HYPE or the more sentiment driven movement in DOGE. That makes its current structure different. It is showing a slower, more orderly battle between buyers and sellers.
TRX remains closely watched due to its role in blockchain transfers, stablecoin activity, and the wider TRON ecosystem. When the asset trades within a contained range, market participants often watch for whether volume begins to rise before price expands. A narrow range can eventually lead to a stronger directional move, but direction should be confirmed by sustained market participation rather than assumed.
The broader market picture is clear. HYPE is leading on momentum and volatility. DOGE is showing a positive recovery but still needs stronger follow through. TRX is offering the most stable structure, with a modest gain and limited intraday fluctuations.
These three assets represent different styles of crypto market behavior. HYPE reflects higher beta participation and active volatility. DOGE reflects community driven liquidity and speculative attention. TRX reflects a steadier structure tied to its established ecosystem role. None of these signals guarantees what happens next, but each provides useful context for traders observing where capital, volume, and attention are moving.
$HYPE
$DOGE
$TRX
7
NEAR, UNI and ENA: Three Narratives, One Clear Lesson for the Market
The crypto market is not moving as one single story right now. NEAR, UNI, and ENA are showing three distinct structures that highlight where capital is becoming selective, where buyers are defending value, and where sellers still control the short term narrative. For traders and market observers, this is the type of environment where patience, liquidity, and confirmation matter more than excitement.
NEAR Protocol is trading around $3.176, up +0.16% from its 24 hour open of $3.171. During the same period, NEAR reached a high of $3.264 and a low of $3.105, producing a 5.12% trading range. The price is slightly above the open, which suggests that buyers are still present, but the move remains measured rather than explosive.
This is an important distinction. A token can trade positively without creating a full momentum breakout. NEAR is currently showing signs of balance, with buyers defending the lower part of the range while sellers remain active near the session high. That structure often reflects a market waiting for stronger direction from broader crypto sentiment, risk appetite, and volume expansion.
NEAR continues to attract attention because of its position in the Layer 1 ecosystem and its focus on scalable blockchain infrastructure. Market participants often watch assets like NEAR when the narrative around high performance networks, developer activity, artificial intelligence, and cross chain usability becomes more active. However, narrative strength alone is not enough to sustain price momentum. For NEAR, the key factor is whether demand can remain consistent when price tests the upper end of its current range.
Uniswap is trading around $5.161, up +0.47% from its 24 hour open of $5.137. UNI reached a high of $5.257 and a low of $5.033, creating a 4.45% daily range. Among the three assets, UNI is showing the strongest positive percentage performance in the latest session, although the difference remains modest.
UNI’s structure is relevant because it often reflects broader sentiment around decentralized finance. When market participants show growing confidence in onchain trading activity, liquidity protocols, and decentralized exchange usage, UNI can attract renewed attention. Its current position above the daily open indicates that buyers have maintained a slight advantage, but the market still needs more follow through to turn that strength into a more decisive trend.
The $5 area has remained an active zone in the latest session, with price holding above the daily low while attempting to maintain progress toward the high. This suggests that UNI is not simply moving on low liquidity. It is trading inside an area where both buyers and sellers are actively engaged. A healthy continuation would require sustained volume and an ability to hold gains rather than giving them back after short term rallies.
Ethena is trading around $0.1158, down -3.42% from its 24 hour open of $0.1199. ENA recorded a high of $0.1216 and a low of $0.1145, creating the widest range among the three assets at 6.20%. This makes ENA the most volatile asset in the group during the latest session.
ENA’s current structure shows that sellers have had the upper hand after price traded near the session high. The token is now closer to its daily low than its high, which indicates that the market has been unable to preserve early strength. This does not automatically define a long term direction, but it does show that short term sentiment is more fragile than it is for NEAR or UNI.
Ethena remains a closely watched DeFi asset because its ecosystem is connected to the fast growing conversation around synthetic dollars, stablecoin liquidity, yield mechanisms, and decentralized financial infrastructure. These narratives can drive strong attention when market conditions are favorable, but they can also increase volatility when liquidity becomes cautious. ENA’s wide daily range is a reminder that highly narrative driven assets can move rapidly in both directions.
The broader market message is clear. NEAR is showing stability with a modest positive bias. UNI is displaying slightly stronger relative momentum and holding above its daily open. ENA is experiencing more visible selling pressure and wider volatility. These are different market conditions, not a single unified trend.
For traders, the most useful approach is to monitor how each asset reacts around the edges of its current range. NEAR needs stronger participation to turn stability into momentum. UNI needs sustained demand to protect its positive move. ENA needs to demonstrate whether buyers can absorb the current selling pressure after a volatile session.
Strong markets are built through confirmation, not assumptions. Price action, volume, liquidity, and broader crypto sentiment will continue to shape the next phase for all three assets. Staying focused on the data can help traders avoid emotional decisions when volatility rises.
#NEARProtocol #Uniswap #Ethena #CryptoMarket #DeFi
$NEAR
{spot}(NEARUSDT)
$UNI
{spot}(UNIUSDT)
$ENA
{spot}(ENAUSDT)
NEAR, UNI and ENA: Three Narratives, One Clear Lesson for the Market
The crypto market is not moving as one single story right now. NEAR, UNI, and ENA are showing three distinct structures that highlight where capital is becoming selective, where buyers are defending value, and where sellers still control the short term narrative. For traders and market observers, this is the type of environment where patience, liquidity, and confirmation matter more than excitement.
NEAR Protocol is trading around $3.176, up +0.16% from its 24 hour open of $3.171. During the same period, NEAR reached a high of $3.264 and a low of $3.105, producing a 5.12% trading range. The price is slightly above the open, which suggests that buyers are still present, but the move remains measured rather than explosive.
This is an important distinction. A token can trade positively without creating a full momentum breakout. NEAR is currently showing signs of balance, with buyers defending the lower part of the range while sellers remain active near the session high. That structure often reflects a market waiting for stronger direction from broader crypto sentiment, risk appetite, and volume expansion.
NEAR continues to attract attention because of its position in the Layer 1 ecosystem and its focus on scalable blockchain infrastructure. Market participants often watch assets like NEAR when the narrative around high performance networks, developer activity, artificial intelligence, and cross chain usability becomes more active. However, narrative strength alone is not enough to sustain price momentum. For NEAR, the key factor is whether demand can remain consistent when price tests the upper end of its current range.
Uniswap is trading around $5.161, up +0.47% from its 24 hour open of $5.137. UNI reached a high of $5.257 and a low of $5.033, creating a 4.45% daily range. Among the three assets, UNI is showing the strongest positive percentage performance in the latest session, although the difference remains modest.
UNI’s structure is relevant because it often reflects broader sentiment around decentralized finance. When market participants show growing confidence in onchain trading activity, liquidity protocols, and decentralized exchange usage, UNI can attract renewed attention. Its current position above the daily open indicates that buyers have maintained a slight advantage, but the market still needs more follow through to turn that strength into a more decisive trend.
The $5 area has remained an active zone in the latest session, with price holding above the daily low while attempting to maintain progress toward the high. This suggests that UNI is not simply moving on low liquidity. It is trading inside an area where both buyers and sellers are actively engaged. A healthy continuation would require sustained volume and an ability to hold gains rather than giving them back after short term rallies.
Ethena is trading around $0.1158, down -3.42% from its 24 hour open of $0.1199. ENA recorded a high of $0.1216 and a low of $0.1145, creating the widest range among the three assets at 6.20%. This makes ENA the most volatile asset in the group during the latest session.
ENA’s current structure shows that sellers have had the upper hand after price traded near the session high. The token is now closer to its daily low than its high, which indicates that the market has been unable to preserve early strength. This does not automatically define a long term direction, but it does show that short term sentiment is more fragile than it is for NEAR or UNI.
Ethena remains a closely watched DeFi asset because its ecosystem is connected to the fast growing conversation around synthetic dollars, stablecoin liquidity, yield mechanisms, and decentralized financial infrastructure. These narratives can drive strong attention when market conditions are favorable, but they can also increase volatility when liquidity becomes cautious. ENA’s wide daily range is a reminder that highly narrative driven assets can move rapidly in both directions.
The broader market message is clear. NEAR is showing stability with a modest positive bias. UNI is displaying slightly stronger relative momentum and holding above its daily open. ENA is experiencing more visible selling pressure and wider volatility. These are different market conditions, not a single unified trend.
For traders, the most useful approach is to monitor how each asset reacts around the edges of its current range. NEAR needs stronger participation to turn stability into momentum. UNI needs sustained demand to protect its positive move. ENA needs to demonstrate whether buyers can absorb the current selling pressure after a volatile session.
Strong markets are built through confirmation, not assumptions. Price action, volume, liquidity, and broader crypto sentiment will continue to shape the next phase for all three assets. Staying focused on the data can help traders avoid emotional decisions when volatility rises.
#NEARProtocol #Uniswap #Ethena #CryptoMarket #DeFi
$NEAR
$UNI
$ENA
NEAR Protocol is trading around $3.176, up +0.16% from its 24 hour open of $3.171. During the same period, NEAR reached a high of $3.264 and a low of $3.105, producing a 5.12% trading range. The price is slightly above the open, which suggests that buyers are still present, but the move remains measured rather than explosive.
This is an important distinction. A token can trade positively without creating a full momentum breakout. NEAR is currently showing signs of balance, with buyers defending the lower part of the range while sellers remain active near the session high. That structure often reflects a market waiting for stronger direction from broader crypto sentiment, risk appetite, and volume expansion.
NEAR continues to attract attention because of its position in the Layer 1 ecosystem and its focus on scalable blockchain infrastructure. Market participants often watch assets like NEAR when the narrative around high performance networks, developer activity, artificial intelligence, and cross chain usability becomes more active. However, narrative strength alone is not enough to sustain price momentum. For NEAR, the key factor is whether demand can remain consistent when price tests the upper end of its current range.
Uniswap is trading around $5.161, up +0.47% from its 24 hour open of $5.137. UNI reached a high of $5.257 and a low of $5.033, creating a 4.45% daily range. Among the three assets, UNI is showing the strongest positive percentage performance in the latest session, although the difference remains modest.
UNI’s structure is relevant because it often reflects broader sentiment around decentralized finance. When market participants show growing confidence in onchain trading activity, liquidity protocols, and decentralized exchange usage, UNI can attract renewed attention. Its current position above the daily open indicates that buyers have maintained a slight advantage, but the market still needs more follow through to turn that strength into a more decisive trend.
The $5 area has remained an active zone in the latest session, with price holding above the daily low while attempting to maintain progress toward the high. This suggests that UNI is not simply moving on low liquidity. It is trading inside an area where both buyers and sellers are actively engaged. A healthy continuation would require sustained volume and an ability to hold gains rather than giving them back after short term rallies.
Ethena is trading around $0.1158, down -3.42% from its 24 hour open of $0.1199. ENA recorded a high of $0.1216 and a low of $0.1145, creating the widest range among the three assets at 6.20%. This makes ENA the most volatile asset in the group during the latest session.
ENA’s current structure shows that sellers have had the upper hand after price traded near the session high. The token is now closer to its daily low than its high, which indicates that the market has been unable to preserve early strength. This does not automatically define a long term direction, but it does show that short term sentiment is more fragile than it is for NEAR or UNI.
Ethena remains a closely watched DeFi asset because its ecosystem is connected to the fast growing conversation around synthetic dollars, stablecoin liquidity, yield mechanisms, and decentralized financial infrastructure. These narratives can drive strong attention when market conditions are favorable, but they can also increase volatility when liquidity becomes cautious. ENA’s wide daily range is a reminder that highly narrative driven assets can move rapidly in both directions.
The broader market message is clear. NEAR is showing stability with a modest positive bias. UNI is displaying slightly stronger relative momentum and holding above its daily open. ENA is experiencing more visible selling pressure and wider volatility. These are different market conditions, not a single unified trend.
For traders, the most useful approach is to monitor how each asset reacts around the edges of its current range. NEAR needs stronger participation to turn stability into momentum. UNI needs sustained demand to protect its positive move. ENA needs to demonstrate whether buyers can absorb the current selling pressure after a volatile session.
Strong markets are built through confirmation, not assumptions. Price action, volume, liquidity, and broader crypto sentiment will continue to shape the next phase for all three assets. Staying focused on the data can help traders avoid emotional decisions when volatility rises.
#NEARProtocol #Uniswap #Ethena #CryptoMarket #DeFi
$NEAR
$UNI
$ENA
1
13
SOL, ZEC and XRP: Three Different Market Narratives Emerging
The current market is showing three very different forms of price behavior across SOL, ZEC, and XRP. While all three remain highly liquid and widely watched assets, their latest trading structures reveal different momentum profiles, volatility conditions, and trader expectations. This is exactly the type of environment where disciplined market observation matters more than chasing every move.
Solana is trading around $71.82, unchanged over the latest 24 hour period. During that window, SOL reached a high of $72.95 and a low of $69.93, creating a 4.20% trading range. The lack of net movement does not mean SOL is inactive. Instead, it suggests a balance between buying interest near the lower part of the range and selling pressure as price approaches the upper area.
SOL remains one of the most closely monitored large cap altcoins because of its strong ecosystem visibility, active trading community, and role in broader high beta crypto sentiment. When SOL starts to expand from a tight range with rising participation, the move can often attract substantial attention. At the moment, however, the market is still waiting for clearer direction. The key signal is whether price can sustain demand beyond the current upper range rather than simply testing it and falling back.
For traders, SOL’s current structure highlights the importance of patience. A stable price near the daily open can be constructive if buyers continue defending lower levels, but it can also reflect hesitation if volume does not improve. The next meaningful move will likely depend on whether broader market liquidity strengthens and whether Solana can convert short term stability into renewed momentum.
ZEC is trading around $904.48, up +0.49% over the latest 24 hour window. It recorded a high of $918.98 and a low of $846.62, producing an 8.04% daily range. That makes ZEC the most volatile asset among the three in this session. The price is holding above its daily open of $900.09, which shows that buyers have retained a modest advantage, but the wide range also confirms that this market is moving with high intensity.
ZEC has historically attracted attention when privacy related narratives, low supply dynamics, and speculative momentum align. Its current range indicates that both sides of the market are actively engaged. Buyers have managed to push the asset above the opening level, while sellers have also been able to create meaningful intraday pullbacks. This type of price action can generate strong engagement because volatility brings opportunity, but it also increases risk significantly.
The most important factor for ZEC is whether price can remain stable after sharp intraday movements. A volatile market can continue higher, consolidate, or reverse quickly depending on liquidity and sentiment. Traders watching ZEC should focus on how price reacts after periods of expansion. Sustained demand following a sharp move may indicate stronger conviction, while repeated spikes followed by fast selling can signal that the market remains speculative and unstable.
XRP is trading near $0.9583, down -0.29% over the latest 24 hour period. The token reached a high of $0.9779 and a low of $0.9424, creating a 3.69% daily range. XRP is currently trading slightly below its daily open of $0.9611, showing a mild short term advantage for sellers. However, the move remains limited rather than aggressive, which suggests that the market is still searching for stronger directional conviction.
XRP continues to be watched closely due to its large community, strong liquidity, and frequent sensitivity to narrative driven sentiment. Its latest price structure is more defensive than ZEC’s and less volatile than SOL’s recent range behavior. The important question is whether XRP can regain the daily open and attract follow through, or whether continued selling keeps it under pressure near the lower part of the range.
The broader picture is clear. SOL is consolidating, ZEC is displaying the strongest volatility and modest positive momentum, while XRP is showing mild weakness but remains inside a controlled range. These differences matter because capital does not move evenly across the crypto market. Traders often look for assets where price, volume, and market attention begin to align. At the same time, high volatility can reverse quickly, especially when broader market conditions shift.
The strongest approach in a market like this is to watch confirmation rather than emotion. SOL needs a clearer expansion from its range, ZEC needs sustained stability after volatile swings, and XRP needs to show whether it can reclaim short term momentum. Every asset can produce opportunity, but every asset can also produce rapid downside when liquidity changes.
$SOL
{spot}(SOLUSDT)
$ZEC
{spot}(ZECUSDT)
$XRP
{spot}(XRPUSDT)
SOL, ZEC and XRP: Three Different Market Narratives Emerging
The current market is showing three very different forms of price behavior across SOL, ZEC, and XRP. While all three remain highly liquid and widely watched assets, their latest trading structures reveal different momentum profiles, volatility conditions, and trader expectations. This is exactly the type of environment where disciplined market observation matters more than chasing every move.
Solana is trading around $71.82, unchanged over the latest 24 hour period. During that window, SOL reached a high of $72.95 and a low of $69.93, creating a 4.20% trading range. The lack of net movement does not mean SOL is inactive. Instead, it suggests a balance between buying interest near the lower part of the range and selling pressure as price approaches the upper area.
SOL remains one of the most closely monitored large cap altcoins because of its strong ecosystem visibility, active trading community, and role in broader high beta crypto sentiment. When SOL starts to expand from a tight range with rising participation, the move can often attract substantial attention. At the moment, however, the market is still waiting for clearer direction. The key signal is whether price can sustain demand beyond the current upper range rather than simply testing it and falling back.
For traders, SOL’s current structure highlights the importance of patience. A stable price near the daily open can be constructive if buyers continue defending lower levels, but it can also reflect hesitation if volume does not improve. The next meaningful move will likely depend on whether broader market liquidity strengthens and whether Solana can convert short term stability into renewed momentum.
ZEC is trading around $904.48, up +0.49% over the latest 24 hour window. It recorded a high of $918.98 and a low of $846.62, producing an 8.04% daily range. That makes ZEC the most volatile asset among the three in this session. The price is holding above its daily open of $900.09, which shows that buyers have retained a modest advantage, but the wide range also confirms that this market is moving with high intensity.
ZEC has historically attracted attention when privacy related narratives, low supply dynamics, and speculative momentum align. Its current range indicates that both sides of the market are actively engaged. Buyers have managed to push the asset above the opening level, while sellers have also been able to create meaningful intraday pullbacks. This type of price action can generate strong engagement because volatility brings opportunity, but it also increases risk significantly.
The most important factor for ZEC is whether price can remain stable after sharp intraday movements. A volatile market can continue higher, consolidate, or reverse quickly depending on liquidity and sentiment. Traders watching ZEC should focus on how price reacts after periods of expansion. Sustained demand following a sharp move may indicate stronger conviction, while repeated spikes followed by fast selling can signal that the market remains speculative and unstable.
XRP is trading near $0.9583, down -0.29% over the latest 24 hour period. The token reached a high of $0.9779 and a low of $0.9424, creating a 3.69% daily range. XRP is currently trading slightly below its daily open of $0.9611, showing a mild short term advantage for sellers. However, the move remains limited rather than aggressive, which suggests that the market is still searching for stronger directional conviction.
XRP continues to be watched closely due to its large community, strong liquidity, and frequent sensitivity to narrative driven sentiment. Its latest price structure is more defensive than ZEC’s and less volatile than SOL’s recent range behavior. The important question is whether XRP can regain the daily open and attract follow through, or whether continued selling keeps it under pressure near the lower part of the range.
The broader picture is clear. SOL is consolidating, ZEC is displaying the strongest volatility and modest positive momentum, while XRP is showing mild weakness but remains inside a controlled range. These differences matter because capital does not move evenly across the crypto market. Traders often look for assets where price, volume, and market attention begin to align. At the same time, high volatility can reverse quickly, especially when broader market conditions shift.
The strongest approach in a market like this is to watch confirmation rather than emotion. SOL needs a clearer expansion from its range, ZEC needs sustained stability after volatile swings, and XRP needs to show whether it can reclaim short term momentum. Every asset can produce opportunity, but every asset can also produce rapid downside when liquidity changes.
$SOL
$ZEC
$XRP
Solana is trading around $71.82, unchanged over the latest 24 hour period. During that window, SOL reached a high of $72.95 and a low of $69.93, creating a 4.20% trading range. The lack of net movement does not mean SOL is inactive. Instead, it suggests a balance between buying interest near the lower part of the range and selling pressure as price approaches the upper area.
SOL remains one of the most closely monitored large cap altcoins because of its strong ecosystem visibility, active trading community, and role in broader high beta crypto sentiment. When SOL starts to expand from a tight range with rising participation, the move can often attract substantial attention. At the moment, however, the market is still waiting for clearer direction. The key signal is whether price can sustain demand beyond the current upper range rather than simply testing it and falling back.
For traders, SOL’s current structure highlights the importance of patience. A stable price near the daily open can be constructive if buyers continue defending lower levels, but it can also reflect hesitation if volume does not improve. The next meaningful move will likely depend on whether broader market liquidity strengthens and whether Solana can convert short term stability into renewed momentum.
ZEC is trading around $904.48, up +0.49% over the latest 24 hour window. It recorded a high of $918.98 and a low of $846.62, producing an 8.04% daily range. That makes ZEC the most volatile asset among the three in this session. The price is holding above its daily open of $900.09, which shows that buyers have retained a modest advantage, but the wide range also confirms that this market is moving with high intensity.
ZEC has historically attracted attention when privacy related narratives, low supply dynamics, and speculative momentum align. Its current range indicates that both sides of the market are actively engaged. Buyers have managed to push the asset above the opening level, while sellers have also been able to create meaningful intraday pullbacks. This type of price action can generate strong engagement because volatility brings opportunity, but it also increases risk significantly.
The most important factor for ZEC is whether price can remain stable after sharp intraday movements. A volatile market can continue higher, consolidate, or reverse quickly depending on liquidity and sentiment. Traders watching ZEC should focus on how price reacts after periods of expansion. Sustained demand following a sharp move may indicate stronger conviction, while repeated spikes followed by fast selling can signal that the market remains speculative and unstable.
XRP is trading near $0.9583, down -0.29% over the latest 24 hour period. The token reached a high of $0.9779 and a low of $0.9424, creating a 3.69% daily range. XRP is currently trading slightly below its daily open of $0.9611, showing a mild short term advantage for sellers. However, the move remains limited rather than aggressive, which suggests that the market is still searching for stronger directional conviction.
XRP continues to be watched closely due to its large community, strong liquidity, and frequent sensitivity to narrative driven sentiment. Its latest price structure is more defensive than ZEC’s and less volatile than SOL’s recent range behavior. The important question is whether XRP can regain the daily open and attract follow through, or whether continued selling keeps it under pressure near the lower part of the range.
The broader picture is clear. SOL is consolidating, ZEC is displaying the strongest volatility and modest positive momentum, while XRP is showing mild weakness but remains inside a controlled range. These differences matter because capital does not move evenly across the crypto market. Traders often look for assets where price, volume, and market attention begin to align. At the same time, high volatility can reverse quickly, especially when broader market conditions shift.
The strongest approach in a market like this is to watch confirmation rather than emotion. SOL needs a clearer expansion from its range, ZEC needs sustained stability after volatile swings, and XRP needs to show whether it can reclaim short term momentum. Every asset can produce opportunity, but every asset can also produce rapid downside when liquidity changes.
$SOL
$ZEC
$XRP
12
BTC, ETH and BNB Market Pulse: Strength Is Present, but Selectivity Matters
Bitcoin is trading around $65,184, up 0.29% in the latest 24 hour session after moving between $63,905 and $65,696. The price action shows that BTC is still attracting steady liquidity near the upper end of its daily range, but it has not yet delivered a decisive expansion beyond the session high. That matters because Bitcoin remains the market’s main risk gauge. When BTC holds firm and volatility stays controlled, capital often becomes more willing to rotate into large cap altcoins. When BTC loses momentum sharply, the wider market usually becomes more defensive.
For now, BTC is showing resilience rather than aggressive breakout behavior. Buyers have defended the lower part of the range, while the market is still testing whether demand can absorb supply closer to the high. This makes the current phase important for traders watching momentum, volume, and the reaction around intraday highs. A sustained push with improving participation could strengthen broader market confidence, while rejection near the range high may keep price action choppy.
Ethereum is trading near $1,823.62, up 0.31% in the latest 24 hour session, with a daily range between $1,787.11 and $1,866.89. ETH is holding a relatively stable structure, but it remains inside a broad intraday range where both buyers and sellers have been active. The move above the daily open shows some positive demand, yet the gap between the current price and the session high also highlights that the market is not moving in a straight line.
Ethereum continues to be one of the most important assets to watch when assessing whether capital is flowing beyond Bitcoin. Its liquidity, ecosystem activity, and position across decentralized finance, stablecoins, tokenization, and institutional infrastructure keep it central to the broader crypto market. If ETH can maintain stability while BTC remains constructive, market participants may view that as a healthier environment for selective altcoin activity. However, ETH also needs sustained demand to reclaim stronger momentum, especially after testing both sides of its daily range.
BNB is trading around $593.33, up 0.10% in the latest 24 hour session. It traded between $583.81 and $598.42, showing a tight but active range. BNB’s ability to remain close to its daily open suggests balanced market conditions rather than a strong directional move. The asset is holding relatively steady while the market evaluates whether demand can push it back toward the top of the current range.
BNB is often watched differently from BTC and ETH because its market behavior can also reflect activity across the Binance ecosystem, including spot participation, trading activity, and BNB Chain usage. A stable BNB structure can be viewed as a sign of contained volatility, but traders should still watch whether volume increases as price approaches the upper range. Without stronger participation, short term moves can remain limited and vulnerable to broader market sentiment.
The key takeaway is that BTC, ETH, and BNB are all trading slightly above their daily opens, which points to a cautiously constructive tone across major crypto assets. BTC is leading with resilience, ETH is holding an important liquidity zone, and BNB is maintaining stability near the middle to upper portion of its session range. This is not a market environment that rewards blind excitement. It is a market that rewards patience, risk control, and attention to confirmation.
For traders, the real focus should be on whether Bitcoin can maintain its strength without sudden volatility, whether Ethereum can attract stronger follow through, and whether BNB can break out of its narrow range with higher activity. Large cap assets often set the direction for the rest of the market, so monitoring their behavior can provide useful context before reacting to moves in smaller and more volatile tokens.
Crypto markets can change quickly. Manage risk carefully, avoid emotional decisions, and treat every move as a probability rather than a certainty.
#Bitcoin #Ethereum #BNB #CryptoMarket #Binance
$BTC
{spot}(BTCUSDT)
$ETH
{spot}(ETHUSDT)
$BNB
{spot}(BNBUSDT)
BTC, ETH and BNB Market Pulse: Strength Is Present, but Selectivity Matters
Bitcoin is trading around $65,184, up 0.29% in the latest 24 hour session after moving between $63,905 and $65,696. The price action shows that BTC is still attracting steady liquidity near the upper end of its daily range, but it has not yet delivered a decisive expansion beyond the session high. That matters because Bitcoin remains the market’s main risk gauge. When BTC holds firm and volatility stays controlled, capital often becomes more willing to rotate into large cap altcoins. When BTC loses momentum sharply, the wider market usually becomes more defensive.
For now, BTC is showing resilience rather than aggressive breakout behavior. Buyers have defended the lower part of the range, while the market is still testing whether demand can absorb supply closer to the high. This makes the current phase important for traders watching momentum, volume, and the reaction around intraday highs. A sustained push with improving participation could strengthen broader market confidence, while rejection near the range high may keep price action choppy.
Ethereum is trading near $1,823.62, up 0.31% in the latest 24 hour session, with a daily range between $1,787.11 and $1,866.89. ETH is holding a relatively stable structure, but it remains inside a broad intraday range where both buyers and sellers have been active. The move above the daily open shows some positive demand, yet the gap between the current price and the session high also highlights that the market is not moving in a straight line.
Ethereum continues to be one of the most important assets to watch when assessing whether capital is flowing beyond Bitcoin. Its liquidity, ecosystem activity, and position across decentralized finance, stablecoins, tokenization, and institutional infrastructure keep it central to the broader crypto market. If ETH can maintain stability while BTC remains constructive, market participants may view that as a healthier environment for selective altcoin activity. However, ETH also needs sustained demand to reclaim stronger momentum, especially after testing both sides of its daily range.
BNB is trading around $593.33, up 0.10% in the latest 24 hour session. It traded between $583.81 and $598.42, showing a tight but active range. BNB’s ability to remain close to its daily open suggests balanced market conditions rather than a strong directional move. The asset is holding relatively steady while the market evaluates whether demand can push it back toward the top of the current range.
BNB is often watched differently from BTC and ETH because its market behavior can also reflect activity across the Binance ecosystem, including spot participation, trading activity, and BNB Chain usage. A stable BNB structure can be viewed as a sign of contained volatility, but traders should still watch whether volume increases as price approaches the upper range. Without stronger participation, short term moves can remain limited and vulnerable to broader market sentiment.
The key takeaway is that BTC, ETH, and BNB are all trading slightly above their daily opens, which points to a cautiously constructive tone across major crypto assets. BTC is leading with resilience, ETH is holding an important liquidity zone, and BNB is maintaining stability near the middle to upper portion of its session range. This is not a market environment that rewards blind excitement. It is a market that rewards patience, risk control, and attention to confirmation.
For traders, the real focus should be on whether Bitcoin can maintain its strength without sudden volatility, whether Ethereum can attract stronger follow through, and whether BNB can break out of its narrow range with higher activity. Large cap assets often set the direction for the rest of the market, so monitoring their behavior can provide useful context before reacting to moves in smaller and more volatile tokens.
Crypto markets can change quickly. Manage risk carefully, avoid emotional decisions, and treat every move as a probability rather than a certainty.
#Bitcoin #Ethereum #BNB #CryptoMarket #Binance
$BTC
$ETH
$BNB
For now, BTC is showing resilience rather than aggressive breakout behavior. Buyers have defended the lower part of the range, while the market is still testing whether demand can absorb supply closer to the high. This makes the current phase important for traders watching momentum, volume, and the reaction around intraday highs. A sustained push with improving participation could strengthen broader market confidence, while rejection near the range high may keep price action choppy.
Ethereum is trading near $1,823.62, up 0.31% in the latest 24 hour session, with a daily range between $1,787.11 and $1,866.89. ETH is holding a relatively stable structure, but it remains inside a broad intraday range where both buyers and sellers have been active. The move above the daily open shows some positive demand, yet the gap between the current price and the session high also highlights that the market is not moving in a straight line.
Ethereum continues to be one of the most important assets to watch when assessing whether capital is flowing beyond Bitcoin. Its liquidity, ecosystem activity, and position across decentralized finance, stablecoins, tokenization, and institutional infrastructure keep it central to the broader crypto market. If ETH can maintain stability while BTC remains constructive, market participants may view that as a healthier environment for selective altcoin activity. However, ETH also needs sustained demand to reclaim stronger momentum, especially after testing both sides of its daily range.
BNB is trading around $593.33, up 0.10% in the latest 24 hour session. It traded between $583.81 and $598.42, showing a tight but active range. BNB’s ability to remain close to its daily open suggests balanced market conditions rather than a strong directional move. The asset is holding relatively steady while the market evaluates whether demand can push it back toward the top of the current range.
BNB is often watched differently from BTC and ETH because its market behavior can also reflect activity across the Binance ecosystem, including spot participation, trading activity, and BNB Chain usage. A stable BNB structure can be viewed as a sign of contained volatility, but traders should still watch whether volume increases as price approaches the upper range. Without stronger participation, short term moves can remain limited and vulnerable to broader market sentiment.
The key takeaway is that BTC, ETH, and BNB are all trading slightly above their daily opens, which points to a cautiously constructive tone across major crypto assets. BTC is leading with resilience, ETH is holding an important liquidity zone, and BNB is maintaining stability near the middle to upper portion of its session range. This is not a market environment that rewards blind excitement. It is a market that rewards patience, risk control, and attention to confirmation.
For traders, the real focus should be on whether Bitcoin can maintain its strength without sudden volatility, whether Ethereum can attract stronger follow through, and whether BNB can break out of its narrow range with higher activity. Large cap assets often set the direction for the rest of the market, so monitoring their behavior can provide useful context before reacting to moves in smaller and more volatile tokens.
Crypto markets can change quickly. Manage risk carefully, avoid emotional decisions, and treat every move as a probability rather than a certainty.
#Bitcoin #Ethereum #BNB #CryptoMarket #Binance
$BTC
$ETH
$BNB
1
12
Quant Market Outlook: QNT Holding Steady Near Key Moving Averages
Quant is currently trading at 155.10 USDT, reflecting a solid 24-hour gain of 7.05% with a daily range between 144.77 and 159.12. The 24-hour trading volume stands at 40,928.56 QNT, equivalent to approximately 6.33M USDT.
Looking at the technical indicators on the chart, the price is consolidating tightly around the moving averages, with MA(7) at 155.92, MA(25) at 154.62, and MA(99) at 156.96. This compression following the recent bounce from the 140.05 low points toward a potential continuation pattern as the market builds momentum for its next move.
#Quant #QNT #CryptoTrading #BinanceSquare #TechnicalAnalysis
$QNT
{spot}(QNTUSDT)
Quant Market Outlook: QNT Holding Steady Near Key Moving Averages
Quant is currently trading at 155.10 USDT, reflecting a solid 24-hour gain of 7.05% with a daily range between 144.77 and 159.12. The 24-hour trading volume stands at 40,928.56 QNT, equivalent to approximately 6.33M USDT.
Looking at the technical indicators on the chart, the price is consolidating tightly around the moving averages, with MA(7) at 155.92, MA(25) at 154.62, and MA(99) at 156.96. This compression following the recent bounce from the 140.05 low points toward a potential continuation pattern as the market builds momentum for its next move.
#Quant #QNT #CryptoTrading #BinanceSquare #TechnicalAnalysis
$QNT
Quant is currently trading at 155.10 USDT, reflecting a solid 24-hour gain of 7.05% with a daily range between 144.77 and 159.12. The 24-hour trading volume stands at 40,928.56 QNT, equivalent to approximately 6.33M USDT.
Looking at the technical indicators on the chart, the price is consolidating tightly around the moving averages, with MA(7) at 155.92, MA(25) at 154.62, and MA(99) at 156.96. This compression following the recent bounce from the 140.05 low points toward a potential continuation pattern as the market builds momentum for its next move.
#Quant #QNT #CryptoTrading #BinanceSquare #TechnicalAnalysis
$QNT
6
Sui (SUI) Struggles Under Resistance: Can Buyers Take Control?
$SUI is trading around $0.7202, up roughly 1.24% on the day, but the chart shows a market that is still moving sideways. After pushing up to $0.7401, price met selling pressure and has since slipped back into a tight range, with trading volume fading along the way.
Price is now sitting just below the short-term moving averages, and the longer-term trend is still pointing down. The nearest support is the 24h low around $0.7106. If that gives way, the $0.6759 swing low could come into play. On the upside, buyers first need to reclaim $0.7257, and the major hurdle sits near $0.7629, where the long-term average is overhead.
A bullish move is not confirmed yet. I’d want to see stronger volume, a clean push back above the nearby resistance, and follow-through on the lower timeframes before trusting a recovery. Until then, $0.7106 is the level to watch.
#SUI #Sui #CryptoAnalysis #TechnicalAnalysis #Altcoins
$SUI
{spot}(SUIUSDT)
Sui (SUI) Struggles Under Resistance: Can Buyers Take Control?
$SUI is trading around $0.7202, up roughly 1.24% on the day, but the chart shows a market that is still moving sideways. After pushing up to $0.7401, price met selling pressure and has since slipped back into a tight range, with trading volume fading along the way.
Price is now sitting just below the short-term moving averages, and the longer-term trend is still pointing down. The nearest support is the 24h low around $0.7106. If that gives way, the $0.6759 swing low could come into play. On the upside, buyers first need to reclaim $0.7257, and the major hurdle sits near $0.7629, where the long-term average is overhead.
A bullish move is not confirmed yet. I’d want to see stronger volume, a clean push back above the nearby resistance, and follow-through on the lower timeframes before trusting a recovery. Until then, $0.7106 is the level to watch.
#SUI #Sui #CryptoAnalysis #TechnicalAnalysis #Altcoins
$SUI
$SUI is trading around $0.7202, up roughly 1.24% on the day, but the chart shows a market that is still moving sideways. After pushing up to $0.7401, price met selling pressure and has since slipped back into a tight range, with trading volume fading along the way.
Price is now sitting just below the short-term moving averages, and the longer-term trend is still pointing down. The nearest support is the 24h low around $0.7106. If that gives way, the $0.6759 swing low could come into play. On the upside, buyers first need to reclaim $0.7257, and the major hurdle sits near $0.7629, where the long-term average is overhead.
A bullish move is not confirmed yet. I’d want to see stronger volume, a clean push back above the nearby resistance, and follow-through on the lower timeframes before trusting a recovery. Until then, $0.7106 is the level to watch.
#SUI #Sui #CryptoAnalysis #TechnicalAnalysis #Altcoins
$SUI
7
Hyperliquid (HYPE) Is Stuck Below Resistance: Is a Breakout Close?
$HYPE is trading around $66.26, up roughly 1.5% on the day, but the chart shows a market that still can’t pick a direction. After pushing up to $69.05, price met selling pressure and has since been drifting sideways to slightly lower, with trading volume fading along the way.
Price is now sitting below the short-term moving averages, and the longer-term trend is still pointing down. The nearest support is the 24h low around $65.19. If that gives way, the $62.42 swing low could come into play. On the upside, buyers first need to reclaim $67.14, and the major hurdle sits near $69, where the long-term average is overhead.
A bullish move is not confirmed yet. I’d want to see stronger volume, a clean push back above the nearby resistance, and follow-through on the lower timeframes before trusting a recovery. Until then, $65.19 is the level to watch.
#HYPE #Hyperliquid #CryptoAnalysis #TechnicalAnalysis #Altcoins
$HYPE
{spot}(HYPEUSDT)
Hyperliquid (HYPE) Is Stuck Below Resistance: Is a Breakout Close?
$HYPE is trading around $66.26, up roughly 1.5% on the day, but the chart shows a market that still can’t pick a direction. After pushing up to $69.05, price met selling pressure and has since been drifting sideways to slightly lower, with trading volume fading along the way.
Price is now sitting below the short-term moving averages, and the longer-term trend is still pointing down. The nearest support is the 24h low around $65.19. If that gives way, the $62.42 swing low could come into play. On the upside, buyers first need to reclaim $67.14, and the major hurdle sits near $69, where the long-term average is overhead.
A bullish move is not confirmed yet. I’d want to see stronger volume, a clean push back above the nearby resistance, and follow-through on the lower timeframes before trusting a recovery. Until then, $65.19 is the level to watch.
#HYPE #Hyperliquid #CryptoAnalysis #TechnicalAnalysis #Altcoins
$HYPE
$HYPE is trading around $66.26, up roughly 1.5% on the day, but the chart shows a market that still can’t pick a direction. After pushing up to $69.05, price met selling pressure and has since been drifting sideways to slightly lower, with trading volume fading along the way.
Price is now sitting below the short-term moving averages, and the longer-term trend is still pointing down. The nearest support is the 24h low around $65.19. If that gives way, the $62.42 swing low could come into play. On the upside, buyers first need to reclaim $67.14, and the major hurdle sits near $69, where the long-term average is overhead.
A bullish move is not confirmed yet. I’d want to see stronger volume, a clean push back above the nearby resistance, and follow-through on the lower timeframes before trusting a recovery. Until then, $65.19 is the level to watch.
#HYPE #Hyperliquid #CryptoAnalysis #TechnicalAnalysis #Altcoins
$HYPE
8
Filecoin (FIL) at a Make-or-Break Level: Is a Reversal Taking Shape?
$FIL is still under pressure, having slipped roughly 6% as the wider crypto market sold off. Current market reports suggest the drop is mostly a reflection of overall weakness, not any negative news specific to Filecoin.
Even so, the weekly chart still shows a bearish structure, with price printing lower highs and lower lows. FIL is now moving toward a key support zone near $0.42, which also lines up with the descending trendline. If buyers can defend this area, a relief bounce could follow, and it might even mark the start of a bigger recovery. The first major resistance sits at $1.23 to $1.30, where earlier rallies ran into heavy selling.
For now, a bullish reversal remains unconfirmed. To turn constructive, I’d want to see strong buying pressure, a break of the current lower-high structure, and confirmation on the lower timeframes. If support fails, further downside is still on the table. Until then, $0.42 is the level that matters most.
#FIL #Filecoin #CryptoAnalysis #TechnicalAnalysis #Altcoins
$FIL
{spot}(FILUSDT)
Filecoin (FIL) at a Make-or-Break Level: Is a Reversal Taking Shape?
$FIL is still under pressure, having slipped roughly 6% as the wider crypto market sold off. Current market reports suggest the drop is mostly a reflection of overall weakness, not any negative news specific to Filecoin.
Even so, the weekly chart still shows a bearish structure, with price printing lower highs and lower lows. FIL is now moving toward a key support zone near $0.42, which also lines up with the descending trendline. If buyers can defend this area, a relief bounce could follow, and it might even mark the start of a bigger recovery. The first major resistance sits at $1.23 to $1.30, where earlier rallies ran into heavy selling.
For now, a bullish reversal remains unconfirmed. To turn constructive, I’d want to see strong buying pressure, a break of the current lower-high structure, and confirmation on the lower timeframes. If support fails, further downside is still on the table. Until then, $0.42 is the level that matters most.
#FIL #Filecoin #CryptoAnalysis #TechnicalAnalysis #Altcoins
$FIL
$FIL is still under pressure, having slipped roughly 6% as the wider crypto market sold off. Current market reports suggest the drop is mostly a reflection of overall weakness, not any negative news specific to Filecoin.
Even so, the weekly chart still shows a bearish structure, with price printing lower highs and lower lows. FIL is now moving toward a key support zone near $0.42, which also lines up with the descending trendline. If buyers can defend this area, a relief bounce could follow, and it might even mark the start of a bigger recovery. The first major resistance sits at $1.23 to $1.30, where earlier rallies ran into heavy selling.
For now, a bullish reversal remains unconfirmed. To turn constructive, I’d want to see strong buying pressure, a break of the current lower-high structure, and confirmation on the lower timeframes. If support fails, further downside is still on the table. Until then, $0.42 is the level that matters most.
#FIL #Filecoin #CryptoAnalysis #TechnicalAnalysis #Altcoins
$FIL
1
18
RARE/USDT Explodes 61% in a Day: Can the Breakout Hold?
SuperRare (RARE) just had one of the strongest sessions on the board. The price is trading at $0.01355, up 61.50% in 24 hours, after spending most of the previous day drifting quietly near the lows.
On the 1H chart, price sat in a tight range around $0.00826 before a single massive green candle sent it vertically to a 24h high of $0.01632. The 24h low was $0.00837. The volume spike on that candle dwarfs everything else on the chart, which points to a sudden surge of buying interest rather than a gradual build-up.
After the peak, price pulled back and has since been building a base. It is now consolidating between roughly $0.0115 and $0.0150, forming a series of higher lows. That is a healthy sign after such a sharp move.
Here is how the moving averages look:
MA(7): 0.01301: price is trading just above it, so short-term momentum is still positive.
MA(25): 0.01117: well below price and rising, which supports the new uptrend.
MA(99): 0.00990: the long-term average has started to curve upward, a early sign the trend may be turning.
24h stats: 1.20B RARE traded, roughly 16.02M USDT in volume. That is strong participation for a move of this size.
Levels to watch: Support sits around $0.0114, with $0.0112 (near the MA(25)) as the next safety net. On the upside, $0.0150 is the first resistance, and a clean break above it could bring the $0.01632 high back into play.
After a gain this large, pullbacks are normal and chasing green candles is rarely a good idea. I’d rather wait for a retest of support or a confirmed breakout than buy into the heat. Manage your risk and do your own research.
This is not financial advice.
#RARE #SuperRare #CryptoTrading #TechnicalAnalysis #Binance
$RARE
{spot}(RAREUSDT)
RARE/USDT Explodes 61% in a Day: Can the Breakout Hold?
SuperRare (RARE) just had one of the strongest sessions on the board. The price is trading at $0.01355, up 61.50% in 24 hours, after spending most of the previous day drifting quietly near the lows.
On the 1H chart, price sat in a tight range around $0.00826 before a single massive green candle sent it vertically to a 24h high of $0.01632. The 24h low was $0.00837. The volume spike on that candle dwarfs everything else on the chart, which points to a sudden surge of buying interest rather than a gradual build-up.
After the peak, price pulled back and has since been building a base. It is now consolidating between roughly $0.0115 and $0.0150, forming a series of higher lows. That is a healthy sign after such a sharp move.
Here is how the moving averages look:
MA(7): 0.01301: price is trading just above it, so short-term momentum is still positive.
MA(25): 0.01117: well below price and rising, which supports the new uptrend.
MA(99): 0.00990: the long-term average has started to curve upward, a early sign the trend may be turning.
24h stats: 1.20B RARE traded, roughly 16.02M USDT in volume. That is strong participation for a move of this size.
Levels to watch: Support sits around $0.0114, with $0.0112 (near the MA(25)) as the next safety net. On the upside, $0.0150 is the first resistance, and a clean break above it could bring the $0.01632 high back into play.
After a gain this large, pullbacks are normal and chasing green candles is rarely a good idea. I’d rather wait for a retest of support or a confirmed breakout than buy into the heat. Manage your risk and do your own research.
This is not financial advice.
#RARE #SuperRare #CryptoTrading #TechnicalAnalysis #Binance
$RARE
SuperRare (RARE) just had one of the strongest sessions on the board. The price is trading at $0.01355, up 61.50% in 24 hours, after spending most of the previous day drifting quietly near the lows.
On the 1H chart, price sat in a tight range around $0.00826 before a single massive green candle sent it vertically to a 24h high of $0.01632. The 24h low was $0.00837. The volume spike on that candle dwarfs everything else on the chart, which points to a sudden surge of buying interest rather than a gradual build-up.
After the peak, price pulled back and has since been building a base. It is now consolidating between roughly $0.0115 and $0.0150, forming a series of higher lows. That is a healthy sign after such a sharp move.
Here is how the moving averages look:
MA(7): 0.01301: price is trading just above it, so short-term momentum is still positive.
MA(25): 0.01117: well below price and rising, which supports the new uptrend.
MA(99): 0.00990: the long-term average has started to curve upward, a early sign the trend may be turning.
24h stats: 1.20B RARE traded, roughly 16.02M USDT in volume. That is strong participation for a move of this size.
Levels to watch: Support sits around $0.0114, with $0.0112 (near the MA(25)) as the next safety net. On the upside, $0.0150 is the first resistance, and a clean break above it could bring the $0.01632 high back into play.
After a gain this large, pullbacks are normal and chasing green candles is rarely a good idea. I’d rather wait for a retest of support or a confirmed breakout than buy into the heat. Manage your risk and do your own research.
This is not financial advice.
#RARE #SuperRare #CryptoTrading #TechnicalAnalysis #Binance
$RARE
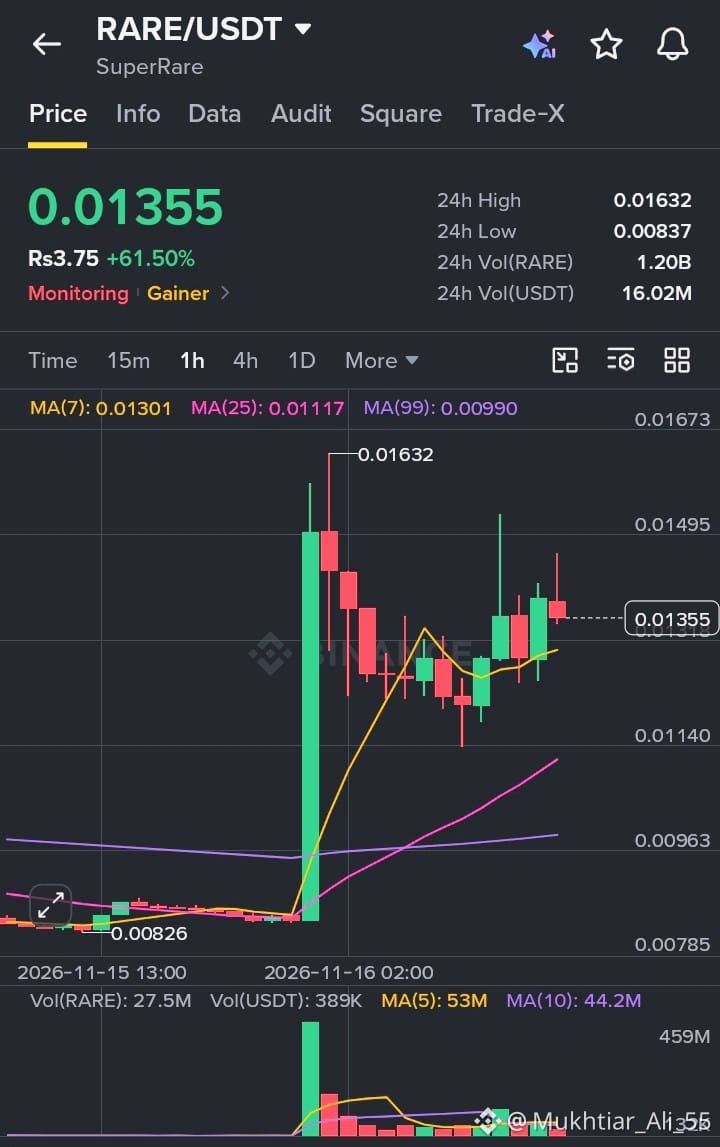
1
XAUT/USDT Rejected at the 99-Day Average: Gold Holds Its Ground
Tether Gold (XAUT) is trading at $3,844.79, up 0.63% on the day. It’s a quieter session than the headline move suggests, with a lot happening underneath.
On the 1H chart, price pushed up to a 24h high of $3,883.36 and was rejected almost immediately. A sharp pullback followed, with a red candle dragging price down toward $3,813.58 (the 24h low) before buyers stepped back in. The recovery has been steady, and price is now back near the middle of the day’s range.
Here is how the moving averages are lining up:
MA(7): 3,847.46: price is sitting just under it, so short-term momentum is flat.
MA(25): 3,839.42: price is holding above it, which keeps the near-term structure intact.
MA(99): 3,862.16: still sloping down overhead and acting as resistance. This is where the rally stalled.
24h stats: 5,743.89 XAUT traded, roughly 22.08M USDT in volume. The heaviest volume came on the push to the high, which suggests sellers were active at that level.
Levels to watch: Support sits around $3,827, with $3,810 as the lower floor from the recent swing low. On the upside, a clean hourly close above $3,862 would be the first sign of strength, with $3,883 as the next test.
Gold-backed assets tend to move slowly compared with the rest of the crypto market, so I’d rather wait for a confirmed break of this range than force a trade inside it. Manage your risk and do your own research.
This is not financial advice.
#XAUT #TetherGold #GoldTrading #TechnicalAnalysis #Binance
$XAUT
{spot}(XAUTUSDT)
XAUT/USDT Rejected at the 99-Day Average: Gold Holds Its Ground
Tether Gold (XAUT) is trading at $3,844.79, up 0.63% on the day. It’s a quieter session than the headline move suggests, with a lot happening underneath.
On the 1H chart, price pushed up to a 24h high of $3,883.36 and was rejected almost immediately. A sharp pullback followed, with a red candle dragging price down toward $3,813.58 (the 24h low) before buyers stepped back in. The recovery has been steady, and price is now back near the middle of the day’s range.
Here is how the moving averages are lining up:
MA(7): 3,847.46: price is sitting just under it, so short-term momentum is flat.
MA(25): 3,839.42: price is holding above it, which keeps the near-term structure intact.
MA(99): 3,862.16: still sloping down overhead and acting as resistance. This is where the rally stalled.
24h stats: 5,743.89 XAUT traded, roughly 22.08M USDT in volume. The heaviest volume came on the push to the high, which suggests sellers were active at that level.
Levels to watch: Support sits around $3,827, with $3,810 as the lower floor from the recent swing low. On the upside, a clean hourly close above $3,862 would be the first sign of strength, with $3,883 as the next test.
Gold-backed assets tend to move slowly compared with the rest of the crypto market, so I’d rather wait for a confirmed break of this range than force a trade inside it. Manage your risk and do your own research.
This is not financial advice.
#XAUT #TetherGold #GoldTrading #TechnicalAnalysis #Binance
$XAUT
Tether Gold (XAUT) is trading at $3,844.79, up 0.63% on the day. It’s a quieter session than the headline move suggests, with a lot happening underneath.
On the 1H chart, price pushed up to a 24h high of $3,883.36 and was rejected almost immediately. A sharp pullback followed, with a red candle dragging price down toward $3,813.58 (the 24h low) before buyers stepped back in. The recovery has been steady, and price is now back near the middle of the day’s range.
Here is how the moving averages are lining up:
MA(7): 3,847.46: price is sitting just under it, so short-term momentum is flat.
MA(25): 3,839.42: price is holding above it, which keeps the near-term structure intact.
MA(99): 3,862.16: still sloping down overhead and acting as resistance. This is where the rally stalled.
24h stats: 5,743.89 XAUT traded, roughly 22.08M USDT in volume. The heaviest volume came on the push to the high, which suggests sellers were active at that level.
Levels to watch: Support sits around $3,827, with $3,810 as the lower floor from the recent swing low. On the upside, a clean hourly close above $3,862 would be the first sign of strength, with $3,883 as the next test.
Gold-backed assets tend to move slowly compared with the rest of the crypto market, so I’d rather wait for a confirmed break of this range than force a trade inside it. Manage your risk and do your own research.
This is not financial advice.
#XAUT #TetherGold #GoldTrading #TechnicalAnalysis #Binance
$XAUT
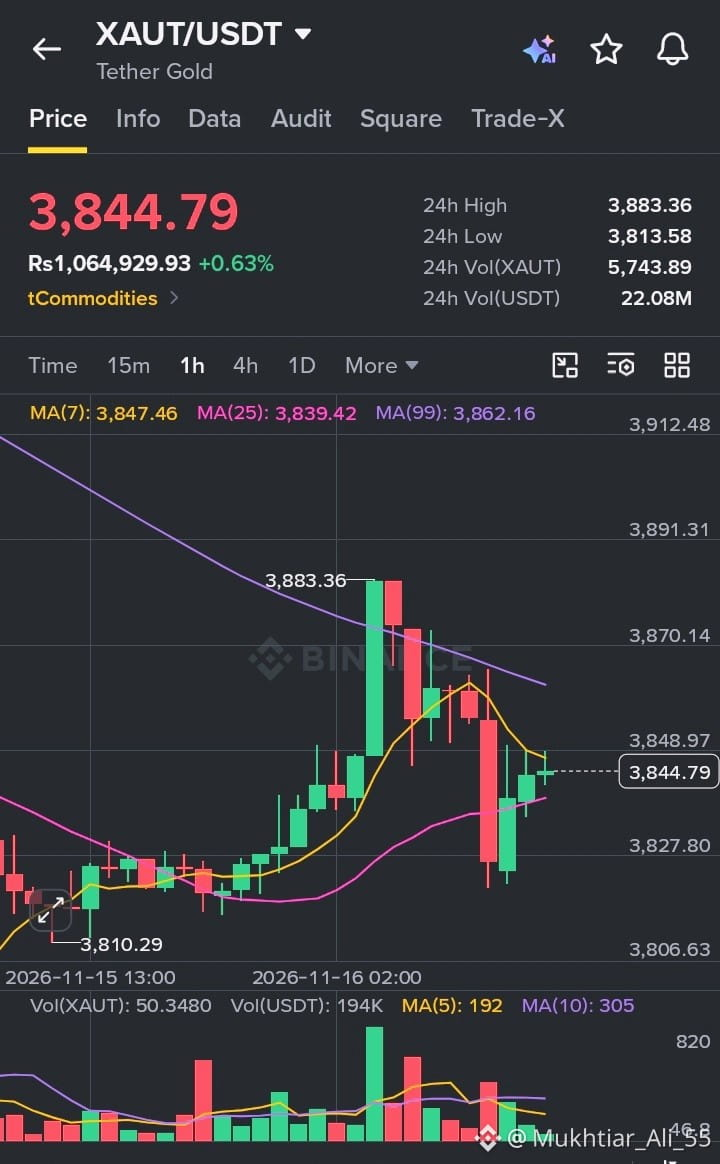
1
36
Войдите, чтобы посмотреть больше материала
Присоединяйтесь к пользователям криптовалют по всему миру на Binance Square
⚡️ Получайте новейшую и полезную информацию о криптоактивах.
💬 Нам доверяет крупнейшая в мире криптобиржа.
👍 Получите достоверные аналитические данные от верифицированных создателей контента.
Эл. почта/номер телефона
В тренде
A Packed Week of Earnings and Data Tests Markets
Просмотров: 62,252
395 обсуждают
Nvidia, Anthropic і ФРС. Три тести за один тиждень
Nick_Invest
·Лайков: 3
·Просмотров: 1.3k
AnthropicIPOTestsInvestorAppetiteForAI
Просмотров: 116,406
1,353 обсуждают
BitcoinExtendsLosingStreakToSixWeeks
Просмотров: 90,421
719 обсуждают