cryptoanalysisupdate

Просмотров: 239,924
751 обсуждают
Gena Woodbeck rXvd raja Hassan
·
--
BTC/USDT Perp 1h Technical Outlook - 83,945.60 (+0.36%) Mark Price: 83,945.6 | 24h High: 84,340.20 | 24h Low: 82,916.7 24h Vol: 87,100.868 BTC / 7.29B USDT Chart Breakdown: Price bounced strongly from 82,981.70 support as marked with green line. 17 Bars, 17h, Vol 78.74k recovery to 84,340.20 high. Now holding above 83,945. Technical Insights: SAR(0.02, 0.2) at 83,350.23 is well below current price - strong bullish trend confirmed. RSI(6) at 54.80 is above 50 and moving towards 60 - healthy bullish momentum. MACD: DIF 231.65, DEA 212.94, MACD 18.71 - positive histogram, bullish crossover active. Volume: Vol(BTC) 4.1K, MA(5) 4.95K, MA(10) 4.04K - volume increasing on up move. Key Levels: Support: 83,462.72 / 83,350.23 / 82,981.70 Resistance: 84,091.81 / 84,340.20 Hold above 83,462 keeps uptrend intact. Break above 84,340 opens next upside. BTC/USDT Perp 1h Technical Outlook - 83,945.60 (+0.36%) Mark: 83,945.6 | High: 84,340.20 | Low: 82,916.7 Vol: 87,100.868 BTC / 7.29B USDT | Ask 83,945.70 Bid 83,945.60 Chart Breakdown: Strong bounce from 82,981.70 support as marked. 17 Bars, 17h, Vol 78.74k recovery to 84,340.20 high. Price now holding above 83,945. Technical Insights: SAR(0.02,0.2) at 83,350.23 below price - strong bullish trend active. RSI(6) at 54.80 above 50 moving to 60 - healthy momentum. MACD DIF 231.65, DEA 212.94, MACD 18.71 - bullish crossover, buyers in control. Volume: Vol(BTC) 4.1K, MA(5) 4.95K, MA(10) 4.04K - volume spike on breakout confirms interest. Key Levels: Support: 83,462.72 / 83,350.23 / 82,981.70 Resistance: 84,091.81 / 84,340.20 Hold above 83,462 keeps uptrend intact. Break above 84,340 opens next leg. {future}(BTCUSDT) #BTCUSDT #BTC #Bitcoin #BinanceSquare #CryptoAnalysisUpdate
BTC/USDT Perp 1h Technical Outlook - 83,945.60 (+0.36%)

Mark Price: 83,945.6 | 24h High: 84,340.20 | 24h Low: 82,916.7
24h Vol: 87,100.868 BTC / 7.29B USDT

Chart Breakdown:
Price bounced strongly from 82,981.70 support as marked with green line. 17 Bars, 17h, Vol 78.74k recovery to 84,340.20 high. Now holding above 83,945.

Technical Insights:
SAR(0.02, 0.2) at 83,350.23 is well below current price - strong bullish trend confirmed.
RSI(6) at 54.80 is above 50 and moving towards 60 - healthy bullish momentum.
MACD: DIF 231.65, DEA 212.94, MACD 18.71 - positive histogram, bullish crossover active.

Volume: Vol(BTC) 4.1K, MA(5) 4.95K, MA(10) 4.04K - volume increasing on up move.

Key Levels:
Support: 83,462.72 / 83,350.23 / 82,981.70
Resistance: 84,091.81 / 84,340.20
Hold above 83,462 keeps uptrend intact. Break above 84,340 opens next upside.
BTC/USDT Perp 1h Technical Outlook - 83,945.60 (+0.36%)

Mark: 83,945.6 | High: 84,340.20 | Low: 82,916.7
Vol: 87,100.868 BTC / 7.29B USDT | Ask 83,945.70 Bid 83,945.60

Chart Breakdown:
Strong bounce from 82,981.70 support as marked. 17 Bars, 17h, Vol 78.74k recovery to 84,340.20 high. Price now holding above 83,945.

Technical Insights:
SAR(0.02,0.2) at 83,350.23 below price - strong bullish trend active.
RSI(6) at 54.80 above 50 moving to 60 - healthy momentum.
MACD DIF 231.65, DEA 212.94, MACD 18.71 - bullish crossover, buyers in control.

Volume: Vol(BTC) 4.1K, MA(5) 4.95K, MA(10) 4.04K - volume spike on breakout confirms interest.

Key Levels:
Support: 83,462.72 / 83,350.23 / 82,981.70
Resistance: 84,091.81 / 84,340.20
Hold above 83,462 keeps uptrend intact. Break above 84,340 opens next leg.


#BTCUSDT #BTC #Bitcoin #BinanceSquare #CryptoAnalysisUpdate
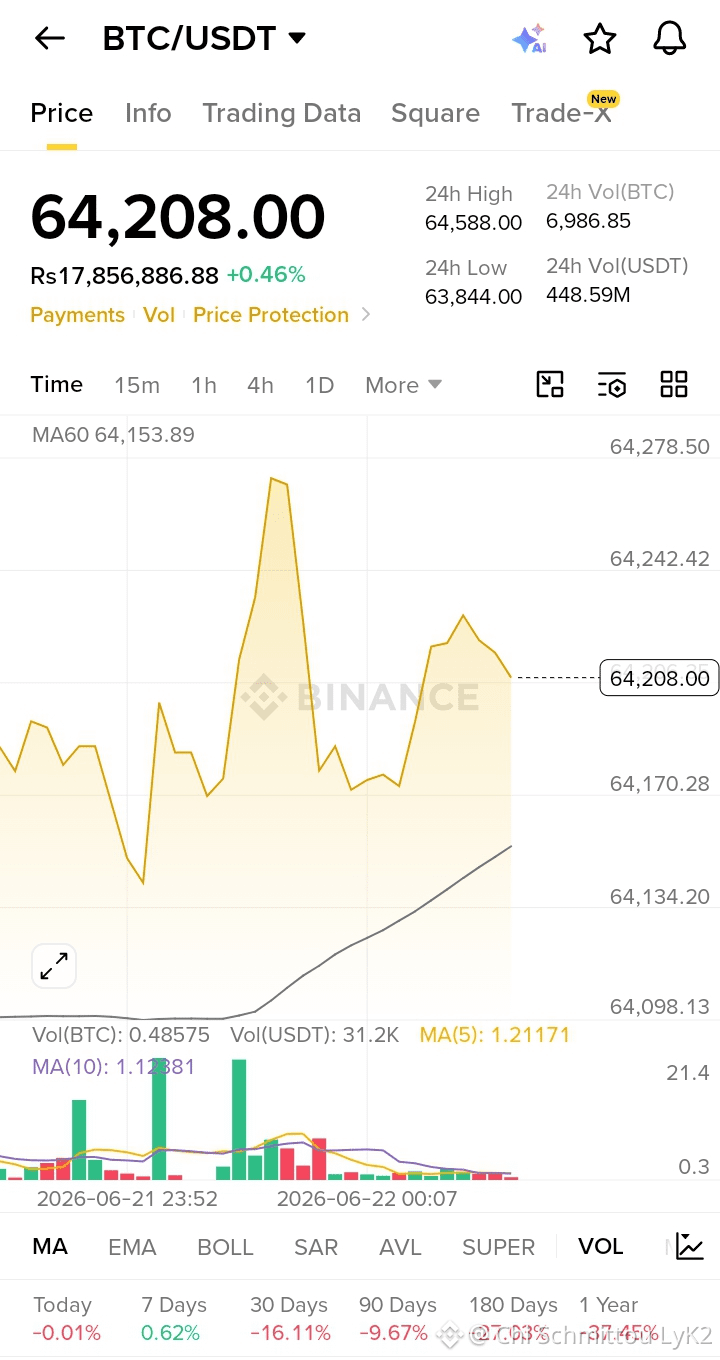
$NVDAB BTC/USDT Market Update | 22 June 2026, 00:09 PKT* *Coin*: Bitcoin $BTC *Current Price*: $64,208.00 (+0.46% 24h) *Trend*: Bullish / Above MA60 *Key Levels* *Support*: $64,153 - MA60 support + $64,134 - demand zone *Resistance*: $64,242 - local supply + $64,588 - 24h high. Flip $64,588 = $65K next *Trader Insight*: BTC holding $64,208 after rejection from $64,278, still trading above MA60 at $64,153. MA5/MA10 above MA60 keeps structure bullish, but volume is thin at 0.48 BTC = consolidation. Buyers defending MA60 is key. Hold $64,153 and we test $64,242 again. Break below MA60 opens $64,134 then $63,844. No chase - wait for volume confirmation. Not financial advice. Trade the plan, not the candle. #Bitcoin❗ #BTCUSDT! #CryptoAnalysisUpdate #SupportLevels
$NVDAB BTC/USDT Market Update | 22 June 2026, 00:09 PKT*

*Coin*: Bitcoin $BTC
*Current Price*: $64,208.00 (+0.46% 24h)
*Trend*: Bullish / Above MA60

*Key Levels*
*Support*: $64,153 - MA60 support + $64,134 - demand zone
*Resistance*: $64,242 - local supply + $64,588 - 24h high. Flip $64,588 = $65K next

*Trader Insight*:
BTC holding $64,208 after rejection from $64,278, still trading above MA60 at $64,153. MA5/MA10 above MA60 keeps structure bullish, but volume is thin at 0.48 BTC = consolidation. Buyers defending MA60 is key. Hold $64,153 and we test $64,242 again. Break below MA60 opens $64,134 then $63,844. No chase - wait for volume confirmation.

Not financial advice. Trade the plan, not the candle.

#Bitcoin❗ #BTCUSDT! #CryptoAnalysisUpdate #SupportLevels
🔥 $BTC BTC — UP OR DOWN FROM HERE? MY HONEST ANALYSIS Everyone's asking the same question. Here's what the data says 👇 📍 Current Price: ~$73,500 😰 Fear & Greed Index: 22 — EXTREME FEAR The 50-day moving average is falling, suggesting a weakening short-term trend. The 200-day moving average has also been falling since May 25 — indicating a weak longer-term trend too. (bloomingbit) That's the bearish case. Now here's the other side 👇 📈 The Bullish Case Technical analysis suggests BTC could increase 6% and hit $81,500 by end of May — with institutional demand and improving macro sentiment supporting a stronger rally. (Intellectia.AI) This week's predicted range sits between $74,235 and $81,899 — meaning a 10%+ move to the upside is possible before June. (CoinDesk) 📉 The Bearish Case Polymarket shows an 82% chance BTC hits $65,000 this year. ETF outflows, US-Iran tensions, hot inflation data, and leveraged long liquidations continue to weigh heavily on price. (bloomingbit) ⚖️ My Read: Bullish signals: ✅ $73K holding as strong support ✅ Institutions still buying dips quietly ✅ Post-halving supply squeeze ongoing Bearish signals: 🔴 ETF outflows not stopping yet 🔴 200-day MA turning down 🔴 Macro uncertainty still high Bottom line: Expect a summer dip before BTC picks back up in August–September — then a potential run to new all-time highs by end of 2026. (KuCoin) Short term: cautious. Long term: still bullish. 🎯 Are you buying this dip or waiting for lower? Drop your target 👇 #Bitcoin #BTC #CryptoAnalysisUpdate #CryptoWolf_MM #Binance ⚠️ Not financial advice. DYOR.
🔥 $BTC BTC — UP OR DOWN FROM HERE? MY HONEST ANALYSIS
Everyone's asking the same question. Here's what the data says 👇
📍 Current Price: ~$73,500
😰 Fear & Greed Index: 22 — EXTREME FEAR
The 50-day moving average is falling, suggesting a weakening short-term trend. The 200-day moving average has also been falling since May 25 — indicating a weak longer-term trend too. (bloomingbit)
That's the bearish case. Now here's the other side 👇
📈 The Bullish Case
Technical analysis suggests BTC could increase 6% and hit $81,500 by end of May — with institutional demand and improving macro sentiment supporting a stronger rally. (Intellectia.AI)
This week's predicted range sits between $74,235 and $81,899 — meaning a 10%+ move to the upside is possible before June. (CoinDesk)
📉 The Bearish Case
Polymarket shows an 82% chance BTC hits $65,000 this year. ETF outflows, US-Iran tensions, hot inflation data, and leveraged long liquidations continue to weigh heavily on price. (bloomingbit)
⚖️ My Read:
Bullish signals:
✅ $73K holding as strong support
✅ Institutions still buying dips quietly
✅ Post-halving supply squeeze ongoing
Bearish signals:
🔴 ETF outflows not stopping yet
🔴 200-day MA turning down
🔴 Macro uncertainty still high
Bottom line:
Expect a summer dip before BTC picks back up in August–September — then a potential run to new all-time highs by end of 2026. (KuCoin)
Short term: cautious. Long term: still bullish. 🎯
Are you buying this dip or waiting for lower?
Drop your target 👇
#Bitcoin #BTC #CryptoAnalysisUpdate #CryptoWolf_MM #Binance
⚠️ Not financial advice. DYOR.
$AVAX BUYERS, HERE'S YOUR PLAN! 📍 Buy Zone: $8.00–$8.10 🎯 Target: $11–$12 🛑 Risk Level: Below $7.80 💎 New Buyers: Consider gradual entries. 📈 Existing Holders: Monitor your target and protect your profits. 🔥 Strong institutional news could support further upside! #AVAX #Avalanche #CryptoAnalysisUpdate #BinanceSquare {spot}(AVAXUSDT)

$AVAX BUYERS, HERE'S YOUR PLAN!
📍 Buy Zone: $8.00–$8.10 🎯 Target: $11–$12 🛑 Risk Level: Below $7.80
💎 New Buyers: Consider gradual entries. 📈 Existing Holders: Monitor your target and protect your profits.
🔥 Strong institutional news could support further upside!
#AVAX #Avalanche #CryptoAnalysisUpdate #BinanceSquare

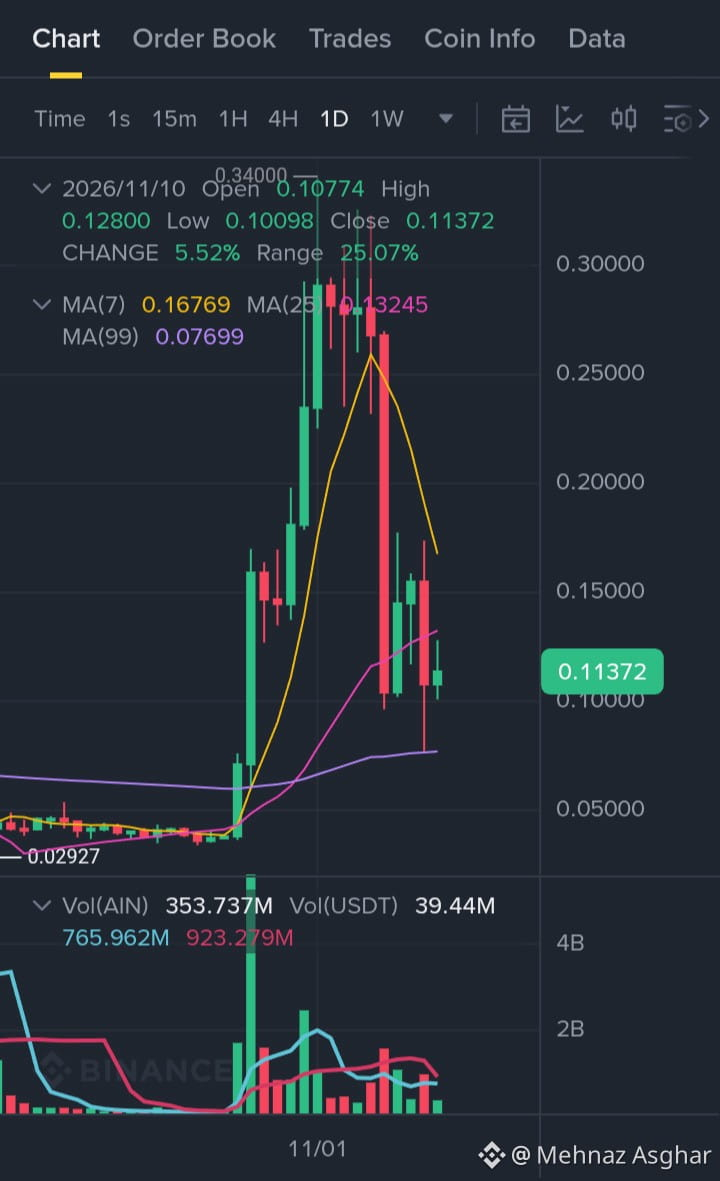
📊 $AIN USDT – REAL CHART ANALYSIS {future}(AINUSDT) 🔥 $AIN shows a small daily recovery, but the bigger trend still needs confirmation! Chart timeframe: 1D Closing price: 0.11372 USDT Daily change: +5.52% 📈 KEY LEVELS 🟢 Support: 0.10098 🔴 Resistance 1: 0.12800 🔴 Resistance 2: 0.13245 🚀 Major resistance: 0.16769 MOVING AVERAGES MA7: 0.16769 MA25: 0.13245 MA99: 0.07699 🎯 TRADING PLAN 🟢 Bullish confirmation: Daily close above 0.13245. 🔴 Bearish warning: Daily close below 0.10098. ⚠️ No confirmed breakout yet. Avoid entering just because of one green candle. Question: Can AIN reclaim the 0.13245 level? #AIN #AINUSDT #InfinityGround #CryptoAnalysisUpdate #Binance
📊 $AIN USDT – REAL CHART ANALYSIS

🔥 $AIN shows a small daily recovery, but the bigger trend still needs confirmation!

Chart timeframe: 1D
Closing price: 0.11372 USDT
Daily change: +5.52%

📈 KEY LEVELS
🟢 Support: 0.10098
🔴 Resistance 1: 0.12800
🔴 Resistance 2: 0.13245
🚀 Major resistance: 0.16769

MOVING AVERAGES
MA7: 0.16769
MA25: 0.13245
MA99: 0.07699

🎯 TRADING PLAN
🟢 Bullish confirmation: Daily close above 0.13245.
🔴 Bearish warning: Daily close below 0.10098.

⚠️ No confirmed breakout yet. Avoid entering just because of one green candle.

Question:
Can AIN reclaim the 0.13245 level?

#AIN #AINUSDT #InfinityGround #CryptoAnalysisUpdate #Binance

·
--
Падение
🚨 TRUMP COIN: CAN BUYERS DEFEND THE $1.11 SUPPORT? $TRUMP {future}(TRUMPUSDT) OFFICIAL TRUMP ($TRUMP) is trading around $1.12, with selling pressure continuing across the market. 📊 Market Snapshot • Current Price: $1.12 • 24H Change: -4.16% • 7D Change: -31% • Trend: Bearish • Support: $1.11 • Resistance: $1.18 🎯 Potential LONG Setup Entry: $1.18–$1.20 (after confirmed breakout and retest) TP1: $1.23 TP2: $1.28 TP3: $1.35 🛑 Stop Loss: $1.10 📈 Bullish Trigger: A breakout above $1.18 could create room for a recovery. 📉 Bearish Risk: Losing $1.11 could expose lower price levels. MY VIEW: TRUMP needs strong buying volume to reverse its current trend. Patience is essential — don't chase a speculative bounce. 💬 Can TRUMP reclaim $1.20, or will sellers push it below $1.10? #TRUMP #OfficialTrump #TRUMPUSDT #memecoin🚀🚀🚀 #CryptoAnalysisUpdate #TechnicalAnalysis #CryptoAnalysisUpdate #BinanceSquare ⚠️ High-risk meme coin. Trading levels are conditional, not guaranteed. Always manage risk.

🚨 TRUMP COIN: CAN BUYERS DEFEND THE $1.11 SUPPORT?
$TRUMP

OFFICIAL TRUMP ($TRUMP ) is trading around $1.12, with selling pressure continuing across the market.

📊 Market Snapshot
• Current Price: $1.12
• 24H Change: -4.16%
• 7D Change: -31%
• Trend: Bearish
• Support: $1.11
• Resistance: $1.18

🎯 Potential LONG Setup
Entry: $1.18–$1.20 (after confirmed breakout and retest)

TP1: $1.23
TP2: $1.28
TP3: $1.35

🛑 Stop Loss: $1.10

📈 Bullish Trigger: A breakout above $1.18 could create room for a recovery.

📉 Bearish Risk: Losing $1.11 could expose lower price levels.

MY VIEW: TRUMP needs strong buying volume to reverse its current trend. Patience is essential — don't chase a speculative bounce.

💬 Can TRUMP reclaim $1.20, or will sellers push it below $1.10?

#TRUMP #OfficialTrump #TRUMPUSDT #memecoin🚀🚀🚀 #CryptoAnalysisUpdate #TechnicalAnalysis #CryptoAnalysisUpdate #BinanceSquare

⚠️ High-risk meme coin. Trading levels are conditional, not guaranteed. Always manage risk.
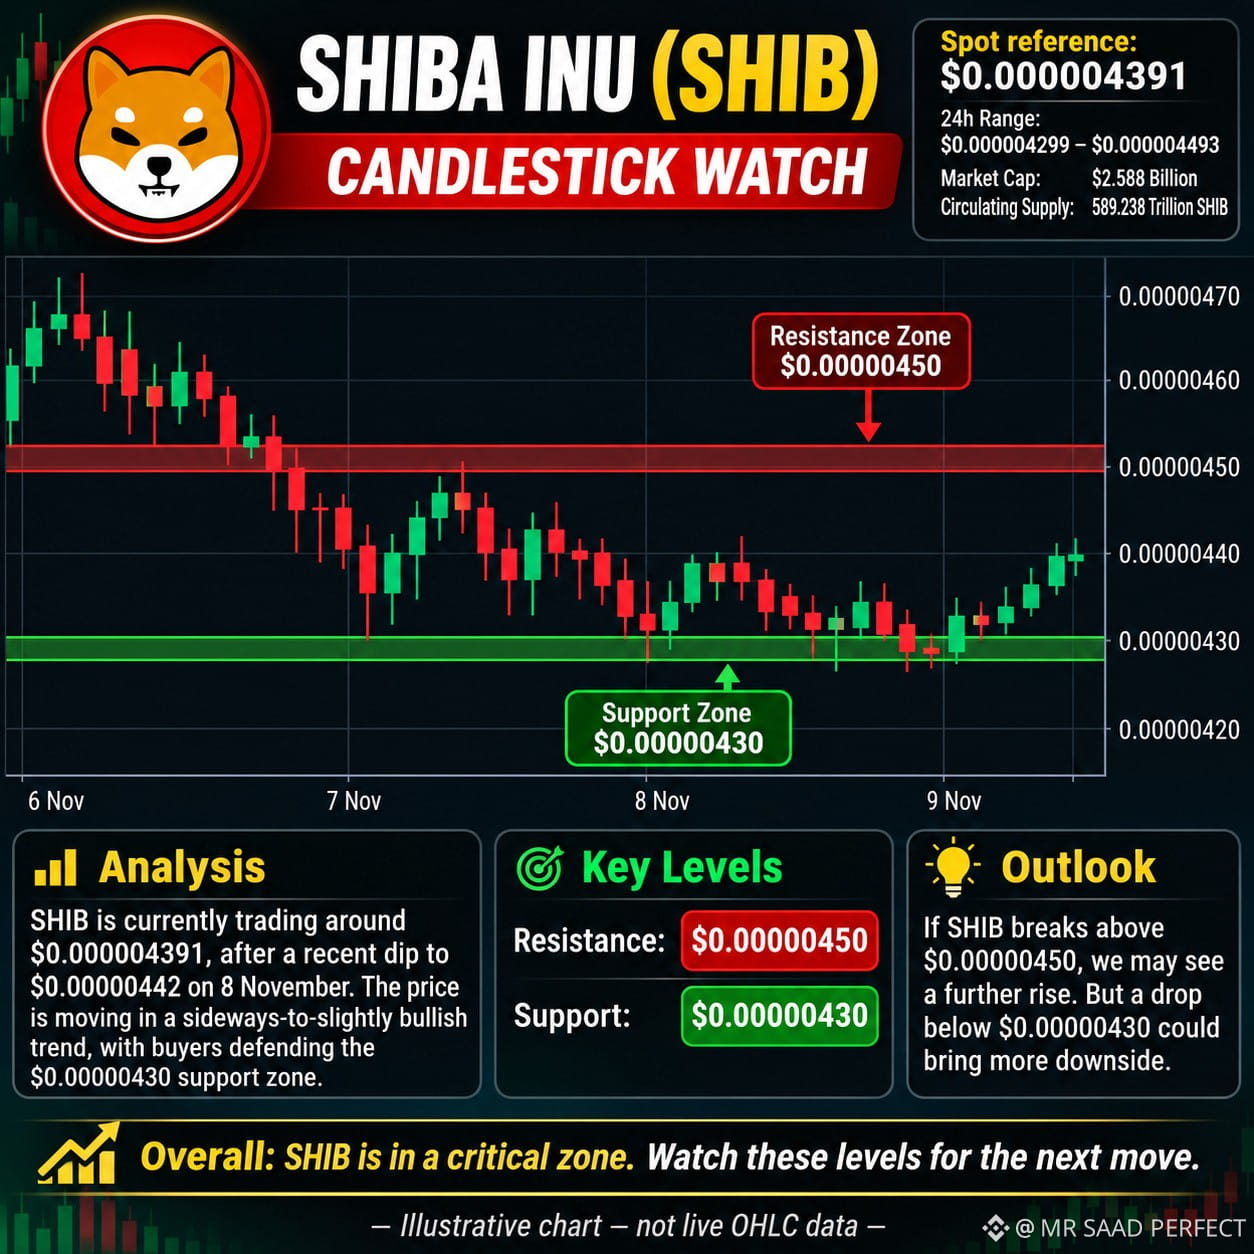
🐕 $SHIB {spot}(SHIBUSDT) INU ($SHIB ) – Market Analysis Shiba Inu is currently trading around $0.000004391. SHIB is showing signs of consolidation after recent selling pressure. Key Resistance: $0.00000450 Key Support: $0.00000430 📈 A breakout above resistance could open the door to further gains. 📉 A breakdown below support may bring additional selling pressure. My Outlook: SHIB is at an important price level. Watch volume and Bitcoin's direction before making any trading decision. ⚠️ High volatility. Always manage your risk. DYOR. #SHIB #Shibainuholder #CryptoAnalysisUpdate #CryptoTrading

🐕 $SHIB
INU ($SHIB ) – Market Analysis

Shiba Inu is currently trading around $0.000004391. SHIB is showing signs of consolidation after recent selling pressure.

Key Resistance: $0.00000450

Key Support: $0.00000430

📈 A breakout above resistance could open the door to further gains.

📉 A breakdown below support may bring additional selling pressure.

My Outlook: SHIB is at an important price level. Watch volume and Bitcoin's direction before making any trading decision.

⚠️ High volatility. Always manage your risk. DYOR.

#SHIB #Shibainuholder #CryptoAnalysisUpdate #CryptoTrading
🚀 $AIN (AInalyst) – Trading Signal #03 📅 November 8, 2026 📊 Market Analysis Current Price: ~$0.00003035 Market Cap: ~$30.3K 24H Volume: ~$18.60 🔍 Technical Outlook: $AIN is trading near its reported historical low. This area deserves attention, but a strong bullish reversal is not confirmed yet. 🎯 Trading Plan 🟢 Entry: Only after a confirmed breakout above $0.00003100 with increased volume. 🎯 TP1: 0.00003200 🎯 TP2: 0.00003300 🎯 TP3: 0.00003400 🛑 Stop Loss: Below the breakout retest low. 📈 Bullish Confirmation: A sustained move above resistance with stronger buying volume could improve the short-term outlook. ⚠️ Risk Management: AIN has extremely low trading volume. Avoid large positions and check liquidity before placing any order. 💎 No FOMO. No blind entries. Trade with confirmation! #AIN #AInalyst #AltcoinTradingStrategy #CryptoAnalysisUpdate
🚀 $AIN (AInalyst) – Trading Signal #03

📅 November 8, 2026

📊 Market Analysis

Current Price: ~$0.00003035
Market Cap: ~$30.3K
24H Volume: ~$18.60

🔍 Technical Outlook:
$AIN is trading near its reported historical low. This area deserves attention, but a strong bullish reversal is not confirmed yet.

🎯 Trading Plan

🟢 Entry: Only after a confirmed breakout above $0.00003100 with increased volume.

🎯 TP1: 0.00003200
🎯 TP2: 0.00003300
🎯 TP3: 0.00003400

🛑 Stop Loss: Below the breakout retest low.

📈 Bullish Confirmation:
A sustained move above resistance with stronger buying volume could improve the short-term outlook.

⚠️ Risk Management:
AIN has extremely low trading volume. Avoid large positions and check liquidity before placing any order.

💎 No FOMO. No blind entries. Trade with confirmation!

#AIN #AInalyst #AltcoinTradingStrategy #CryptoAnalysisUpdate
📊 BNB Market Update – November 8, 2026 🟢 Current Market Situation: Slightly Bullish My Analysis: $BNB is showing a small positive movement in the short term. However, its current price remains significantly below its previous all-time high. Market Outlook: $BNB needs stronger buying momentum to confirm a sustained recovery. #Binance #BNB #CryptoAnalysisUpdate
📊 BNB Market Update – November 8, 2026

🟢 Current Market Situation: Slightly Bullish

My Analysis:

$BNB is showing a small positive movement in the short term. However, its current price remains significantly below its previous all-time high.

Market Outlook: $BNB needs stronger buying momentum to confirm a sustained recovery.
#Binance #BNB #CryptoAnalysisUpdate
أهلاً بكم يا شباب في بينانس سكوير! العيون كلها تترقب حركة SOL التي تتحرك قرب مستويات $95.50 وسط تداولات حذرة. هل هي مجرد استراحة محارب قبل معاودة الصعود، أم أن هناك فخاً للمشترين؟ دعونا نكتشف السر في النقاط التالية: ​🔍 ما الذي يخبرنا به الشارت؟ ​منطقة المغناطيس السعري (الدعم الحرج): العملة تختبر باحة قوية بين $89 - $91. هبوط السعر إلى هذه المنطقة واجه عمليات شراء سريعة، مما يعني أن "الحيتان" تدافع بشراسة عن هذا الخط لئلا ينهار السعر نحو أعماق جديدة. ​جدار المقاومة العنيد: لكي نشهد "الإنفجار السعري" الموعود، يجب على SOL أولاً كسر واختراق نطاق المقاومة القريب عند $98 - $100. أي إغلاق يومي فوق هذا الحاجز سيعيد الزخم الإيجابي بقوة نحو الأهداف العليا. ​🎯 السيناريوهات المحتملة: ​1. سيناريو الانفجار والصعود (🟢): ارتداد قوي من الدعم الحالي مع دخول سيولة جديدة واختراق حاجز $100 يستهدف مباشرة مناطق $110 ثم $124. ​2. سيناريو الحذر وجني الأرباح (🔴): فشل الثبات فوق $90 قد يفتح الباب لموجة هبوط سريعة نحو اختبار مستويات سيولة أدنى قرب $80. ​💡 سؤال للجميع: هل ستقوم بتعزيز محفظتك عند هذه الأسعار أم تفضل الانتظار حتى يتضح الاتجاه؟ شاركنا توقعاتك في التعليقات! 👇 ​#SolanaStrong #CryptoAnalysisUpdate #BinanceSquareFamily #تداول $SOL {future}(SOLUSDT)

أهلاً بكم يا شباب في بينانس سكوير! العيون كلها تترقب حركة SOL التي تتحرك قرب مستويات $95.50 وسط تداولات حذرة. هل هي مجرد استراحة محارب قبل معاودة الصعود، أم أن هناك فخاً للمشترين؟ دعونا نكتشف السر في النقاط التالية:
​🔍 ما الذي يخبرنا به الشارت؟
​منطقة المغناطيس السعري (الدعم الحرج):
العملة تختبر باحة قوية بين $89 - $91. هبوط السعر إلى هذه المنطقة واجه عمليات شراء سريعة، مما يعني أن "الحيتان" تدافع بشراسة عن هذا الخط لئلا ينهار السعر نحو أعماق جديدة.
​جدار المقاومة العنيد:
لكي نشهد "الإنفجار السعري" الموعود، يجب على SOL أولاً كسر واختراق نطاق المقاومة القريب عند $98 - $100. أي إغلاق يومي فوق هذا الحاجز سيعيد الزخم الإيجابي بقوة نحو الأهداف العليا.
​🎯 السيناريوهات المحتملة:
​1. سيناريو الانفجار والصعود (🟢):
ارتداد قوي من الدعم الحالي مع دخول سيولة جديدة واختراق حاجز $100 يستهدف مباشرة مناطق $110 ثم $124.
​2. سيناريو الحذر وجني الأرباح (🔴):
فشل الثبات فوق $90 قد يفتح الباب لموجة هبوط سريعة نحو اختبار مستويات سيولة أدنى قرب $80.
​💡 سؤال للجميع: هل ستقوم بتعزيز محفظتك عند هذه الأسعار أم تفضل الانتظار حتى يتضح الاتجاه؟ شاركنا توقعاتك في التعليقات! 👇
​#SolanaStrong #CryptoAnalysisUpdate #BinanceSquareFamily #تداول $SOL
ABO3ZAM:
حياك الله يا درغام، فعلاً منطقة الدعم بين 89 و91 دولار هي الفيصل، وإذا ثبتنا فوق 100 دولار بنشوف انفجار سعري محترم نحو 124 🎯
📊 NOVEMBER CRYPTO MARKET OUTLOOK Two major coins I'm watching closely: $BTC Watching $82,920 for a bullish breakout. $ETH Watching $2,490 for confirmation. Institutional inflows are returning, but geopolitical risks and Fed policy remain important. Which one will outperform? #ETH #Bitcoin #Ethereum #CryptoAnalysisUpdate

📊 NOVEMBER CRYPTO MARKET OUTLOOK
Two major coins I'm watching closely:

$BTC Watching $82,920 for a bullish breakout.
$ETH Watching $2,490 for confirmation.
Institutional inflows are returning, but geopolitical risks and Fed policy remain important.

Which one will outperform?

#ETH #Bitcoin #Ethereum #CryptoAnalysisUpdate
🚨 BITCOIN MARKET UPDATE | NOVEMBER 3, 2026 🚨 $BTC is facing selling pressure and currently trading around the $76,600–$76,800 zone. 📊 Technical Analysis 🔹 Key Support: $76,200 🔹 Next Support: $74,900 🔹 Immediate Resistance: $77,250 🔹 Major Resistance: $78,100 📉 Market Outlook $BTC remains under short-term pressure. A strong move above $77,250 could support a recovery, while a breakdown below $76,200 may expose lower support levels. 💡 My View: Stay patient, manage your risk, and avoid emotional trading. Wait for confirmation before making any trading decisions. 🔥 What do you think? Will Bitcoin recover towards $80,000 or fall below $75,000? Share your opinion in the comments! #CryptoAnalys #CryptoAnalysis" #CryptoAnalysisUpdate #CryptoAnalysis📈📉🐋📅🚀
🚨 BITCOIN MARKET UPDATE | NOVEMBER 3, 2026 🚨
$BTC is facing selling pressure and currently trading around the $76,600–$76,800 zone.
📊 Technical Analysis
🔹 Key Support: $76,200
🔹 Next Support: $74,900
🔹 Immediate Resistance: $77,250
🔹 Major Resistance: $78,100
📉 Market Outlook
$BTC remains under short-term pressure. A strong move above $77,250 could support a recovery, while a breakdown below $76,200 may expose lower support levels.
💡 My View:
Stay patient, manage your risk, and avoid emotional trading. Wait for confirmation before making any trading decisions.
🔥 What do you think?
Will Bitcoin recover towards $80,000 or fall below $75,000?
Share your opinion in the comments!
#CryptoAnalys #CryptoAnalysis" #CryptoAnalysisUpdate #CryptoAnalysis📈📉🐋📅🚀
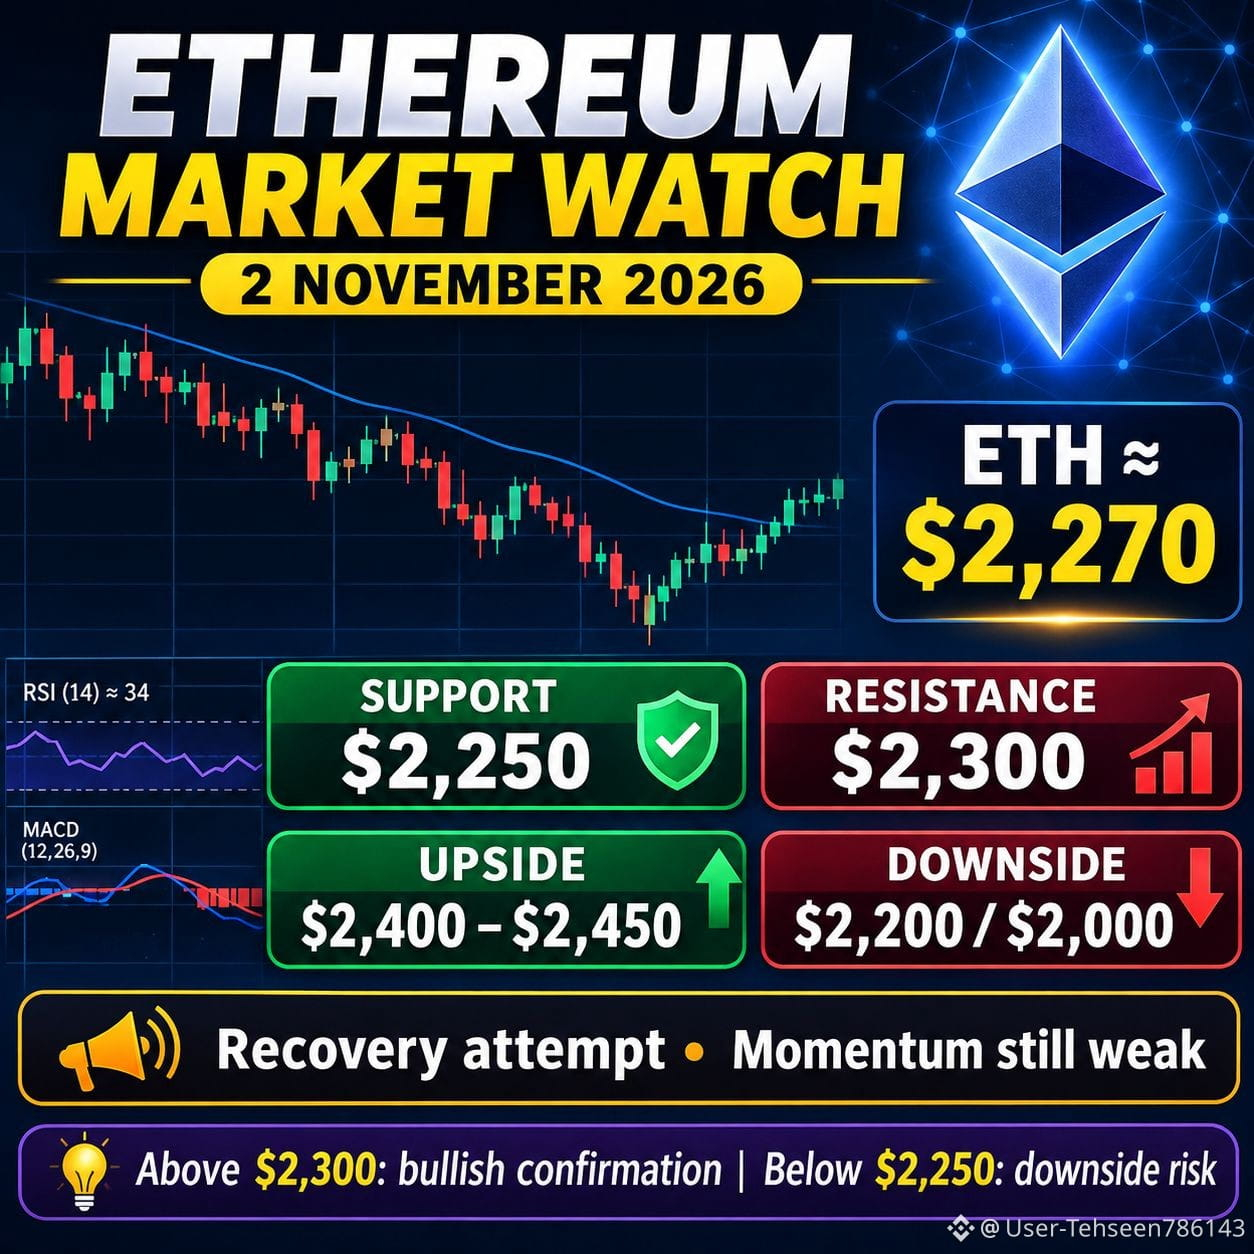
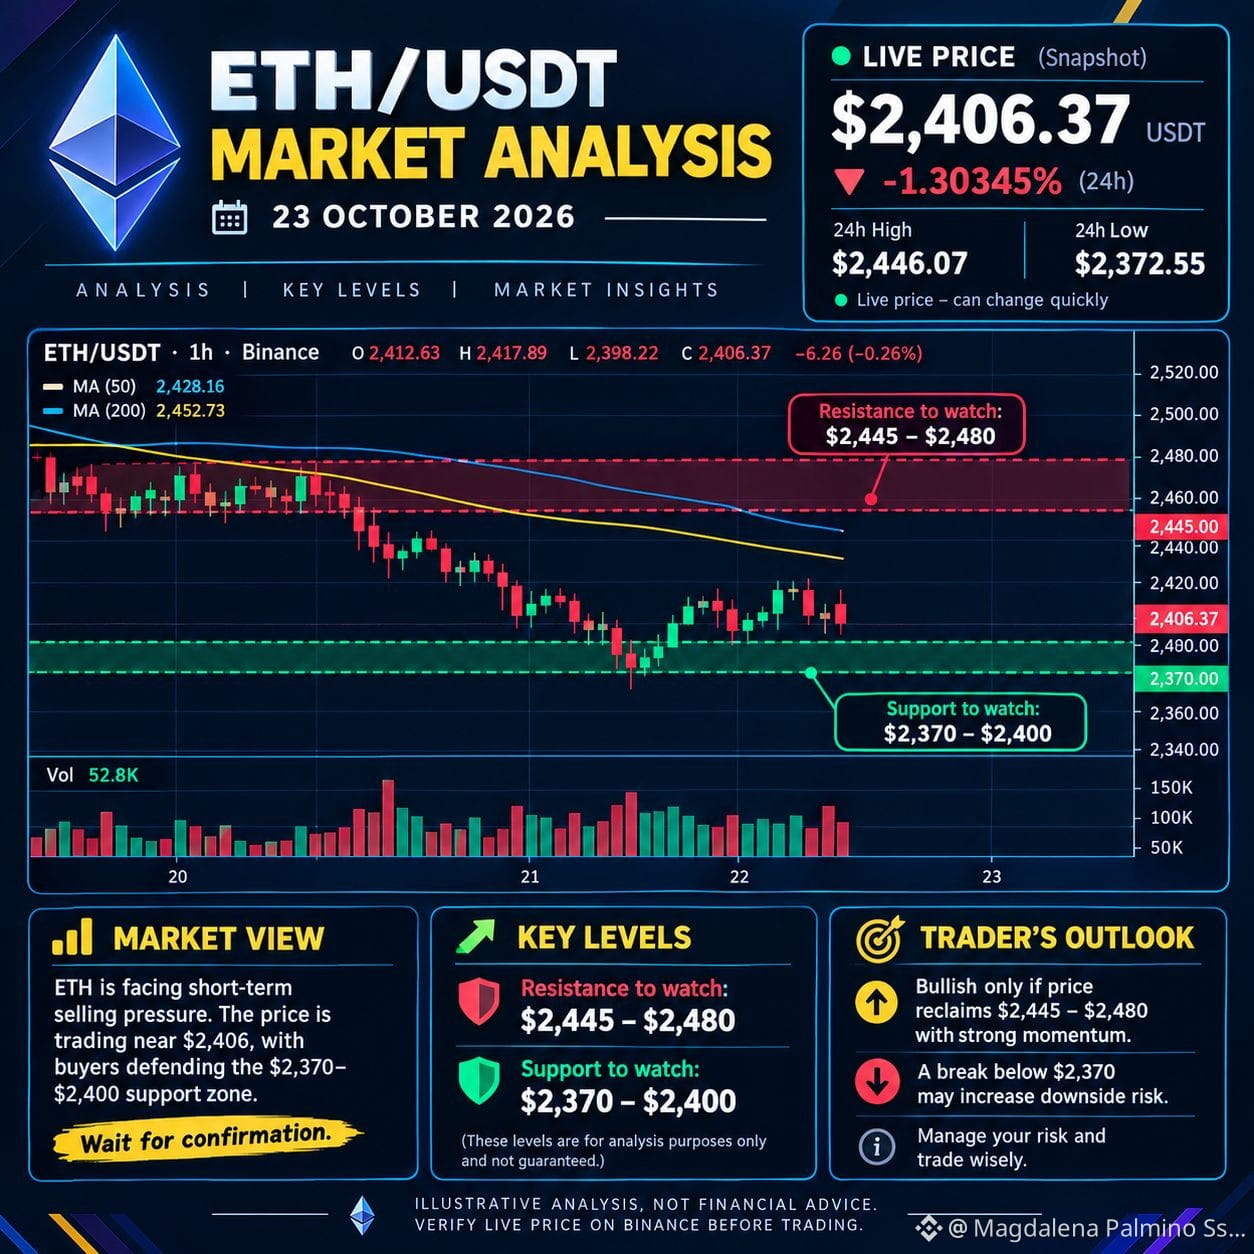
🚀 $ETH ETHEREUM (ETH) LATEST MARKET ANALYSIS 🔥 Ethereum is showing signs of a short-term recovery after recent market pressure. ETH is trading around $2,270, but bulls still need to break a major resistance level. 📊 Key Technical Levels 🟢 Current Price: ~$2,270 🟢 Support Zone: $2,250 🔴 Resistance: $2,300 🎯 Bullish Targets: - $2,400 - $2,450 ⚠️ Bearish Targets: - $2,200 - $2,000 📈 Bullish Scenario: If ETH breaks and holds above $2,300, buyers could push the price toward $2,400–$2,450. 📉 Bearish Scenario: If ETH loses the $2,250 support, further downside toward $2,200 and potentially $2,000 becomes possible. 🔥 Market Sentiment: ETH is attempting a recovery, but momentum remains weak. ETF outflows are creating pressure, while growing staking activity provides a longer-term positive signal. 💡 My Strategy: Wait for a confirmed breakout above $2,300 or a clear bounce from support before entering a trade. Risk management is essential. 🚀 Is Ethereum preparing for a major recovery, or will bears take control again? #Ethereum #Ethereum #CryptoAnalysisUpdate {spot}(ETHUSDT) #ETHUSDT #Bitcoin #CryptoTrading #Altcoins #Market_Update #BinancePick $ETH
🚀 $ETH ETHEREUM (ETH) LATEST MARKET ANALYSIS 🔥

Ethereum is showing signs of a short-term recovery after recent market pressure. ETH is trading around $2,270, but bulls still need to break a major resistance level.

📊 Key Technical Levels

🟢 Current Price: ~$2,270

🟢 Support Zone: $2,250

🔴 Resistance: $2,300

🎯 Bullish Targets:

- $2,400
- $2,450

⚠️ Bearish Targets:

- $2,200
- $2,000

📈 Bullish Scenario:
If ETH breaks and holds above $2,300, buyers could push the price toward $2,400–$2,450.

📉 Bearish Scenario:
If ETH loses the $2,250 support, further downside toward $2,200 and potentially $2,000 becomes possible.

🔥 Market Sentiment:
ETH is attempting a recovery, but momentum remains weak. ETF outflows are creating pressure, while growing staking activity provides a longer-term positive signal.

💡 My Strategy:
Wait for a confirmed breakout above $2,300 or a clear bounce from support before entering a trade. Risk management is essential.

🚀 Is Ethereum preparing for a major recovery, or will bears take control again?

#Ethereum #Ethereum #CryptoAnalysisUpdate
#ETHUSDT #Bitcoin #CryptoTrading #Altcoins #Market_Update #BinancePick $ETH
🚨 $BTC {spot}(BTCUSDT) #BinanceUpdatesProofofReservesAddresses #BinanceToResumePhaseOneOfWithdrawals #BITCOIN (BTC) LATEST MARKET ANALYSIS – NOV 2, 2026 📊 Bitcoin is showing signs of recovery after recent selling pressure, but volatility remains high. 💰 BTC Price: Around $77,900 📉 Key Support: $76,900 🚀 Immediate Resistance: $78,000 🎯 Next Target: $79,100 – $80,400 Market Outlook: - A breakout above $78K could bring fresh bullish momentum. - Losing $76.9K may trigger further downside. - Traders should watch volume and market sentiment closely. My View: Neutral with cautious bullish potential if BTC breaks above resistance. 📈 ⚠️ Trade carefully and manage your risk. #Bitcoin #BTC #CryptoAnalysisUpdate # #BitcoinUpdate #CryptoMarket
🚨 $BTC
#BinanceUpdatesProofofReservesAddresses #BinanceToResumePhaseOneOfWithdrawals #BITCOIN (BTC) LATEST MARKET ANALYSIS – NOV 2, 2026 📊

Bitcoin is showing signs of recovery after recent selling pressure, but volatility remains high.

💰 BTC Price: Around $77,900

📉 Key Support: $76,900
🚀 Immediate Resistance: $78,000
🎯 Next Target: $79,100 – $80,400

Market Outlook:

- A breakout above $78K could bring fresh bullish momentum.
- Losing $76.9K may trigger further downside.
- Traders should watch volume and market sentiment closely.

My View: Neutral with cautious bullish potential if BTC breaks above resistance. 📈

⚠️ Trade carefully and manage your risk.

#Bitcoin #BTC #CryptoAnalysisUpdate # #BitcoinUpdate #CryptoMarket
Bitcoin Up or Down - November 1, 5PM-5:15PM ET

Bitcoin Up or Down - November 1, 5PM-5:15PM ET

1%Up99%Down
Объем $484,893.33
·
--
Рост
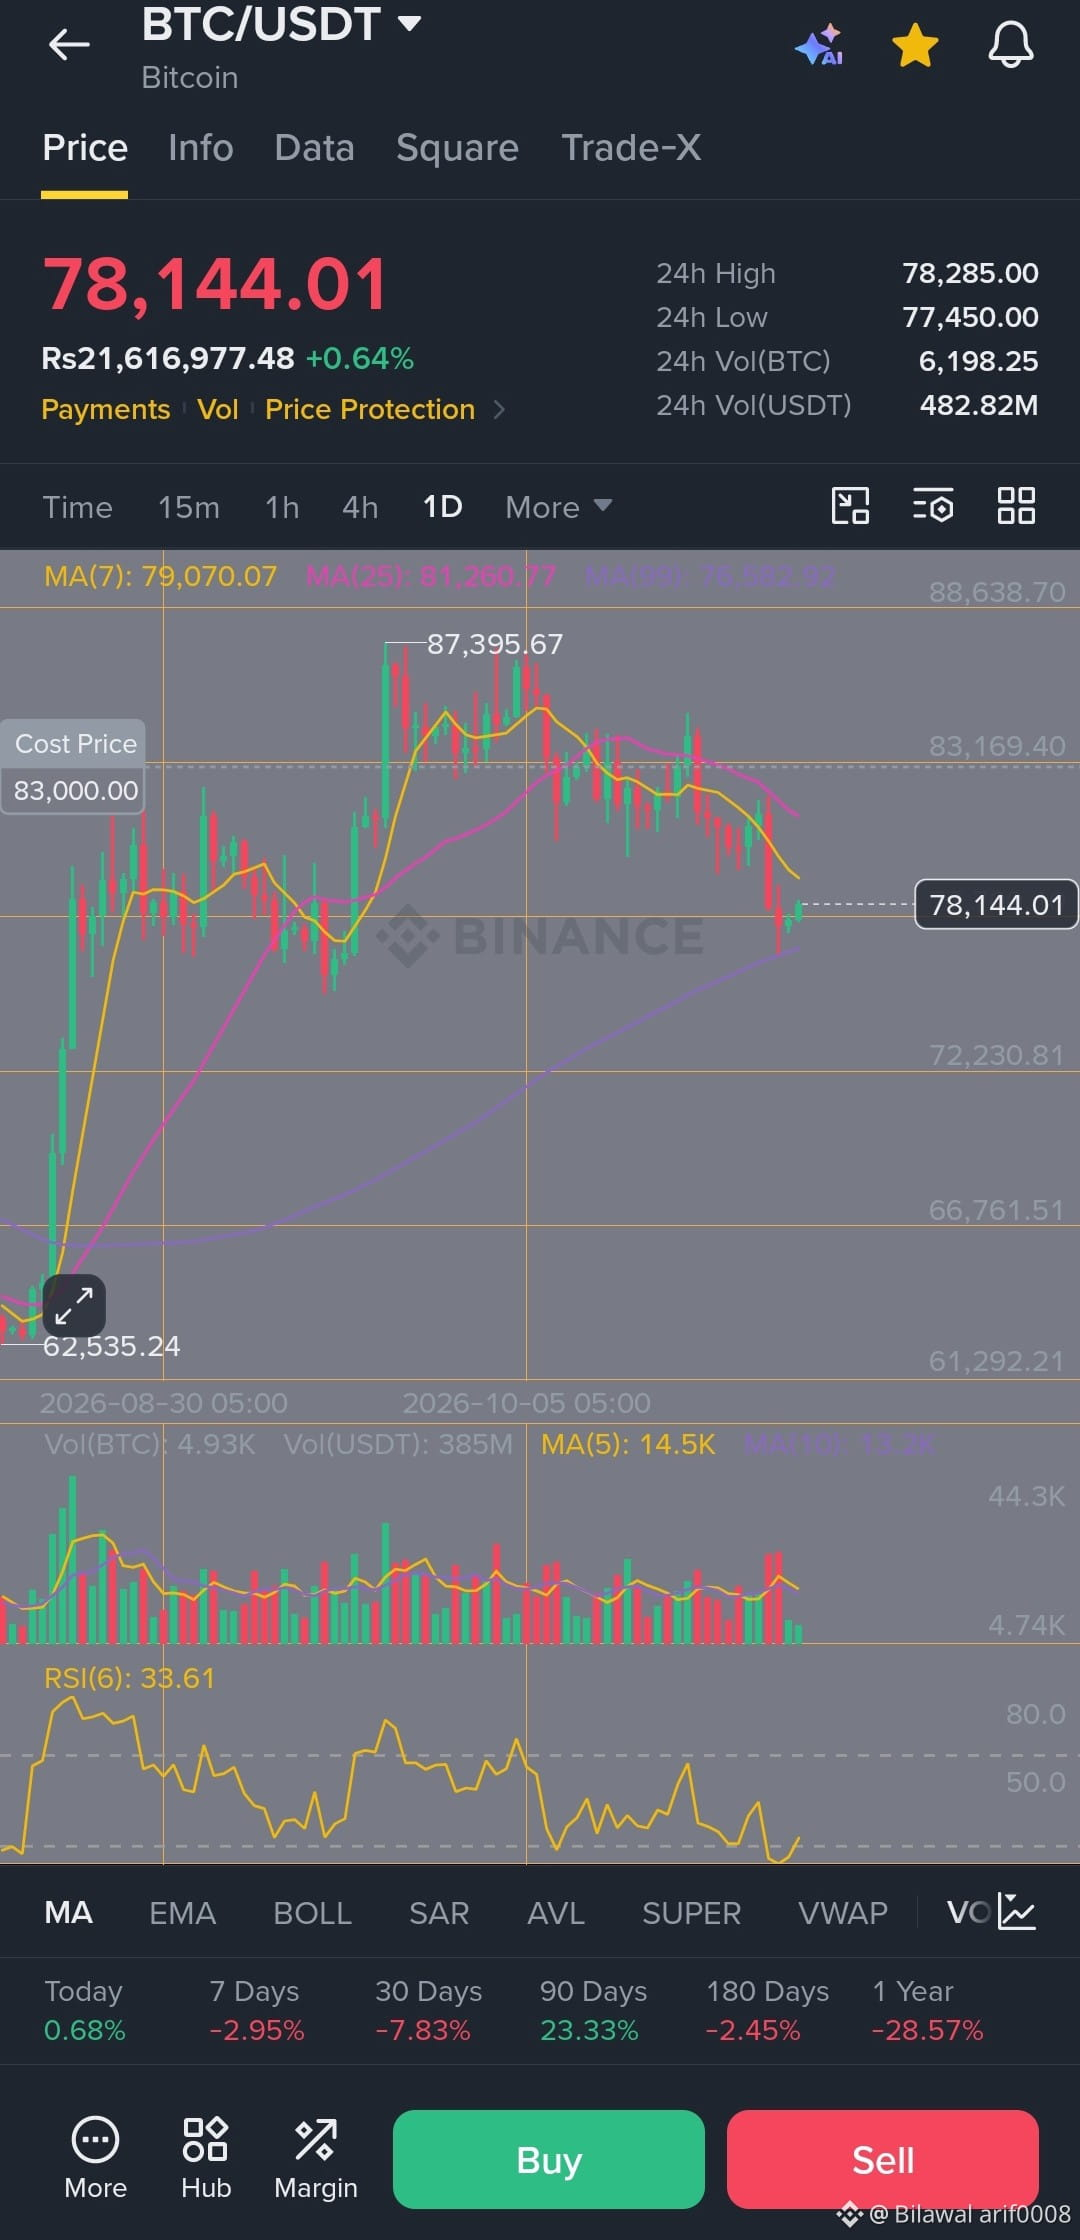
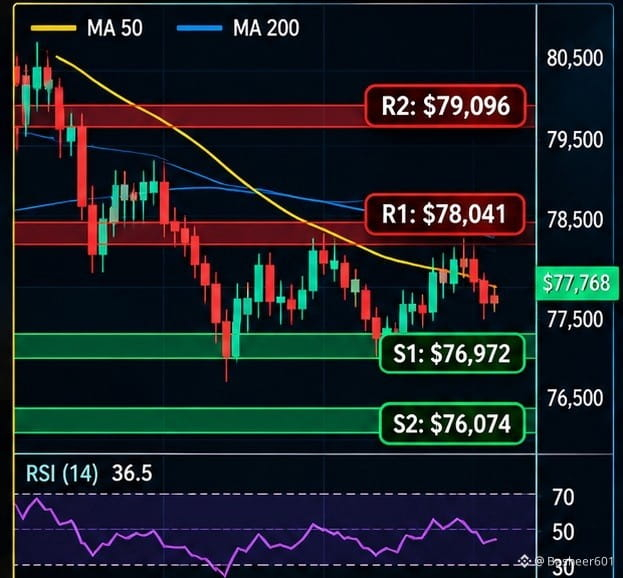
$BTC AT $78K — BREAKOUT OR MORE DOWNSIDE? ₿ 📍 Current reference: $77,966 🔴 Resistance: $78,041 | $79,119 🟢 Support: $76,974 | $76,074 $BTC is at a critical decision zone. Can buyers reclaim $78K, or will sellers push it lower? 👇 Your prediction: BULLISH 🚀 or BEARISH 🐻? #bitcoin.” #BTC #CryptoAnalysisUpdate #BinanceSquare {future}(BTCUSDT)
$BTC AT $78K — BREAKOUT OR MORE DOWNSIDE? ₿

📍 Current reference: $77,966

🔴 Resistance: $78,041 | $79,119
🟢 Support: $76,974 | $76,074

$BTC is at a critical decision zone. Can buyers reclaim $78K, or will sellers push it lower?

👇 Your prediction: BULLISH 🚀 or BEARISH 🐻?

#bitcoin.” #BTC #CryptoAnalysisUpdate #BinanceSquare
Bitcoin Up or Down - November 1, 3:05AM-3:10AM ET

Bitcoin Up or Down - November 1, 3:05AM-3:10AM ET

1%Up99%Down
Объем $866,729.66
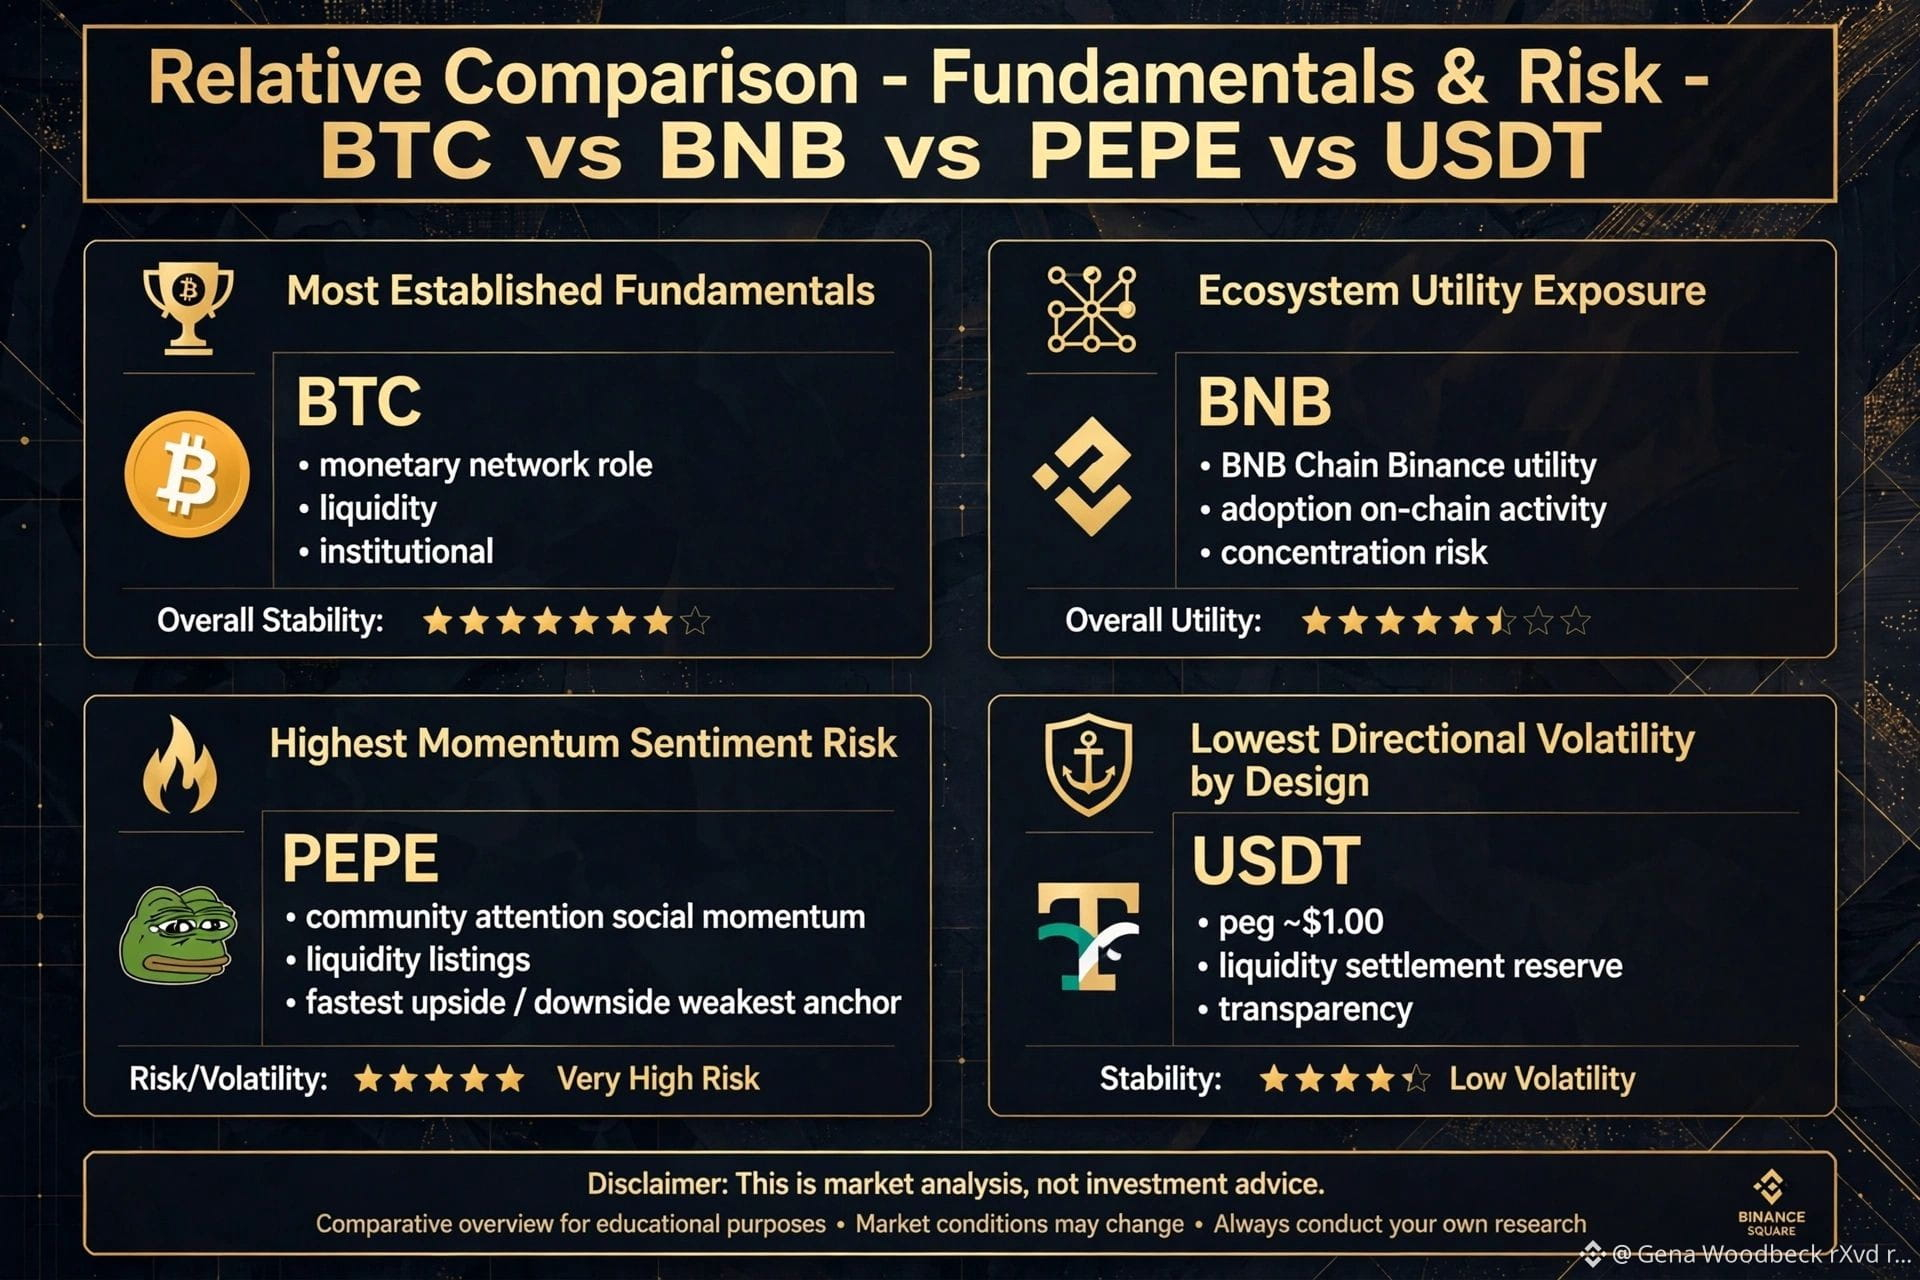
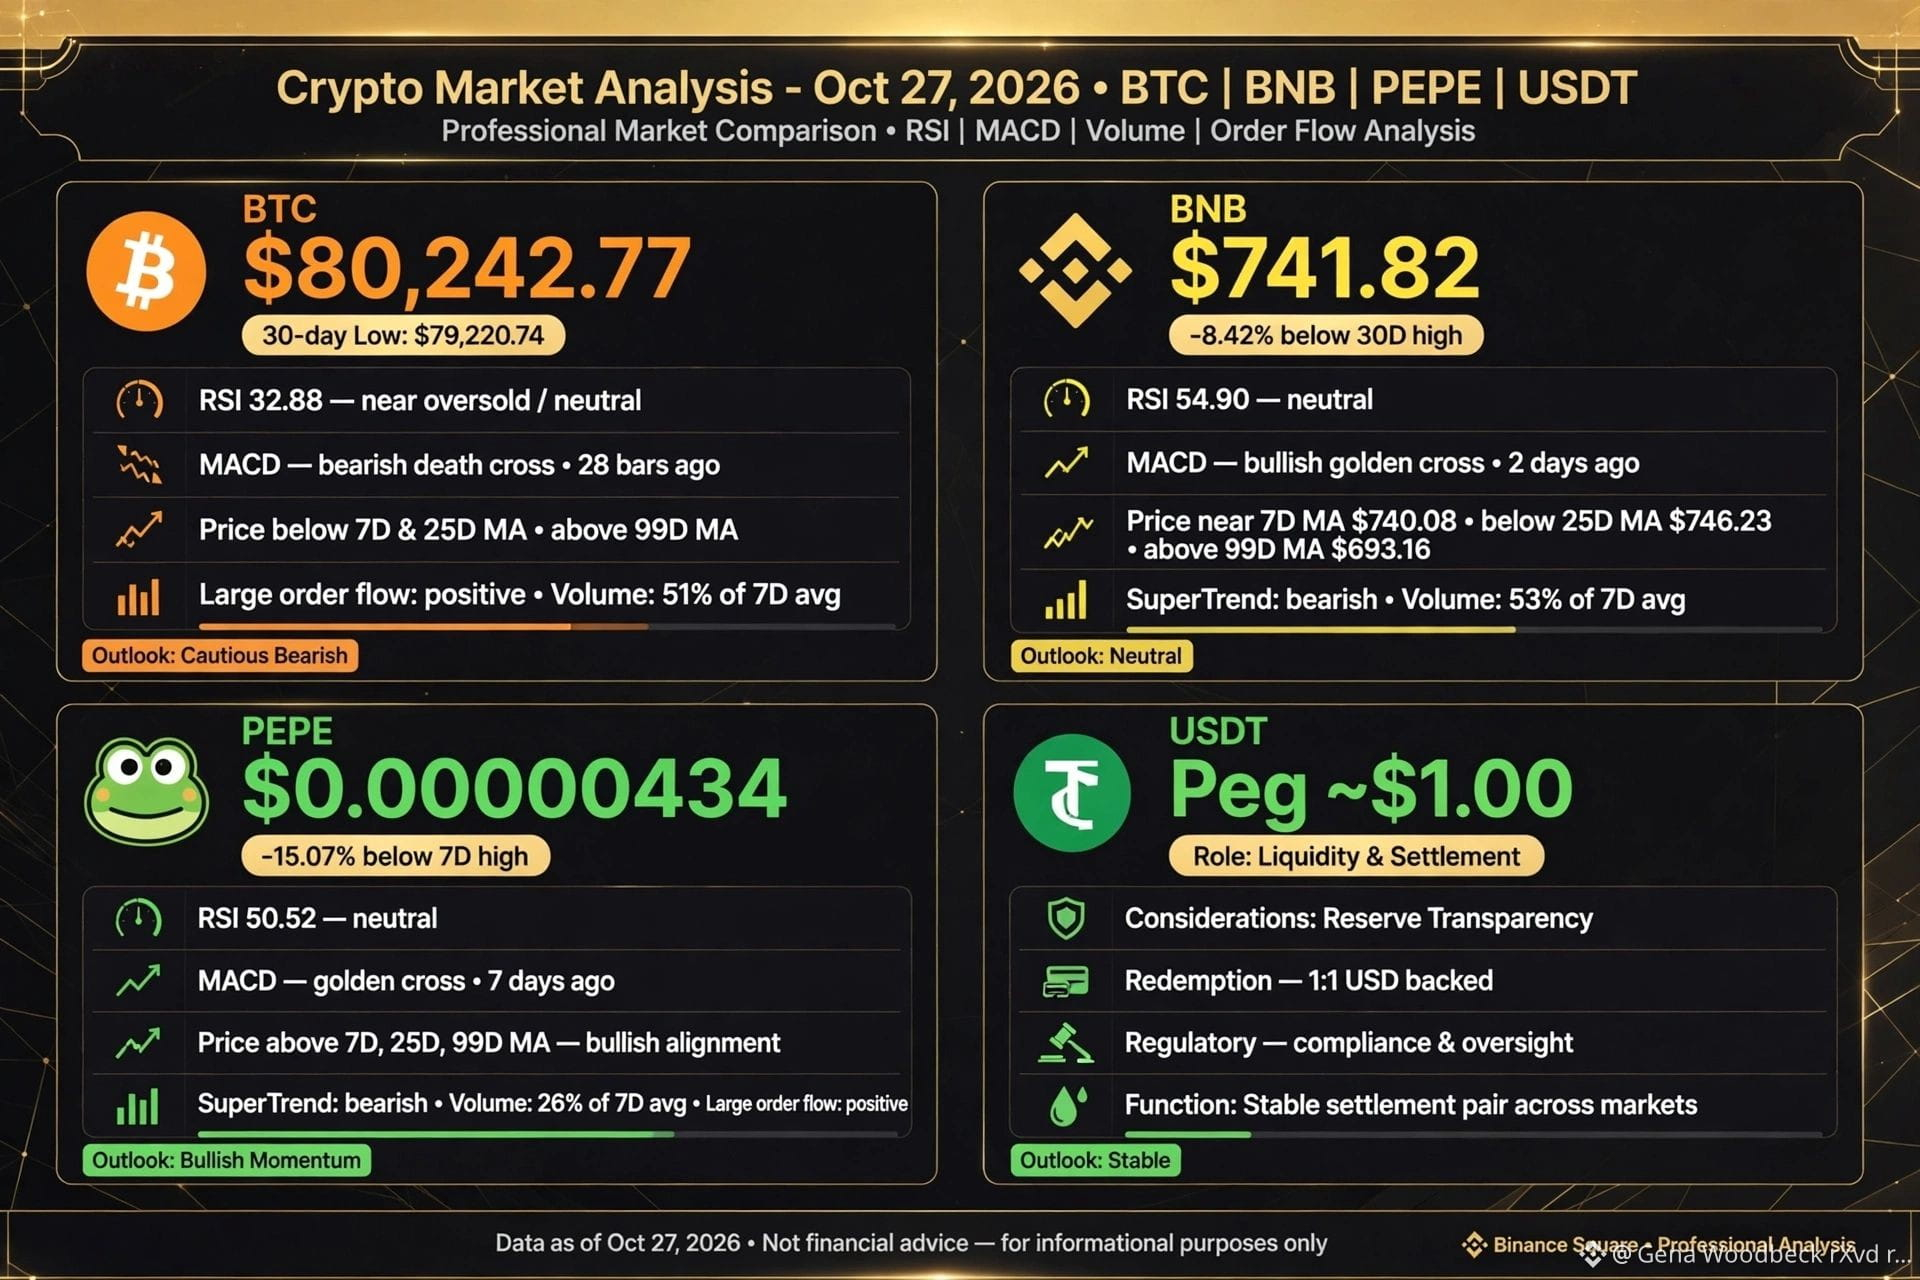
BTC — Technical & Fundamental View | Oct 27, 2026 Technical: BTC is near the lower end of its recent 30-day range: $80,242.77 vs 30-day low $79,220.74. 6-day RSI 32.88 — neutral but close to oversold. MACD remains bearish, death cross 28 daily bars ago. Price below 7D & 25D MAs, above 99D MA — short-term pressure within higher long-term reference. Large-order flow positive today, but daily volume only 51% of 7D avg, so rebound lacks strong participation. Fundamentals: Most established cryptoasset — scarcity, security, deep liquidity, institutional accessibility. Risks: macro liquidity, regulatory, cyclical drawdowns. BNB — $741.82 Technical: RSI 54.90 neutral. MACD bullish golden cross 2 days ago, but price slightly below 7D MA ($740.08) and 25D MA ($746.23), above 99D MA ($693.16). SuperTrend bearish, signals not fully aligned. -8.42% below 30D high, volume 53% of 7D avg. Fundamentals: Utility tied to BNB Chain ecosystem, fees & platform utility. Benefits from ecosystem growth but carries concentration risk. PEPE — $0.00000434 Technical: RSI 50.52 neutral. MACD golden cross 7 bars ago, price above 7D/25D/99D MAs — bullish alignment. SuperTrend still bearish, -15.07% below 7D high, volume only 26% of 7D avg — improving structure but no volume confirmation. Large-order flow positive. Fundamentals: Meme coin — driven by community attention, liquidity, listings, social momentum & risk appetite. Fast upside/downside, weakest fundamental anchor. Most sentiment-sensitive. USDT — Role & Fundamentals Designed to track ~$1, not appreciate. Role is liquidity, settlement, volatility hedge. Key considerations: reserve transparency, redemption, regulation, platform liquidity. Relative Comparison: • Most established: BTC • Ecosystem utility: BNB • Highest sentiment risk: PEPE • Lowest volatility by design: USDT Data as of Oct 27, 2026. Market analysis, not investment advice. DYOR #BTC #BNB #PEPE #USDT #CryptoAnalysisUpdate #writetoearn #write2earnonbinancesquare #BNB_Market_Update #bnbbtc $BNB $BTC $USDT {spot}(BNBUSDT) {spot}(BTCUSDT)
BTC — Technical & Fundamental View | Oct 27, 2026

Technical: BTC is near the lower end of its recent 30-day range: $80,242.77 vs 30-day low $79,220.74. 6-day RSI 32.88 — neutral but close to oversold. MACD remains bearish, death cross 28 daily bars ago. Price below 7D & 25D MAs, above 99D MA — short-term pressure within higher long-term reference. Large-order flow positive today, but daily volume only 51% of 7D avg, so rebound lacks strong participation.

Fundamentals: Most established cryptoasset — scarcity, security, deep liquidity, institutional accessibility. Risks: macro liquidity, regulatory, cyclical drawdowns.

BNB — $741.82
Technical: RSI 54.90 neutral. MACD bullish golden cross 2 days ago, but price slightly below 7D MA ($740.08) and 25D MA ($746.23), above 99D MA ($693.16). SuperTrend bearish, signals not fully aligned. -8.42% below 30D high, volume 53% of 7D avg.
Fundamentals: Utility tied to BNB Chain ecosystem, fees & platform utility. Benefits from ecosystem growth but carries concentration risk.

PEPE — $0.00000434
Technical: RSI 50.52 neutral. MACD golden cross 7 bars ago, price above 7D/25D/99D MAs — bullish alignment. SuperTrend still bearish, -15.07% below 7D high, volume only 26% of 7D avg — improving structure but no volume confirmation. Large-order flow positive.
Fundamentals: Meme coin — driven by community attention, liquidity, listings, social momentum & risk appetite. Fast upside/downside, weakest fundamental anchor. Most sentiment-sensitive.

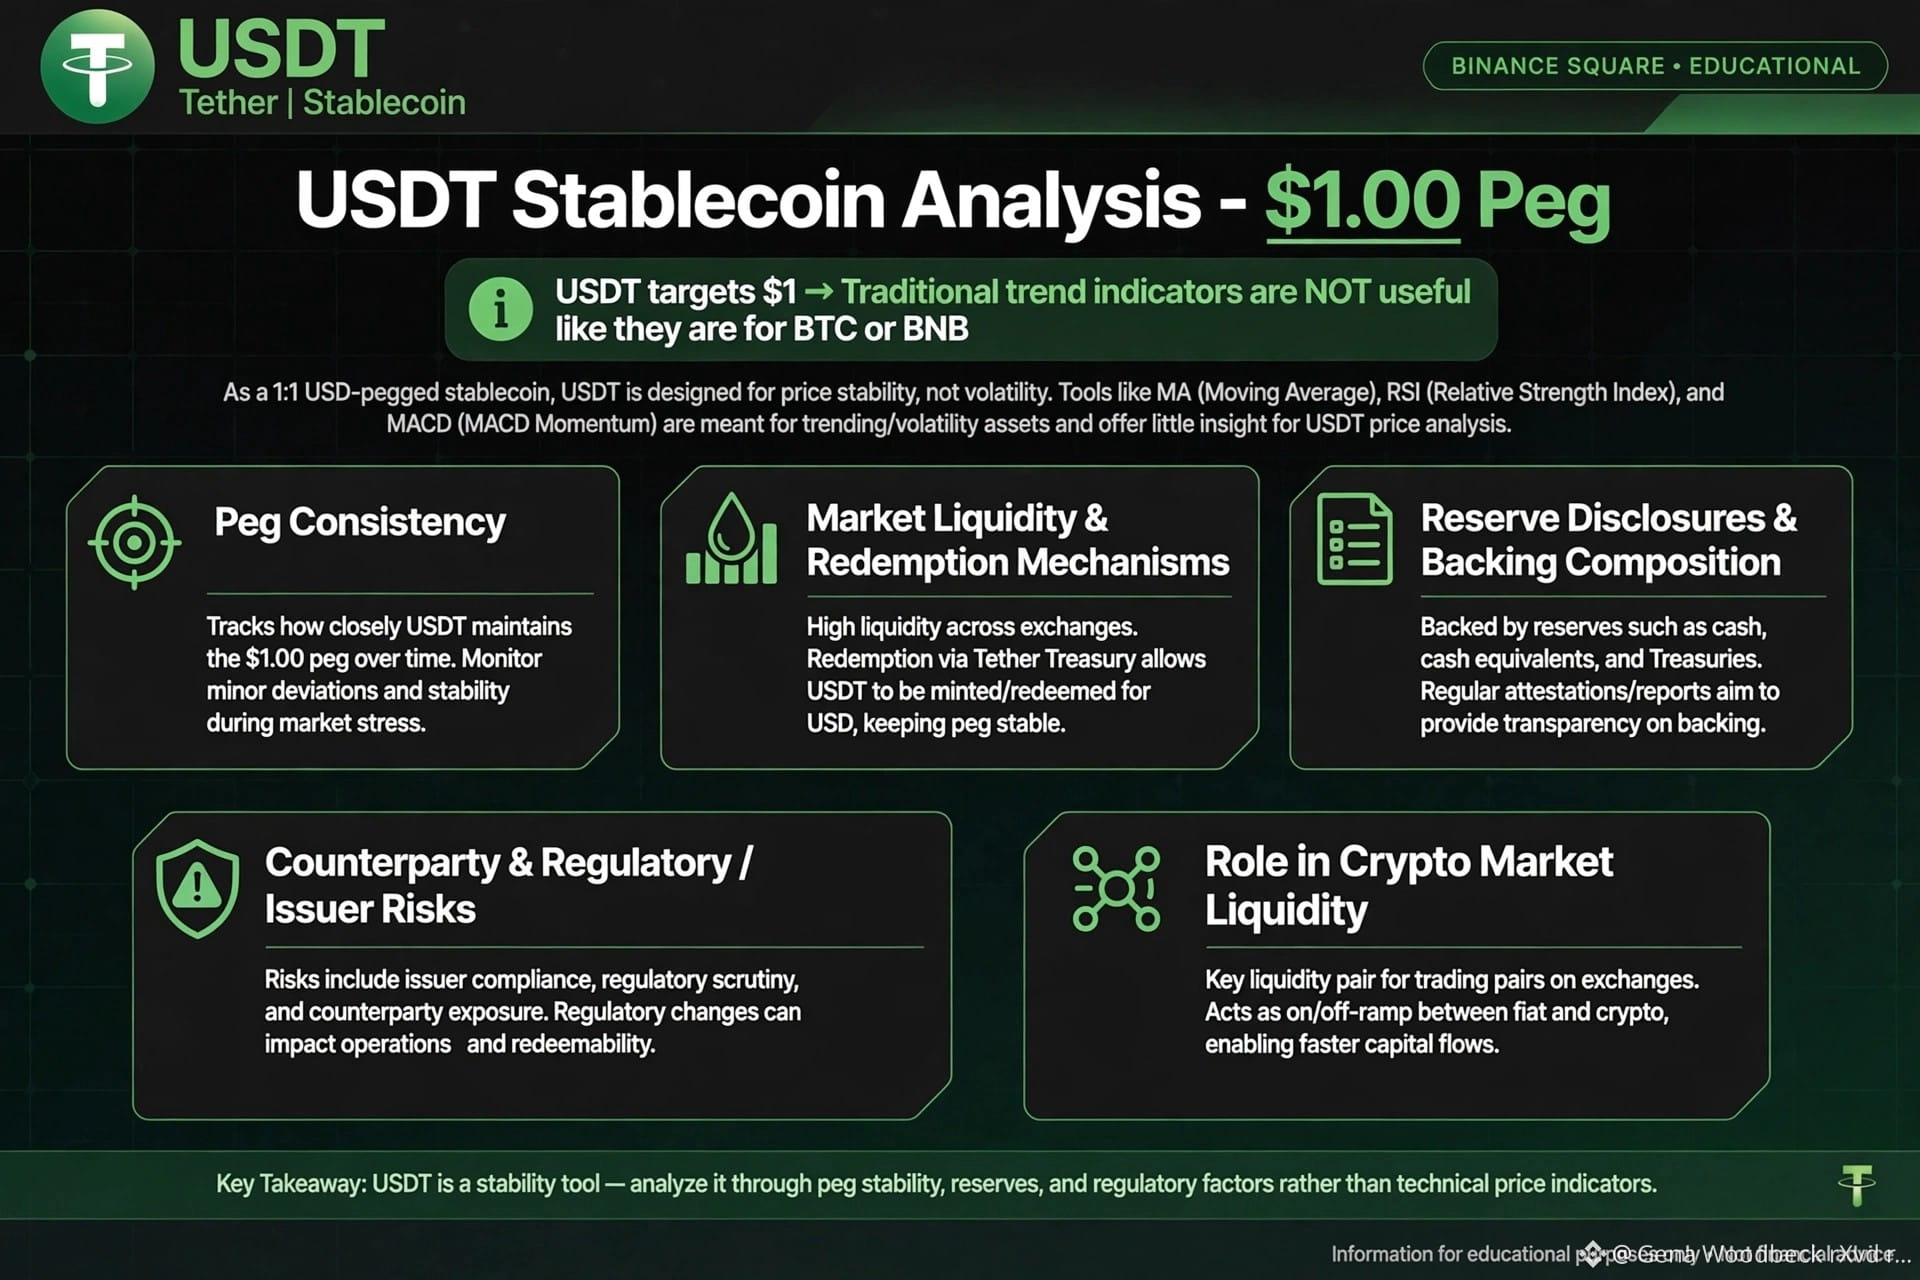
USDT — Role & Fundamentals

Designed to track ~$1, not appreciate. Role is liquidity, settlement, volatility hedge. Key considerations: reserve transparency, redemption, regulation, platform liquidity.

Relative Comparison:
• Most established: BTC
• Ecosystem utility: BNB
• Highest sentiment risk: PEPE
• Lowest volatility by design: USDT

Data as of Oct 27, 2026. Market analysis, not investment advice. DYOR

#BTC #BNB #PEPE #USDT #CryptoAnalysisUpdate #writetoearn #write2earnonbinancesquare #BNB_Market_Update #bnbbtc $BNB $BTC $USDT
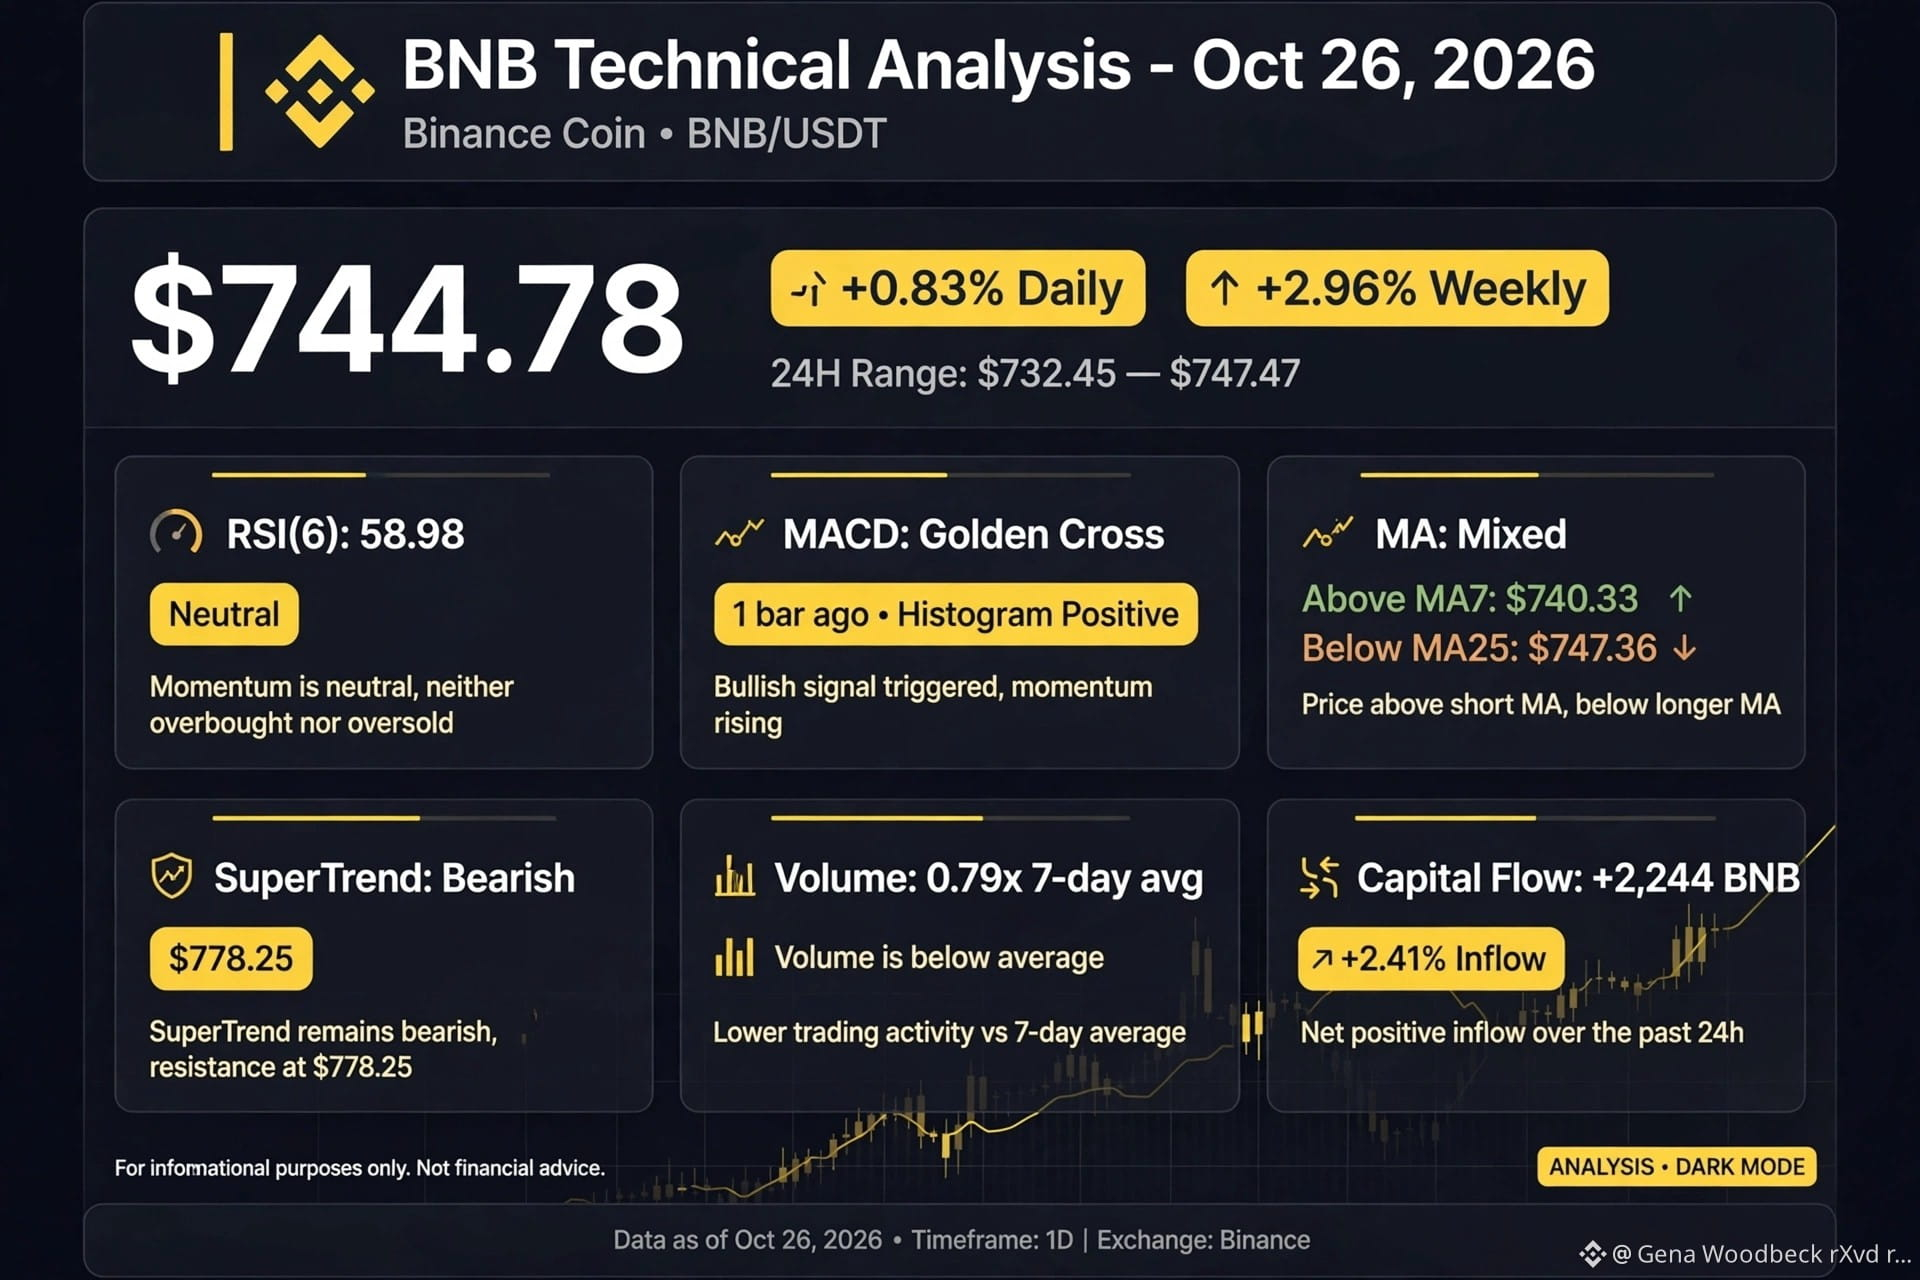
BNB Technical Analysis - Oct 26, 2026 | $744.78 Price Action: $744.78 (+0.83% Daily, +2.96% Weekly) | 24H Range: $732.45 - $747.47 | 30D: -4.16% Momentum: RSI(6) 58.98 Neutral, improving from 51.17. MACD Golden Cross 1 bar ago, histogram turned positive. MA Structure: Above MA7 $740.33 but below MA25 $747.36. Mixed short-term alignment. SuperTrend still bearish at $778.25 - daily reversal not confirmed yet. Flow & Volume: Volume 0.79x 7-day avg - rebound on low participation. Large-order net inflow +2,244 BNB (+2.41%) showing some accumulation. Fundamentals: Native asset for BNB Chain fees, ecosystem apps, and burn mechanics. Drivers: Chain activity + burns + market risk appetite. Risks: Ecosystem dependence + regulation + volatility. Bias: Neutral to cautiously bullish until break above MA25 and SuperTrend. Not financial advice. DYOR. #BNB #BNBChain #CryptoAnalysisUpdate #writetoearn #WritetoEarnBinanceSquar #EarningsSeason #BNBLUNCPOOL $BNB {spot}(BNBUSDT)
BNB Technical Analysis - Oct 26, 2026 | $744.78

Price Action: $744.78 (+0.83% Daily, +2.96% Weekly) | 24H Range: $732.45 - $747.47 | 30D: -4.16%
Momentum: RSI(6) 58.98 Neutral, improving from 51.17. MACD Golden Cross 1 bar ago, histogram turned positive.

MA Structure: Above MA7 $740.33 but below MA25 $747.36. Mixed short-term alignment. SuperTrend still bearish at $778.25 - daily reversal not confirmed yet.

Flow & Volume: Volume 0.79x 7-day avg - rebound on low participation. Large-order net inflow +2,244 BNB (+2.41%) showing some accumulation.

Fundamentals: Native asset for BNB Chain fees, ecosystem apps, and burn mechanics. Drivers: Chain activity + burns + market risk appetite. Risks: Ecosystem dependence + regulation + volatility.

Bias: Neutral to cautiously bullish until break above MA25 and SuperTrend.

Not financial advice. DYOR.

#BNB #BNBChain #CryptoAnalysisUpdate #writetoearn #WritetoEarnBinanceSquar #EarningsSeason #BNBLUNCPOOL $BNB
$Q $Q Uptrend Intact: Next Stop $0.2170, Key Support $0.1204 | $5.2M in Shorts Squeezed in 24h 📊 $Q Quant Outlook | 1-Day Intraday Price: 0.135274 (+16.2% / 1D) Trend (1H): Uptrend | RSI 57 Structure: above 200D MA ✅ 🔑 Key Levels Support: 0.120421 / 0.112601 Resistance: 0.216977 / 0.231816 📈 Bull case: 1H close above 0.216977 → 0.231816 next 📉 Bear case: 1H close below 0.120421 → 0.112601 in play 🧮 Derivatives Pulse • Funding: -0.0070% (shorts crowded) • Open Interest: $42.1M (-21.8% 24h) • Liquidations 24h: Longs $2.0M | Shorts $5.2M • Top traders L/S 0.84 vs Retail 0.89 🌐 Market Context • Fear & Greed: 59 (Greed) • BTC trend (1D): Bullish • MC rank #101 | FDV/MC 2.1x • Short-term model bias (1-4h): Neutral 🎯 Trade Idea (R:R-checked) LONG on retest ~0.124131 | SL 0.109291 | TP1 0.216977 | TP2 0.231816 | R:R 1:6.3 Risk management: max 2x isolated, risk ≤1-2% of capital Not Financial Advice | DYOR #QUSDT #CryptoAnalysisUpdate #TechnicalAnalysiss s #BinanceSquareTips #QUSDT — Crypto Quant Analyst | Fundamental & Technical Expert | Data-backed insights
$Q

$Q Uptrend Intact: Next Stop $0.2170, Key Support $0.1204 | $5.2M in Shorts Squeezed in 24h

📊 $Q Quant Outlook | 1-Day Intraday

Price: 0.135274 (+16.2% / 1D)
Trend (1H): Uptrend | RSI 57
Structure: above 200D MA ✅

🔑 Key Levels
Support: 0.120421 / 0.112601
Resistance: 0.216977 / 0.231816

📈 Bull case: 1H close above 0.216977 → 0.231816 next
📉 Bear case: 1H close below 0.120421 → 0.112601 in play

🧮 Derivatives Pulse
• Funding: -0.0070% (shorts crowded)
• Open Interest: $42.1M (-21.8% 24h)
• Liquidations 24h: Longs $2.0M | Shorts $5.2M
• Top traders L/S 0.84 vs Retail 0.89

🌐 Market Context
• Fear & Greed: 59 (Greed)
• BTC trend (1D): Bullish
• MC rank #101 | FDV/MC 2.1x
• Short-term model bias (1-4h): Neutral

🎯 Trade Idea (R:R-checked)
LONG on retest ~0.124131 | SL 0.109291 | TP1 0.216977 | TP2 0.231816 | R:R 1:6.3
Risk management: max 2x isolated, risk ≤1-2% of capital

Not Financial Advice | DYOR
#QUSDT #CryptoAnalysisUpdate #TechnicalAnalysiss s #BinanceSquareTips #QUSDT
— Crypto Quant Analyst | Fundamental & Technical Expert | Data-backed insights
Войдите, чтобы посмотреть больше материала
Присоединяйтесь к пользователям криптовалют по всему миру на Binance Square
⚡️ Получайте новейшую и полезную информацию о криптоактивах.
💬 Нам доверяет крупнейшая в мире криптобиржа.
👍 Получите достоверные аналитические данные от верифицированных создателей контента.
Эл. почта/номер телефона