

#altcoinseason
altcoinseason
Просмотров: 41.6M
71,515 обсуждают
Популярные
Новые

·
--
Альтсезон: что дальше? 🚀
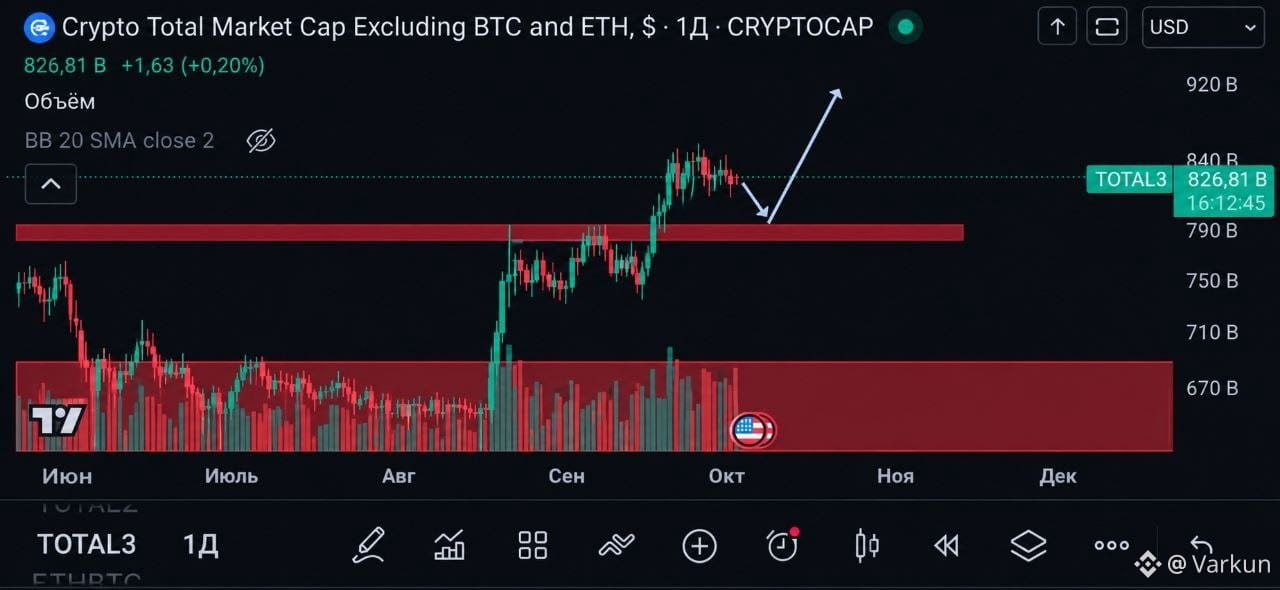
Капитализация альты может протестировать пробитую зону сопротивления сверху. Это может вызвать локальную просадку.
Если зона удержится — возможен новый виток роста, и многие альткоины могут снова сделать иксы!
$HBAR $XRP $LTC
#altcoins #altcoinseason
Альтсезон: что дальше? 🚀
Капитализация альты может протестировать пробитую зону сопротивления сверху. Это может вызвать локальную просадку.
Если зона удержится — возможен новый виток роста, и многие альткоины могут снова сделать иксы!
$HBAR $XRP $LTC
#altcoins #altcoinseason
Капитализация альты может протестировать пробитую зону сопротивления сверху. Это может вызвать локальную просадку.
Если зона удержится — возможен новый виток роста, и многие альткоины могут снова сделать иксы!
$HBAR $XRP $LTC
#altcoins #altcoinseason
572

·
--
Watching the BTC dominance and ETH dominance divergence is one of the cleanest alt-rotation clocks in crypto.
Here is the logic: when $BTC dominance peaks and begins rolling over, capital starts leaking into large-cap alts first. But the real confirmation signal comes when ETH dominance itself starts to compress. That squeeze means liquidity is cascading further down the cap table into mid and small caps.
Three stages to watch:
1. BTC.D peaks — Large-cap rotation starts. ETH and $BNB typically lead.
2. ETH.D peaks — Mid-cap alts wake up. This is the broadening phase.
3. Both declining simultaneously — Speculative heat is fully distributed. Historically a late-cycle signal, not an entry point.
The mistake most people make is chasing stage 3 thinking it is stage 1. By the time every altcoin is green for weeks straight, the risk/reward has already compressed substantially.
Right now, studying where BTC.D and ETH.D sit relative to their 90-day ranges tells you more about positioning than most price charts. Rotation is a process, not an event — and the dominance ratios are your map.
Know the stage before you size the trade. $BTC $BNB
#AltcoinSeason #CryptoRotation #BTCDominance #MarketCycle #CryptoStrategy
Watching the BTC dominance and ETH dominance divergence is one of the cleanest alt-rotation clocks in crypto.
Here is the logic: when $BTC dominance peaks and begins rolling over, capital starts leaking into large-cap alts first. But the real confirmation signal comes when ETH dominance itself starts to compress. That squeeze means liquidity is cascading further down the cap table into mid and small caps.
Three stages to watch:
1. BTC.D peaks — Large-cap rotation starts. ETH and $BNB typically lead.
2. ETH.D peaks — Mid-cap alts wake up. This is the broadening phase.
3. Both declining simultaneously — Speculative heat is fully distributed. Historically a late-cycle signal, not an entry point.
The mistake most people make is chasing stage 3 thinking it is stage 1. By the time every altcoin is green for weeks straight, the risk/reward has already compressed substantially.
Right now, studying where BTC.D and ETH.D sit relative to their 90-day ranges tells you more about positioning than most price charts. Rotation is a process, not an event — and the dominance ratios are your map.
Know the stage before you size the trade. $BTC $BNB
#AltcoinSeason #CryptoRotation #BTCDominance #MarketCycle #CryptoStrategy
Here is the logic: when $BTC dominance peaks and begins rolling over, capital starts leaking into large-cap alts first. But the real confirmation signal comes when ETH dominance itself starts to compress. That squeeze means liquidity is cascading further down the cap table into mid and small caps.
Three stages to watch:
1. BTC.D peaks — Large-cap rotation starts. ETH and $BNB typically lead.
2. ETH.D peaks — Mid-cap alts wake up. This is the broadening phase.
3. Both declining simultaneously — Speculative heat is fully distributed. Historically a late-cycle signal, not an entry point.
The mistake most people make is chasing stage 3 thinking it is stage 1. By the time every altcoin is green for weeks straight, the risk/reward has already compressed substantially.
Right now, studying where BTC.D and ETH.D sit relative to their 90-day ranges tells you more about positioning than most price charts. Rotation is a process, not an event — and the dominance ratios are your map.
Know the stage before you size the trade. $BTC $BNB
#AltcoinSeason #CryptoRotation #BTCDominance #MarketCycle #CryptoStrategy
74
·
--
Most traders watch ETH/BTC to call altcoin season. But there is a second ratio worth tracking just as closely: SOL/BTC.
Here is why it matters.
$ETH/BTC has historically been the first rotation signal. When ETH starts outperforming Bitcoin, capital is beginning to move down the risk curve. That is the established playbook.
But $SOL/BTC is increasingly acting as a confirmation layer — and sometimes a leading one. SOL attracts a different capital cohort: retail traders, meme token participants, and high-throughput DeFi users. When SOL/BTC breaks higher while ETH/BTC is still basing, it often signals that speculative appetite is already running hot in pockets of the market.
The sequence to watch in a healthy rotation:
1. $BTC dominance peaks and rolls over
2. ETH/BTC ratio turns up (large-cap rotation begins)
3. SOL/BTC confirms with a breakout (speculative risk-on is real)
4. Broader alts follow — mid and small caps
If SOL/BTC is surging but ETH/BTC is still lagging, treat it as a warning sign rather than a green light. Speculative pockets can run hot without full cycle participation.
Two ratios. One gives you direction. The other tells you conviction.
Track both before chasing alts.
#AltcoinSeason #CryptoTrading #MarketRotation #BinanceSquare #CryptoInsights
Most traders watch ETH/BTC to call altcoin season. But there is a second ratio worth tracking just as closely: SOL/BTC.
Here is why it matters.
$ETH /BTC has historically been the first rotation signal. When ETH starts outperforming Bitcoin, capital is beginning to move down the risk curve. That is the established playbook.
But $SOL /BTC is increasingly acting as a confirmation layer — and sometimes a leading one. SOL attracts a different capital cohort: retail traders, meme token participants, and high-throughput DeFi users. When SOL/BTC breaks higher while ETH/BTC is still basing, it often signals that speculative appetite is already running hot in pockets of the market.
The sequence to watch in a healthy rotation:
1. $BTC dominance peaks and rolls over
2. ETH/BTC ratio turns up (large-cap rotation begins)
3. SOL/BTC confirms with a breakout (speculative risk-on is real)
4. Broader alts follow — mid and small caps
If SOL/BTC is surging but ETH/BTC is still lagging, treat it as a warning sign rather than a green light. Speculative pockets can run hot without full cycle participation.
Two ratios. One gives you direction. The other tells you conviction.
Track both before chasing alts.
#AltcoinSeason #CryptoTrading #MarketRotation #BinanceSquare #CryptoInsights
Here is why it matters.
$ETH /BTC has historically been the first rotation signal. When ETH starts outperforming Bitcoin, capital is beginning to move down the risk curve. That is the established playbook.
But $SOL /BTC is increasingly acting as a confirmation layer — and sometimes a leading one. SOL attracts a different capital cohort: retail traders, meme token participants, and high-throughput DeFi users. When SOL/BTC breaks higher while ETH/BTC is still basing, it often signals that speculative appetite is already running hot in pockets of the market.
The sequence to watch in a healthy rotation:
1. $BTC dominance peaks and rolls over
2. ETH/BTC ratio turns up (large-cap rotation begins)
3. SOL/BTC confirms with a breakout (speculative risk-on is real)
4. Broader alts follow — mid and small caps
If SOL/BTC is surging but ETH/BTC is still lagging, treat it as a warning sign rather than a green light. Speculative pockets can run hot without full cycle participation.
Two ratios. One gives you direction. The other tells you conviction.
Track both before chasing alts.
#AltcoinSeason #CryptoTrading #MarketRotation #BinanceSquare #CryptoInsights
35

·
--
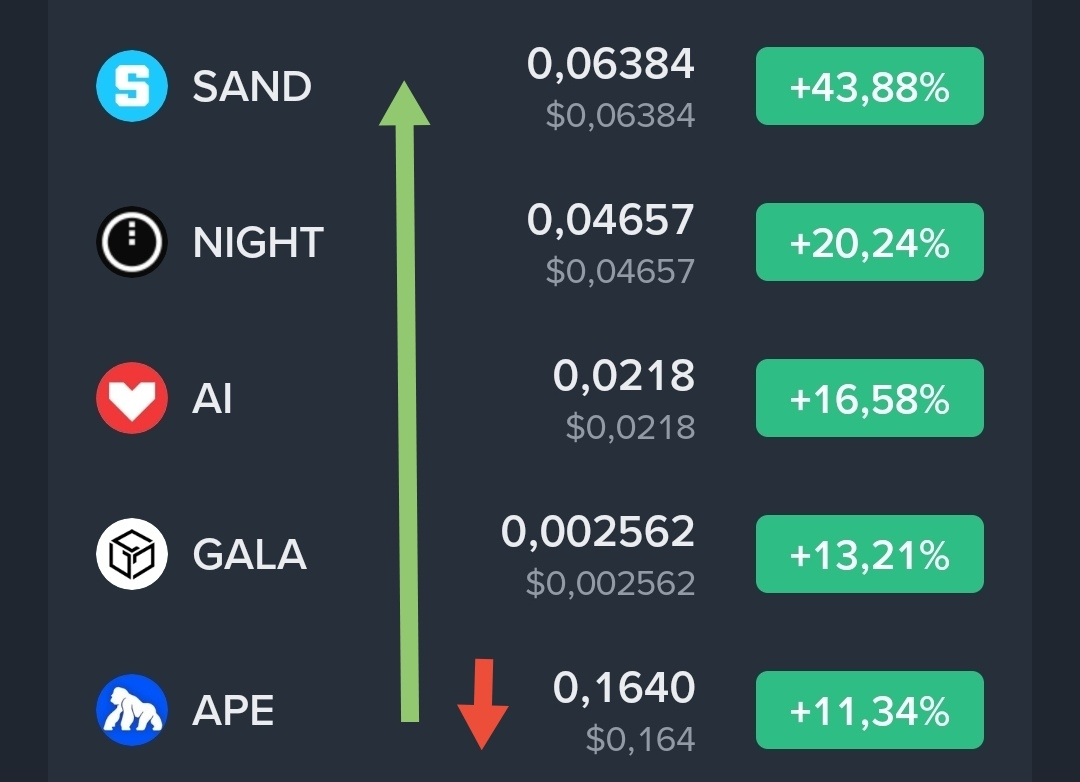
📚 5 ALTCOINS PUMPING – WHAT YOU NEED TO KNOW BEFORE YOU TRADE
$SAND +43% 🥇
$NIGHT +20% 🥈
$AI +16% 🥉
#GALA +13% ⚡
#APE +11% 📈
---
🧠 THE LESSON:
Big green candles attract attention. But smart traders ask WHY before they ask HOW MUCH.
→ SAND – Metaverse narrative returning. Breakout above $0.044 with volume. Pullbacks to $0.058 = potential entries. Resistance at $0.070.
→ **NIGHT** – Privacy + Cardano ecosystem hype. Holding $0.042 support. Break above $0.050 = continuation signal.
→ **AI** – AI narrative still hot. Base building near $0.020. Needs volume above $0.025 to confirm next leg.
→ **GALA** – Gaming sector lagging but recovering. Support at $0.0023. Breakout above $0.0027 could trigger momentum.
→ **APE** – Slowest mover. Needs volume above $0.170 to confirm real interest. Otherwise, sideways.
---
⚡ FUTURES MINDSET:
→ Leverage amplifies BOTH gains and losses.
→ SAND: x3-x5 max, STOP-LOSS at $0.058.
→ NIGHT/AI: x2 max – AI coins can reverse in minutes.
→ GALA/APE: x2 max – lagging momentum = higher risk.
---
🎯 THE RULE:
Never chase green candles. Wait for pullbacks. Set STOP-LOSSES. Risk max 5% per trade.
⚠️ NFA – DYOR. SAND +43% in 24h – corrections can be brutal. The market rewards patience, not FOMO.
Hit 👍 and Fallow 🙏
#Memzone #AltcoinSeason #CryptoEducation
📚 5 ALTCOINS PUMPING – WHAT YOU NEED TO KNOW BEFORE YOU TRADE
$SAND +43% 🥇
$NIGHT +20% 🥈
$AI +16% 🥉
#GALA +13% ⚡
#APE +11% 📈
---
🧠 THE LESSON:
Big green candles attract attention. But smart traders ask WHY before they ask HOW MUCH.
→ SAND – Metaverse narrative returning. Breakout above $0.044 with volume. Pullbacks to $0.058 = potential entries. Resistance at $0.070.
→ **NIGHT** – Privacy + Cardano ecosystem hype. Holding $0.042 support. Break above $0.050 = continuation signal.
→ **AI** – AI narrative still hot. Base building near $0.020. Needs volume above $0.025 to confirm next leg.
→ **GALA** – Gaming sector lagging but recovering. Support at $0.0023. Breakout above $0.0027 could trigger momentum.
→ **APE** – Slowest mover. Needs volume above $0.170 to confirm real interest. Otherwise, sideways.
---
⚡ FUTURES MINDSET:
→ Leverage amplifies BOTH gains and losses.
→ SAND: x3-x5 max, STOP-LOSS at $0.058.
→ NIGHT/AI: x2 max – AI coins can reverse in minutes.
→ GALA/APE: x2 max – lagging momentum = higher risk.
---
🎯 THE RULE:
Never chase green candles. Wait for pullbacks. Set STOP-LOSSES. Risk max 5% per trade.
⚠️ NFA – DYOR. SAND +43% in 24h – corrections can be brutal. The market rewards patience, not FOMO.
Hit 👍 and Fallow 🙏
#Memzone #AltcoinSeason #CryptoEducation
$SAND +43% 🥇
$NIGHT +20% 🥈
$AI +16% 🥉
#GALA +13% ⚡
#APE +11% 📈
---
🧠 THE LESSON:
Big green candles attract attention. But smart traders ask WHY before they ask HOW MUCH.
→ SAND – Metaverse narrative returning. Breakout above $0.044 with volume. Pullbacks to $0.058 = potential entries. Resistance at $0.070.
→ **NIGHT** – Privacy + Cardano ecosystem hype. Holding $0.042 support. Break above $0.050 = continuation signal.
→ **AI** – AI narrative still hot. Base building near $0.020. Needs volume above $0.025 to confirm next leg.
→ **GALA** – Gaming sector lagging but recovering. Support at $0.0023. Breakout above $0.0027 could trigger momentum.
→ **APE** – Slowest mover. Needs volume above $0.170 to confirm real interest. Otherwise, sideways.
---
⚡ FUTURES MINDSET:
→ Leverage amplifies BOTH gains and losses.
→ SAND: x3-x5 max, STOP-LOSS at $0.058.
→ NIGHT/AI: x2 max – AI coins can reverse in minutes.
→ GALA/APE: x2 max – lagging momentum = higher risk.
---
🎯 THE RULE:
Never chase green candles. Wait for pullbacks. Set STOP-LOSSES. Risk max 5% per trade.
⚠️ NFA – DYOR. SAND +43% in 24h – corrections can be brutal. The market rewards patience, not FOMO.
Hit 👍 and Fallow 🙏
#Memzone #AltcoinSeason #CryptoEducation
618
·
--
BTC dominance is the cycle clock most altcoin traders ignore until it is too late.
When $BTC dominance rises — capital is consolidating. Investors are reducing risk, parking in the most liquid asset, or new money is entering via Bitcoin-first products like ETFs and corporate treasuries. This phase punishes altcoins even when BTC itself is flat.
The reversal signal is not a single-day drop in dominance. It is a sustained structural shift: dominance peaks and rolls over while $ETH maintains parity or gains relative to BTC. The ETH/BTC pair is the earliest altcoin rotation signal — ETH captures institutional overflow before retail reaches smaller caps.
The sequence historically runs: BTC price up + dominance up → BTC consolidates + dominance peaks → ETH/BTC bottoms and reverses → large-cap alts follow → speculative small-caps follow last.
Where most traders get burned: they skip the ETH/BTC confirmation and jump straight into small caps during the consolidation phase. They see BTC holding highs and assume rotation has begun — it has not.
Dominance is not a sentiment metric. It is a capital-flow map. Read it as a structural signal, not a prediction, and layer it with stablecoin velocity and exchange inflow data before making any rotation calls.
Patience at the BTC/ETH boundary is the real edge.
$BTC $ETH $BNB
#Bitcoin #AltcoinSeason #CryptoMarkets #BTCDominance #CryptoStrategy
BTC dominance is the cycle clock most altcoin traders ignore until it is too late.
When $BTC dominance rises — capital is consolidating. Investors are reducing risk, parking in the most liquid asset, or new money is entering via Bitcoin-first products like ETFs and corporate treasuries. This phase punishes altcoins even when BTC itself is flat.
The reversal signal is not a single-day drop in dominance. It is a sustained structural shift: dominance peaks and rolls over while $ETH maintains parity or gains relative to BTC. The ETH/BTC pair is the earliest altcoin rotation signal — ETH captures institutional overflow before retail reaches smaller caps.
The sequence historically runs: BTC price up + dominance up → BTC consolidates + dominance peaks → ETH/BTC bottoms and reverses → large-cap alts follow → speculative small-caps follow last.
Where most traders get burned: they skip the ETH/BTC confirmation and jump straight into small caps during the consolidation phase. They see BTC holding highs and assume rotation has begun — it has not.
Dominance is not a sentiment metric. It is a capital-flow map. Read it as a structural signal, not a prediction, and layer it with stablecoin velocity and exchange inflow data before making any rotation calls.
Patience at the BTC/ETH boundary is the real edge.
$BTC $ETH $BNB
#Bitcoin #AltcoinSeason #CryptoMarkets #BTCDominance #CryptoStrategy
When $BTC dominance rises — capital is consolidating. Investors are reducing risk, parking in the most liquid asset, or new money is entering via Bitcoin-first products like ETFs and corporate treasuries. This phase punishes altcoins even when BTC itself is flat.
The reversal signal is not a single-day drop in dominance. It is a sustained structural shift: dominance peaks and rolls over while $ETH maintains parity or gains relative to BTC. The ETH/BTC pair is the earliest altcoin rotation signal — ETH captures institutional overflow before retail reaches smaller caps.
The sequence historically runs: BTC price up + dominance up → BTC consolidates + dominance peaks → ETH/BTC bottoms and reverses → large-cap alts follow → speculative small-caps follow last.
Where most traders get burned: they skip the ETH/BTC confirmation and jump straight into small caps during the consolidation phase. They see BTC holding highs and assume rotation has begun — it has not.
Dominance is not a sentiment metric. It is a capital-flow map. Read it as a structural signal, not a prediction, and layer it with stablecoin velocity and exchange inflow data before making any rotation calls.
Patience at the BTC/ETH boundary is the real edge.
$BTC $ETH $BNB
#Bitcoin #AltcoinSeason #CryptoMarkets #BTCDominance #CryptoStrategy
52
·
--
Stablecoin supply growth is one of the most underrated altcoin season signals — and most traders never look at it.
Here is the logic: stablecoins parked on-chain represent dry powder waiting to deploy. When aggregate stablecoin market cap expands sharply — especially on L1s and DEX-heavy chains — it is fresh capital entering the ecosystem, not just rotating between coins. When that supply starts moving out of idle wallets and into protocol liquidity pools and spot markets, altcoin volume follows.
The sequence typically runs: $BTC leads price discovery → $ETH confirms risk appetite → stablecoin supply on alt-friendly chains spikes as traders pre-position → small-cap alts finally wake up.
The trap? Watching BTC dominance fall and assuming rotation has already begun. Dominance can drop while absolute BTC price rises, pulling alts up on paper but not in BTC terms. The cleaner tell is stablecoin velocity — how fast that parked capital is actually moving into risk.
DeFi TVL on $SOL is a secondary confirmation. Rising TVL alongside falling stablecoin idle supply means capital is genuinely deploying, not just sitting ready.
Bottom line: before you size into altcoin exposure, check where the stablecoins are going — not just where BTC dominance is trending.
#AltcoinSeason #CryptoMarkets #OnChainAnalysis #DeFi #CryptoStrategy
Stablecoin supply growth is one of the most underrated altcoin season signals — and most traders never look at it.
Here is the logic: stablecoins parked on-chain represent dry powder waiting to deploy. When aggregate stablecoin market cap expands sharply — especially on L1s and DEX-heavy chains — it is fresh capital entering the ecosystem, not just rotating between coins. When that supply starts moving out of idle wallets and into protocol liquidity pools and spot markets, altcoin volume follows.
The sequence typically runs: $BTC leads price discovery → $ETH confirms risk appetite → stablecoin supply on alt-friendly chains spikes as traders pre-position → small-cap alts finally wake up.
The trap? Watching BTC dominance fall and assuming rotation has already begun. Dominance can drop while absolute BTC price rises, pulling alts up on paper but not in BTC terms. The cleaner tell is stablecoin velocity — how fast that parked capital is actually moving into risk.
DeFi TVL on $SOL is a secondary confirmation. Rising TVL alongside falling stablecoin idle supply means capital is genuinely deploying, not just sitting ready.
Bottom line: before you size into altcoin exposure, check where the stablecoins are going — not just where BTC dominance is trending.
#AltcoinSeason #CryptoMarkets #OnChainAnalysis #DeFi #CryptoStrategy
Here is the logic: stablecoins parked on-chain represent dry powder waiting to deploy. When aggregate stablecoin market cap expands sharply — especially on L1s and DEX-heavy chains — it is fresh capital entering the ecosystem, not just rotating between coins. When that supply starts moving out of idle wallets and into protocol liquidity pools and spot markets, altcoin volume follows.
The sequence typically runs: $BTC leads price discovery → $ETH confirms risk appetite → stablecoin supply on alt-friendly chains spikes as traders pre-position → small-cap alts finally wake up.
The trap? Watching BTC dominance fall and assuming rotation has already begun. Dominance can drop while absolute BTC price rises, pulling alts up on paper but not in BTC terms. The cleaner tell is stablecoin velocity — how fast that parked capital is actually moving into risk.
DeFi TVL on $SOL is a secondary confirmation. Rising TVL alongside falling stablecoin idle supply means capital is genuinely deploying, not just sitting ready.
Bottom line: before you size into altcoin exposure, check where the stablecoins are going — not just where BTC dominance is trending.
#AltcoinSeason #CryptoMarkets #OnChainAnalysis #DeFi #CryptoStrategy
96

Altcoins are absolutely exploding right now ‼️‼️‼️
Here are this month's top-performing leaders:
• $QNT
{future}(QNTUSDT)
• $AKE
{future}(AKEUSDT)
• $BTW
{future}(BTWUSDT)
While the crowd stayed on the sidelines, these alts were quietly delivering massive rallies.
The market heat is officially picking up 🔥
#Altcoins #CryptoRally #CryptoNews #Bullish #AltcoinSeason
Altcoins are absolutely exploding right now ‼️‼️‼️
Here are this month's top-performing leaders:
• $QNT
• $AKE
• $BTW
While the crowd stayed on the sidelines, these alts were quietly delivering massive rallies.
The market heat is officially picking up 🔥
#Altcoins #CryptoRally #CryptoNews #Bullish #AltcoinSeason
Here are this month's top-performing leaders:
• $QNT
• $AKE
• $BTW
While the crowd stayed on the sidelines, these alts were quietly delivering massive rallies.
The market heat is officially picking up 🔥
#Altcoins #CryptoRally #CryptoNews #Bullish #AltcoinSeason
1
864
·
--
BTC dominance breaking down is one of the most watched altcoin season signals — but most traders read it wrong.
Dominance falling because BTC is selling off is not rotation. It is just a risk-off drawdown where everything falls and altcoins fall harder. That is not the altcoin season setup. That is the trap.
Real rotation looks different. $BTC holds flat or grinds higher while dominance still drops. That means fresh capital is flowing into the broader market, not fleeing it. The ETH/BTC ratio starts printing higher lows. $ETH ecosystem tokens begin outperforming on low-volume days. Small-cap beta — the sensitivity of altcoins to each point of BTC move — starts compressing, meaning alts are moving on their own merit rather than just leveraging BTC.
This compression is the real tell. When second-tier tokens start decoupling upward without a BTC catalyst, capital has rotated deep enough to sustain its own momentum.
The cascade sequence historically runs: BTC accumulation → ETH outperformance → $SOL and L1 broadening → small-cap beta explosion. Each phase has a different risk profile. Chasing phase four with phase-one sizing is where most cycles end badly.
Read dominance direction AND BTC price together. One without the other is noise.
#CryptoMarkets #AltcoinSeason #BTCDominance #CryptoAnalysis #Binance
BTC dominance breaking down is one of the most watched altcoin season signals — but most traders read it wrong.
Dominance falling because BTC is selling off is not rotation. It is just a risk-off drawdown where everything falls and altcoins fall harder. That is not the altcoin season setup. That is the trap.
Real rotation looks different. $BTC holds flat or grinds higher while dominance still drops. That means fresh capital is flowing into the broader market, not fleeing it. The ETH/BTC ratio starts printing higher lows. $ETH ecosystem tokens begin outperforming on low-volume days. Small-cap beta — the sensitivity of altcoins to each point of BTC move — starts compressing, meaning alts are moving on their own merit rather than just leveraging BTC.
This compression is the real tell. When second-tier tokens start decoupling upward without a BTC catalyst, capital has rotated deep enough to sustain its own momentum.
The cascade sequence historically runs: BTC accumulation → ETH outperformance → $SOL and L1 broadening → small-cap beta explosion. Each phase has a different risk profile. Chasing phase four with phase-one sizing is where most cycles end badly.
Read dominance direction AND BTC price together. One without the other is noise.
#CryptoMarkets #AltcoinSeason #BTCDominance #CryptoAnalysis #Binance
Dominance falling because BTC is selling off is not rotation. It is just a risk-off drawdown where everything falls and altcoins fall harder. That is not the altcoin season setup. That is the trap.
Real rotation looks different. $BTC holds flat or grinds higher while dominance still drops. That means fresh capital is flowing into the broader market, not fleeing it. The ETH/BTC ratio starts printing higher lows. $ETH ecosystem tokens begin outperforming on low-volume days. Small-cap beta — the sensitivity of altcoins to each point of BTC move — starts compressing, meaning alts are moving on their own merit rather than just leveraging BTC.
This compression is the real tell. When second-tier tokens start decoupling upward without a BTC catalyst, capital has rotated deep enough to sustain its own momentum.
The cascade sequence historically runs: BTC accumulation → ETH outperformance → $SOL and L1 broadening → small-cap beta explosion. Each phase has a different risk profile. Chasing phase four with phase-one sizing is where most cycles end badly.
Read dominance direction AND BTC price together. One without the other is noise.
#CryptoMarkets #AltcoinSeason #BTCDominance #CryptoAnalysis #Binance
100

·
--
𝗧𝗵𝗲 𝗺𝗮𝗿𝗸𝗲𝘁 𝗶𝘀 𝗽𝗿𝗶𝗰𝗶𝗻𝗴 𝗮𝗻 𝗮𝗹𝘁𝘀𝗲𝗮𝘀𝗼𝗻 𝘁𝗵𝗮𝘁 𝘁𝗵𝗲 𝗱𝗮𝘁𝗮 𝘀𝗮𝘆𝘀 𝗵𝗮𝘀 𝗻𝗼𝘁 𝘀𝘁𝗮𝗿𝘁𝗲𝗱 ❔
Here is a number worth sitting with: the Altcoin Season Index reads 37 out of 100. Altseason needs 75.
Now look at the board. PUMPBTCUSDT down 29.5 percent after Binance announced it will delist and settle the contract on October 5. Beneath it, a full roster of pain — 100000BOB at minus 20, $QNT CYPH and BLUAI all near minus 12, SOON at minus 10, then NEAR on both quote pairs, followed by SKDD, AMC, ONG, SHAZ, MET, ENA on two venues, BERA, TEM, $ZEC across USDT and USDC, SEC, ON, then WLD and BLUR side by side, POWER, Q listed twice, APR, Z2, ALPHA, KMN, 4, FLOCK, $ESPORTS OG, and finally HBAR on both pairs closing near minus 5.
Twenty nine names. One direction.
Meanwhile Bitcoin trades around 84,600, dominance sits near 58 percent, and Glassnode data shows 85 percent of altcoins carrying funding rates above their mean — the highest since Bitcoin traded at record levels.
Read that twice. Futures traders are paying premium to long altcoins at the exact moment the rotation index says there is no rotation.
This is what denial looks like on a leaderboard. Leveraged longs waiting for a season the tape refuses to deliver, funding bleeding out while dominance holds.
History is blunt about this setup. Every confirmed altseason was preceded by Bitcoin leading and ETH strengthening against it. Neither is happening. What is happening is forced exits, delistings, and longs paying rent on underwater positions.
The board is not a buying list. It is a warning label.
Which name on that list are you still holding — and is it conviction or is it funding fees talking?
Not financial advice. Do your own research.
#bitcoin #altcoinseason #BinanceSquare #cryptotrading #MarketAnalysis
𝗧𝗵𝗲 𝗺𝗮𝗿𝗸𝗲𝘁 𝗶𝘀 𝗽𝗿𝗶𝗰𝗶𝗻𝗴 𝗮𝗻 𝗮𝗹𝘁𝘀𝗲𝗮𝘀𝗼𝗻 𝘁𝗵𝗮𝘁 𝘁𝗵𝗲 𝗱𝗮𝘁𝗮 𝘀𝗮𝘆𝘀 𝗵𝗮𝘀 𝗻𝗼𝘁 𝘀𝘁𝗮𝗿𝘁𝗲𝗱 ❔
Here is a number worth sitting with: the Altcoin Season Index reads 37 out of 100. Altseason needs 75.
Now look at the board. PUMPBTCUSDT down 29.5 percent after Binance announced it will delist and settle the contract on October 5. Beneath it, a full roster of pain — 100000BOB at minus 20, $QNT CYPH and BLUAI all near minus 12, SOON at minus 10, then NEAR on both quote pairs, followed by SKDD, AMC, ONG, SHAZ, MET, ENA on two venues, BERA, TEM, $ZEC across USDT and USDC, SEC, ON, then WLD and BLUR side by side, POWER, Q listed twice, APR, Z2, ALPHA, KMN, 4, FLOCK, $ESPORTS OG, and finally HBAR on both pairs closing near minus 5.
Twenty nine names. One direction.
Meanwhile Bitcoin trades around 84,600, dominance sits near 58 percent, and Glassnode data shows 85 percent of altcoins carrying funding rates above their mean — the highest since Bitcoin traded at record levels.
Read that twice. Futures traders are paying premium to long altcoins at the exact moment the rotation index says there is no rotation.
This is what denial looks like on a leaderboard. Leveraged longs waiting for a season the tape refuses to deliver, funding bleeding out while dominance holds.
History is blunt about this setup. Every confirmed altseason was preceded by Bitcoin leading and ETH strengthening against it. Neither is happening. What is happening is forced exits, delistings, and longs paying rent on underwater positions.
The board is not a buying list. It is a warning label.
Which name on that list are you still holding — and is it conviction or is it funding fees talking?
Not financial advice. Do your own research.
#bitcoin #altcoinseason #BinanceSquare #cryptotrading #MarketAnalysis
Here is a number worth sitting with: the Altcoin Season Index reads 37 out of 100. Altseason needs 75.
Now look at the board. PUMPBTCUSDT down 29.5 percent after Binance announced it will delist and settle the contract on October 5. Beneath it, a full roster of pain — 100000BOB at minus 20, $QNT CYPH and BLUAI all near minus 12, SOON at minus 10, then NEAR on both quote pairs, followed by SKDD, AMC, ONG, SHAZ, MET, ENA on two venues, BERA, TEM, $ZEC across USDT and USDC, SEC, ON, then WLD and BLUR side by side, POWER, Q listed twice, APR, Z2, ALPHA, KMN, 4, FLOCK, $ESPORTS OG, and finally HBAR on both pairs closing near minus 5.
Twenty nine names. One direction.
Meanwhile Bitcoin trades around 84,600, dominance sits near 58 percent, and Glassnode data shows 85 percent of altcoins carrying funding rates above their mean — the highest since Bitcoin traded at record levels.
Read that twice. Futures traders are paying premium to long altcoins at the exact moment the rotation index says there is no rotation.
This is what denial looks like on a leaderboard. Leveraged longs waiting for a season the tape refuses to deliver, funding bleeding out while dominance holds.
History is blunt about this setup. Every confirmed altseason was preceded by Bitcoin leading and ETH strengthening against it. Neither is happening. What is happening is forced exits, delistings, and longs paying rent on underwater positions.
The board is not a buying list. It is a warning label.
Which name on that list are you still holding — and is it conviction or is it funding fees talking?
Not financial advice. Do your own research.
#bitcoin #altcoinseason #BinanceSquare #cryptotrading #MarketAnalysis

1
57

·
--
Рост
#EtherGains70.9%InQ3 $BTC 🚨 5 DAYS ABOVE 60… IS ALTCOIN SEASON WAKING UP? 👀
Something interesting is happening beneath the crypto market. 📊
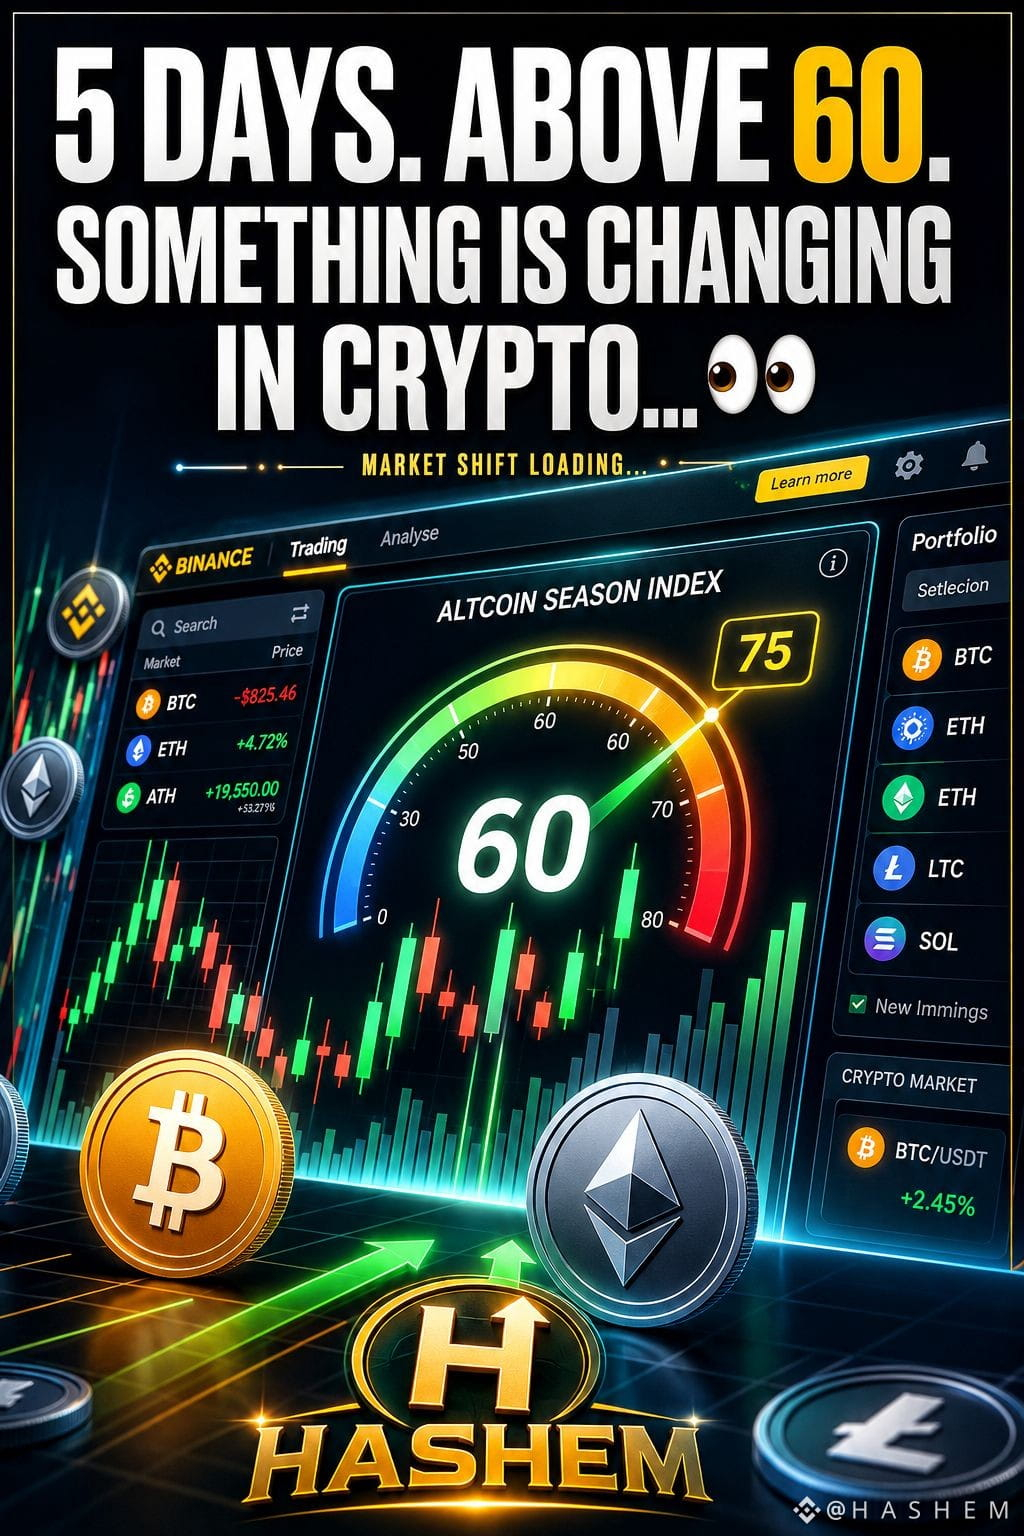
🔥 The Altcoin Season Index has remained above 60 for 5 consecutive days.
That may not officially qualify as “Altcoin Season” yet—but it’s a signal traders are starting to watch closely.
🎯 60 = Early Signal
🚀 75 = Stronger Confirmation
Now comes the real question:
Are we seeing the early stages of capital rotation into altcoins… or just another temporary market move? 🤔
If the index continues climbing while $BTC stays relatively stable, attention could gradually shift toward $ETH and selected altcoins. ⚡
The signal is getting louder.
But remember—confirmation matters more than excitement. 📈
👀 Would you call this the beginning of Altcoin Season, or is it too early?
#AltcoinSeason #Crypto #Bitcoin #BTC #Ethereum #ETH #CryptoMarket #CryptoTrading
{spot}(BTCUSDT)
{spot}(ETCUSDT)
{spot}(BNBUSDT)
#EtherGains70.9%InQ3 $BTC 🚨 5 DAYS ABOVE 60… IS ALTCOIN SEASON WAKING UP? 👀
Something interesting is happening beneath the crypto market. 📊
🔥 The Altcoin Season Index has remained above 60 for 5 consecutive days.
That may not officially qualify as “Altcoin Season” yet—but it’s a signal traders are starting to watch closely.
🎯 60 = Early Signal
🚀 75 = Stronger Confirmation
Now comes the real question:
Are we seeing the early stages of capital rotation into altcoins… or just another temporary market move? 🤔
If the index continues climbing while $BTC stays relatively stable, attention could gradually shift toward $ETH and selected altcoins. ⚡
The signal is getting louder.
But remember—confirmation matters more than excitement. 📈
👀 Would you call this the beginning of Altcoin Season, or is it too early?
#AltcoinSeason #Crypto #Bitcoin #BTC #Ethereum #ETH #CryptoMarket #CryptoTrading
Something interesting is happening beneath the crypto market. 📊
🔥 The Altcoin Season Index has remained above 60 for 5 consecutive days.
That may not officially qualify as “Altcoin Season” yet—but it’s a signal traders are starting to watch closely.
🎯 60 = Early Signal
🚀 75 = Stronger Confirmation
Now comes the real question:
Are we seeing the early stages of capital rotation into altcoins… or just another temporary market move? 🤔
If the index continues climbing while $BTC stays relatively stable, attention could gradually shift toward $ETH and selected altcoins. ⚡
The signal is getting louder.
But remember—confirmation matters more than excitement. 📈
👀 Would you call this the beginning of Altcoin Season, or is it too early?
#AltcoinSeason #Crypto #Bitcoin #BTC #Ethereum #ETH #CryptoMarket #CryptoTrading
60

🔥 It’s Official: L1 Altcoins Are Outperforming Bitcoin! 🚀
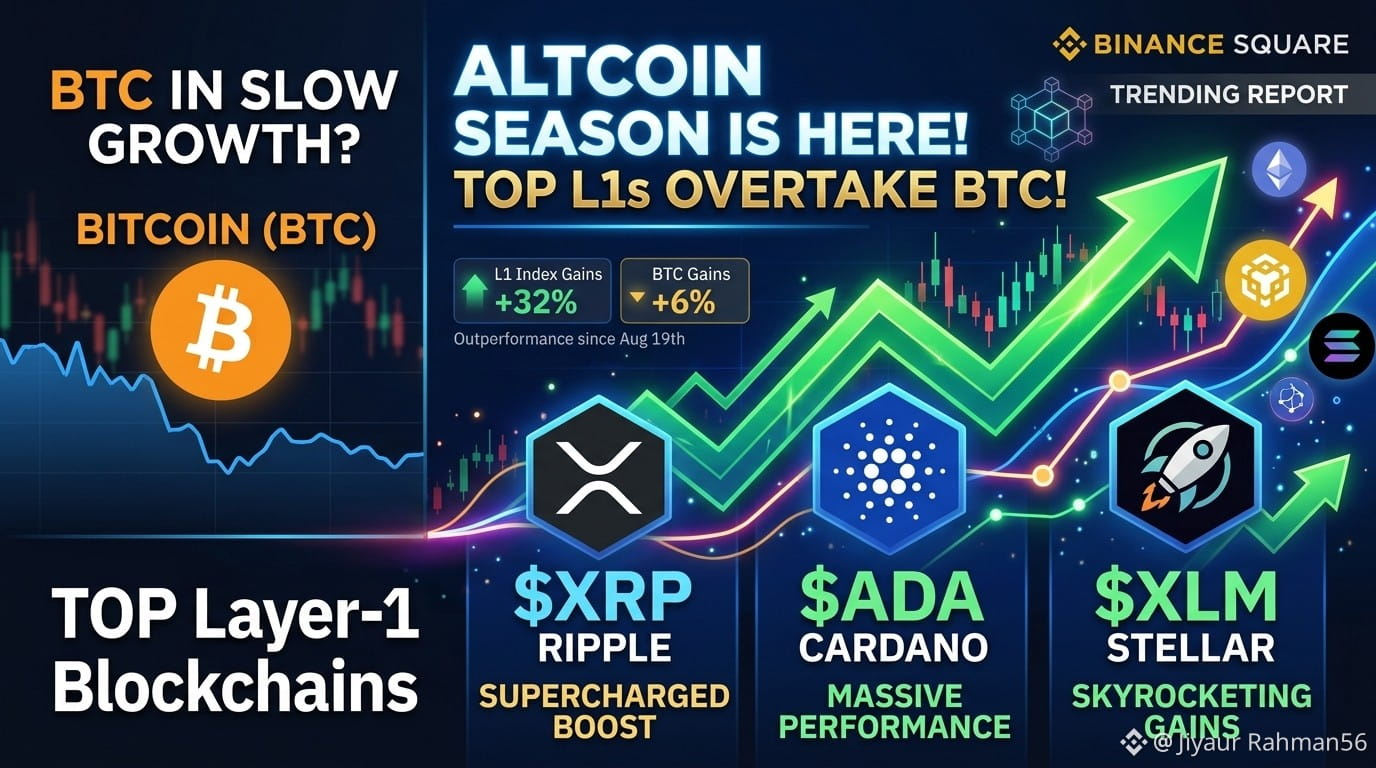
Back-testing data reveals that over the past two months, a basket of top Layer-1 blockchains has officially outpaced $BTC ! 📈
Since mid-August, major L1 assets have shown relative strength against Bitcoin, signaling a strong shift in market momentum.
Key L1 Performers Leading the Charge: 🔹 Ripple ($XRP ) 🔹 Cardano ($ADA ) 🔹 Stellar $XLM
As capital rotates across major blockchain ecosystems, are we heading into a full-blown Altcoin Season?
What’s your top-performing L1 holding right now? Let us know in the comments! 👇
#AltcoinSeason #L1Blockchains #XRP #XLM #BinanceSquare
{spot}(XLMUSDT)
{spot}(XRPUSDT)
{spot}(BTCUSDT)
🔥 It’s Official: L1 Altcoins Are Outperforming Bitcoin! 🚀
Back-testing data reveals that over the past two months, a basket of top Layer-1 blockchains has officially outpaced $BTC ! 📈
Since mid-August, major L1 assets have shown relative strength against Bitcoin, signaling a strong shift in market momentum.
Key L1 Performers Leading the Charge: 🔹 Ripple ($XRP ) 🔹 Cardano ($ADA ) 🔹 Stellar $XLM
As capital rotates across major blockchain ecosystems, are we heading into a full-blown Altcoin Season?
What’s your top-performing L1 holding right now? Let us know in the comments! 👇
#AltcoinSeason #L1Blockchains #XRP #XLM #BinanceSquare
Back-testing data reveals that over the past two months, a basket of top Layer-1 blockchains has officially outpaced $BTC ! 📈
Since mid-August, major L1 assets have shown relative strength against Bitcoin, signaling a strong shift in market momentum.
Key L1 Performers Leading the Charge: 🔹 Ripple ($XRP ) 🔹 Cardano ($ADA ) 🔹 Stellar $XLM
As capital rotates across major blockchain ecosystems, are we heading into a full-blown Altcoin Season?
What’s your top-performing L1 holding right now? Let us know in the comments! 👇
#AltcoinSeason #L1Blockchains #XRP #XLM #BinanceSquare
169

·
--
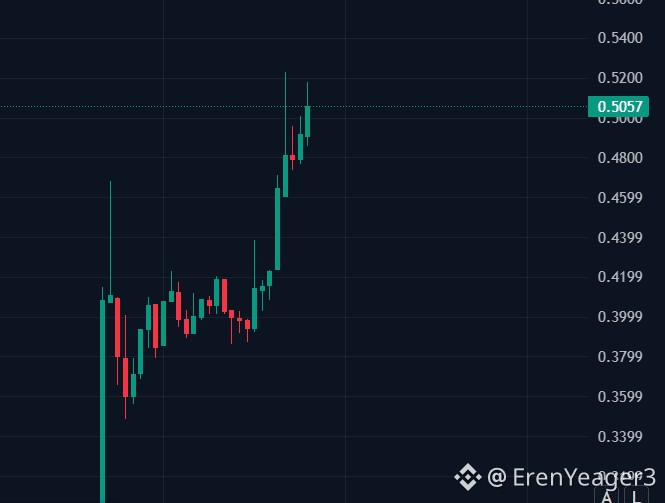
$CT (1H): BULLISH BREAKOUT IN PROGRESS 🚀
🎯 Key levels: Entry $0.42–$0.45 · Targets $0.50 / $0.55 / $0.60 · Invalidation $0.3742
Bias is bullish on the 1H chart as $CT has broken out strongly from its previous consolidation range and is now trading around $0.50. The chart shows a clear sequence of higher highs and higher lows, with buyers taking control after the extended sideways movement around $0.38–$0.42.
The strong expansion above $0.42–$0.45 confirms increased buying pressure and opens the possibility for further upside. However, after such a sharp move, a pullback or short consolidation could happen before continuation.
The ideal entry zone remains around $0.42–$0.45, where a retest of the breakout area could offer a better risk-to-reward opportunity. A bullish rejection from this zone would strengthen the continuation setup.
If momentum holds, $0.53 is the first important target, followed by $0.55 and potentially $0.60. The bullish structure would be invalidated if price loses the $0.3742 area with strong selling pressure.
For now, $CT is showing strong momentum — the key is whether buyers can maintain the breakout and push toward the next resistance levels. 🔥
#AltcoinSeason #BNBChain #Crypto
{alpha}(560x0a092e544da31150b439a1aaa1a3a2214a867f46)
{future}(CTUSDT)
$CT (1H): BULLISH BREAKOUT IN PROGRESS 🚀
🎯 Key levels: Entry $0.42–$0.45 · Targets $0.50 / $0.55 / $0.60 · Invalidation $0.3742
Bias is bullish on the 1H chart as $CT has broken out strongly from its previous consolidation range and is now trading around $0.50. The chart shows a clear sequence of higher highs and higher lows, with buyers taking control after the extended sideways movement around $0.38–$0.42.
The strong expansion above $0.42–$0.45 confirms increased buying pressure and opens the possibility for further upside. However, after such a sharp move, a pullback or short consolidation could happen before continuation.
The ideal entry zone remains around $0.42–$0.45, where a retest of the breakout area could offer a better risk-to-reward opportunity. A bullish rejection from this zone would strengthen the continuation setup.
If momentum holds, $0.53 is the first important target, followed by $0.55 and potentially $0.60. The bullish structure would be invalidated if price loses the $0.3742 area with strong selling pressure.
For now, $CT is showing strong momentum — the key is whether buyers can maintain the breakout and push toward the next resistance levels. 🔥
#AltcoinSeason #BNBChain #Crypto
🎯 Key levels: Entry $0.42–$0.45 · Targets $0.50 / $0.55 / $0.60 · Invalidation $0.3742
Bias is bullish on the 1H chart as $CT has broken out strongly from its previous consolidation range and is now trading around $0.50. The chart shows a clear sequence of higher highs and higher lows, with buyers taking control after the extended sideways movement around $0.38–$0.42.
The strong expansion above $0.42–$0.45 confirms increased buying pressure and opens the possibility for further upside. However, after such a sharp move, a pullback or short consolidation could happen before continuation.
The ideal entry zone remains around $0.42–$0.45, where a retest of the breakout area could offer a better risk-to-reward opportunity. A bullish rejection from this zone would strengthen the continuation setup.
If momentum holds, $0.53 is the first important target, followed by $0.55 and potentially $0.60. The bullish structure would be invalidated if price loses the $0.3742 area with strong selling pressure.
For now, $CT is showing strong momentum — the key is whether buyers can maintain the breakout and push toward the next resistance levels. 🔥
#AltcoinSeason #BNBChain #Crypto
399

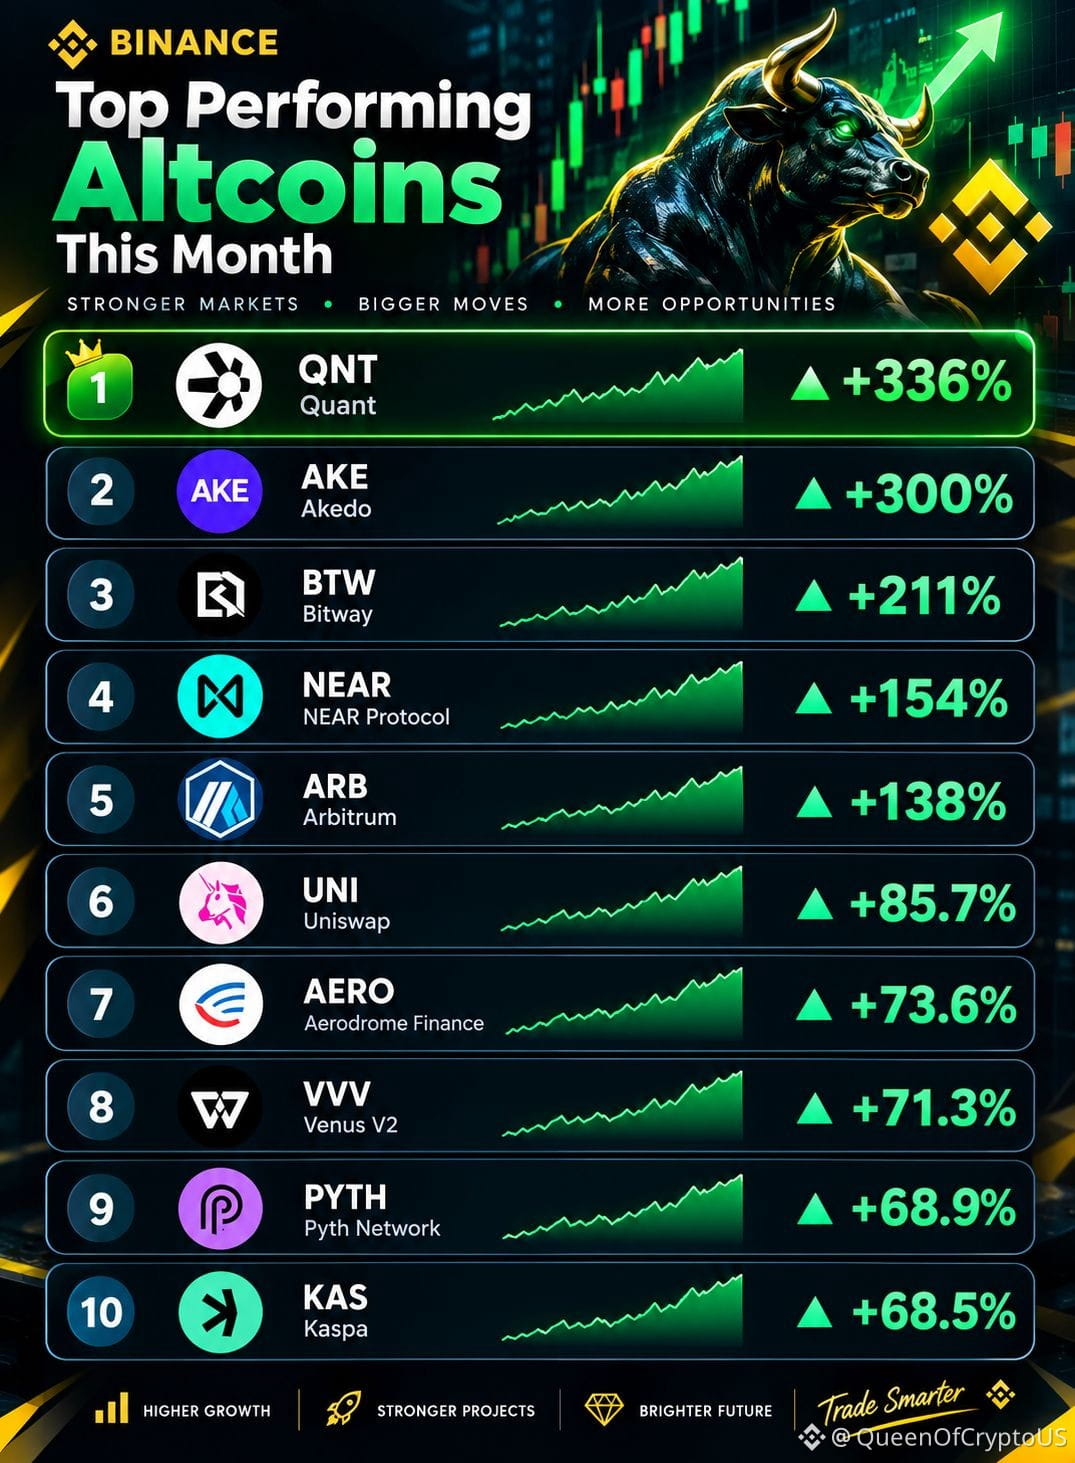
🚀 ALTCOIN MOMENTUM IS BUILDING!
Altcoin market is showing strong momentum, and several projects are delivering impressive moves this month. 📈
🔥 Top Movers:
1️⃣ QNT — +336%
2️⃣ AKE — +300%
3️⃣ BTW — +211%
4️⃣ NEAR — +154%
5️⃣ ARB — +138%
6️⃣ UNI — +85.7%
7️⃣ AERO — +73.6%
8️⃣ VVV — +71.3%
9️⃣ PYTH — +68.9%
🔟 KAS — +68.5%
The real question is: Are we entering a stronger altcoin phase, or could the market cool down with another pullback? 👀
I’m watching volume, support zones, and market structure instead of blindly chasing pumps.
🎯 Which altcoin has your attention right now?
Drop the ticker below. 👇
📊 Follow for daily crypto updates, market insights & trading education.
#Altcoins #AltcoinSeason #crypto #cryptotrading
{future}(QNTUSDT)
{future}(AKEUSDT)
{future}(BTWUSDT)
🚀 ALTCOIN MOMENTUM IS BUILDING!
Altcoin market is showing strong momentum, and several projects are delivering impressive moves this month. 📈
🔥 Top Movers:
1️⃣ QNT — +336%
2️⃣ AKE — +300%
3️⃣ BTW — +211%
4️⃣ NEAR — +154%
5️⃣ ARB — +138%
6️⃣ UNI — +85.7%
7️⃣ AERO — +73.6%
8️⃣ VVV — +71.3%
9️⃣ PYTH — +68.9%
🔟 KAS — +68.5%
The real question is: Are we entering a stronger altcoin phase, or could the market cool down with another pullback? 👀
I’m watching volume, support zones, and market structure instead of blindly chasing pumps.
🎯 Which altcoin has your attention right now?
Drop the ticker below. 👇
📊 Follow for daily crypto updates, market insights & trading education.
#Altcoins #AltcoinSeason #crypto #cryptotrading
Altcoin market is showing strong momentum, and several projects are delivering impressive moves this month. 📈
🔥 Top Movers:
1️⃣ QNT — +336%
2️⃣ AKE — +300%
3️⃣ BTW — +211%
4️⃣ NEAR — +154%
5️⃣ ARB — +138%
6️⃣ UNI — +85.7%
7️⃣ AERO — +73.6%
8️⃣ VVV — +71.3%
9️⃣ PYTH — +68.9%
🔟 KAS — +68.5%
The real question is: Are we entering a stronger altcoin phase, or could the market cool down with another pullback? 👀
I’m watching volume, support zones, and market structure instead of blindly chasing pumps.
🎯 Which altcoin has your attention right now?
Drop the ticker below. 👇
📊 Follow for daily crypto updates, market insights & trading education.
#Altcoins #AltcoinSeason #crypto #cryptotrading
3
1.9k

Статья
What keeps catching my attention is that the breadth is holdingThe more I watch the Altcoin Season Index hold above 60, the more I’m starting to think I was looking at the wrong number.
At first, I thought the obvious story was: “Altseason might be starting.”
But… I’m not sure that’s actually the interesting part. 👀
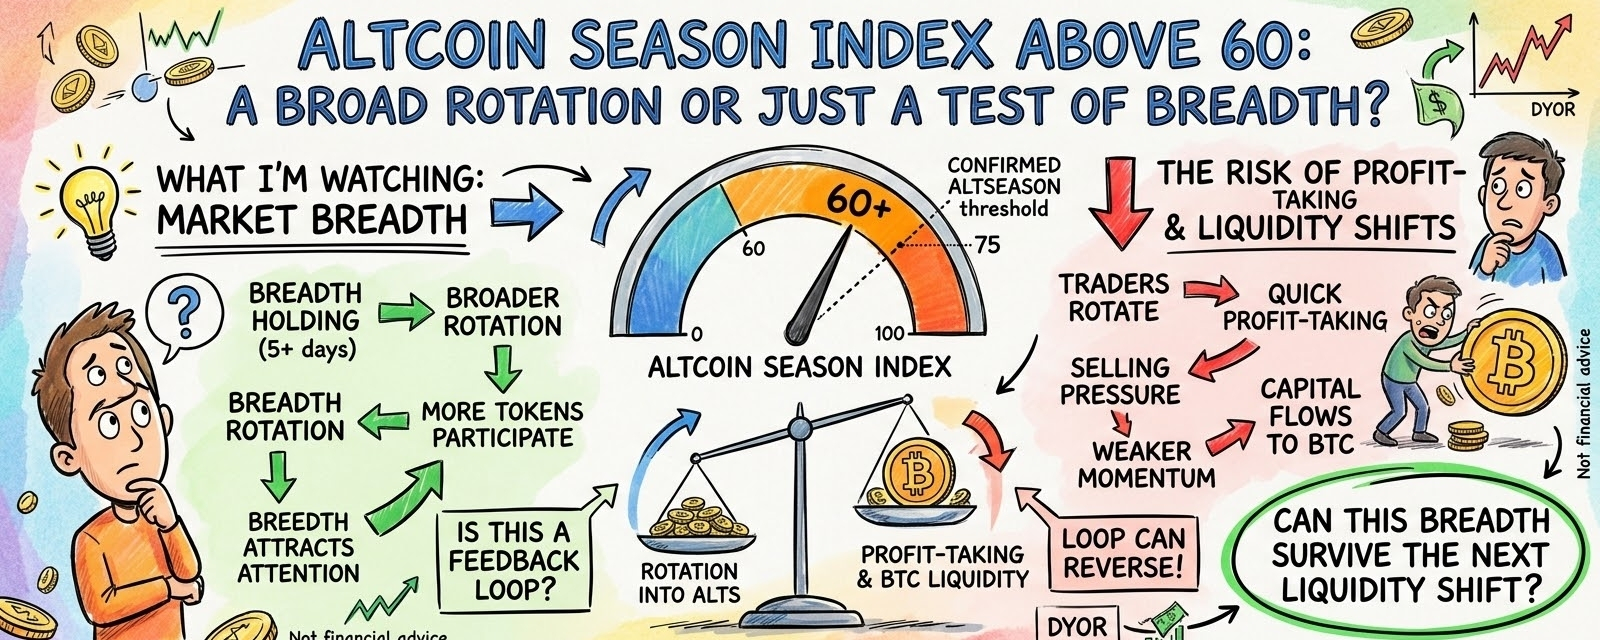
What keeps catching my attention is that the breadth is holding.
The index has stayed above 60 for five consecutive days, which makes me wonder whether this is becoming a broader rotation rather than a few altcoins randomly outperforming $BTC.
And that changes how I look at the move.
If more altcoins outperform $BTC → traders notice → capital rotates → more tokens participate → breadth improves.
Then that stronger breadth attracts even more attention.
That’s the loop I’m watching. 🧵
But there’s something I don’t want to ignore.
A reading above 60 still isn’t the same thing as a confirmed Altcoin Season. The commonly used threshold is 75, so we’re not there yet.
Which makes this feel more like a test of market breadth than a conclusion.
The part I’m still trying to figure out is what happens to the capital behind that breadth.
Because if traders rotate into altcoins, but quickly take profits, the loop can reverse:
profit-taking → selling pressure → weaker momentum → less attention → weaker rotation.
And then $BTC becomes important again.
If Bitcoin stays relatively calm while altcoins keep gaining strength, the rotation has room to develop.
But if $BTC suddenly pulls liquidity back toward itself, that same altcoin breadth could disappear surprisingly fast.
This only works if capital keeps rotating into altcoins faster than profit-taking and Bitcoin can absorb that liquidity.
That’s the constraint I’m watching now.
So I’m less interested in asking, “Are we in altseason?”
I’m starting to ask a different question:
Can this breadth survive the next liquidity shift? 🤔
Because 60+ feels interesting…
…but maybe the real signal is what happens after everyone starts believing it.
Not financial advice. Always DYOR.
What keeps catching my attention is that the breadth is holding
The more I watch the Altcoin Season Index hold above 60, the more I’m starting to think I was looking at the wrong number.
At first, I thought the obvious story was: “Altseason might be starting.”
But… I’m not sure that’s actually the interesting part. 👀
What keeps catching my attention is that the breadth is holding.
The index has stayed above 60 for five consecutive days, which makes me wonder whether this is becoming a broader rotation rather than a few altcoins randomly outperforming $BTC.
And that changes how I look at the move.
If more altcoins outperform $BTC → traders notice → capital rotates → more tokens participate → breadth improves.
Then that stronger breadth attracts even more attention.
That’s the loop I’m watching. 🧵
But there’s something I don’t want to ignore.
A reading above 60 still isn’t the same thing as a confirmed Altcoin Season. The commonly used threshold is 75, so we’re not there yet.
Which makes this feel more like a test of market breadth than a conclusion.
The part I’m still trying to figure out is what happens to the capital behind that breadth.
Because if traders rotate into altcoins, but quickly take profits, the loop can reverse:
profit-taking → selling pressure → weaker momentum → less attention → weaker rotation.
And then $BTC becomes important again.
If Bitcoin stays relatively calm while altcoins keep gaining strength, the rotation has room to develop.
But if $BTC suddenly pulls liquidity back toward itself, that same altcoin breadth could disappear surprisingly fast.
This only works if capital keeps rotating into altcoins faster than profit-taking and Bitcoin can absorb that liquidity.
That’s the constraint I’m watching now.
So I’m less interested in asking, “Are we in altseason?”
I’m starting to ask a different question:
Can this breadth survive the next liquidity shift? 🤔
Because 60+ feels interesting…
…but maybe the real signal is what happens after everyone starts believing it.
Not financial advice. Always DYOR.
At first, I thought the obvious story was: “Altseason might be starting.”
But… I’m not sure that’s actually the interesting part. 👀
What keeps catching my attention is that the breadth is holding.
The index has stayed above 60 for five consecutive days, which makes me wonder whether this is becoming a broader rotation rather than a few altcoins randomly outperforming $BTC.
And that changes how I look at the move.
If more altcoins outperform $BTC → traders notice → capital rotates → more tokens participate → breadth improves.
Then that stronger breadth attracts even more attention.
That’s the loop I’m watching. 🧵
But there’s something I don’t want to ignore.
A reading above 60 still isn’t the same thing as a confirmed Altcoin Season. The commonly used threshold is 75, so we’re not there yet.
Which makes this feel more like a test of market breadth than a conclusion.
The part I’m still trying to figure out is what happens to the capital behind that breadth.
Because if traders rotate into altcoins, but quickly take profits, the loop can reverse:
profit-taking → selling pressure → weaker momentum → less attention → weaker rotation.
And then $BTC becomes important again.
If Bitcoin stays relatively calm while altcoins keep gaining strength, the rotation has room to develop.
But if $BTC suddenly pulls liquidity back toward itself, that same altcoin breadth could disappear surprisingly fast.
This only works if capital keeps rotating into altcoins faster than profit-taking and Bitcoin can absorb that liquidity.
That’s the constraint I’m watching now.
So I’m less interested in asking, “Are we in altseason?”
I’m starting to ask a different question:
Can this breadth survive the next liquidity shift? 🤔
Because 60+ feels interesting…
…but maybe the real signal is what happens after everyone starts believing it.
Not financial advice. Always DYOR.
1
126


#altcoinseasonindexholdsabove60for5days
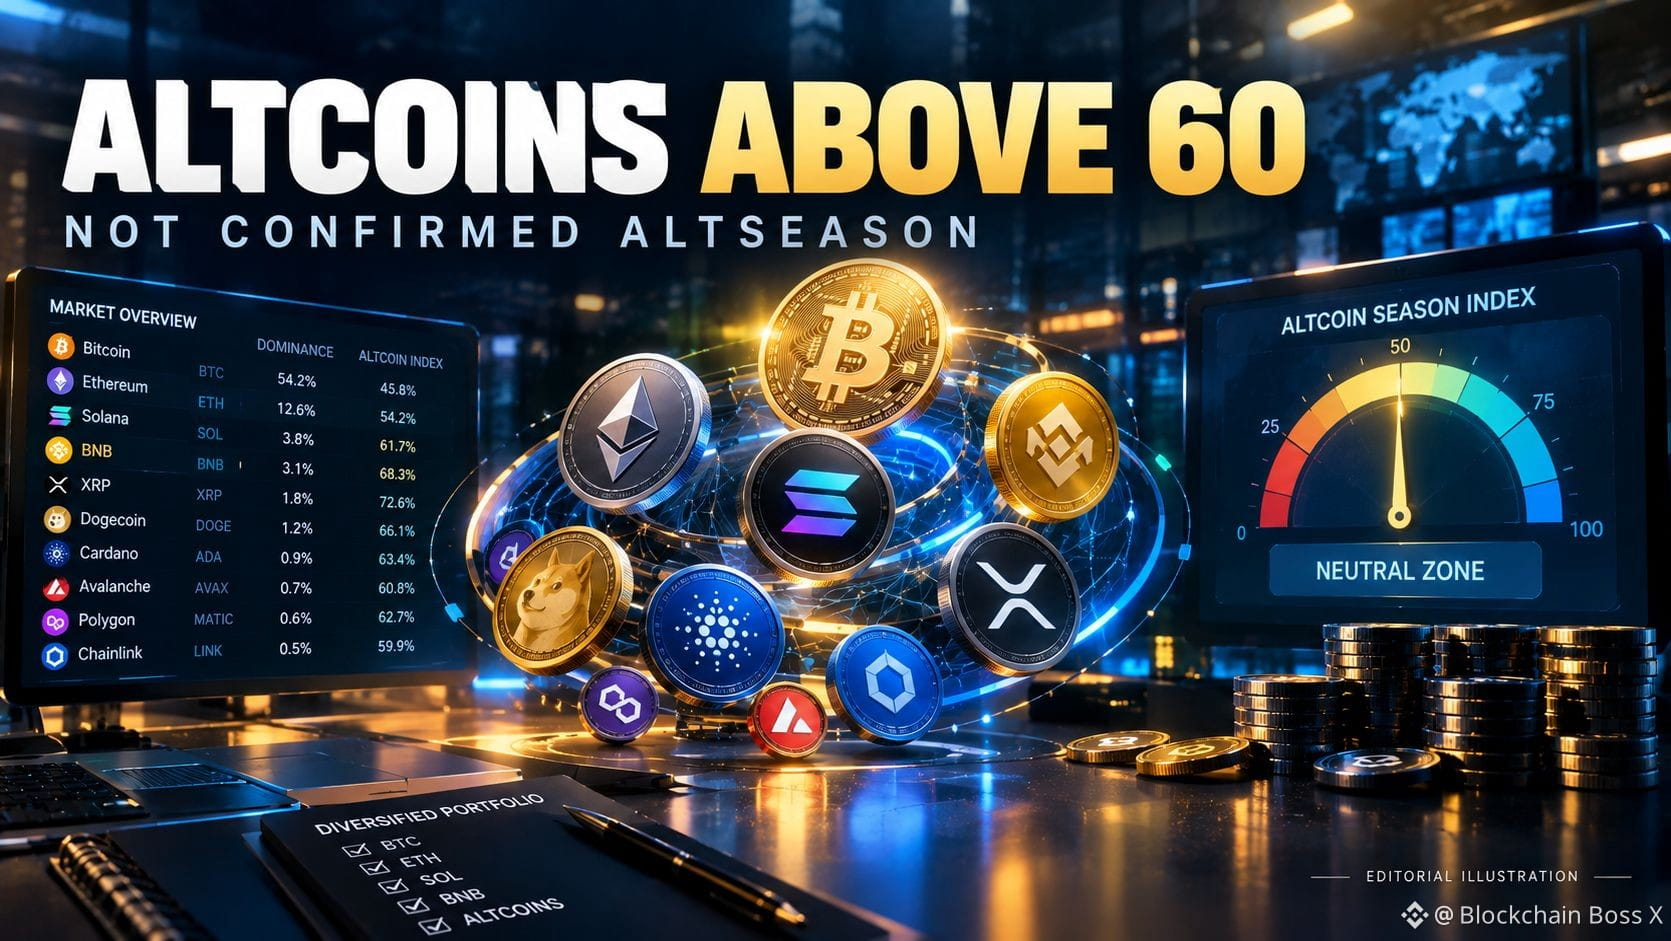
Altcoin Season Index Holds Above 60—but the Signal Isn’t Confirmed Yet
Altcoins are showing broader relative strength, but the market has not officially entered “altcoin season.”
The latest readings are mixed by provider. BlockchainCenter’s Top 50 index showed 59 on September 30, while other trackers reported readings in the low-to-high 60s. That means the claim that the index has remained above 60 for five straight days depends on the methodology and data source being used.blockchaincenter+2
The important threshold is 75. BlockchainCenter defines altcoin season as at least 75% of its eligible Top 50 coins outperforming Bitcoin over a rolling 90-day period. Its index remains in the neutral range of 26–74, and the last transition from Bitcoin Season to Neutral occurred on September 2.
My take: A sustained reading above 60 would indicate that market breadth is improving, but it is not proof of a broad altcoin cycle. The rally may still be concentrated in selected large-cap tokens or specific narratives. Confirmation would require the index to reach 75, Bitcoin dominance to weaken in a sustained way and performance to broaden across sectors rather than remain limited to a few leaders.
For now, traders should treat the data as an early rotation signal—not a confirmed altseason call. Which metric do you use to identify a genuine altcoin cycle?
#altcoinseason #altcoins #CryptoMarket
$BTC $NOM $AGT
{future}(AGTUSDT)
{future}(NOMUSDT)
{future}(BTCUSDT)
#altcoinseasonindexholdsabove60for5days
Altcoin Season Index Holds Above 60—but the Signal Isn’t Confirmed Yet
Altcoins are showing broader relative strength, but the market has not officially entered “altcoin season.”
The latest readings are mixed by provider. BlockchainCenter’s Top 50 index showed 59 on September 30, while other trackers reported readings in the low-to-high 60s. That means the claim that the index has remained above 60 for five straight days depends on the methodology and data source being used.blockchaincenter+2
The important threshold is 75. BlockchainCenter defines altcoin season as at least 75% of its eligible Top 50 coins outperforming Bitcoin over a rolling 90-day period. Its index remains in the neutral range of 26–74, and the last transition from Bitcoin Season to Neutral occurred on September 2.
My take: A sustained reading above 60 would indicate that market breadth is improving, but it is not proof of a broad altcoin cycle. The rally may still be concentrated in selected large-cap tokens or specific narratives. Confirmation would require the index to reach 75, Bitcoin dominance to weaken in a sustained way and performance to broaden across sectors rather than remain limited to a few leaders.
For now, traders should treat the data as an early rotation signal—not a confirmed altseason call. Which metric do you use to identify a genuine altcoin cycle?
#altcoinseason #altcoins #CryptoMarket
$BTC $NOM $AGT
Altcoin Season Index Holds Above 60—but the Signal Isn’t Confirmed Yet
Altcoins are showing broader relative strength, but the market has not officially entered “altcoin season.”
The latest readings are mixed by provider. BlockchainCenter’s Top 50 index showed 59 on September 30, while other trackers reported readings in the low-to-high 60s. That means the claim that the index has remained above 60 for five straight days depends on the methodology and data source being used.blockchaincenter+2
The important threshold is 75. BlockchainCenter defines altcoin season as at least 75% of its eligible Top 50 coins outperforming Bitcoin over a rolling 90-day period. Its index remains in the neutral range of 26–74, and the last transition from Bitcoin Season to Neutral occurred on September 2.
My take: A sustained reading above 60 would indicate that market breadth is improving, but it is not proof of a broad altcoin cycle. The rally may still be concentrated in selected large-cap tokens or specific narratives. Confirmation would require the index to reach 75, Bitcoin dominance to weaken in a sustained way and performance to broaden across sectors rather than remain limited to a few leaders.
For now, traders should treat the data as an early rotation signal—not a confirmed altseason call. Which metric do you use to identify a genuine altcoin cycle?
#altcoinseason #altcoins #CryptoMarket
$BTC $NOM $AGT
490
·
--
Altcoin season has a tell. Most people wait to feel it. By then, the move is mostly done.
The signal to watch is $BTC dominance — the share of total crypto market cap held in Bitcoin. When dominance rises, capital is crowding into the safest bet. When it peaks and starts rolling over, it means that capital has found enough conviction to reach for risk. That rotation is the mechanical engine behind altcoin rallies.
But dominance alone is a lagging read. The early signal comes from the $ETH vs BTC price ratio. ETH is the first stop for capital leaving Bitcoin — large, liquid, and institutionally legible. When ETH/BTC is making higher lows while BTC still holds its range, the rotation is starting, not ending.
From ETH, the flow cascades. Mid-cap L1s like $SOL typically move next, repricing against ETH rather than USD. Small-cap alts follow last — loudest gains, shortest window, fastest reversal.
The trap is chasing the cascade tail. By the time low-cap alts trend on social media, the institutional capital that moved the ratio has already taken profit and rotated back toward BTC quality.
Read the ETH/BTC ratio. Watch BTC dominance slope. Size entries before the rotation is obvious, not after.
The calendar does not create altcoin season. Capital flow sequencing does.
#AltcoinSeason #CryptoMarkets #BTCDominance #CryptoStrategy #Altcoins
Altcoin season has a tell. Most people wait to feel it. By then, the move is mostly done.
The signal to watch is $BTC dominance — the share of total crypto market cap held in Bitcoin. When dominance rises, capital is crowding into the safest bet. When it peaks and starts rolling over, it means that capital has found enough conviction to reach for risk. That rotation is the mechanical engine behind altcoin rallies.
But dominance alone is a lagging read. The early signal comes from the $ETH vs BTC price ratio. ETH is the first stop for capital leaving Bitcoin — large, liquid, and institutionally legible. When ETH/BTC is making higher lows while BTC still holds its range, the rotation is starting, not ending.
From ETH, the flow cascades. Mid-cap L1s like $SOL typically move next, repricing against ETH rather than USD. Small-cap alts follow last — loudest gains, shortest window, fastest reversal.
The trap is chasing the cascade tail. By the time low-cap alts trend on social media, the institutional capital that moved the ratio has already taken profit and rotated back toward BTC quality.
Read the ETH/BTC ratio. Watch BTC dominance slope. Size entries before the rotation is obvious, not after.
The calendar does not create altcoin season. Capital flow sequencing does.
#AltcoinSeason #CryptoMarkets #BTCDominance #CryptoStrategy #Altcoins
The signal to watch is $BTC dominance — the share of total crypto market cap held in Bitcoin. When dominance rises, capital is crowding into the safest bet. When it peaks and starts rolling over, it means that capital has found enough conviction to reach for risk. That rotation is the mechanical engine behind altcoin rallies.
But dominance alone is a lagging read. The early signal comes from the $ETH vs BTC price ratio. ETH is the first stop for capital leaving Bitcoin — large, liquid, and institutionally legible. When ETH/BTC is making higher lows while BTC still holds its range, the rotation is starting, not ending.
From ETH, the flow cascades. Mid-cap L1s like $SOL typically move next, repricing against ETH rather than USD. Small-cap alts follow last — loudest gains, shortest window, fastest reversal.
The trap is chasing the cascade tail. By the time low-cap alts trend on social media, the institutional capital that moved the ratio has already taken profit and rotated back toward BTC quality.
Read the ETH/BTC ratio. Watch BTC dominance slope. Size entries before the rotation is obvious, not after.
The calendar does not create altcoin season. Capital flow sequencing does.
#AltcoinSeason #CryptoMarkets #BTCDominance #CryptoStrategy #Altcoins
124

·
--
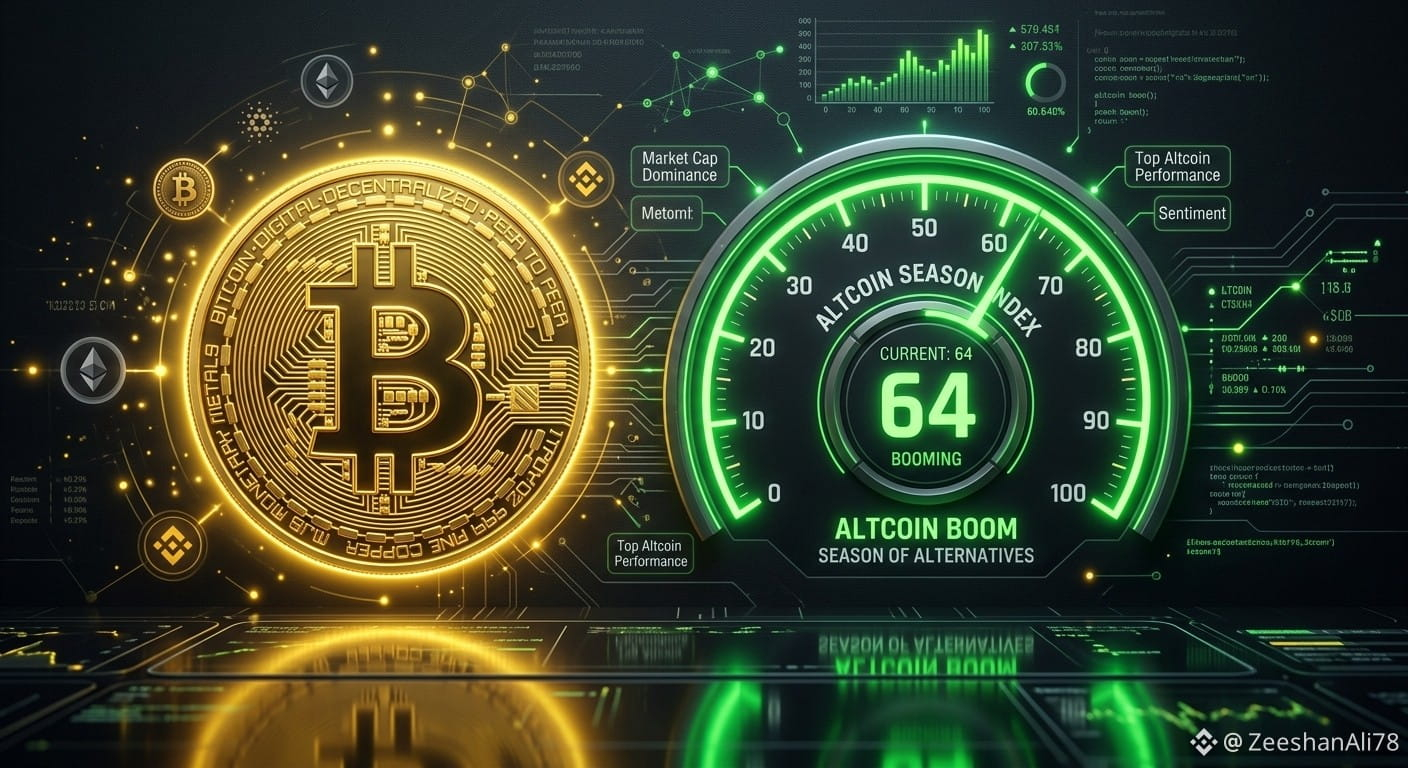
🚨 Altcoin Season Index Holds Above 60 for 5 Consecutive Days! 📈
Bitcoin ($BTC) holding strong above $84,000 has created the perfect environment for altcoins to shine! With the Altcoin Season Index maintaining above 60, market liquidity is actively rotating into high-beta altcoins.
Market Structure Breakdown:
🏛️ BTC Stability: Bitcoin maintaining $84,200+ levels keeps confidence high across the board.
🌊 Altcoin Rotation: Consistent capital inflow into top gainers shows strong trader appetite.
📊 Sustained Momentum: 5 days above 60 on the Altcoin Index confirms a healthy market structure.
Are you holding $BTC for the long run or farming altcoin breakouts right now? Let's discuss! 💬👇
🎯 Click $BTC chart widget below to check live chart levels & open position!
#Bitcoin
{spot}(BTCUSDT)
#BTC #AltcoinSeason #CryptoMarket #Binance
🚨 Altcoin Season Index Holds Above 60 for 5 Consecutive Days! 📈
Bitcoin ($BTC ) holding strong above $84,000 has created the perfect environment for altcoins to shine! With the Altcoin Season Index maintaining above 60, market liquidity is actively rotating into high-beta altcoins.
Market Structure Breakdown:
🏛️ BTC Stability: Bitcoin maintaining $84,200+ levels keeps confidence high across the board.
🌊 Altcoin Rotation: Consistent capital inflow into top gainers shows strong trader appetite.
📊 Sustained Momentum: 5 days above 60 on the Altcoin Index confirms a healthy market structure.
Are you holding $BTC for the long run or farming altcoin breakouts right now? Let's discuss! 💬👇
🎯 Click $BTC chart widget below to check live chart levels & open position!
#Bitcoin
#BTC #AltcoinSeason #CryptoMarket #Binance
Bitcoin ($BTC ) holding strong above $84,000 has created the perfect environment for altcoins to shine! With the Altcoin Season Index maintaining above 60, market liquidity is actively rotating into high-beta altcoins.
Market Structure Breakdown:
🏛️ BTC Stability: Bitcoin maintaining $84,200+ levels keeps confidence high across the board.
🌊 Altcoin Rotation: Consistent capital inflow into top gainers shows strong trader appetite.
📊 Sustained Momentum: 5 days above 60 on the Altcoin Index confirms a healthy market structure.
Are you holding $BTC for the long run or farming altcoin breakouts right now? Let's discuss! 💬👇
🎯 Click $BTC chart widget below to check live chart levels & open position!
#Bitcoin
#BTC #AltcoinSeason #CryptoMarket #Binance
67
·
--
Рост
🚨 ALTSEASON ALERT! 🔥
The Altcoin Season Index has stayed above 60 for 5 straight days 👀
💰 Capital is starting to rotate into altcoins
📈 Many altcoins are outperforming BTC
⚡ Index around 61–62
🎯 A move above 75 would be a much stronger altseason confirmation.
Altcoins are waking up… 👀🔥
Which altcoin are you watching?
#AltcoinSeasonIndexHoldsAbove60For5Days #Altseason #CryptoNews #AltcoinSeason $ETH $ZEC
🚨 ALTSEASON ALERT! 🔥
The Altcoin Season Index has stayed above 60 for 5 straight days 👀
💰 Capital is starting to rotate into altcoins
📈 Many altcoins are outperforming BTC
⚡ Index around 61–62
🎯 A move above 75 would be a much stronger altseason confirmation.
Altcoins are waking up… 👀🔥
Which altcoin are you watching?
#AltcoinSeasonIndexHoldsAbove60For5Days #Altseason #CryptoNews #AltcoinSeason $ETH $ZEC
The Altcoin Season Index has stayed above 60 for 5 straight days 👀
💰 Capital is starting to rotate into altcoins
📈 Many altcoins are outperforming BTC
⚡ Index around 61–62
🎯 A move above 75 would be a much stronger altseason confirmation.
Altcoins are waking up… 👀🔥
Which altcoin are you watching?
#AltcoinSeasonIndexHoldsAbove60For5Days #Altseason #CryptoNews #AltcoinSeason $ETH $ZEC
199

·
--
Статья
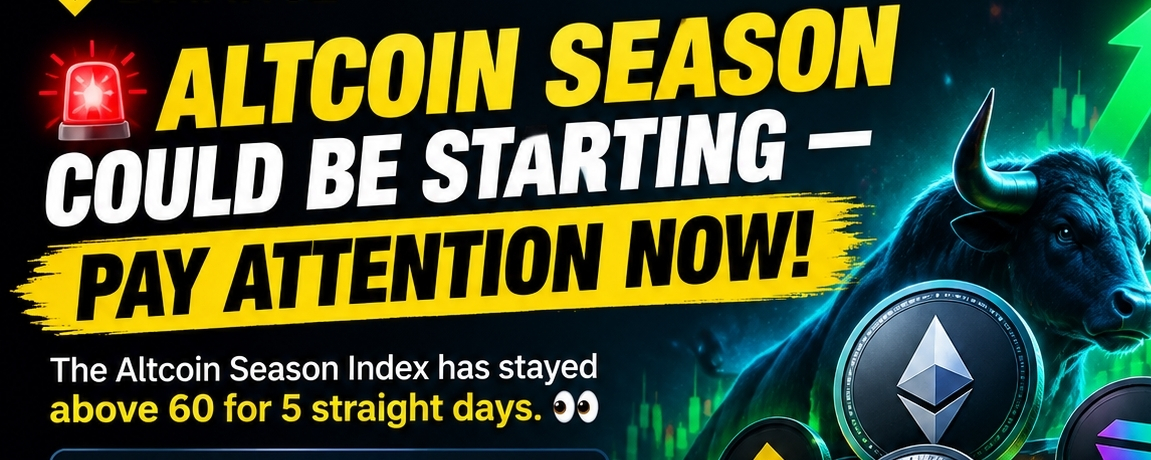
🚨 ALTCOIN SEASON COULD BE STARTING — PAY ATTENTION NOW!The Altcoin Season Index has stayed above 60 for 5 straight days. 👀🔥
Still not confirmed. The key level is 75+.
If the index keeps climbing while BTC dominance drops, altcoin rotation could accelerate.
⚠️ Early signal or fakeout?
The next few days could be crucial.
#AltcoinSeason #crypt #bitcoin #altcoins #BinanceSquare
$BITCOIN
{alpha}(10x72e4f9f808c49a2a61de9c5896298920dc4eeea9)
🚨 ALTCOIN SEASON COULD BE STARTING — PAY ATTENTION NOW!
The Altcoin Season Index has stayed above 60 for 5 straight days. 👀🔥
Still not confirmed. The key level is 75+.
If the index keeps climbing while BTC dominance drops, altcoin rotation could accelerate.
⚠️ Early signal or fakeout?
The next few days could be crucial.
#AltcoinSeason #crypt #bitcoin #altcoins #BinanceSquare
$BITCOIN
Still not confirmed. The key level is 75+.
If the index keeps climbing while BTC dominance drops, altcoin rotation could accelerate.
⚠️ Early signal or fakeout?
The next few days could be crucial.
#AltcoinSeason #crypt #bitcoin #altcoins #BinanceSquare
$BITCOIN
275

·
--
The Altcoin Season Index has held above 60 for five straight days, its strongest stretch in months.
Most trackers now sit in the mid-to-high 50s or low 70s depending on the source.
That’s still short of the classic 75 threshold that officially declares full altseason, but the direction is clear: more of the top 50 coins are beating Bitcoin over the last 90 days.
Bitcoin dominance has eased from its summer highs while names like SOL, XRP, and several mid-caps show relative strength.
Capital is rotating, not abandoning $BTC.
This isn’t the euphoric altseason of past cycles yet.
It’s the early phase where selective alts start to lead.
Watch whether the index can push through 70–75 or if Bitcoin reasserts control.
The next few weeks will tell us if this is the real rotation or just a temporary breath.
$BTC $ETH $SOL
{future}(SOLUSDT)
{future}(BTCUSDT)
{future}(ETHUSDT)
#altcoinseason #crypto
#altcoinseasonindexholdsabove60for5days
The Altcoin Season Index has held above 60 for five straight days, its strongest stretch in months.
Most trackers now sit in the mid-to-high 50s or low 70s depending on the source.
That’s still short of the classic 75 threshold that officially declares full altseason, but the direction is clear: more of the top 50 coins are beating Bitcoin over the last 90 days.
Bitcoin dominance has eased from its summer highs while names like SOL, XRP, and several mid-caps show relative strength.
Capital is rotating, not abandoning $BTC .
This isn’t the euphoric altseason of past cycles yet.
It’s the early phase where selective alts start to lead.
Watch whether the index can push through 70–75 or if Bitcoin reasserts control.
The next few weeks will tell us if this is the real rotation or just a temporary breath.
$BTC $ETH $SOL
#altcoinseason #crypto
#altcoinseasonindexholdsabove60for5days
Most trackers now sit in the mid-to-high 50s or low 70s depending on the source.
That’s still short of the classic 75 threshold that officially declares full altseason, but the direction is clear: more of the top 50 coins are beating Bitcoin over the last 90 days.
Bitcoin dominance has eased from its summer highs while names like SOL, XRP, and several mid-caps show relative strength.
Capital is rotating, not abandoning $BTC .
This isn’t the euphoric altseason of past cycles yet.
It’s the early phase where selective alts start to lead.
Watch whether the index can push through 70–75 or if Bitcoin reasserts control.
The next few weeks will tell us if this is the real rotation or just a temporary breath.
$BTC $ETH $SOL
#altcoinseason #crypto
#altcoinseasonindexholdsabove60for5days
223
Войдите, чтобы посмотреть больше материала
Присоединяйтесь к пользователям криптовалют по всему миру на Binance Square
⚡️ Получайте новейшую и полезную информацию о криптоактивах.
💬 Нам доверяет крупнейшая в мире криптобиржа.
👍 Получите достоверные аналитические данные от верифицированных создателей контента.
Эл. почта/номер телефона
В тренде
1
#ZcashETFPostsFirstWeeklyOutflow$93.6M
Просмотров: 33,809
97 обсуждают
2
#GreekPoliceBustCryptoScamRingArrest17
Просмотров: 69,893
672 обсуждают
3
#BitcoinRejectedAt$87K
Просмотров: 119,027
156 обсуждают
4
#FedOctoberRateHikeOddsFallTo17%
Просмотров: 95,509
952 обсуждают
5
#NvidiaHitsRecordHighUp2.4%
Просмотров: 64,260
696 обсуждают
6
#CanaryFilesAmendedS1ForPEPEETF
Просмотров: 17,880
492 обсуждают
7
#USRussiaUkraineTalksReportedlyIncludeLukoilOilDeal
Просмотров: 28,824
490 обсуждают
8
#BitcoinParesGainsAfterRallyTo$86.5K
Просмотров: 46,732
165 обсуждают
9
#CerebrasSinksNearly20%OnReportNvidiaToPowerOpenAI
Просмотров: 114,066
1,095 обсуждают
10
#SECProposesCryptoCustodyRules
Просмотров: 154,067
1,372 обсуждают