

Atta_e_Abbas110
3 Publicações

Atta_e_Abbas110
Denunciar
Bloquear Utilizador
10 A seguir
22 Seguidores
14 Gostaram
Publicações
🧠 Gestão de risco vs. volatilidade do mercado: para onde está a fluir a liquidez?
Com $BTC a manter uma forte dominância acima dos 59% e as yields macroeconómicas a mudar, o mercado apresenta uma divisão clássica: o capital institucional dá prioridade à segurança, enquanto os traders dinâmicos procuram volatilidade em altcoins de elevado volume.
Navegar com sucesso nestas condições de mercado não é uma questão de adivinhar o topo ou o fundo exatos — trata-se de aplicar uma estrutura sistemática de gestão de risco.
Aqui estão 3 regras de execução que todos os traders devem seguir neste momento:
1️⃣ A gestão da margem é importante (isolada vs. cruzada)
Em períodos de oscilações voláteis, uma alavancagem excessiva com margem cruzada pode colocar todo o saldo da sua conta em risco. A utilização de margem isolada limita as perdas por posição e mantém o seu capital principal protegido.
2️⃣ Acompanhe a liquidez do livro de ordens e os mapas de calor
Não negoceie às cegas contra a resistência. Consulte os mapas de profundidade para identificar onde se encontram as verdadeiras paredes de venda e os agrupamentos de liquidez antes de colocar ordens limite. As falsas ruturas ocorrem geralmente quando a liquidez diminui em períodos de baixo volume.
3️⃣ Dê prioridade à preservação do capital
Uma estratégia vencedora dá atenção ao potencial de valorização, mas uma estratégia sustentável dá prioridade à proteção contra perdas. Calcule sempre o tamanho da sua posição com base na percentagem máxima de perda aceitável, e não no lucro potencial.
📌 Foco atual e preparação da comunidade:
Vai manter posições à vista durante esta fase de consolidação ou fazer scalping ativo da volatilidade de curto prazo?
Partilhe abaixo a sua configuração e os principais níveis de preço! 👇
$BTC $ETH
#CryptoTrading. #BinanceSquareFamily #writetoearn #RiskManagementMastery #MarketAnalysis
98
Ver tradução
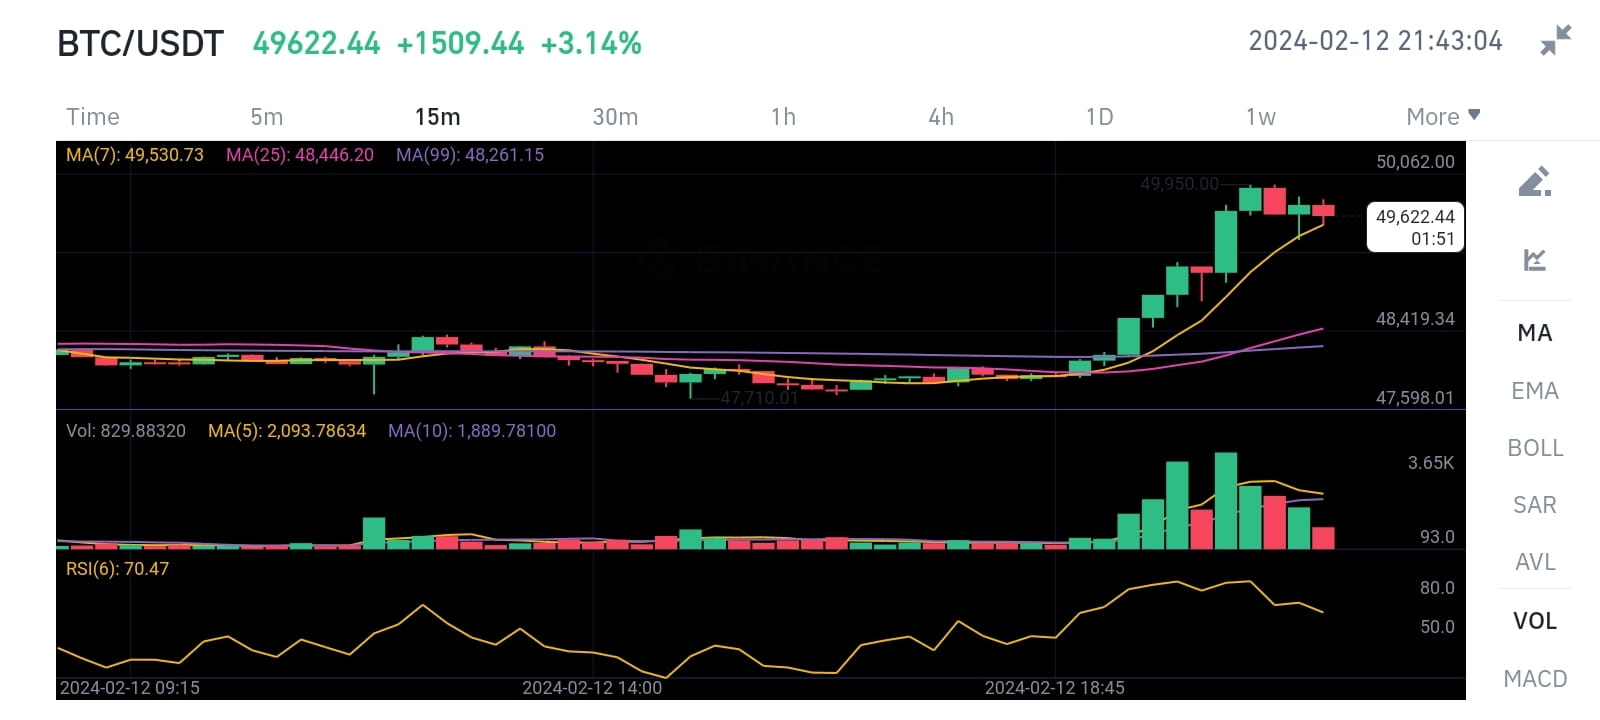
$BTC I can try to help you with that. Here is my analysis of the chart:
The chart shows the price movement of BTC/USDT (Bitcoin/Tether) trading pair on a 15-minute time frame.
The price is in an uptrend, as indicated by the higher highs and higher lows, and the moving averages (MA7, MA25, MA99) being in ascending order.
The support point is around 47,598.01, where the price had a consolidation before moving upwards. This level can act as a floor for the price, and if it breaks below it, it may signal a reversal of the trend.
The resistance point is at 50,062.00, where the highest price is marked. This level can act as a ceiling for the price, and if it breaks above it, it may signal a continuation of the trend.
The RSI (Relative Strength Index) is at 70.47, which is close to the overbought zone (above 70). This means that the price may be overvalued and due for a correction or a pullback.
The volume bars show that the buying volume is higher than the selling volume, which confirms the bullish sentiment of the market.
Based on this analysis, one possible trading strategy is to buy BTC/USDT at the support level of 47,598.01, and sell it at the resistance level of 50,062.00, or hold it until the trend changes. However, this is not a financial advice, and you should do your own research and risk management before making any trading decisions.
if you want more analysis like this you have to like comment
#Write2Earn
#TrendingTopic #BTC
7
984
Ver tradução
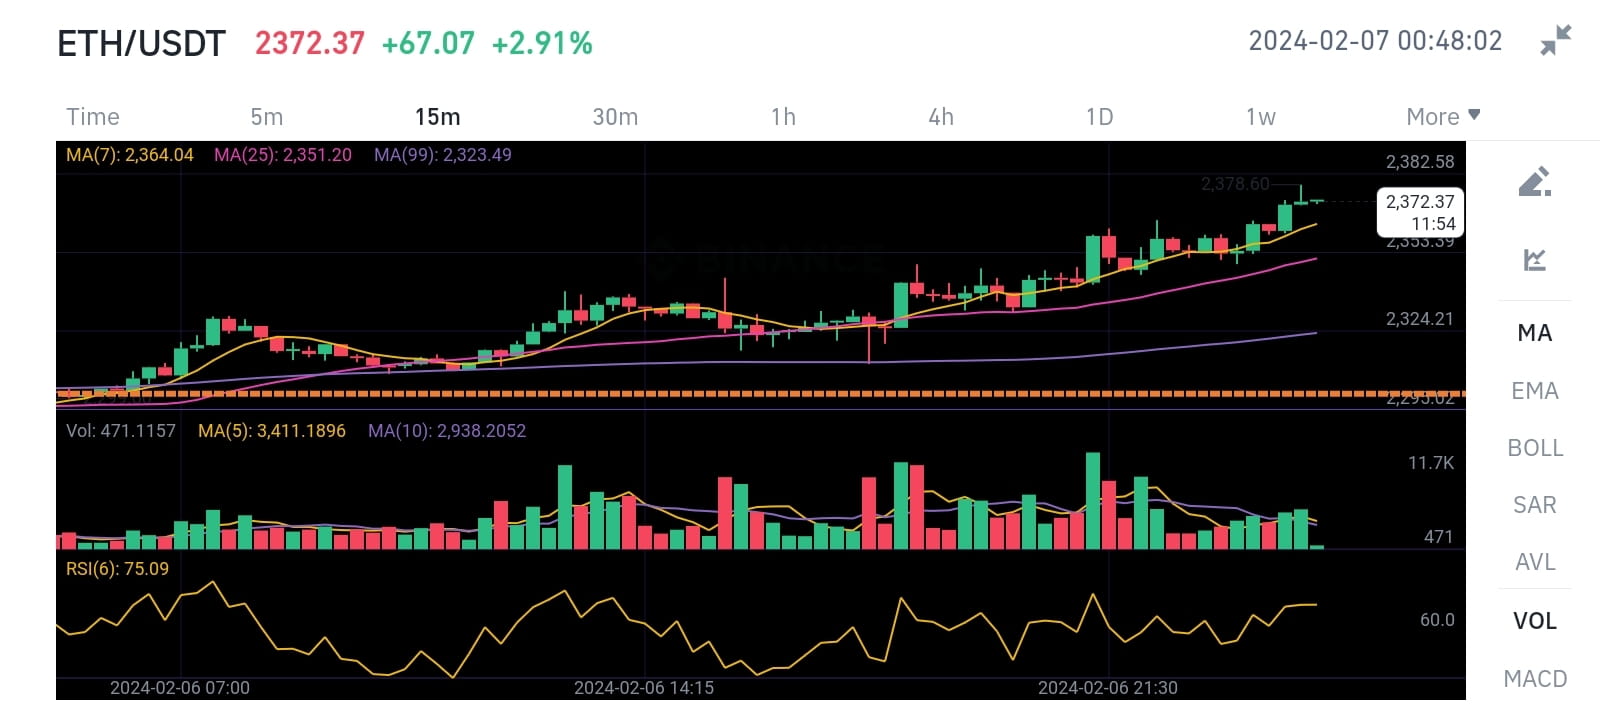
$ETH This is my technical analysis for this chart. I hope you find it helpful. 😊
The support can be identified around the price of 2324.21 USDT where the price has bounced back up previously. This level also coincides with the MA99 line, which adds to its strength as a support. If the price breaks below this level, it could indicate a bearish trend and the next support could be around 2300 USDT where the price has found support in the past.
The resistance point is likely near the current high in this image at 2372.37 USDT. This level is also close to the RSI overbought zone, which suggests that the price might face some selling pressure and pull back. If the price breaks above this level, it could indicate a bullish trend and the next resistance could be around 2400 USDT where the price has faced resistance in the past.#Write2Earn #Write2Earn #Write2Earn
7
2.1k
Inicia sessão para explorar mais conteúdos
Junta-te a utilizadores de criptomoedas de todo o mundo na Binance Square
⚡️ Obtém informações úteis e recentes sobre criptomoedas.
💬 Com a confiança da maior exchange de criptomoedas do mundo.
👍 Descobre perspetivas reais de criadores verificados.
E-mail/Número de telefone
Tópicos em Tendência
CanMicrosoftDeliverOnAI
341,868 visualizações
2,710 a discutir
Temporada de resultados — Sessão 3: a Google e a Microsoft vão superar as expectativas?
Binance Square Official
·136 gostos
·66k visualizações
CanGoogleDefindItsCore
201,338 visualizações
1,912 a discutir
EarningsSeason
5.9M visualizações
28,756 a discutir