Binance Square
Ace_V
2.1k Publicações

Ace_V

Read the tape, not the noise. Clear support/resistance maps on BTC, ETH & today's movers - real data, zero hype. New reads daily.
14 A seguir
55 Seguidores
221 Gostaram
Publicações
·
--
Artigo
Ver tradução
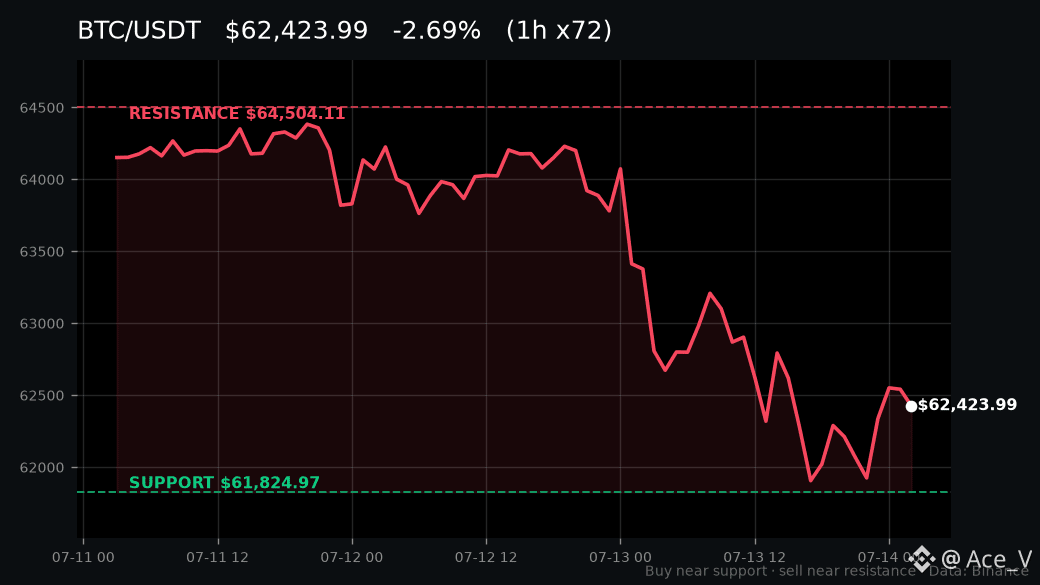
Government Moves $297M in Seized Crypto — Here Is What It Means for BTCThe headline that matters most today is not about personnel shuffles or regulatory posturing. It is that the US government moved $297 million in seized Bitcoin and Ether to Coinbase Prime. That is a cold, mechanical signal — sovereign supply hitting a custodial exchange that routes directly to institutional liquidity. When a government wallet sends assets to a prime brokerage, the market reads one word: distribution. For $BTC specifically, that supply pressure lands in a market already sitting in the lower half of its near-term range. CoinMarketCap data shows Bitcoin at $62,697.08 this morning, down a marginal 0.17% over 24 hours on $1.24 billion in Binance volume. The number itself is unremarkable. The position on the chart is not. Bitcoin's 72-hour support sits at $61,824.97. Resistance is pinned at $64,504.11. Current price is closer to the floor than the ceiling — roughly $870 above support and $1,800 below resistance. That asymmetry matters when fresh sovereign supply is the day's loudest headline. Here is the map a trader needs to have in mind right now. If $BTC holds above $61,824.97, buyers are still defending the lower boundary of this three-day range. That level has absorbed selling pressure consistently, and a clean bounce here would confirm that institutional bid remains live beneath the market. It is the zone where dip-buyers historically step in — not on conviction, but because the risk-reward tilts sharply in their favor when support is this clearly defined. If $BTC loses $61,824.97, the range breaks. There is no obvious structural floor immediately below, and a government-triggered supply event is exactly the kind of catalyst that accelerates stop-losses. Sellers gain momentum and the path of least resistance flips downward. That is not a prediction — it is the mechanical consequence of a well-defined level giving way under real volume. On the upside, a reclaim of $64,504.11 would reverse the supply narrative entirely. Resistance becoming support would signal that the market has already digested the government distribution and buyers are looking through it. That would be the higher-conviction long, but it is not the setup on the table right now. Right now, the tape is pressing toward the floor, and the question is whether the floor holds. The broader backdrop reinforces the caution. Patrick Witt, the White House crypto adviser, is heading for military training — a personnel shift that introduces uncertainty into the policy pipeline at a moment when regulatory clarity matters more than ever. Japan is expanding crypto credit infrastructure. Thai authorities are clawing back $122 million in scam proceeds. The global regulatory texture is evolving in real time, and liquidity — the tide that lifts or drops all crypto assets — is responding to every headline. What makes today's government move particularly relevant is the execution mechanics. Coinbase Prime is not a retail platform. It is the on-ramp for institutional block trades. When $297 million lands there, it does not sit idle. Market makers price it, desks absorb it, and order books adjust in anticipation. The supply does not need to hit spot markets directly to pressure prices — the expectation alone reshapes positioning. This is where the macro lens earns its keep. Bitcoin does not trade in isolation. It trades relative to dollar liquidity, rate expectations, and institutional risk appetite. A government liquidation signal arriving on the same day the market hovers near 72-hour support creates a tension that will resolve in one direction within hours, not weeks. The window on these levels is the horizon where the supply catalyst either gets absorbed cleanly or triggers a structural break. Defending support here or waiting for the break? The $BTC pair on Binance is one tap away. The levels are live, the catalyst is real, and the next session decides which side of the range controls the tape. Not financial advice. Zoom out. Follow the liquidity. #Bitcoin #BTC #Crypto

Government Moves $297M in Seized Crypto — Here Is What It Means for BTC

The headline that matters most today is not about personnel shuffles or regulatory posturing. It is that the US government moved $297 million in seized Bitcoin and Ether to Coinbase Prime. That is a cold, mechanical signal — sovereign supply hitting a custodial exchange that routes directly to institutional liquidity. When a government wallet sends assets to a prime brokerage, the market reads one word: distribution.
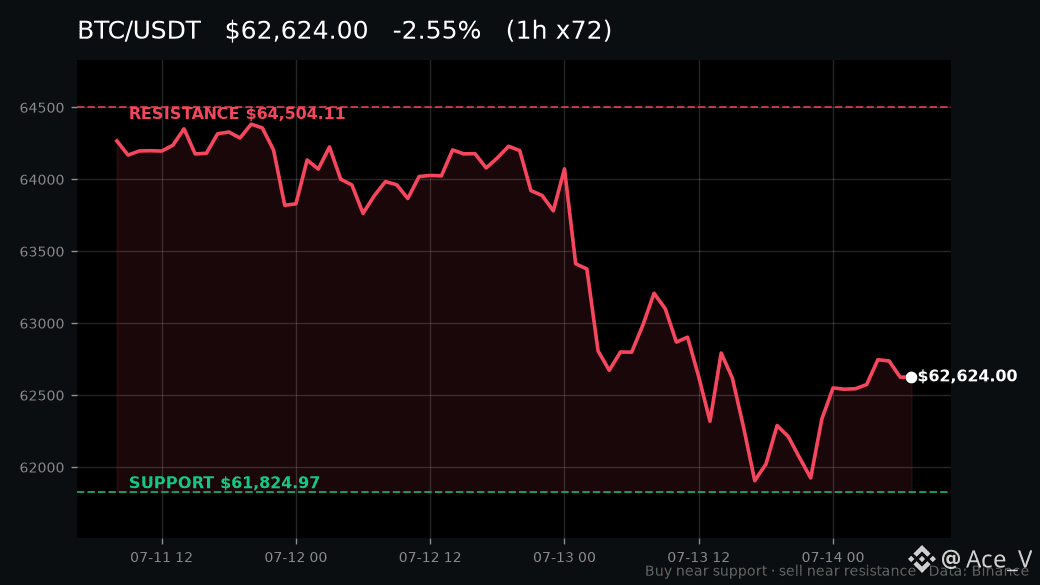
For $BTC specifically, that supply pressure lands in a market already sitting in the lower half of its near-term range. CoinMarketCap data shows Bitcoin at $62,697.08 this morning, down a marginal 0.17% over 24 hours on $1.24 billion in Binance volume. The number itself is unremarkable. The position on the chart is not.
Bitcoin's 72-hour support sits at $61,824.97. Resistance is pinned at $64,504.11. Current price is closer to the floor than the ceiling — roughly $870 above support and $1,800 below resistance. That asymmetry matters when fresh sovereign supply is the day's loudest headline.
Here is the map a trader needs to have in mind right now.
If $BTC holds above $61,824.97, buyers are still defending the lower boundary of this three-day range. That level has absorbed selling pressure consistently, and a clean bounce here would confirm that institutional bid remains live beneath the market. It is the zone where dip-buyers historically step in — not on conviction, but because the risk-reward tilts sharply in their favor when support is this clearly defined.
If $BTC loses $61,824.97, the range breaks. There is no obvious structural floor immediately below, and a government-triggered supply event is exactly the kind of catalyst that accelerates stop-losses. Sellers gain momentum and the path of least resistance flips downward. That is not a prediction — it is the mechanical consequence of a well-defined level giving way under real volume.
On the upside, a reclaim of $64,504.11 would reverse the supply narrative entirely. Resistance becoming support would signal that the market has already digested the government distribution and buyers are looking through it. That would be the higher-conviction long, but it is not the setup on the table right now. Right now, the tape is pressing toward the floor, and the question is whether the floor holds.
The broader backdrop reinforces the caution. Patrick Witt, the White House crypto adviser, is heading for military training — a personnel shift that introduces uncertainty into the policy pipeline at a moment when regulatory clarity matters more than ever. Japan is expanding crypto credit infrastructure. Thai authorities are clawing back $122 million in scam proceeds. The global regulatory texture is evolving in real time, and liquidity — the tide that lifts or drops all crypto assets — is responding to every headline.
What makes today's government move particularly relevant is the execution mechanics. Coinbase Prime is not a retail platform. It is the on-ramp for institutional block trades. When $297 million lands there, it does not sit idle. Market makers price it, desks absorb it, and order books adjust in anticipation. The supply does not need to hit spot markets directly to pressure prices — the expectation alone reshapes positioning.
This is where the macro lens earns its keep. Bitcoin does not trade in isolation. It trades relative to dollar liquidity, rate expectations, and institutional risk appetite. A government liquidation signal arriving on the same day the market hovers near 72-hour support creates a tension that will resolve in one direction within hours, not weeks. The window on these levels is the horizon where the supply catalyst either gets absorbed cleanly or triggers a structural break.
Defending support here or waiting for the break?
The $BTC pair on Binance is one tap away. The levels are live, the catalyst is real, and the next session decides which side of the range controls the tape. Not financial advice.
Zoom out. Follow the liquidity.
#Bitcoin #BTC #Crypto
BTC-3,11%
ETH-5,05%
COINUS-2,02%
·
--
Ver tradução
Ethereum is green while Solana bleeds red — but the real question is which Layer-1 is actually building strength. Think of it like a race. Not about who moves more today, but which chain holds its ground and which one is leaking momentum. According to CoinMarketCap, $ETH sits at $1,786.48, up 0.53% on $379.24M in volume. Pressing toward 72h resistance at $1,846 while buyers defend support at $1,750.20. If ETH holds above that floor, the path toward resistance stays open. Lose $1,750 and the momentum shift gets real. $SOL tells a different story. At $75.29, down 1.40% on lighter $97.41M volume, hovering just above 72h support of $74.10. Lose that and sellers take control. Resistance sits all the way up at $78.88. Volume confirms the ranking — money is flowing into $ETH, not $SOL. Today's tape picks a clear winner. Riding ETH toward resistance here or waiting for a pullback to $1,750? Not financial advice. The $ETH pair is one tap away, and the $1,846 level is where it gets decided. Understand it, then decide. #Solana #SOL #Ethereum #ETH
Ethereum is green while Solana bleeds red — but the real question is which Layer-1 is actually building strength.

Think of it like a race. Not about who moves more today, but which chain holds its ground and which one is leaking momentum.

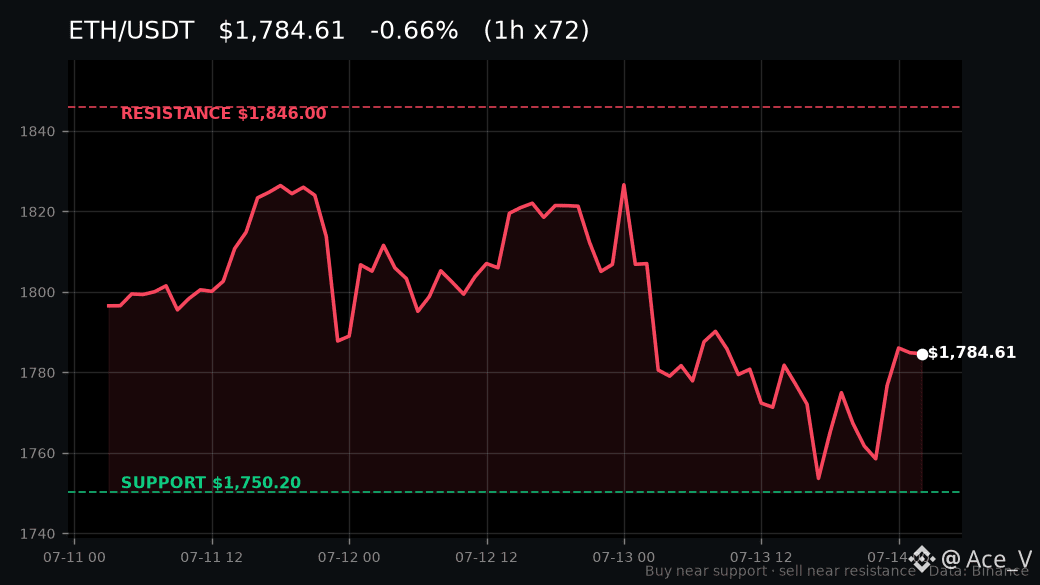
According to CoinMarketCap, $ETH sits at $1,786.48, up 0.53% on $379.24M in volume. Pressing toward 72h resistance at $1,846 while buyers defend support at $1,750.20. If ETH holds above that floor, the path toward resistance stays open. Lose $1,750 and the momentum shift gets real.

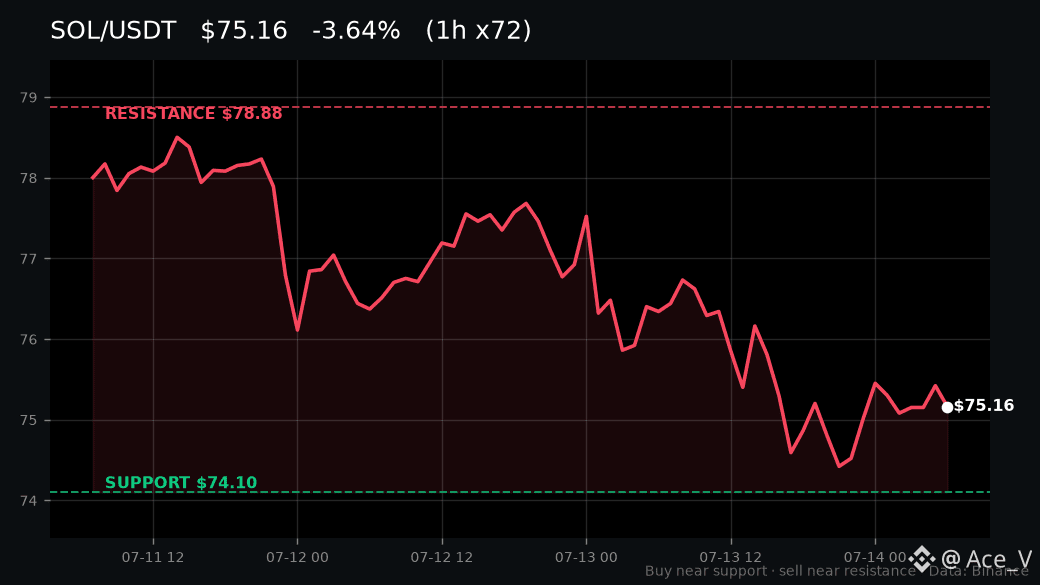
$SOL tells a different story. At $75.29, down 1.40% on lighter $97.41M volume, hovering just above 72h support of $74.10. Lose that and sellers take control. Resistance sits all the way up at $78.88.

Volume confirms the ranking — money is flowing into $ETH , not $SOL . Today's tape picks a clear winner.

Riding ETH toward resistance here or waiting for a pullback to $1,750? Not financial advice.

The $ETH pair is one tap away, and the $1,846 level is where it gets decided.

Understand it, then decide.

#Solana #SOL #Ethereum #ETH
·
--
Ver tradução
$297 million in seized BTC and ETH just landed on Coinbase Prime — per Cointelegraph, the US government moved it today. That's real supply pressure hitting the tape while $BTC… $BTC #Bitcoin #BTC #BinanceSquare
$297 million in seized BTC and ETH just landed on Coinbase Prime — per Cointelegraph, the US government moved it today. That's real supply pressure hitting the tape while $BTC

$BTC

#Bitcoin #BTC #BinanceSquare
·
--
Ver tradução
Everyone's talking about GRVT's Binance Square campaign like it's a guaranteed catalyst. Engagement farming, reward points, social buzz — the usual playbook. But here's what the tape actually tells us. The US government just moved $297 million in seized Bitcoin and Ether to Coinbase Prime, and a White House crypto adviser is shipping off to military training. The regulatory and institutional landscape is shifting under every new exchange token's feet right now. Campaigns generate clicks, not liquidity. GRVT's hybrid DEX pitch is genuinely interesting — but social volume without orderbook depth is just noise. The real signal is whether the hype converts into actual sustained flow on the pair. Ask yourself: when the campaign ends and the engagement rewards dry up, does $GRVT still have a reason to hold? That's the only question that matters for anyone thinking about a position. If you want to be in when that answer becomes clear, the $GRVT pair is one tap away on the chart. Not financial advice. When everyone agrees, check the other side. #GRVT #Markets
Everyone's talking about GRVT's Binance Square campaign like it's a guaranteed catalyst. Engagement farming, reward points, social buzz — the usual playbook.

But here's what the tape actually tells us. The US government just moved $297 million in seized Bitcoin and Ether to Coinbase Prime, and a White House crypto adviser is shipping off to military training. The regulatory and institutional landscape is shifting under every new exchange token's feet right now.

Campaigns generate clicks, not liquidity. GRVT's hybrid DEX pitch is genuinely interesting — but social volume without orderbook depth is just noise. The real signal is whether the hype converts into actual sustained flow on the pair.

Ask yourself: when the campaign ends and the engagement rewards dry up, does $GRVT still have a reason to hold? That's the only question that matters for anyone thinking about a position.

If you want to be in when that answer becomes clear, the $GRVT pair is one tap away on the chart. Not financial advice.

When everyone agrees, check the other side.

#GRVT #Markets
·
--
Artigo
Ver tradução
Funding Rates Whisper What Price Charts Won'tBitcoin sits at $62,803.42 on Binance, flat over the last 24 hours with $1.21 billion in volume. Ethereum is a shade higher at $1,789.53, up 0.36 percent on $381.87 million in daily turnover. On the surface, both look quiet. But derivatives markets are never quiet — they are just speaking a different language than spot, and right now that language is saying something worth decoding. Funding rates exist because perpetual futures have no expiry date. To keep the contract price tethered to the actual asset, exchanges charge one side of the trade to the other. When longs are crowded, funding goes positive and longs pay shorts. When shorts dominate, it flips negative. The rate itself is a crowdsourced thermometer of positioning, refreshed every few hours on most major venues. A slightly positive rate is normal — it reflects the natural cost of leveraged upside exposure. A deeply positive rate is a warning. It means the crowd is so one-sided that the market is paying a premium just to maintain the bet. Here is why that matters today. $BTC is coiling inside a tight 72-hour band defined by support at $61,824.97 and resistance at $64,504.11. Price has traveled barely 4 percent across that entire range. When spot vol compresses like this, derivatives take over as the primary price-discovery engine. Open interest builds, funding drifts, and the balance of leveraged bets determines which side of the range snaps first. A funding rate hovering near neutral tells you neither longs nor shorts have conviction yet — the spring is loaded but nobody has let go. If $BTC holds $61,824.97, that level becomes the floor where dip-buyers step in and longs feel safe adding size. If it loses that support, the unwinding accelerates because those same longs start liquidating, and the next leg down begins not from a chart pattern but from a cascade of forced sells. On the upside, $64,504.11 is the ceiling where sellers have been capping every push. A clean break above it flips the script — shorts get squeezed, funding spikes positive, and momentum traders pile in on the other side of the move. The derivatives read on $ETH is subtly different. At $1,789.53, ether is pressing against a tighter 72-hour bracket: support at $1,750.20 and resistance at $1,846.00. That is roughly a 5.5 percent range, and ETH has been creeping toward the upper end rather than sitting at the midpoint. When one asset drifts toward resistance while its funding stays subdued, the signal is accumulation under the surface — traders positioning long without yet triggering the crowded-trade alarm. If $ETH breaks above $1,846.00, the derivatives unwind on the short side could be sharp because resistance-level stops are clustered there. If it fails and slips back to $1,750.20, watch whether that support produces a higher low — that would confirm the drift upward is structural rather than a fluke. Macro context adds another layer. The US government just moved $297 million in seized Bitcoin and Ether to Coinbase Prime, according to CoinMarketCap-curated headlines. Large government transfers to exchange custody historically precede OTC liquidations, which means invisible supply may be entering the market without showing up on spot order books. Derivatives traders know this, and positioning around such events often tightens funding as the crowd waits for the sell pressure to absorb. The White House crypto adviser heading to military training is a softer headline, but it signals ongoing policy uncertainty that keeps institutional desks hedged through options and perps rather than going naked long. That hedging activity itself suppresses directional funding and explains the flat tape you see in both assets. Here is the mechanism in one sentence: compressed spot ranges plus neutral funding plus incoming supply equals a market coiled for a directional move, with derivatives determining the trigger. The question is not whether the range breaks — it is which side of the leveraged crowd gets caught wrong-footed first. If you are watching $BTC defend $61,824.97 or attack $64,504.11, or if $ETH testing $1,846.00 is the setup you are tracking, the pair is one tap away when you want in. The levels are defined. The positioning is loaded. The rest is tape. Not financial advice. Follow the builders. #Bitcoin #BTC #Ethereum #ETH

Funding Rates Whisper What Price Charts Won't

Bitcoin sits at $62,803.42 on Binance, flat over the last 24 hours with $1.21 billion in volume. Ethereum is a shade higher at $1,789.53, up 0.36 percent on $381.87 million in daily turnover. On the surface, both look quiet. But derivatives markets are never quiet — they are just speaking a different language than spot, and right now that language is saying something worth decoding.
Funding rates exist because perpetual futures have no expiry date. To keep the contract price tethered to the actual asset, exchanges charge one side of the trade to the other. When longs are crowded, funding goes positive and longs pay shorts. When shorts dominate, it flips negative. The rate itself is a crowdsourced thermometer of positioning, refreshed every few hours on most major venues. A slightly positive rate is normal — it reflects the natural cost of leveraged upside exposure. A deeply positive rate is a warning. It means the crowd is so one-sided that the market is paying a premium just to maintain the bet.
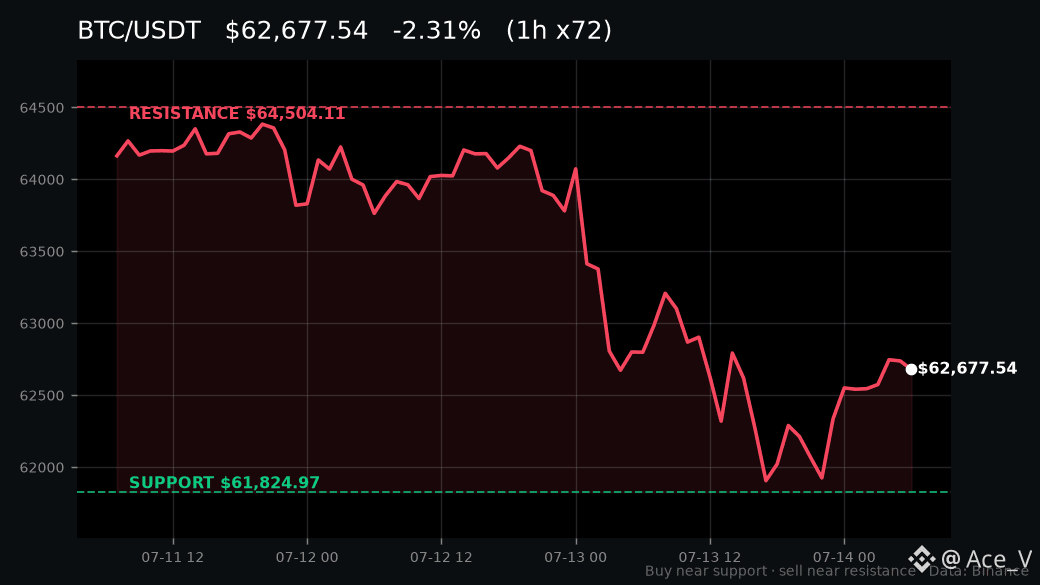
Here is why that matters today. $BTC is coiling inside a tight 72-hour band defined by support at $61,824.97 and resistance at $64,504.11. Price has traveled barely 4 percent across that entire range. When spot vol compresses like this, derivatives take over as the primary price-discovery engine. Open interest builds, funding drifts, and the balance of leveraged bets determines which side of the range snaps first. A funding rate hovering near neutral tells you neither longs nor shorts have conviction yet — the spring is loaded but nobody has let go.
If $BTC holds $61,824.97, that level becomes the floor where dip-buyers step in and longs feel safe adding size. If it loses that support, the unwinding accelerates because those same longs start liquidating, and the next leg down begins not from a chart pattern but from a cascade of forced sells. On the upside, $64,504.11 is the ceiling where sellers have been capping every push. A clean break above it flips the script — shorts get squeezed, funding spikes positive, and momentum traders pile in on the other side of the move.
The derivatives read on $ETH is subtly different. At $1,789.53, ether is pressing against a tighter 72-hour bracket: support at $1,750.20 and resistance at $1,846.00. That is roughly a 5.5 percent range, and ETH has been creeping toward the upper end rather than sitting at the midpoint. When one asset drifts toward resistance while its funding stays subdued, the signal is accumulation under the surface — traders positioning long without yet triggering the crowded-trade alarm. If $ETH breaks above $1,846.00, the derivatives unwind on the short side could be sharp because resistance-level stops are clustered there. If it fails and slips back to $1,750.20, watch whether that support produces a higher low — that would confirm the drift upward is structural rather than a fluke.
Macro context adds another layer. The US government just moved $297 million in seized Bitcoin and Ether to Coinbase Prime, according to CoinMarketCap-curated headlines. Large government transfers to exchange custody historically precede OTC liquidations, which means invisible supply may be entering the market without showing up on spot order books. Derivatives traders know this, and positioning around such events often tightens funding as the crowd waits for the sell pressure to absorb.
The White House crypto adviser heading to military training is a softer headline, but it signals ongoing policy uncertainty that keeps institutional desks hedged through options and perps rather than going naked long. That hedging activity itself suppresses directional funding and explains the flat tape you see in both assets.
Here is the mechanism in one sentence: compressed spot ranges plus neutral funding plus incoming supply equals a market coiled for a directional move, with derivatives determining the trigger. The question is not whether the range breaks — it is which side of the leveraged crowd gets caught wrong-footed first.
If you are watching $BTC defend $61,824.97 or attack $64,504.11, or if $ETH testing $1,846.00 is the setup you are tracking, the pair is one tap away when you want in. The levels are defined. The positioning is loaded. The rest is tape.
Not financial advice.
Follow the builders.
#Bitcoin #BTC #Ethereum #ETH
·
--
Ver tradução
TRX is down 1.72% today while the US government moves $297 million in seized crypto to Coinbase Prime. At least someone's coins are going somewhere. Right now $TRX trades at $0.325100 per CoinMarketCap, sitting right on top of the 72-hour support at $0.324000. That floor is the whole game — if it holds, dip-buyers have a clear line to defend. If it loses, momentum rolls downhill fast. Overhead resistance is $0.332300. A clean break above that with volume flips the short-term picture. A rejection there? Sellers stay in control and the range persists. Stablecoin flows on Tron keep churning regardless of price action — the network is working, the chart just hasn't gotten the memo yet. Defending support here or waiting for the break? The $TRX pair is one tap away while the setup is still live. Laugh, then look at the chart. #TRON #TRX #Markets
TRX is down 1.72% today while the US government moves $297 million in seized crypto to Coinbase Prime. At least someone's coins are going somewhere.

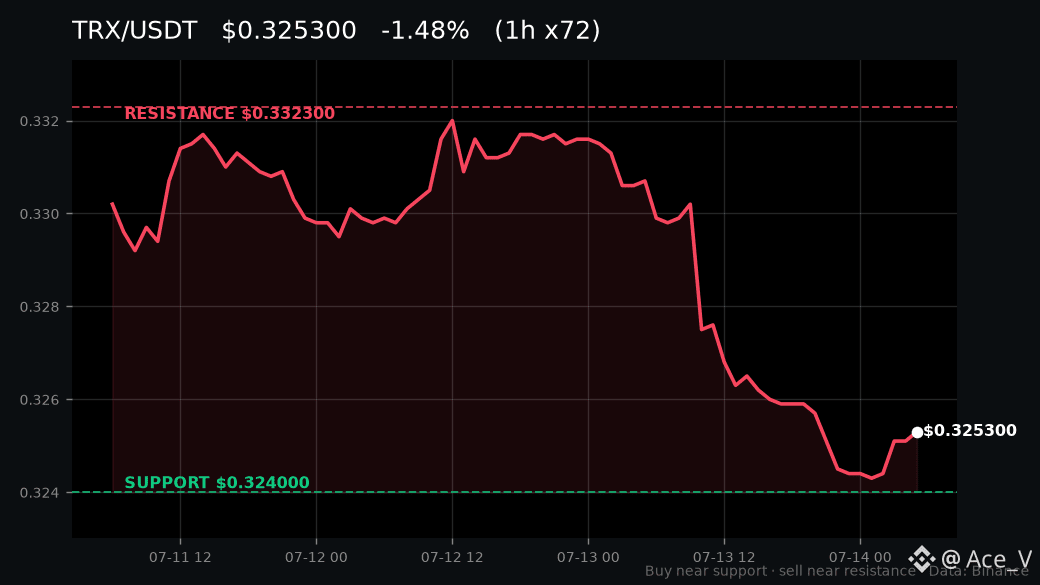
Right now $TRX trades at $0.325100 per CoinMarketCap, sitting right on top of the 72-hour support at $0.324000. That floor is the whole game — if it holds, dip-buyers have a clear line to defend. If it loses, momentum rolls downhill fast.

Overhead resistance is $0.332300. A clean break above that with volume flips the short-term picture. A rejection there? Sellers stay in control and the range persists.

Stablecoin flows on Tron keep churning regardless of price action — the network is working, the chart just hasn't gotten the memo yet.

Defending support here or waiting for the break?

The $TRX pair is one tap away while the setup is still live. Laugh, then look at the chart.

#TRON #TRX #Markets
·
--
Ver tradução
Litecoin has settled payments for over a decade while newer chains still debate throughput. $LTC #Litecoin #LTC #Crypto
Litecoin has settled payments for over a decade while newer chains still debate throughput.

$LTC

#Litecoin #LTC #Crypto
·
--
Artigo
Ver tradução
NEWT Hovers Just 1.3% Above Support — Here Is the MapNewtown is trading at $0.045700 on Binance right now, and if you pull up the chart you will notice something important: price is sitting barely above the 72-hour support level at $0.045100 while the 24-hour volume sits at roughly $348,846. That is a thin cushion between current price and the level that has been propping up the entire short-term structure. Meanwhile, resistance overhead at $0.049000 represents the ceiling that bulls have failed to crack for three sessions running. According to CoinMarketCap, NEWT is down 0.44% on the day, which tells you the drift is sideways-to-lower rather than any capitulation — but it also tells you buyers are not yet pressing hard enough to flip the bias. Let me walk through why this specific positioning matters for anyone watching $NEWT right now. The structure is straightforward. The 72-hour support at $0.045100 is the line that has kept the short-term trend from breaking down. Every time price has dipped toward it, bids have appeared. That is what support does — it concentrates liquidity and decision-making into a narrow zone. Right now we are roughly $0.0006 above it, which in percentage terms is about 1.3%. That is razor thin. A single high-volume candle on any broad market flush could test it. The question is whether it holds. If $0.045100 holds on a retest, the bull case stays intact. That means buyers are still defending the range, and the next logical target becomes the resistance at $0.049000. The gap between support and resistance is approximately 8.6%, which is a meaningful range for a low-cap token with modest daily turnover. For a disciplined trader, a hold at support followed by a push toward resistance is the textbook long setup — you define risk below the level, and you let the range do the work. If $0.045100 loses, the picture changes. A clean break beneath that support with volume confirmation means the floor that held for three days is gone, and prior support tends to become resistance. In that scenario, there is no obvious structural level immediately below to catch the fall on the current timeframe. That is the risk — not a catastrophic collapse, but a void where the next bid might sit. Anyone holding a position would need to decide quickly whether to reduce exposure or wait for a new base to form. The invalidation is clean: close below $0.045100 on meaningful volume, and the setup is simply wrong. Now layer in the broader backdrop. The latest headlines are not directly tied to NEWT, but they shape the macro mood that flows into every micro-cap on Binance. The White House crypto adviser Patrick Witt heading to military training signals a brief leadership vacuum in US crypto policy discussions. The CLARITY Act picking up a second law enforcement endorsement ahead of its Senate push is structurally positive for the industry long term, but short term it means regulatory uncertainty persists — and that keeps risk appetite muted for tokens like $NEWT that trade on sentiment as much as fundamentals. The US government moving $297 million in seized Bitcoin and Ether to Coinbase Prime is supply-side pressure on majors, and when majors wobble, micro-caps feel the drag harder. None of this breaks NEWT specifically, but it explains why volume is light and why bulls have not yet pushed toward that $0.049000 resistance. The scenario map is clear. Above $0.045100, you are in the range, and the trade idea is a bounce play toward $0.049000 with defined risk just below support. Below $0.045100, the short-term structure fails and the prudent move is to step aside and wait for a new level to establish itself. At resistance near $0.049000, sellers have capped upside for three days — a rejection there is the take-profit zone for anyone who entered near support. A clean break above $0.049000 with follow-through volume would flip the bias bullish and open up the next range, but that is a conditional outcome, not a given. The risk note is simple: if you are playing the range, your line in the sand is $0.045100. Below it, the thesis does not exist anymore. For anyone who sees the setup and wants to act on these exact levels while the structure is still live, the $NEWT pair on Binance is one tap away. The chart is right there, the levels are mapped, and the next candle is where it gets decided. Levels, not feelings. Not financial advice. #NEWT #Trading

NEWT Hovers Just 1.3% Above Support — Here Is the Map

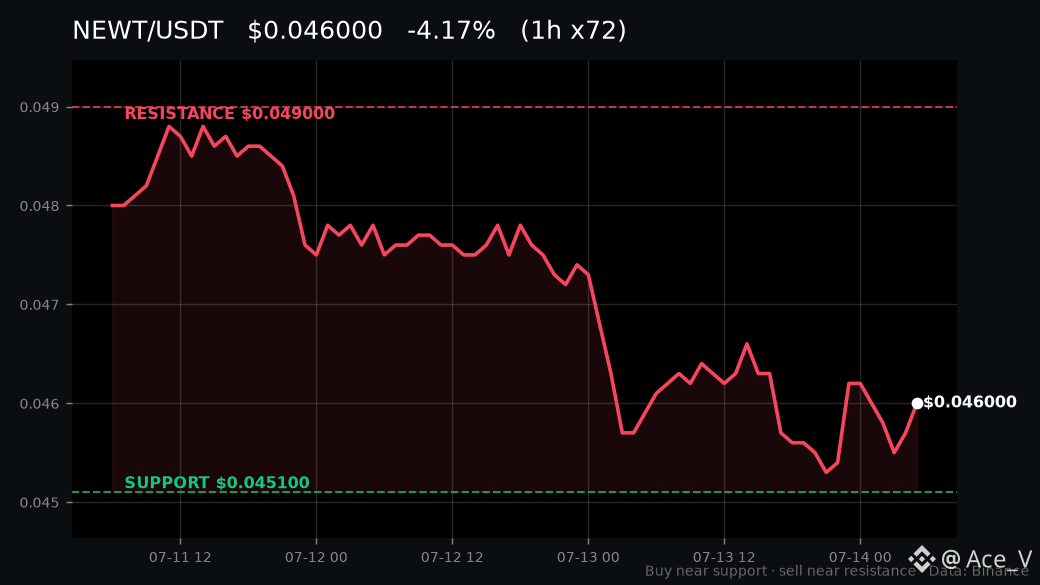
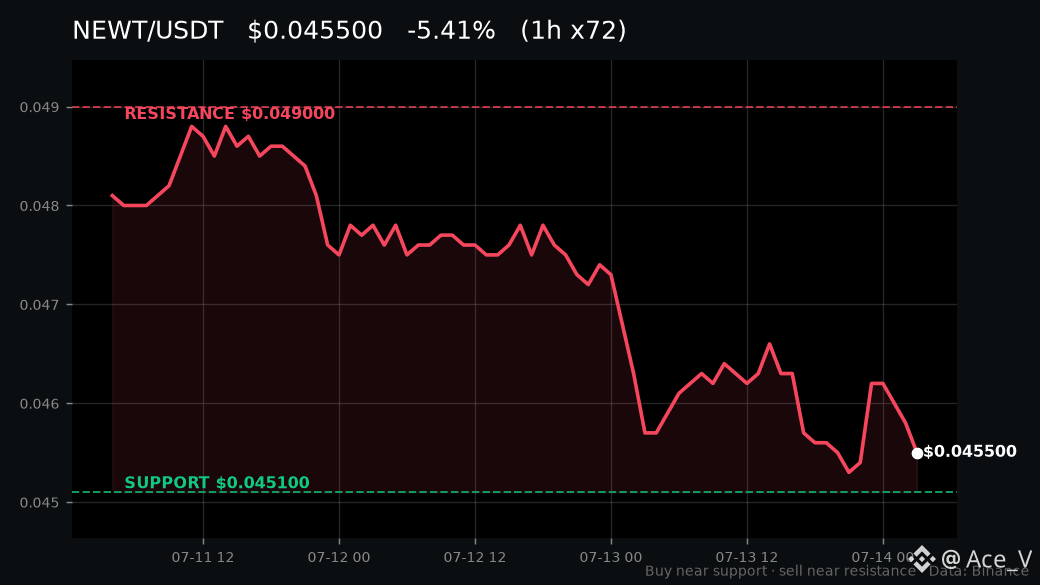
Newtown is trading at $0.045700 on Binance right now, and if you pull up the chart you will notice something important: price is sitting barely above the 72-hour support level at $0.045100 while the 24-hour volume sits at roughly $348,846. That is a thin cushion between current price and the level that has been propping up the entire short-term structure. Meanwhile, resistance overhead at $0.049000 represents the ceiling that bulls have failed to crack for three sessions running. According to CoinMarketCap, NEWT is down 0.44% on the day, which tells you the drift is sideways-to-lower rather than any capitulation — but it also tells you buyers are not yet pressing hard enough to flip the bias.
Let me walk through why this specific positioning matters for anyone watching $NEWT right now.
The structure is straightforward. The 72-hour support at $0.045100 is the line that has kept the short-term trend from breaking down. Every time price has dipped toward it, bids have appeared. That is what support does — it concentrates liquidity and decision-making into a narrow zone. Right now we are roughly $0.0006 above it, which in percentage terms is about 1.3%. That is razor thin. A single high-volume candle on any broad market flush could test it. The question is whether it holds.
If $0.045100 holds on a retest, the bull case stays intact. That means buyers are still defending the range, and the next logical target becomes the resistance at $0.049000. The gap between support and resistance is approximately 8.6%, which is a meaningful range for a low-cap token with modest daily turnover. For a disciplined trader, a hold at support followed by a push toward resistance is the textbook long setup — you define risk below the level, and you let the range do the work.
If $0.045100 loses, the picture changes. A clean break beneath that support with volume confirmation means the floor that held for three days is gone, and prior support tends to become resistance. In that scenario, there is no obvious structural level immediately below to catch the fall on the current timeframe. That is the risk — not a catastrophic collapse, but a void where the next bid might sit. Anyone holding a position would need to decide quickly whether to reduce exposure or wait for a new base to form. The invalidation is clean: close below $0.045100 on meaningful volume, and the setup is simply wrong.
Now layer in the broader backdrop. The latest headlines are not directly tied to NEWT, but they shape the macro mood that flows into every micro-cap on Binance. The White House crypto adviser Patrick Witt heading to military training signals a brief leadership vacuum in US crypto policy discussions. The CLARITY Act picking up a second law enforcement endorsement ahead of its Senate push is structurally positive for the industry long term, but short term it means regulatory uncertainty persists — and that keeps risk appetite muted for tokens like $NEWT that trade on sentiment as much as fundamentals. The US government moving $297 million in seized Bitcoin and Ether to Coinbase Prime is supply-side pressure on majors, and when majors wobble, micro-caps feel the drag harder. None of this breaks NEWT specifically, but it explains why volume is light and why bulls have not yet pushed toward that $0.049000 resistance.
The scenario map is clear. Above $0.045100, you are in the range, and the trade idea is a bounce play toward $0.049000 with defined risk just below support. Below $0.045100, the short-term structure fails and the prudent move is to step aside and wait for a new level to establish itself. At resistance near $0.049000, sellers have capped upside for three days — a rejection there is the take-profit zone for anyone who entered near support. A clean break above $0.049000 with follow-through volume would flip the bias bullish and open up the next range, but that is a conditional outcome, not a given.
The risk note is simple: if you are playing the range, your line in the sand is $0.045100. Below it, the thesis does not exist anymore.
For anyone who sees the setup and wants to act on these exact levels while the structure is still live, the $NEWT pair on Binance is one tap away. The chart is right there, the levels are mapped, and the next candle is where it gets decided.
Levels, not feelings. Not financial advice.
#NEWT #Trading
·
--
Ver tradução
DOT is coiling just above $0.825 support at $0.839, per CoinMarketCap—a level where dip-buyers have quietly stepped in. Up 0.96% in 24 hours with $4.66M volume, it's charting its own path amid headlines of regulatory advances and scam crackdowns. The tape shows a clear range: $0.825 as the floor for buyers, $0.887 resistance as the ceiling for sellers. If support holds, it's a defend-and-accumulate zone; a clean break above resistance could trigger momentum. Lose $0.825, and sellers may push toward lower ground. The $DOT pair is one tap away to trade these exact levels while the setup is live. Defending support here or waiting for the break? Read the tape, not the noise. #Polkadot #DOT #Trading
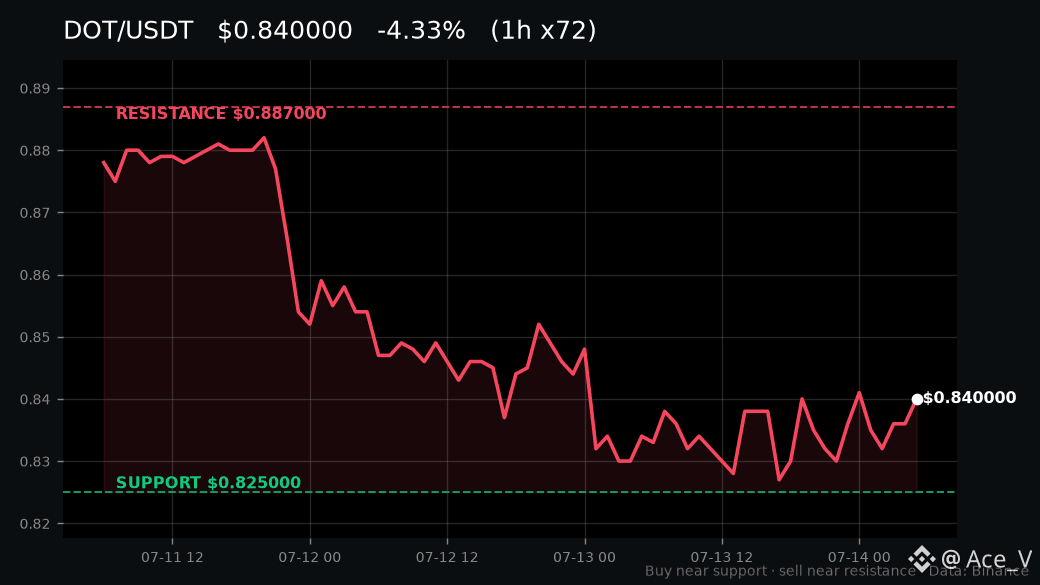
DOT is coiling just above $0.825 support at $0.839, per CoinMarketCap—a level where dip-buyers have quietly stepped in. Up 0.96% in 24 hours with $4.66M volume, it's charting its own path amid headlines of regulatory advances and scam crackdowns.

The tape shows a clear range: $0.825 as the floor for buyers, $0.887 resistance as the ceiling for sellers. If support holds, it's a defend-and-accumulate zone; a clean break above resistance could trigger momentum. Lose $0.825, and sellers may push toward lower ground.

The $DOT pair is one tap away to trade these exact levels while the setup is live. Defending support here or waiting for the break? Read the tape, not the noise.

#Polkadot #DOT #Trading
·
--
Ver tradução
$SUI at $0.7247 on Binance, down 0.66% on $9.13M daily volume. Not a breakout, not a breakdown — a range, and ranges reward discipline over conviction. Support sits at $0.7074. Resistance caps at $0.7548. If price holds that floor, buyers have a defined zone to defend. If it loses $0.7074, the setup flips and patience becomes the position. A break above $0.7548 changes the picture toward momentum. Macro backdrop is quietly constructive — CLARITY Act gaining enforcement support, MiCA compliance tools going live, seized crypto moving to Coinbase Prime. Not SUI-specific catalysts, but the structural floor beneath the market is thickening around it. Holding the $0.7074 support or waiting for the $0.7548 break? The $SUI pair is one tap away when your level is set. Protect the downside; the upside takes care of itself. Not financial advice. #SUI #BinanceSquare
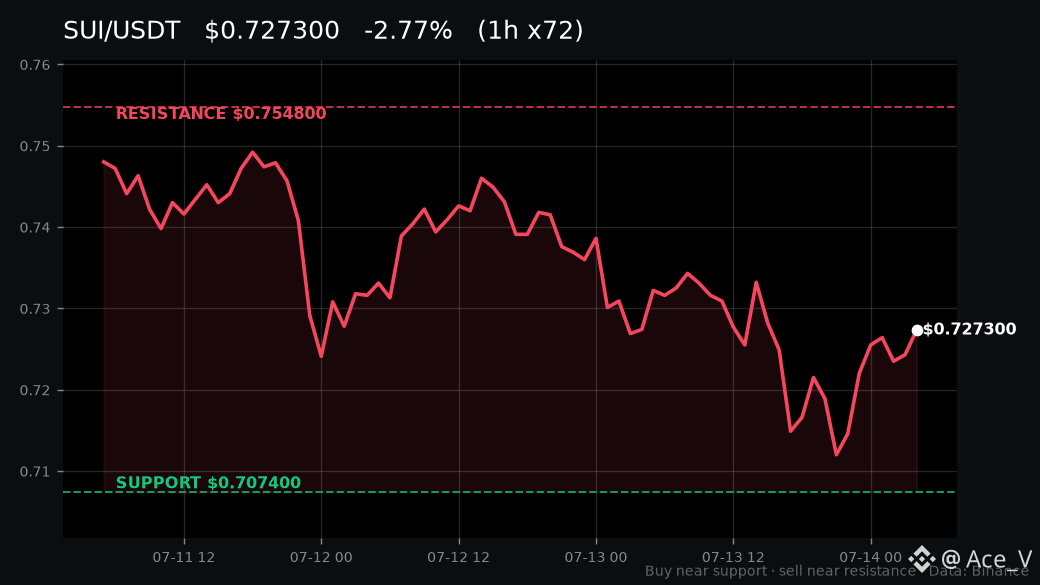
$SUI at $0.7247 on Binance, down 0.66% on $9.13M daily volume. Not a breakout, not a breakdown — a range, and ranges reward discipline over conviction.

Support sits at $0.7074. Resistance caps at $0.7548. If price holds that floor, buyers have a defined zone to defend. If it loses $0.7074, the setup flips and patience becomes the position. A break above $0.7548 changes the picture toward momentum.

Macro backdrop is quietly constructive — CLARITY Act gaining enforcement support, MiCA compliance tools going live, seized crypto moving to Coinbase Prime. Not SUI-specific catalysts, but the structural floor beneath the market is thickening around it.

Holding the $0.7074 support or waiting for the $0.7548 break? The $SUI pair is one tap away when your level is set.

Protect the downside; the upside takes care of itself. Not financial advice.

#SUI #BinanceSquare
·
--
Artigo
Toncoin Mantém uma Faixa Apertada Enquanto o Fluxo Mais Amplo Muda por BaixoUS$1,60 está neste momento na fila de ofertas da Binance para a Toncoin. Alta de 0,95% nas últimas 24 horas, com volume em torno de US$7,72 milhões. À primeira vista, nada de extraordinário. Por baixo da superfície, a estrutura conta uma história mais específica — uma que estreita a janela de decisão para qualquer pessoa acompanhando o gráfico do $TON esta semana. Vamos nos ancorar nos níveis que importam. Nas últimas 72 horas, o $TON abriu uma faixa bem definida: suporte em US$1,53 e resistência em US$1,64. O valor atual de US$1,60 coloca o token quase exatamente no meio desse corredor, cerca de 4,3% acima do piso e 2,5% abaixo do teto. Essa assimetria importa. O preço está mais perto da resistência do que do suporte, o que significa que o caminho de menor resistência — no sentido técnico literal — é para cima, mas apenas se os compradores conseguirem romper a tampa de US$1,64 sem travar.

Toncoin Mantém uma Faixa Apertada Enquanto o Fluxo Mais Amplo Muda por Baixo

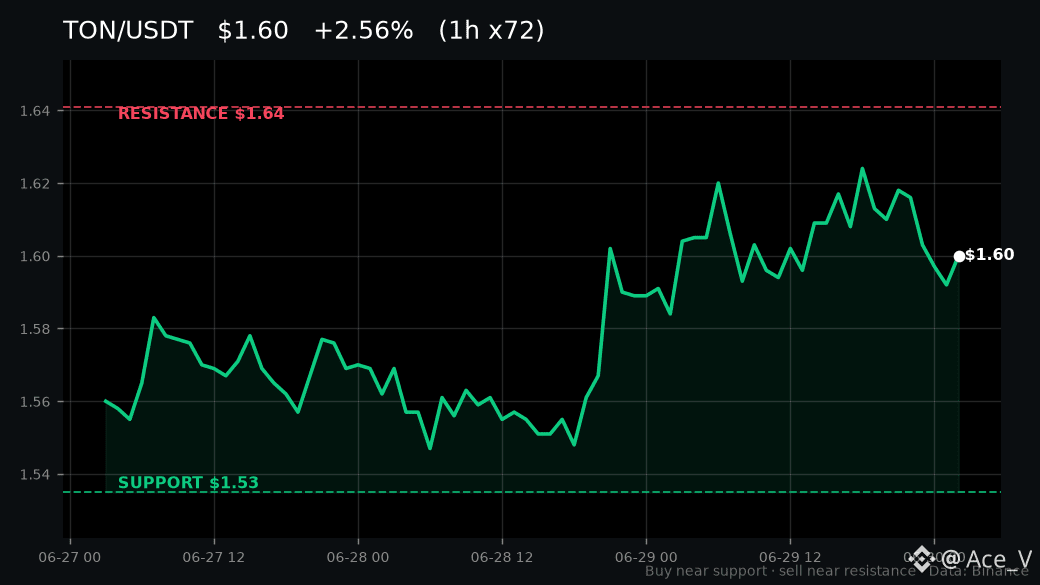
US$1,60 está neste momento na fila de ofertas da Binance para a Toncoin. Alta de 0,95% nas últimas 24 horas, com volume em torno de US$7,72 milhões. À primeira vista, nada de extraordinário. Por baixo da superfície, a estrutura conta uma história mais específica — uma que estreita a janela de decisão para qualquer pessoa acompanhando o gráfico do $TON esta semana.
Vamos nos ancorar nos níveis que importam. Nas últimas 72 horas, o $TON abriu uma faixa bem definida: suporte em US$1,53 e resistência em US$1,64. O valor atual de US$1,60 coloca o token quase exatamente no meio desse corredor, cerca de 4,3% acima do piso e 2,5% abaixo do teto. Essa assimetria importa. O preço está mais perto da resistência do que do suporte, o que significa que o caminho de menor resistência — no sentido técnico literal — é para cima, mas apenas se os compradores conseguirem romper a tampa de US$1,64 sem travar.
·
--
A clareza regulatória está se acumulando rapidamente. A Lei CLARITY acabou de garantir um segundo respaldo para aplicação da lei antes de sua investida no Senado, e uma grande firma global lançou uma ferramenta de conformidade com a MiCA na mesma semana em que as regras da UE ficaram mais rígidas — segundo o Cointelegraph. Esse é exatamente o cenário em que a campanha da Binance Square da GRVT está chegando. A tese da bolsa híbrida se baseia em uma infraestrutura de conformidade de nível institucional, e os traders estão de olho no $GRVT enquanto a maré regulatória favorece venues estruturados. O governo dos EUA também movimentou hoje US$ 297M em BTC e ETH apreendidos para a Coinbase Prime — as “rails” de custódia institucional agora são requisitos básicos, não um diferencial. Nenhum nível específico de suporte ou resistência está sendo exibido para $GRVT neste momento, então o mapa de negociações ainda está sendo formado. Quando uma faixa se confirmar, a direção da quebra definirá a próxima perna. Não é aconselhamento financeiro. Vamos observar o próximo print. #GRVT #Altcoins
A clareza regulatória está se acumulando rapidamente. A Lei CLARITY acabou de garantir um segundo respaldo para aplicação da lei antes de sua investida no Senado, e uma grande firma global lançou uma ferramenta de conformidade com a MiCA na mesma semana em que as regras da UE ficaram mais rígidas — segundo o Cointelegraph.

Esse é exatamente o cenário em que a campanha da Binance Square da GRVT está chegando. A tese da bolsa híbrida se baseia em uma infraestrutura de conformidade de nível institucional, e os traders estão de olho no $GRVT enquanto a maré regulatória favorece venues estruturados.

O governo dos EUA também movimentou hoje US$ 297M em BTC e ETH apreendidos para a Coinbase Prime — as “rails” de custódia institucional agora são requisitos básicos, não um diferencial.

Nenhum nível específico de suporte ou resistência está sendo exibido para $GRVT neste momento, então o mapa de negociações ainda está sendo formado. Quando uma faixa se confirmar, a direção da quebra definirá a próxima perna.

Não é aconselhamento financeiro. Vamos observar o próximo print.

#GRVT #Altcoins
·
--
$6,43 é onde a AVAX está agora — respirando por um fio, subindo apenas 0,19% nas últimas 24 horas com US$ 13,92M de volume segundo a CoinMarketCap. Isso é compressão, não convicção. $AVAX #Avalanche #AVAX #Crypto
$6,43 é onde a AVAX está agora — respirando por um fio, subindo apenas 0,19% nas últimas 24 horas com US$ 13,92M de volume segundo a CoinMarketCap. Isso é compressão, não convicção.

$AVAX

#Avalanche #AVAX #Crypto
·
--
Ver tradução
ADA is trading at $0.1564 on Binance, just $0.001 above its 72-hour support at $0.1554. That's a razor-thin cushion worth watching. Here's how to read it. Support is the price level where buyers have repeatedly stepped in to defend. Resistance at $0.1745 is where sellers keep capping momentum. Price right now sits at the bottom of that range. If ADA holds $0.1554, the range stays intact and buyers still control the floor. If it loses that level on real volume, the structure breaks and the move accelerates lower. A push above $0.1745 would flip the picture entirely — resistance becoming a new base, momentum shifting up. Volume sits at $11.83M over 24 hours with a mild 0.95% pullback per CoinMarketCap. No panic, just a market testing its edge while regulation headlines like the CLARITY Act and new MiCA compliance tools keep broader sentiment cautious. Defending support or waiting for the break? The $ADA pair on Binance is one tap away when you're ready to trade those levels while the setup is still live. Understand it, then decide. #Cardano #ADA #Crypto
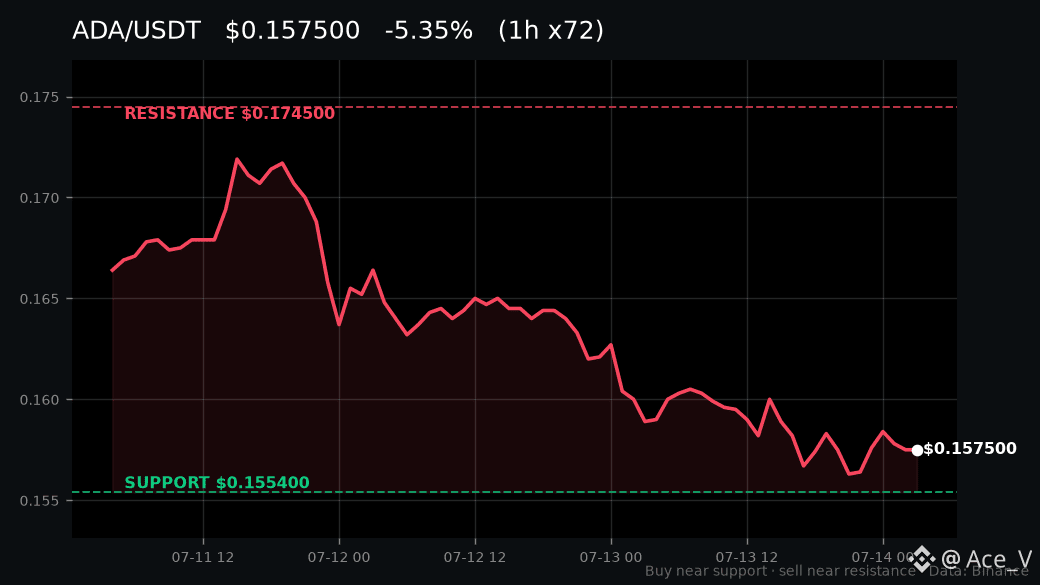
ADA is trading at $0.1564 on Binance, just $0.001 above its 72-hour support at $0.1554. That's a razor-thin cushion worth watching.

Here's how to read it. Support is the price level where buyers have repeatedly stepped in to defend. Resistance at $0.1745 is where sellers keep capping momentum. Price right now sits at the bottom of that range.

If ADA holds $0.1554, the range stays intact and buyers still control the floor. If it loses that level on real volume, the structure breaks and the move accelerates lower.

A push above $0.1745 would flip the picture entirely — resistance becoming a new base, momentum shifting up.

Volume sits at $11.83M over 24 hours with a mild 0.95% pullback per CoinMarketCap. No panic, just a market testing its edge while regulation headlines like the CLARITY Act and new MiCA compliance tools keep broader sentiment cautious.

Defending support or waiting for the break? The $ADA pair on Binance is one tap away when you're ready to trade those levels while the setup is still live.

Understand it, then decide.

#Cardano #ADA #Crypto
·
--
Artigo
Dogecoin a US$ 0.071850 — O indicador que todo trader de memes deveria observarTodo ciclo cripto tem um canário na mina de carvão. Para o setor mais amplo de moedas meme — e, honestamente, para o apetite especulativo em todo o mercado — esse canário é o Dogecoin. Agora ele está em US$ 0.071850 na Binance, com queda de 1,06% nas últimas 24 horas, e US$ 21,12 milhões em volume diário. Não é uma queda. Não é uma ruptura. É apenas o mercado segurando o fôlego num nível que importa. Deixe-me explicar por que esse preço específico importa mais do que você talvez pense. Dois níveis definem o campo de batalha do Dogecoin nas próximas 72 horas. O suporte fica em US$ 0.070920. A resistência limita tudo em US$ 0.075600. Isso coloca o DOGE aproximadamente 1,3% acima do seu piso e cerca de 5,2% abaixo do teto — um intervalo curto o suficiente para que qualquer impulso de volume relevante em qualquer direção resolva essa faixa rapidamente.

Dogecoin a US$ 0.071850 — O indicador que todo trader de memes deveria observar

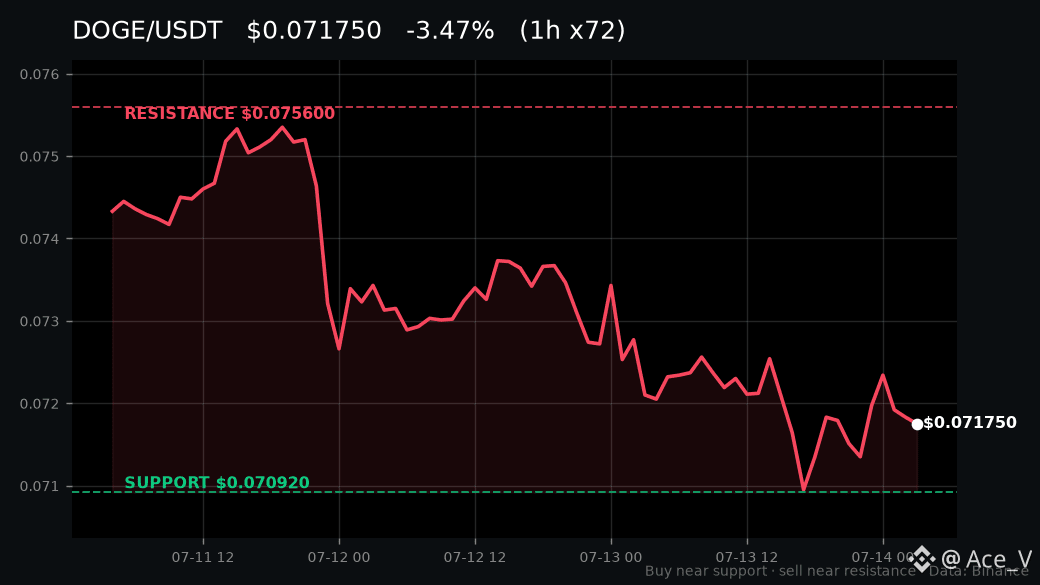
Todo ciclo cripto tem um canário na mina de carvão. Para o setor mais amplo de moedas meme — e, honestamente, para o apetite especulativo em todo o mercado — esse canário é o Dogecoin. Agora ele está em US$ 0.071850 na Binance, com queda de 1,06% nas últimas 24 horas, e US$ 21,12 milhões em volume diário. Não é uma queda. Não é uma ruptura. É apenas o mercado segurando o fôlego num nível que importa.
Deixe-me explicar por que esse preço específico importa mais do que você talvez pense.
Dois níveis definem o campo de batalha do Dogecoin nas próximas 72 horas. O suporte fica em US$ 0.070920. A resistência limita tudo em US$ 0.075600. Isso coloca o DOGE aproximadamente 1,3% acima do seu piso e cerca de 5,2% abaixo do teto — um intervalo curto o suficiente para que qualquer impulso de volume relevante em qualquer direção resolva essa faixa rapidamente.
·
--
Ver tradução
Everyone's buzzing about NEWT's Binance Square campaign and the fresh regulatory clarity from the CLARITY Act and EU's MiCA tool. Feels like momentum is building, right? But here's what the tape actually shows: NEWT sits at $0.0458, down 1.5% in 24h on just $339K volume. That's thin. Support is pinned at $0.0451 — barely 1.5% below — and resistance caps at $0.049. If $0.0451 holds, this is the dip-buy zone where buyers step in. If it cracks, the slide accelerates with no obvious floor beneath. A clean break above $0.049 flips the structure bullish instead. The $NEWT pair is one tap away while this level is still undecided. Defending support here or waiting for the break? Not financial advice. When everyone agrees, check the other side. #NEWT #Markets
Everyone's buzzing about NEWT's Binance Square campaign and the fresh regulatory clarity from the CLARITY Act and EU's MiCA tool. Feels like momentum is building, right?

But here's what the tape actually shows: NEWT sits at $0.0458, down 1.5% in 24h on just $339K volume. That's thin. Support is pinned at $0.0451 — barely 1.5% below — and resistance caps at $0.049.

If $0.0451 holds, this is the dip-buy zone where buyers step in. If it cracks, the slide accelerates with no obvious floor beneath. A clean break above $0.049 flips the structure bullish instead.

The $NEWT pair is one tap away while this level is still undecided. Defending support here or waiting for the break?

Not financial advice. When everyone agrees, check the other side.

#NEWT #Markets
·
--
Ver tradução
$BTC is down 1.66% over the last 24 hours, per CoinMarketCap. $BNB is down just 0.82% in the same window. That gap means BNB is holding up nearly twice as well as Bitcoin while… $BNB $BTC #BNB #Bitcoin #BTC #Trading
$BTC is down 1.66% over the last 24 hours, per CoinMarketCap. $BNB is down just 0.82% in the same window. That gap means BNB is holding up nearly twice as well as Bitcoin while…

$BNB $BTC

#BNB #Bitcoin #BTC #Trading
·
--
Artigo
Ver tradução
ETH at $1,783 Is Boring. That's Exactly Why It MattersSomebody just moved $122 million through a Thai scam wallet while you were sleeping, and meanwhile ETH is sitting at $1,783.71 doing absolutely nothing spectacular. Down 1.32% in the last twenty-four hours. Volume at $440.76 million on Binance. The second-largest cryptocurrency on the planet is behaving like a mid-level accountant on a Tuesday — no drama, no surprises, just quietly existing between two very specific numbers. And honestly? That quiet might be the loudest signal on your screen right now. Here is the part most people scrolling past will miss entirely. Ethereum is compressed between $1,750.20 support and $1,846.00 resistance on the seventy-two-hour chart. That is roughly a $96 range, which translates to about 5.5% of room in either direction. For an asset that regularly swallows 10% swings before lunch, this is a coiled spring pretending to be a napping cat. The price is currently sitting closer to the floor than the ceiling, which means the interesting math is happening right now, not in some hypothetical future. Let's talk about what that means practically, without the fortune-cookie predictions. If ETH holds the $1,750.20 support level, that floor is doing its job — buyers have stepped in there before and the fact that price has not broken below it tells you demand still exists at that zone. Traders who respect that level are essentially saying, if the dip finds buyers again here, the range stays intact and the path of least resistance rotates back up toward that $1,846 ceiling. On the other hand, if ETH loses $1,750.20 on a closing basis, the range breaks down, and there is no obvious structural floor immediately below it that the seventy-two-hour chart is showing you. That is when momentum shifts to sellers and the next leg lower gets its invitation. Now flip it. Resistance at $1,846.00 is where the ceiling lives. If ETH pushes above that level with volume, the range resolves upward and the prior compression turns into fuel. Until then, every rally toward $1,846 is a zone where sellers have historically taken profit. The current price of $1,783.71 sits roughly $62 below resistance and roughly $33 above support. That asymmetry matters — the risk to the downside is tighter than the room to the upside, which makes the defense of $1,750.20 the single most important thing to watch on this chart today. Meanwhile, the macro backdrop is doing its usual thing of being simultaneously boring and enormous. The CLARITY Act just picked up a second law enforcement endorsement ahead of its Senate push, which signals that U.S. regulatory frameworks for crypto are tightening into something resembling actual legislation. Japan is warming up to crypto-backed credit. A major global law firm just launched a MiCA compliance tool to help crypto companies navigate the European rulebook. None of this moves ETH's price thirty dollars in an hour, but all of it builds the infrastructure layer that determines whether the next five thousand dollars of upside has a foundation under it. Regulation is not a headline event — it is a slow structural bid that shows up in flows months later. ETF flows are the other silent variable. Ethereum spot ETF activity has been the key pressure gauge for institutional appetite, and the subdued on-chain volume paired with range-bound price action suggests the market is waiting on a catalyst rather than reacting to one. When ETF inflows tick up meaningfully against a compressing price like this, it often precedes the resolution of the range. When they stall, the range just grinds longer. Right now the tape is telling you to watch, not to guess. So the honest read is this: ETH is not broken, it is not mooning, it is consolidating between two clearly defined levels on a timeframe traders actually care about. The setup is live, the levels are visible, and the decision point is approaching whether price comes to support or resistance first. The $ETH pair on Binance is one tap away when you want to act on those exact levels. Defending the floor here or waiting for the break — which side are you watching? Laugh, then look at the chart. Not financial advice. #Ethereum #ETH #BinanceSquare

ETH at $1,783 Is Boring. That's Exactly Why It Matters

Somebody just moved $122 million through a Thai scam wallet while you were sleeping, and meanwhile ETH is sitting at $1,783.71 doing absolutely nothing spectacular. Down 1.32% in the last twenty-four hours. Volume at $440.76 million on Binance. The second-largest cryptocurrency on the planet is behaving like a mid-level accountant on a Tuesday — no drama, no surprises, just quietly existing between two very specific numbers. And honestly? That quiet might be the loudest signal on your screen right now.
Here is the part most people scrolling past will miss entirely. Ethereum is compressed between $1,750.20 support and $1,846.00 resistance on the seventy-two-hour chart. That is roughly a $96 range, which translates to about 5.5% of room in either direction. For an asset that regularly swallows 10% swings before lunch, this is a coiled spring pretending to be a napping cat. The price is currently sitting closer to the floor than the ceiling, which means the interesting math is happening right now, not in some hypothetical future.
Let's talk about what that means practically, without the fortune-cookie predictions. If ETH holds the $1,750.20 support level, that floor is doing its job — buyers have stepped in there before and the fact that price has not broken below it tells you demand still exists at that zone. Traders who respect that level are essentially saying, if the dip finds buyers again here, the range stays intact and the path of least resistance rotates back up toward that $1,846 ceiling. On the other hand, if ETH loses $1,750.20 on a closing basis, the range breaks down, and there is no obvious structural floor immediately below it that the seventy-two-hour chart is showing you. That is when momentum shifts to sellers and the next leg lower gets its invitation.
Now flip it. Resistance at $1,846.00 is where the ceiling lives. If ETH pushes above that level with volume, the range resolves upward and the prior compression turns into fuel. Until then, every rally toward $1,846 is a zone where sellers have historically taken profit. The current price of $1,783.71 sits roughly $62 below resistance and roughly $33 above support. That asymmetry matters — the risk to the downside is tighter than the room to the upside, which makes the defense of $1,750.20 the single most important thing to watch on this chart today.
Meanwhile, the macro backdrop is doing its usual thing of being simultaneously boring and enormous. The CLARITY Act just picked up a second law enforcement endorsement ahead of its Senate push, which signals that U.S. regulatory frameworks for crypto are tightening into something resembling actual legislation. Japan is warming up to crypto-backed credit. A major global law firm just launched a MiCA compliance tool to help crypto companies navigate the European rulebook. None of this moves ETH's price thirty dollars in an hour, but all of it builds the infrastructure layer that determines whether the next five thousand dollars of upside has a foundation under it. Regulation is not a headline event — it is a slow structural bid that shows up in flows months later.
ETF flows are the other silent variable. Ethereum spot ETF activity has been the key pressure gauge for institutional appetite, and the subdued on-chain volume paired with range-bound price action suggests the market is waiting on a catalyst rather than reacting to one. When ETF inflows tick up meaningfully against a compressing price like this, it often precedes the resolution of the range. When they stall, the range just grinds longer. Right now the tape is telling you to watch, not to guess.
So the honest read is this: ETH is not broken, it is not mooning, it is consolidating between two clearly defined levels on a timeframe traders actually care about. The setup is live, the levels are visible, and the decision point is approaching whether price comes to support or resistance first.
The $ETH pair on Binance is one tap away when you want to act on those exact levels. Defending the floor here or waiting for the break — which side are you watching?
Laugh, then look at the chart.
Not financial advice.
#Ethereum #ETH #BinanceSquare
·
--
Ver tradução
$62,511 is where Bitcoin sits right now, just above the 72-hour support at $61,824 per CoinMarketCap — a level that has quietly held as the floor this week. That $61,824 line is the sand. If buyers defend it here, the setup points back toward resistance at $64,504. Losing it hands momentum to sellers and opens the door to a deeper retrace. On the upside, $64,504 is the ceiling. A clean break above it would signal buyers reclaiming control — that's where the tape shifts. Regulatory momentum is building quietly beneath the surface. The CLARITY Act picked up another law enforcement endorsement ahead of its Senate push, and major firms are launching MiCA compliance tools — the infrastructure is catching up to the asset. Defending support here or waiting for the break? The $BTC pair is one tap away when you want to act on these levels while the setup is still live. Think in cycles, not candles. #Bitcoin #BTC #Crypto
$62,511 is where Bitcoin sits right now, just above the 72-hour support at $61,824 per CoinMarketCap — a level that has quietly held as the floor this week.

That $61,824 line is the sand. If buyers defend it here, the setup points back toward resistance at $64,504. Losing it hands momentum to sellers and opens the door to a deeper retrace.

On the upside, $64,504 is the ceiling. A clean break above it would signal buyers reclaiming control — that's where the tape shifts.

Regulatory momentum is building quietly beneath the surface. The CLARITY Act picked up another law enforcement endorsement ahead of its Senate push, and major firms are launching MiCA compliance tools — the infrastructure is catching up to the asset.

Defending support here or waiting for the break? The $BTC pair is one tap away when you want to act on these levels while the setup is still live.

Think in cycles, not candles.

#Bitcoin #BTC #Crypto
·
--
Ver tradução
Regulatory clarity is hitting the tape hard this week. The CLARITY Act just picked up a second law enforcement endorsement before its Senate push, and a global law firm launched a dedicated MiCA compliance tool for EU crypto firms. That is the kind of institutional infrastructure build that changes where smart money flows. GRVT sits right in the center of this shift. As a compliance-first decentralized exchange with options and structured products, every new regulatory framework that goes live is a tailwind for its thesis. Japan expanding crypto credit access only widens the addressable pool. What matters now is whether $GRVT responds to this macro catalyst with volume. The news flow is undeniably supportive — the CLARITY Act and MiCA tooling both reduce friction for institutional desks to onboard onto regulated DeFi venues. This is the environment where compliant infrastructure plays get repriced. Watch how $GRVT reacts to this wave of headlines over the next few sessions. Not financial advice. The $GRVT pair is one tap away when you want to act on the setup. Levels, not feelings. #GRVT #Crypto
Regulatory clarity is hitting the tape hard this week. The CLARITY Act just picked up a second law enforcement endorsement before its Senate push, and a global law firm launched a dedicated MiCA compliance tool for EU crypto firms.

That is the kind of institutional infrastructure build that changes where smart money flows.

GRVT sits right in the center of this shift. As a compliance-first decentralized exchange with options and structured products, every new regulatory framework that goes live is a tailwind for its thesis. Japan expanding crypto credit access only widens the addressable pool.

What matters now is whether $GRVT responds to this macro catalyst with volume. The news flow is undeniably supportive — the CLARITY Act and MiCA tooling both reduce friction for institutional desks to onboard onto regulated DeFi venues.

This is the environment where compliant infrastructure plays get repriced. Watch how $GRVT reacts to this wave of headlines over the next few sessions.

Not financial advice.

The $GRVT pair is one tap away when you want to act on the setup.

Levels, not feelings.

#GRVT #Crypto
Inicia sessão para explorar mais conteúdos
Junta-te a utilizadores de criptomoedas de todo o mundo na Binance Square
⚡️ Obtém informações úteis e recentes sobre criptomoedas.
💬 Com a confiança da maior exchange de criptomoedas do mundo.
👍 Descobre perspetivas reais de criadores verificados.
E-mail/Número de telefone
Mapa do sítio
Preferências de cookies
Termos e Condições da Plataforma