
Fatima_779
14.2k Publicações

Fatima_779
Denunciar
Bloquear Utilizador
I'm trader and giving trade signals Long/Short Setup 📉📈🤗
Aberto ao trading
Trader Frequente
2.9 ano(s)
646 A seguir
9.4K+ Seguidores
20.4K+ Gostaram
Publicações
Portfólio
Tudo
Cotações
Vídeos
Em direto
PINNED
·
--
Pessoal, um envelope vermelho bem grande 👇
resgatem ✅
repostem 🧐
curtam 🍨
$PIEVERSE
$EVAA
$VVV
Pessoal, um envelope vermelho bem grande 👇
resgatem ✅
repostem 🧐
curtam 🍨
$PIEVERSE
$EVAA
$VVV
resgatem ✅
repostem 🧐
curtam 🍨
$PIEVERSE
$EVAA
$VVV
112
2
10
112
PINNED
·
--
Verificado
Ver tradução
#sxt $SXT One thing I find interesting about Space and Time is how it tackles a problem most blockchain users rarely think about: trusting data.
Its Proof of SQL technology allows developers to query large datasets and generate cryptographic proofs that show the results were calculated correctly. In simple words, a smart contract can check whether data is reliable without doing all the heavy calculations itself.
Another interesting detail is that $SXT Chain stores cryptographic commitments instead of putting entire databases on-chain. This helps keep verification practical.
$SXT supports the network through fees and staking, but real adoption is still the bigger question. Proving costs, reliable data sources, and developer activity will matter more than technical promises.
I think the idea has potential, but execution will decide its value.
Will developers actually choose verifiable databases over traditional solutions?@SpaceandTimeDB
#sxt $SXT One thing I find interesting about Space and Time is how it tackles a problem most blockchain users rarely think about: trusting data.
Its Proof of SQL technology allows developers to query large datasets and generate cryptographic proofs that show the results were calculated correctly. In simple words, a smart contract can check whether data is reliable without doing all the heavy calculations itself.
Another interesting detail is that $SXT Chain stores cryptographic commitments instead of putting entire databases on-chain. This helps keep verification practical.
$SXT supports the network through fees and staking, but real adoption is still the bigger question. Proving costs, reliable data sources, and developer activity will matter more than technical promises.
I think the idea has potential, but execution will decide its value.
Will developers actually choose verifiable databases over traditional solutions?@SpaceandTime
Its Proof of SQL technology allows developers to query large datasets and generate cryptographic proofs that show the results were calculated correctly. In simple words, a smart contract can check whether data is reliable without doing all the heavy calculations itself.
Another interesting detail is that $SXT Chain stores cryptographic commitments instead of putting entire databases on-chain. This helps keep verification practical.
$SXT supports the network through fees and staking, but real adoption is still the bigger question. Proving costs, reliable data sources, and developer activity will matter more than technical promises.
I think the idea has potential, but execution will decide its value.
Will developers actually choose verifiable databases over traditional solutions?@SpaceandTime

7
2
12
121
·
--
Ver tradução
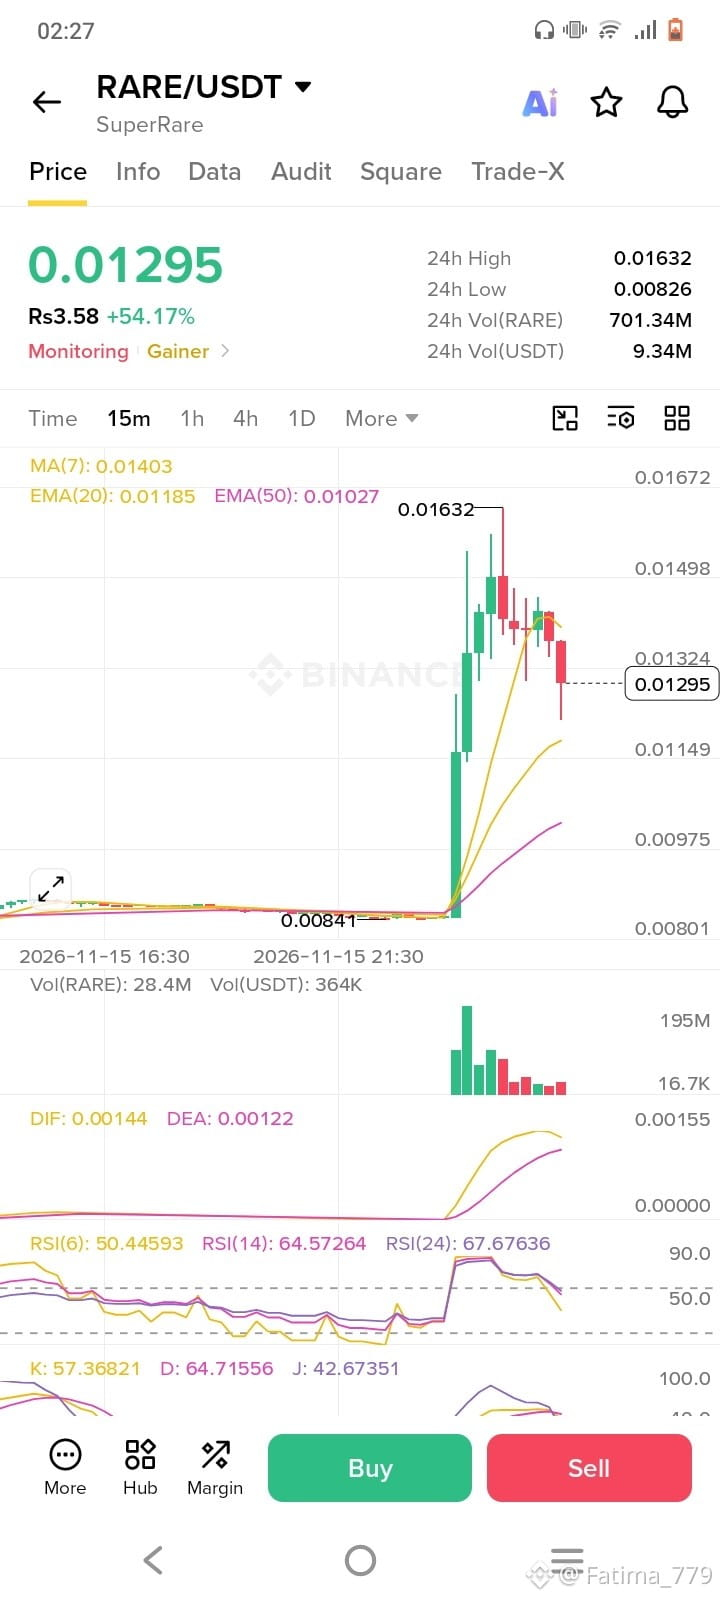
$RARE coin waking up guys go and trade fast fast fast hehe 😁😜
{future}(RAREUSDT)
$RARE coin waking up guys go and trade fast fast fast hehe 😁😜
1
105
·
--
Em Alta
Ei, traders 😃 parem... parem... parem... não saiam daí 😭 olhem essa moeda em alta, hehe 😁
qual moeda vocês escolheriam para uma operação de 20x aqui 👇
$VVV
{future}(VVVUSDT)
$TAC
{future}(TACUSDT)
$IDOL
{future}(IDOLUSDT)
Ei, traders 😃 parem... parem... parem... não saiam daí 😭 olhem essa moeda em alta, hehe 😁
qual moeda vocês escolheriam para uma operação de 20x aqui 👇
$VVV
$TAC
$IDOL
qual moeda vocês escolheriam para uma operação de 20x aqui 👇
$VVV
$TAC
$IDOL
$VVV
$IDOL
$TAC
No one
22 hora(s) restante(s)
1
5
176
·
--
veja esta publicação
veja esta publicação
Fatima_779
·
--
Moedas em maior valorização 👇👀
🚀 $PIEVERSE
🔥 $NIGHT
📈 $VVV
Qual moeda você está acompanhando hoje? 👇
Deixe sua melhor escolha nos comentários! 🎯
🚀 $PIEVERSE
🔥 $NIGHT
📈 $VVV
Qual moeda você está acompanhando hoje? 👇
Deixe sua melhor escolha nos comentários! 🎯
1
41
·
--
Ver tradução
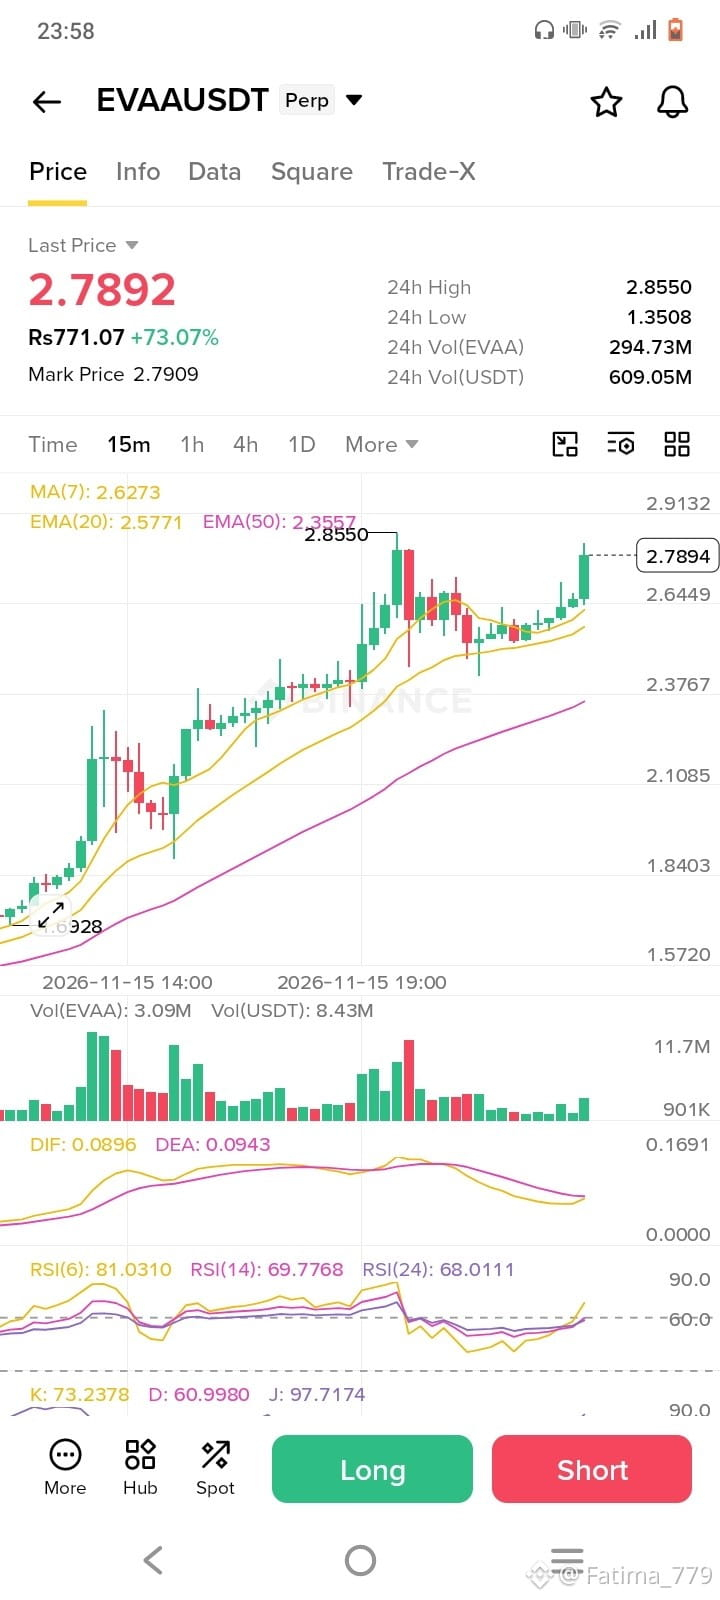
My friend today very happy because she trde on $EVAA coin and take profit it hehe 😂
My friend today very happy because she trde on $EVAA coin and take profit it hehe 😂

5
67
·
--
$LINK
$LINK
Fatima_779
·
--
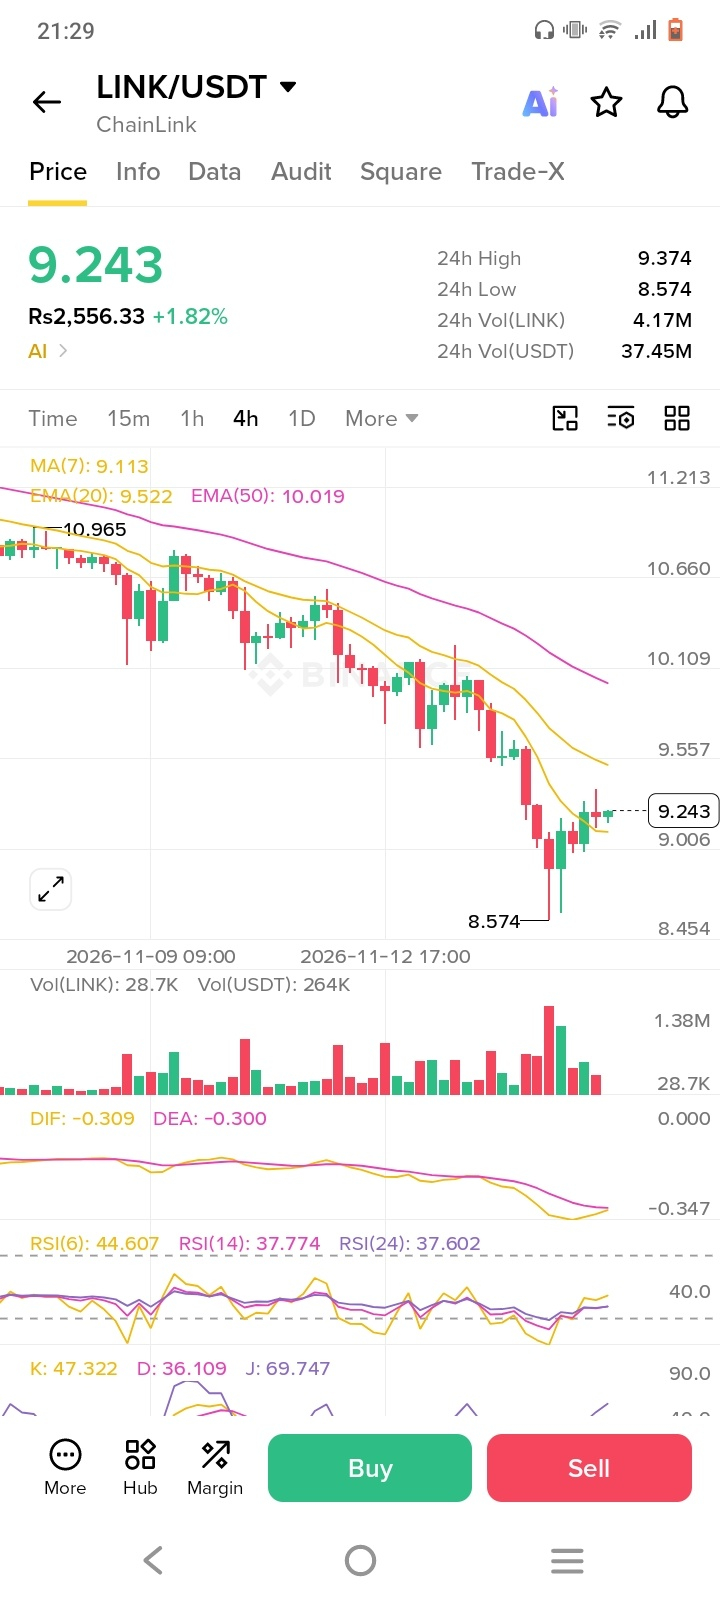
Ei, traders, feliz domingo 😁 deem uma olhada em $LINK coin hoje hehe 😂

1
120
·
--
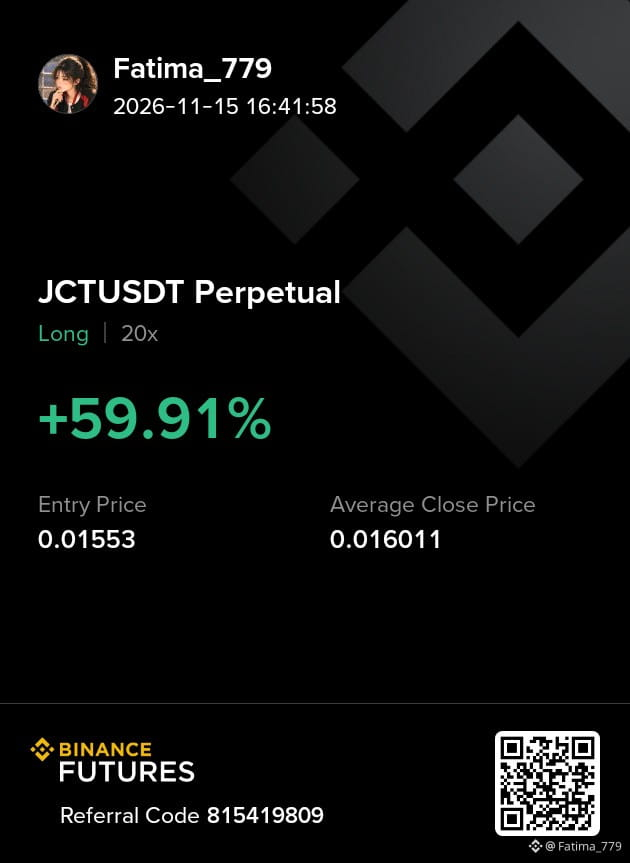
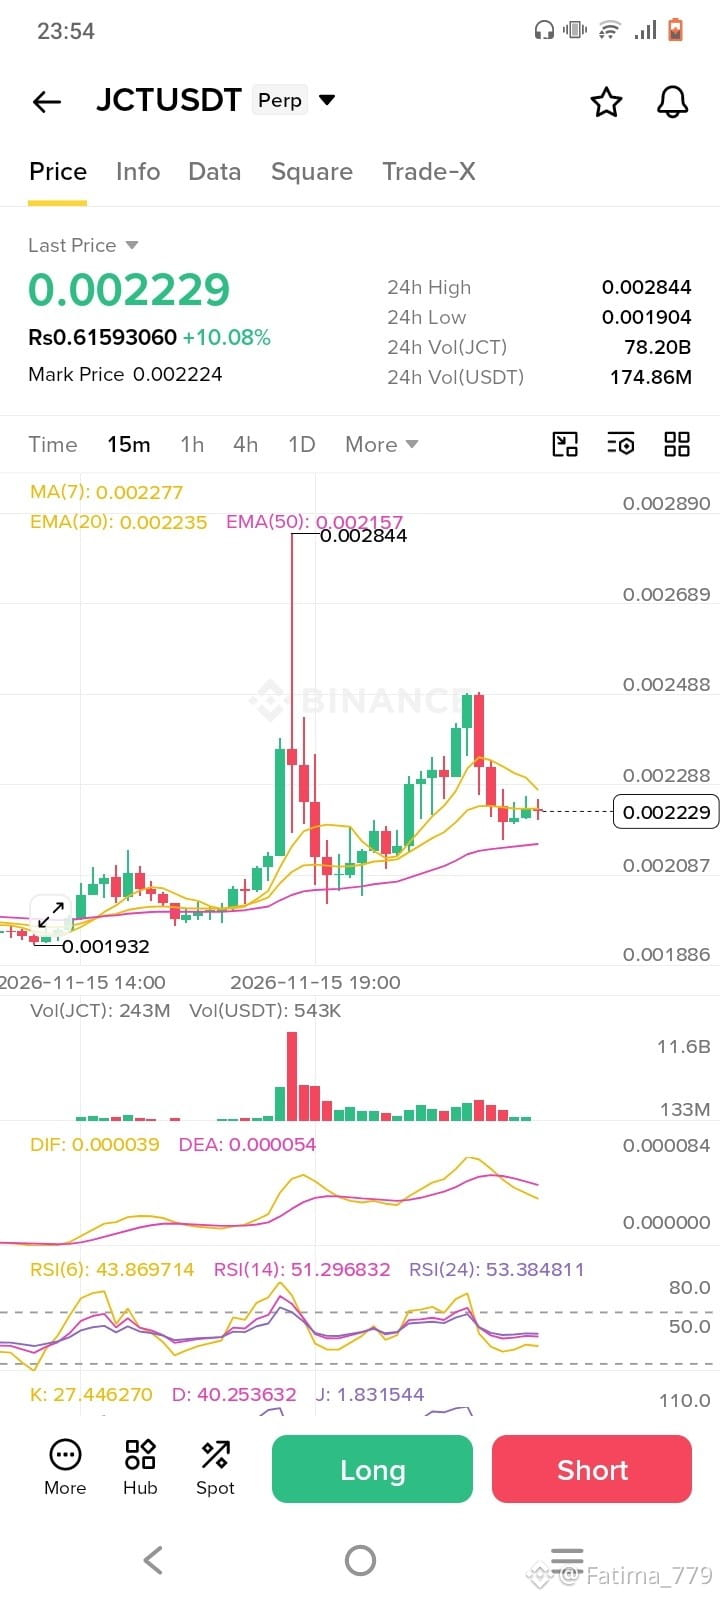
Trading de $JCT de 30 dias no valor de 107.3 USDT

1
128
·
--
olhe
olhe
Fatima_779
·
--
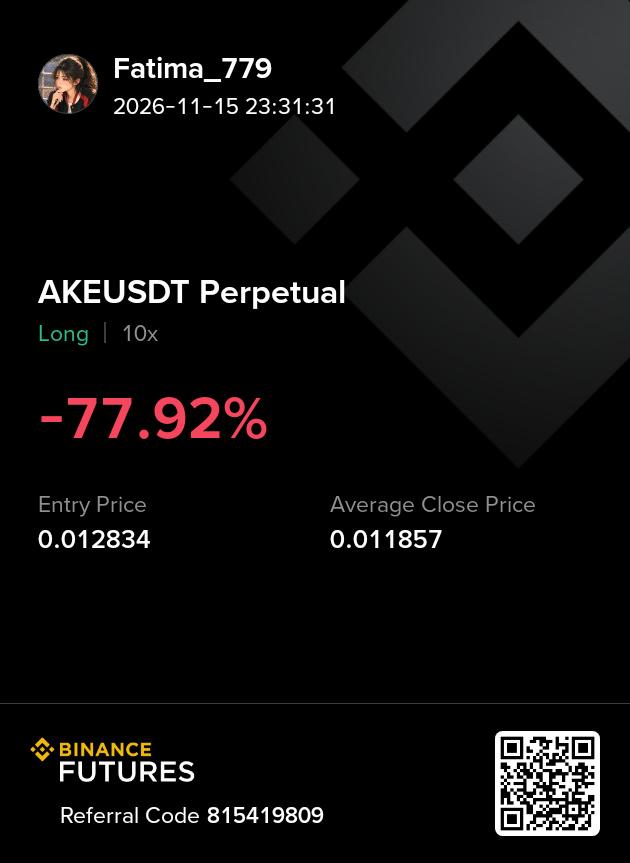
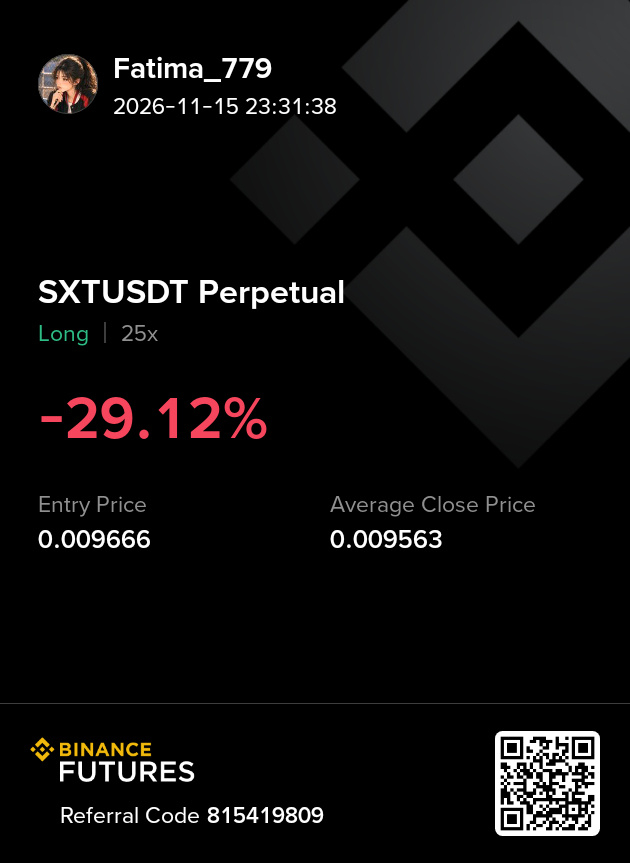
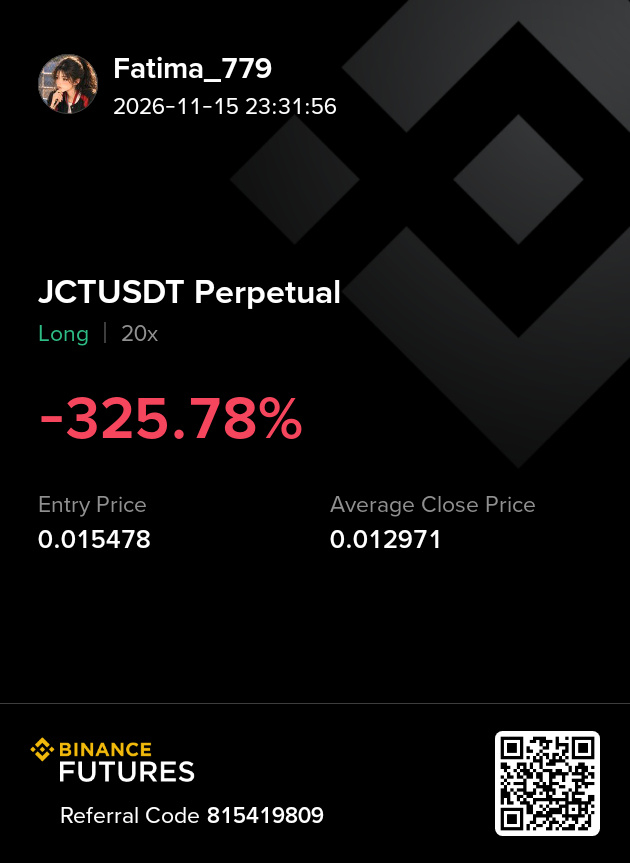
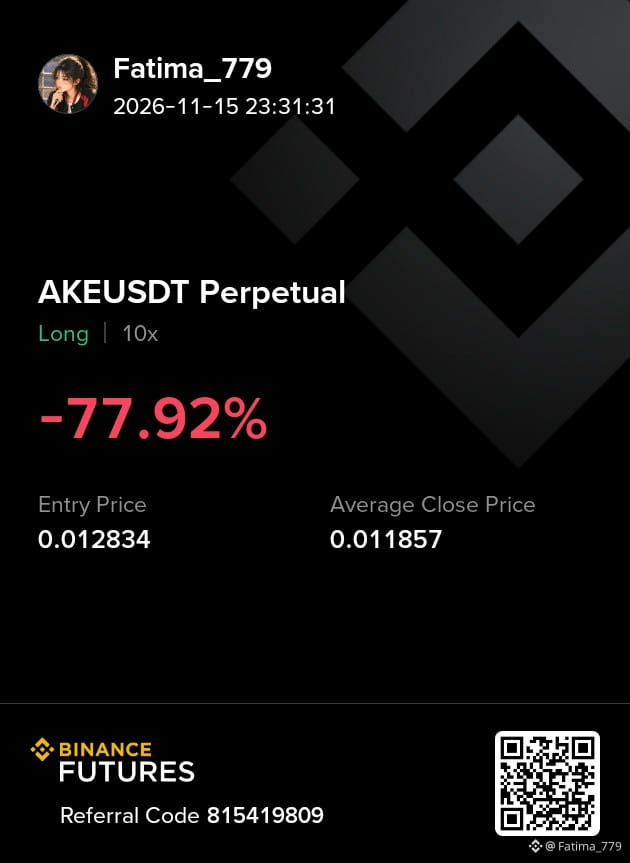
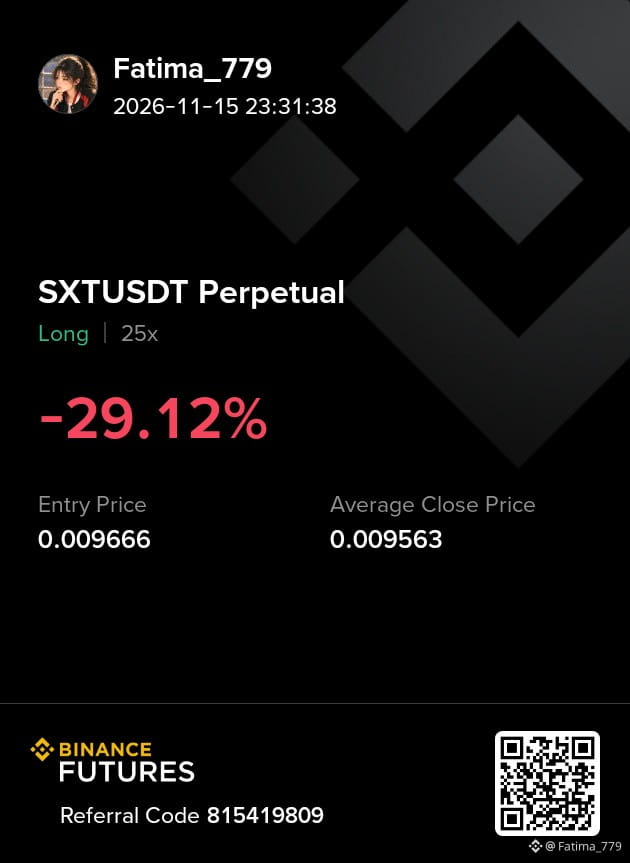
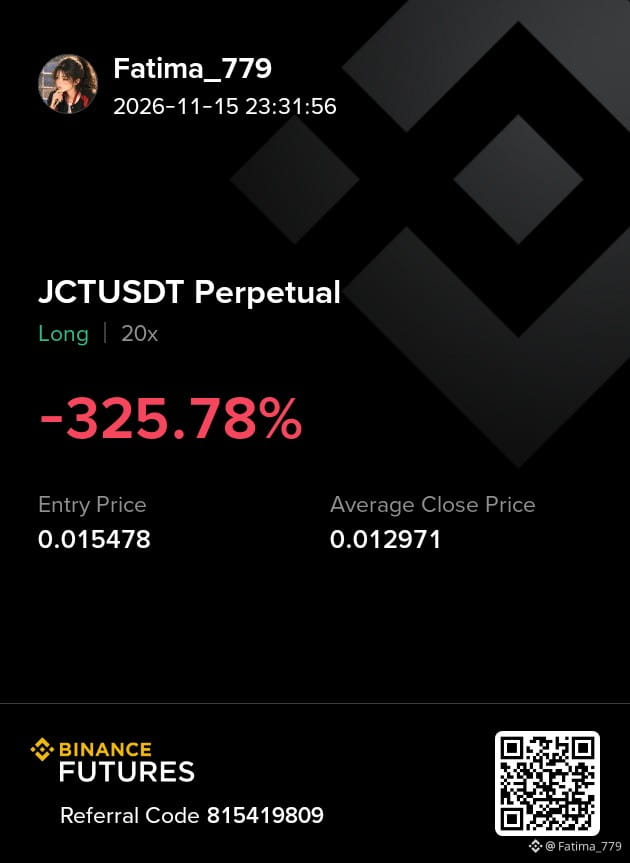
😭😭 Mamãe, o que aconteceu comigo? Perda, perda, o que eu faço, hein? 🥲🥲 te odeio $AKE $SXT $JCT te odeio muito hehe 😂🤣
2
84
·
--
😭😭 Mamãe, o que aconteceu comigo? Perda, perda, o que eu faço, hein? 🥲🥲 te odeio $AKE $SXT $JCT te odeio muito hehe 😂🤣
😭😭 Mamãe, o que aconteceu comigo? Perda, perda, o que eu faço, hein? 🥲🥲 te odeio $AKE $SXT $JCT te odeio muito hehe 😂🤣
1
1
267
·
--
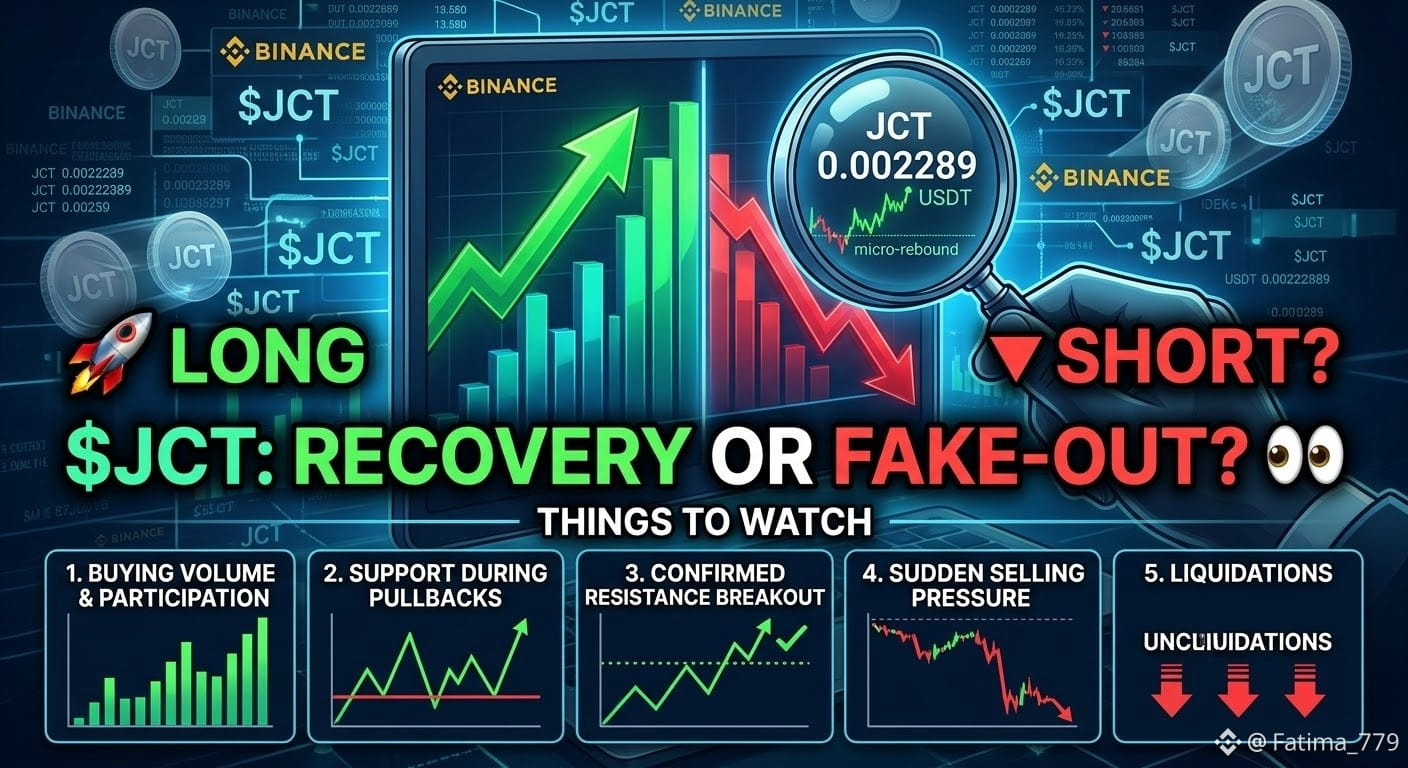
$JCT Está Mostrando Sinais de uma Possível Recuperação 👀
Janction (JCT) está voltando a chamar atenção após uma semana de alta volatilidade. Os compradores estão tentando recuperar o impulso, mas a queda brusca recente mostra que a pressão vendedora ainda é uma preocupação séria.
Uma coisa que estou acompanhando de perto é se a JCT consegue formar uma base estável, em vez de apresentar outra recuperação de curta duração.
Alguns pontos para observar:
- Volume de compras e participação no mercado
- Se o suporte se mantém durante as correções
- Um rompimento confirmado acima da resistência
- Pressão vendedora repentina e liquidações
Não vou abrir uma posição LONG às pressas só porque o preço está se recuperando. A confirmação importa mais do que a empolgação.
O que você acha da JCT daqui para frente?
🚀 LONG ou 🔻 SHORT?
#JCT #Janction #CryptoMarket #Altcoins #Binance
{future}(JCTUSDT)
$JCT Está Mostrando Sinais de uma Possível Recuperação 👀
Janction (JCT) está voltando a chamar atenção após uma semana de alta volatilidade. Os compradores estão tentando recuperar o impulso, mas a queda brusca recente mostra que a pressão vendedora ainda é uma preocupação séria.
Uma coisa que estou acompanhando de perto é se a JCT consegue formar uma base estável, em vez de apresentar outra recuperação de curta duração.
Alguns pontos para observar:
- Volume de compras e participação no mercado
- Se o suporte se mantém durante as correções
- Um rompimento confirmado acima da resistência
- Pressão vendedora repentina e liquidações
Não vou abrir uma posição LONG às pressas só porque o preço está se recuperando. A confirmação importa mais do que a empolgação.
O que você acha da JCT daqui para frente?
🚀 LONG ou 🔻 SHORT?
#JCT #Janction #CryptoMarket #Altcoins #Binance
Janction (JCT) está voltando a chamar atenção após uma semana de alta volatilidade. Os compradores estão tentando recuperar o impulso, mas a queda brusca recente mostra que a pressão vendedora ainda é uma preocupação séria.
Uma coisa que estou acompanhando de perto é se a JCT consegue formar uma base estável, em vez de apresentar outra recuperação de curta duração.
Alguns pontos para observar:
- Volume de compras e participação no mercado
- Se o suporte se mantém durante as correções
- Um rompimento confirmado acima da resistência
- Pressão vendedora repentina e liquidações
Não vou abrir uma posição LONG às pressas só porque o preço está se recuperando. A confirmação importa mais do que a empolgação.
O que você acha da JCT daqui para frente?
🚀 LONG ou 🔻 SHORT?
#JCT #Janction #CryptoMarket #Altcoins #Binance
1
50
·
--
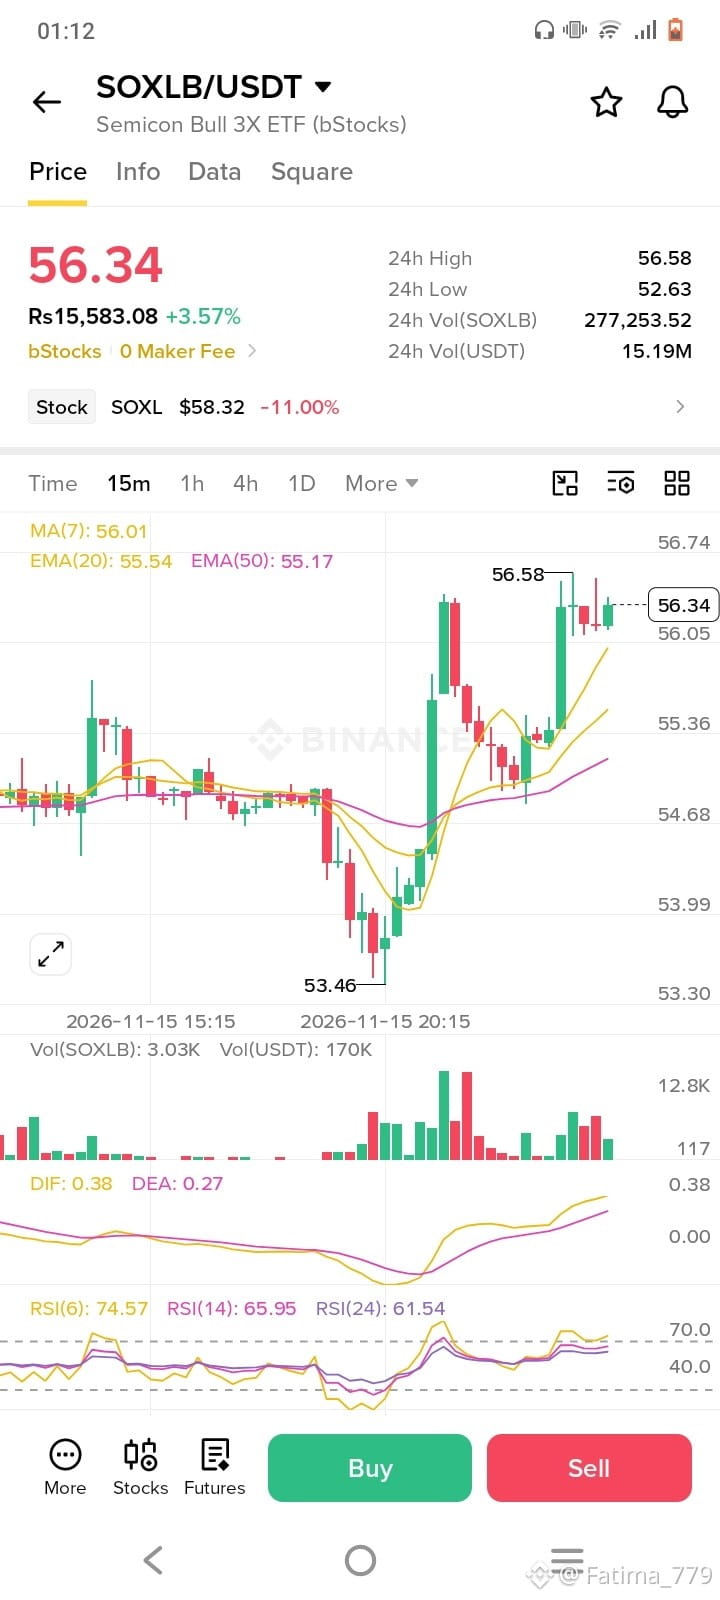
$SOXL : Touros dos semicondutores precisam ficar atentos 📊
SOXL é um ticker interessante para acompanhar, já que as ações de semicondutores continuam sendo uma parte importante da história da IA e da tecnologia.
O que diferencia o SOXL é sua exposição alavancada diária de 3x ao índice de semicondutores. Isso significa que ele pode amplificar os ganhos quando o setor sobe, mas as perdas também podem se tornar significativas quando o momentum se torna negativo.
Para mim, os principais pontos a observar são:
- Momentum do setor de semicondutores
- Movimentação dos preços da NVIDIA e da AMD
- Sentimento geral do mercado
- Volume e confirmação de rompimento
Eu não compraria por impulso após uma vela verde repentina. Um movimento confirmado com volume forte é mais importante do que a empolgação.
O SOXL pode oferecer oportunidades, mas sua alavancagem torna essencial o gerenciamento de risco.
Qual é sua visão atual sobre o SOXL?
Você está otimista 📈 ou pessimista 📉?
#SOXL #Semiconductors #StockMarket #AIStocks #Trading
$SOXL : Touros dos semicondutores precisam ficar atentos 📊
SOXL é um ticker interessante para acompanhar, já que as ações de semicondutores continuam sendo uma parte importante da história da IA e da tecnologia.
O que diferencia o SOXL é sua exposição alavancada diária de 3x ao índice de semicondutores. Isso significa que ele pode amplificar os ganhos quando o setor sobe, mas as perdas também podem se tornar significativas quando o momentum se torna negativo.
Para mim, os principais pontos a observar são:
- Momentum do setor de semicondutores
- Movimentação dos preços da NVIDIA e da AMD
- Sentimento geral do mercado
- Volume e confirmação de rompimento
Eu não compraria por impulso após uma vela verde repentina. Um movimento confirmado com volume forte é mais importante do que a empolgação.
O SOXL pode oferecer oportunidades, mas sua alavancagem torna essencial o gerenciamento de risco.
Qual é sua visão atual sobre o SOXL?
Você está otimista 📈 ou pessimista 📉?
#SOXL #Semiconductors #StockMarket #AIStocks #Trading
SOXL é um ticker interessante para acompanhar, já que as ações de semicondutores continuam sendo uma parte importante da história da IA e da tecnologia.
O que diferencia o SOXL é sua exposição alavancada diária de 3x ao índice de semicondutores. Isso significa que ele pode amplificar os ganhos quando o setor sobe, mas as perdas também podem se tornar significativas quando o momentum se torna negativo.
Para mim, os principais pontos a observar são:
- Momentum do setor de semicondutores
- Movimentação dos preços da NVIDIA e da AMD
- Sentimento geral do mercado
- Volume e confirmação de rompimento
Eu não compraria por impulso após uma vela verde repentina. Um movimento confirmado com volume forte é mais importante do que a empolgação.
O SOXL pode oferecer oportunidades, mas sua alavancagem torna essencial o gerenciamento de risco.
Qual é sua visão atual sobre o SOXL?
Você está otimista 📈 ou pessimista 📉?
#SOXL #Semiconductors #StockMarket #AIStocks #Trading
2
219
·
--
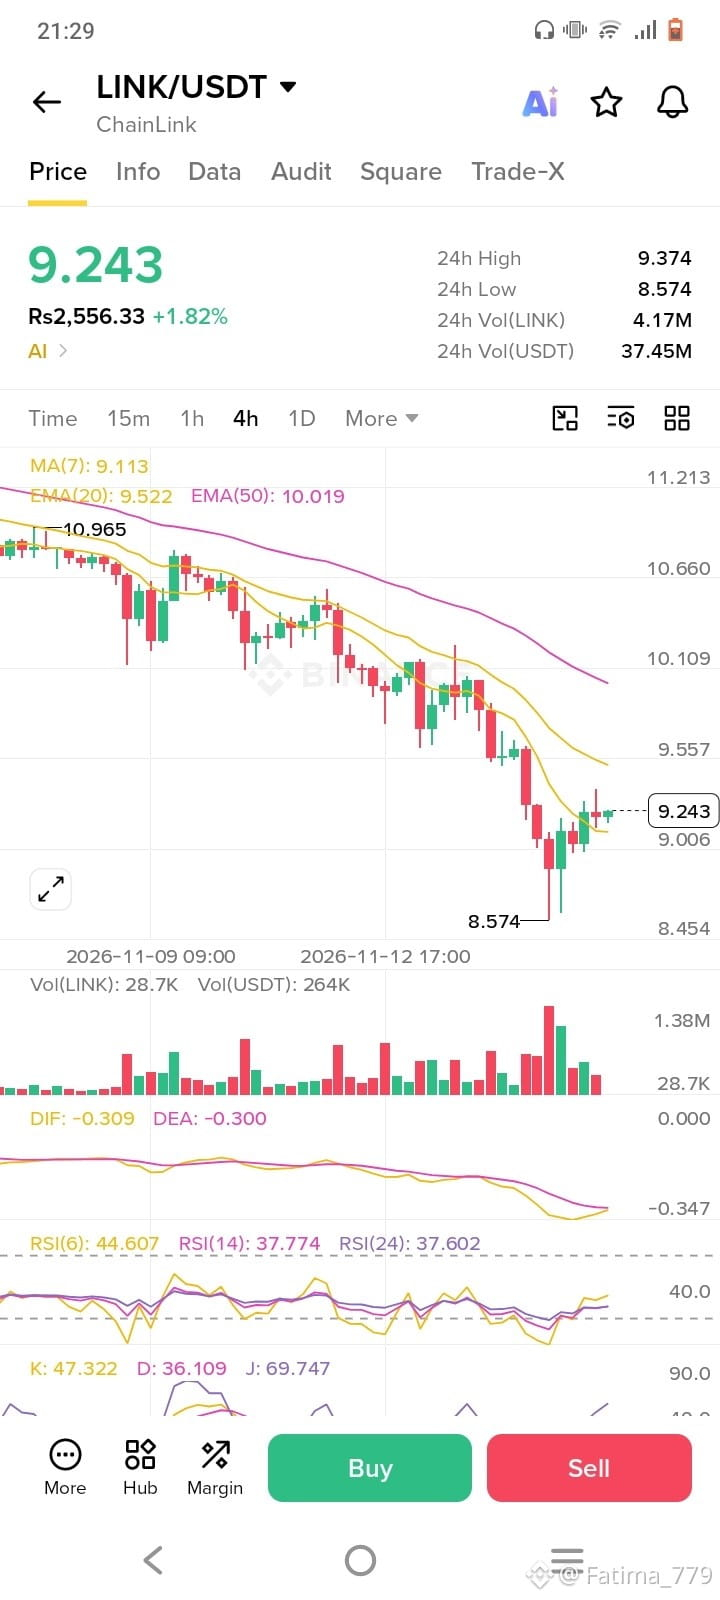
Ei, traders, feliz domingo 😁 deem uma olhada em $LINK coin hoje hehe 😂
Ei, traders, feliz domingo 😁 deem uma olhada em $LINK coin hoje hehe 😂

1
5
259
·
--
Ver tradução
$EVAA is going absolutely parabolic right now.
It's up 46% in 24H, trading around $2.60 after tapping $2.66, with $662M+ in 24H futures volume.
Now look at what just happened on the liquidation map.
That $2.47 - $2.55 short wall we talked about? It just got blown through. That's the squeeze playing out live.
But don't get comfortable. There's now a massive pool of long liquidations building below, especially around $2.40 - $2.20.
Break and hold above $2.66 and we could see another violent leg up toward $2.80+.
Lose $2.50 though, and this turns into a brutal long squeeze fast.
Both sides are still exposed. This is not a smooth trend, this is pure volatility.
Who gets wiped out next?
$EVAA is going absolutely parabolic right now.
It's up 46% in 24H, trading around $2.60 after tapping $2.66, with $662M+ in 24H futures volume.
Now look at what just happened on the liquidation map.
That $2.47 - $2.55 short wall we talked about? It just got blown through. That's the squeeze playing out live.
But don't get comfortable. There's now a massive pool of long liquidations building below, especially around $2.40 - $2.20.
Break and hold above $2.66 and we could see another violent leg up toward $2.80+.
Lose $2.50 though, and this turns into a brutal long squeeze fast.
Both sides are still exposed. This is not a smooth trend, this is pure volatility.
Who gets wiped out next?
It's up 46% in 24H, trading around $2.60 after tapping $2.66, with $662M+ in 24H futures volume.
Now look at what just happened on the liquidation map.
That $2.47 - $2.55 short wall we talked about? It just got blown through. That's the squeeze playing out live.
But don't get comfortable. There's now a massive pool of long liquidations building below, especially around $2.40 - $2.20.
Break and hold above $2.66 and we could see another violent leg up toward $2.80+.
Lose $2.50 though, and this turns into a brutal long squeeze fast.
Both sides are still exposed. This is not a smooth trend, this is pure volatility.
Who gets wiped out next?
2
161
·
--
Ver tradução
#CryptoSelloffTriggersMultipleWhaleLiquidations
#CryptoSelloffTriggersMultipleWhaleLiquidations
The crypto market is facing heavy selling pressure, and leveraged traders are paying the price.
Bitcoin dropped toward $63K, while Ethereum also suffered a sharp decline. Around $1.9 billion in crypto positions were liquidated within 24 hours, with long positions taking most of the damage.
Large liquidations show how quickly market sentiment can change when leverage becomes excessive. Even experienced traders and whales are not protected from sudden volatility.
But one thing is important: liquidations don't automatically mean the market has reached its bottom.
I think this is a time to focus on capital protection rather than chasing every price movement. Watch BTC support levels, market volume and buying pressure before making a decision.
What do you think?
Is this a deeper correction ahead, or could the market be preparing for a recovery?
#BTC #CryptoMarket #Whales #Liquidations
#CryptoSelloffTriggersMultipleWhaleLiquidations
#CryptoSelloffTriggersMultipleWhaleLiquidations
The crypto market is facing heavy selling pressure, and leveraged traders are paying the price.
Bitcoin dropped toward $63K, while Ethereum also suffered a sharp decline. Around $1.9 billion in crypto positions were liquidated within 24 hours, with long positions taking most of the damage.
Large liquidations show how quickly market sentiment can change when leverage becomes excessive. Even experienced traders and whales are not protected from sudden volatility.
But one thing is important: liquidations don't automatically mean the market has reached its bottom.
I think this is a time to focus on capital protection rather than chasing every price movement. Watch BTC support levels, market volume and buying pressure before making a decision.
What do you think?
Is this a deeper correction ahead, or could the market be preparing for a recovery?
#BTC #CryptoMarket #Whales #Liquidations
#CryptoSelloffTriggersMultipleWhaleLiquidations
The crypto market is facing heavy selling pressure, and leveraged traders are paying the price.
Bitcoin dropped toward $63K, while Ethereum also suffered a sharp decline. Around $1.9 billion in crypto positions were liquidated within 24 hours, with long positions taking most of the damage.
Large liquidations show how quickly market sentiment can change when leverage becomes excessive. Even experienced traders and whales are not protected from sudden volatility.
But one thing is important: liquidations don't automatically mean the market has reached its bottom.
I think this is a time to focus on capital protection rather than chasing every price movement. Watch BTC support levels, market volume and buying pressure before making a decision.
What do you think?
Is this a deeper correction ahead, or could the market be preparing for a recovery?
#BTC #CryptoMarket #Whales #Liquidations

1
98
·
--
Ver tradução
Bitcoin Is Facing a Critical Test ⚠️
$BTC is under serious selling pressure, and the market is watching closely.
Bitcoin has dropped below the $65,000 level, raising concerns about whether buyers can defend the current support zone. ETF outflows, macroeconomic uncertainty, and heavy liquidations are adding pressure to the market.
But one thing is important: a sharp decline doesn't automatically mean an immediate recovery or further crash.
What I'm watching now:
- $62,000 — important support zone.
- $65,000 — level bulls need to reclaim.
- $66,200–$68,800 — potential recovery resistance.
If buyers regain control and volume supports the move, BTC could attempt a relief bounce. However, losing support could create more downside pressure.
No FOMO, no blind entries. Confirmation matters more than predictions.
What's your expectation for Bitcoin next?
🟢 Recovery
🔴 More downside
#Bitcoin #BTC #CryptoMarket
{future}(BTCUSDT)
Bitcoin Is Facing a Critical Test ⚠️
$BTC is under serious selling pressure, and the market is watching closely.
Bitcoin has dropped below the $65,000 level, raising concerns about whether buyers can defend the current support zone. ETF outflows, macroeconomic uncertainty, and heavy liquidations are adding pressure to the market.
But one thing is important: a sharp decline doesn't automatically mean an immediate recovery or further crash.
What I'm watching now:
- $62,000 — important support zone.
- $65,000 — level bulls need to reclaim.
- $66,200–$68,800 — potential recovery resistance.
If buyers regain control and volume supports the move, BTC could attempt a relief bounce. However, losing support could create more downside pressure.
No FOMO, no blind entries. Confirmation matters more than predictions.
What's your expectation for Bitcoin next?
🟢 Recovery
🔴 More downside
#Bitcoin #BTC #CryptoMarket
$BTC is under serious selling pressure, and the market is watching closely.
Bitcoin has dropped below the $65,000 level, raising concerns about whether buyers can defend the current support zone. ETF outflows, macroeconomic uncertainty, and heavy liquidations are adding pressure to the market.
But one thing is important: a sharp decline doesn't automatically mean an immediate recovery or further crash.
What I'm watching now:
- $62,000 — important support zone.
- $65,000 — level bulls need to reclaim.
- $66,200–$68,800 — potential recovery resistance.
If buyers regain control and volume supports the move, BTC could attempt a relief bounce. However, losing support could create more downside pressure.
No FOMO, no blind entries. Confirmation matters more than predictions.
What's your expectation for Bitcoin next?
🟢 Recovery
🔴 More downside
#Bitcoin #BTC #CryptoMarket

1
42
·
--
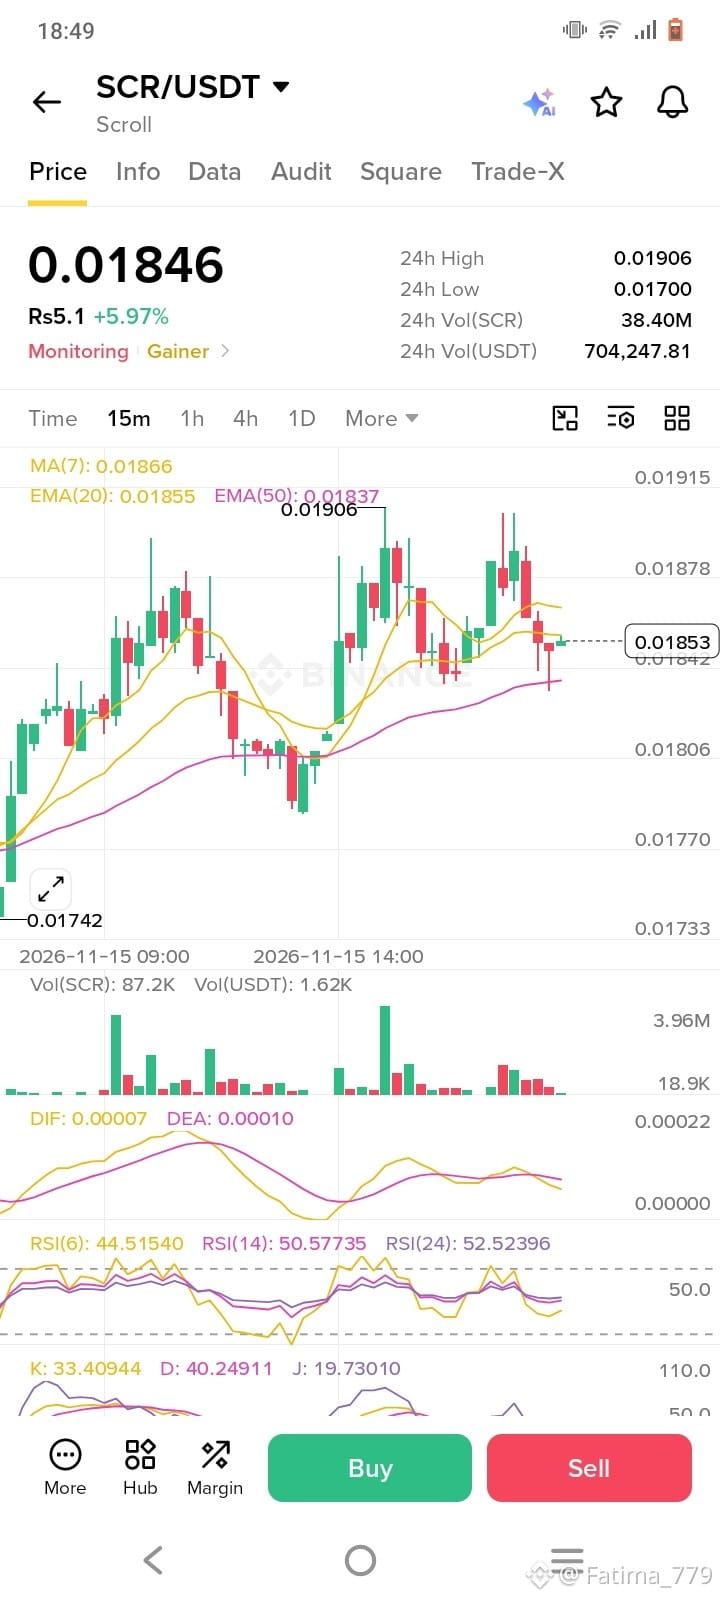
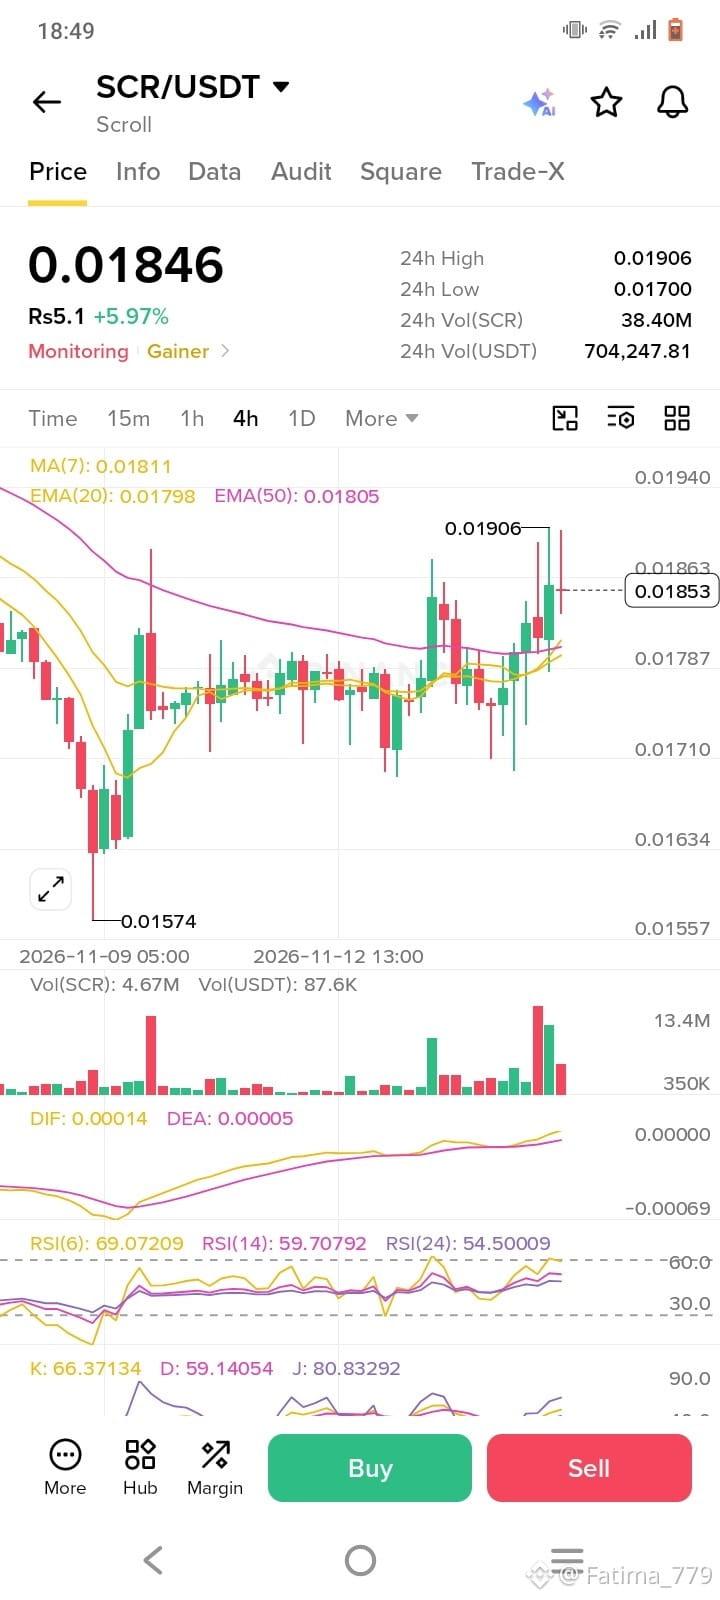
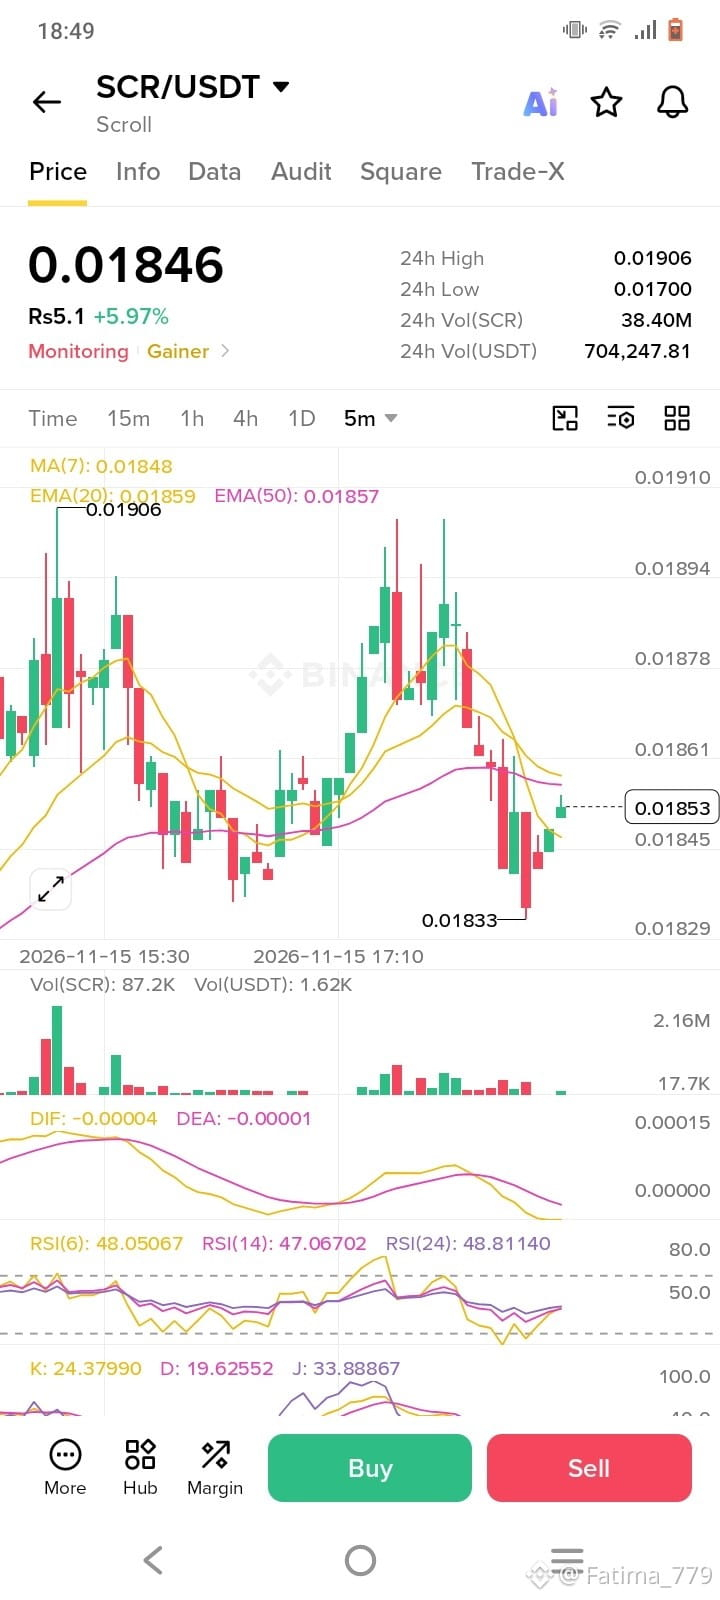
O preço reagiu a partir da zona local de demanda (0.01833), formando uma mudança de caráter altista (CHoCH) em timeframes menores, com forte suporte de bloco de ordens. O RSI está se recuperando de níveis neutros e o momentum do MACD está se tornando positivo, sinalizando uma continuação da alta em direção às máximas locais de liquidez.
$SCR /USDT
Long / Compra
Entrada: 0.01830 - 0.01845
SL: 0.01780
TP: 0.01875 / 0.01900
{future}(SCRUSDT)
O preço reagiu a partir da zona local de demanda (0.01833), formando uma mudança de caráter altista (CHoCH) em timeframes menores, com forte suporte de bloco de ordens. O RSI está se recuperando de níveis neutros e o momentum do MACD está se tornando positivo, sinalizando uma continuação da alta em direção às máximas locais de liquidez.
$SCR /USDT
Long / Compra
Entrada: 0.01830 - 0.01845
SL: 0.01780
TP: 0.01875 / 0.01900
$SCR /USDT
Long / Compra
Entrada: 0.01830 - 0.01845
SL: 0.01780
TP: 0.01875 / 0.01900
1
87
·
--
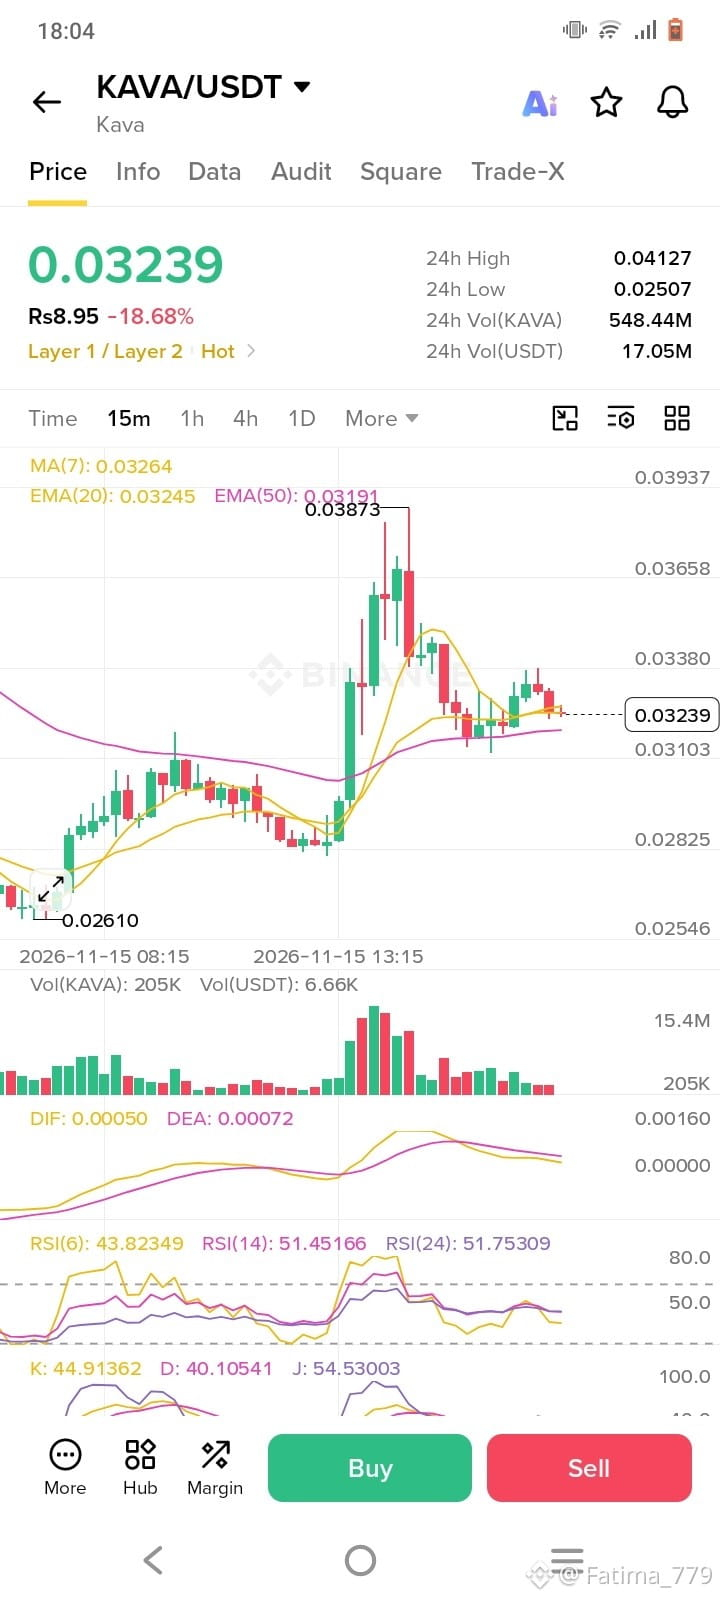
$KAVA O preço está sendo negociado em torno de $0.03239, refletindo uma queda de -18.68% no período de 24 horas (com máxima de $0.04127 e mínima de $0.02507). Após uma forte alta impulsiva que atingiu uma máxima local próxima de $0.03873, o preço recuou e atualmente está em consolidação.
{future}(KAVAUSDT)
$KAVA O preço está sendo negociado em torno de $0.03239, refletindo uma queda de -18.68% no período de 24 horas (com máxima de $0.04127 e mínima de $0.02507). Após uma forte alta impulsiva que atingiu uma máxima local próxima de $0.03873, o preço recuou e atualmente está em consolidação.
1
82
Inicia sessão para explorar mais conteúdos
Junta-te a utilizadores de criptomoedas de todo o mundo na Binance Square
⚡️ Obtém informações úteis e recentes sobre criptomoedas.
💬 Com a confiança da maior exchange de criptomoedas do mundo.
👍 Descobre perspetivas reais de criadores verificados.
E-mail/Número de telefone
Tópicos em Tendência
CryptoSelloffTriggersMultipleWhaleLiquidations
178,434 visualizações
1,776 a discutir
Liquidações de criptomoedas superam US$ 2 bilhões em 24 horas, com 329 mil traders eliminados
Binance News
·40 gostos
·54.7k visualizações
USSpotXRPETFsSeeLargestWeeklyOutflowIn8Months
158,536 visualizações
1,550 a discutir
WillFOMCMinutesReinforceRateHikeExpectations?
46,504 visualizações
738 a discutir