Binance Square
Jazaab Crypto Analysit
28 Publicações

Jazaab Crypto Analysit

Follow me, you will be pro trader
Aberto ao trading
Trader Ocasional
3.9 ano(s)
18 A seguir
15 Seguidores
1 Gostaram
Publicações
Portfólio
·
--
Em Baixa
Ver tradução
#ETH Overall trend: Short-term bearish, medium-term still neutral to slightly bullish The recent rally from around $1,512 to $1,830 has lost momentum. ETH is now pulling back. What the indicators show 1. EMA structure Current price: $1,751.54 EMA(7): 1,768.73 EMA(25): 1,761.28 EMA(99): 1,706.68 Price is below both the 7 EMA and 25 EMA, which is bearish in the short term. However, price is still above the 99 EMA, so the medium-term trend has not completely broken. 2. RSI RSI(6): 32.31 This is close to the oversold zone (30), meaning: Selling pressure is strong. A short bounce is possible. It is not yet a confirmation to buy. RSI can stay oversold during strong downtrends. 3. Volume Selling volume is not extremely high. That suggests this is currently more of a pullback than a panic sell. Important support levels $1,740 (current support) $1,706 (EMA99 and strongest nearby support) $1,664 $1,580 $1,512 (major support) If $1,706 breaks with strong volume, ETH could fall toward $1,660–1,620. Resistance levels $1,760 $1,780 $1,810 $1,830 (major resistance) ETH must reclaim $1,780–1,800 for bulls to regain control. Trading scenarios Bullish scenario (40%) If ETH holds above $1,740–1,706 and buyers step in: First target: $1,780 Second target: $1,810 Third target: $1,830 Bearish scenario (60%) If the current candle closes below $1,740 and especially below $1,706: Target 1: $1,660 Target 2: $1,620 Target 3: $1,580 Trading plan For long positions: Wait for confirmation above $1,780, or Buy near $1,710 only if there is a clear bullish reversal candle. For short positions: A close below $1,740 increases the probability of further downside. Stop-loss should be above the recent swing high. My conclusion At this moment, I would not enter a new long trade. The chart shows weakening momentum: Price is below the short-term EMAs. RSI is weak. The market is correcting after a strong rally. The $1,706 area is the key level. If it holds, ETH can recover. If it breaks, sellers are likely to remain in control. $ETH {future}(ETHUSDT)
#ETH

Overall trend: Short-term bearish, medium-term still neutral to slightly bullish
The recent rally from around $1,512 to $1,830 has lost momentum. ETH is now pulling back.
What the indicators show
1. EMA structure
Current price: $1,751.54
EMA(7): 1,768.73
EMA(25): 1,761.28
EMA(99): 1,706.68
Price is below both the 7 EMA and 25 EMA, which is bearish in the short term.
However, price is still above the 99 EMA, so the medium-term trend has not completely broken.
2. RSI
RSI(6): 32.31
This is close to the oversold zone (30), meaning:
Selling pressure is strong.
A short bounce is possible.
It is not yet a confirmation to buy. RSI can stay oversold during strong downtrends.
3. Volume
Selling volume is not extremely high.
That suggests this is currently more of a pullback than a panic sell.
Important support levels
$1,740 (current support)
$1,706 (EMA99 and strongest nearby support)
$1,664
$1,580
$1,512 (major support)
If $1,706 breaks with strong volume, ETH could fall toward $1,660–1,620.
Resistance levels
$1,760
$1,780
$1,810
$1,830 (major resistance)
ETH must reclaim $1,780–1,800 for bulls to regain control.
Trading scenarios
Bullish scenario (40%)
If ETH holds above $1,740–1,706 and buyers step in:
First target: $1,780
Second target: $1,810
Third target: $1,830
Bearish scenario (60%)
If the current candle closes below $1,740 and especially below $1,706:
Target 1: $1,660
Target 2: $1,620
Target 3: $1,580
Trading plan
For long positions:
Wait for confirmation above $1,780, or
Buy near $1,710 only if there is a clear bullish reversal candle.
For short positions:
A close below $1,740 increases the probability of further downside.
Stop-loss should be above the recent swing high.
My conclusion
At this moment, I would not enter a new long trade. The chart shows weakening momentum:
Price is below the short-term EMAs.
RSI is weak.
The market is correcting after a strong rally.
The $1,706 area is the key level. If it holds, ETH can recover. If it breaks, sellers are likely to remain in control.
$ETH
Ver tradução
Overall trend: Short-term bearish, medium-term still neutral to slightly bullish The recent rally from around $1,512 to $1,830 has lost momentum. ETH is now pulling back. What the indicators show 1. EMA structure Current price: $1,751.54 EMA(7): 1,768.73 EMA(25): 1,761.28 EMA(99): 1,706.68 Price is below both the 7 EMA and 25 EMA, which is bearish in the short term. However, price is still above the 99 EMA, so the medium-term trend has not completely broken. 2. RSI RSI(6): 32.31 This is close to the oversold zone (30), meaning: Selling pressure is strong. A short bounce is possible. It is not yet a confirmation to buy. RSI can stay oversold during strong downtrends. 3. Volume Selling volume is not extremely high. That suggests this is currently more of a pullback than a panic sell. Important support levels $1,740 (current support) $1,706 (EMA99 and strongest nearby support) $1,664 $1,580 $1,512 (major support) If $1,706 breaks with strong volume, ETH could fall toward $1,660–1,620. Resistance levels $1,760 $1,780 $1,810 $1,830 (major resistance) ETH must reclaim $1,780–1,800 for bulls to regain control. Trading scenarios Bullish scenario (40%) If ETH holds above $1,740–1,706 and buyers step in: First target: $1,780 Second target: $1,810 Third target: $1,830 Bearish scenario (60%) If the current candle closes below $1,740 and especially below $1,706: Target 1: $1,660 Target 2: $1,620 Target 3: $1,580 Trading plan For long positions: Wait for confirmation above $1,780, or Buy near $1,710 only if there is a clear bullish reversal candle. For short positions: A close below $1,740 increases the probability of further downside. Stop-loss should be above the recent swing high. My conclusion At this moment, I would not enter a new long trade. The chart shows weakening momentum: Price is below the short-term EMAs. RSI is weak. The market is correcting after a strong rally. The $1,706 area is the key level. If it holds, ETH can recover. If it breaks, sellers are likely to remain in control. #ETH #BTC $BTC $ETH #analysis
Overall trend: Short-term bearish, medium-term still neutral to slightly bullish
The recent rally from around $1,512 to $1,830 has lost momentum. ETH is now pulling back.
What the indicators show
1. EMA structure
Current price: $1,751.54
EMA(7): 1,768.73
EMA(25): 1,761.28
EMA(99): 1,706.68
Price is below both the 7 EMA and 25 EMA, which is bearish in the short term.
However, price is still above the 99 EMA, so the medium-term trend has not completely broken.
2. RSI
RSI(6): 32.31
This is close to the oversold zone (30), meaning:
Selling pressure is strong.
A short bounce is possible.
It is not yet a confirmation to buy. RSI can stay oversold during strong downtrends.
3. Volume
Selling volume is not extremely high.
That suggests this is currently more of a pullback than a panic sell.
Important support levels
$1,740 (current support)
$1,706 (EMA99 and strongest nearby support)
$1,664
$1,580
$1,512 (major support)
If $1,706 breaks with strong volume, ETH could fall toward $1,660–1,620.
Resistance levels
$1,760
$1,780
$1,810
$1,830 (major resistance)
ETH must reclaim $1,780–1,800 for bulls to regain control.
Trading scenarios
Bullish scenario (40%)
If ETH holds above $1,740–1,706 and buyers step in:
First target: $1,780
Second target: $1,810
Third target: $1,830
Bearish scenario (60%)
If the current candle closes below $1,740 and especially below $1,706:
Target 1: $1,660
Target 2: $1,620
Target 3: $1,580
Trading plan
For long positions:
Wait for confirmation above $1,780, or
Buy near $1,710 only if there is a clear bullish reversal candle.
For short positions:
A close below $1,740 increases the probability of further downside.
Stop-loss should be above the recent swing high.
My conclusion
At this moment, I would not enter a new long trade. The chart shows weakening momentum:
Price is below the short-term EMAs.
RSI is weak.
The market is correcting after a strong rally.
The $1,706 area is the key level. If it holds, ETH can recover. If it breaks, sellers are likely to remain in control.
#ETH #BTC $BTC $ETH #analysis
Está indo longe Talvez 3900+ Então curto
Está indo longe
Talvez 3900+
Então curto
Salman273
·
--
Deve ser longo ou curto?
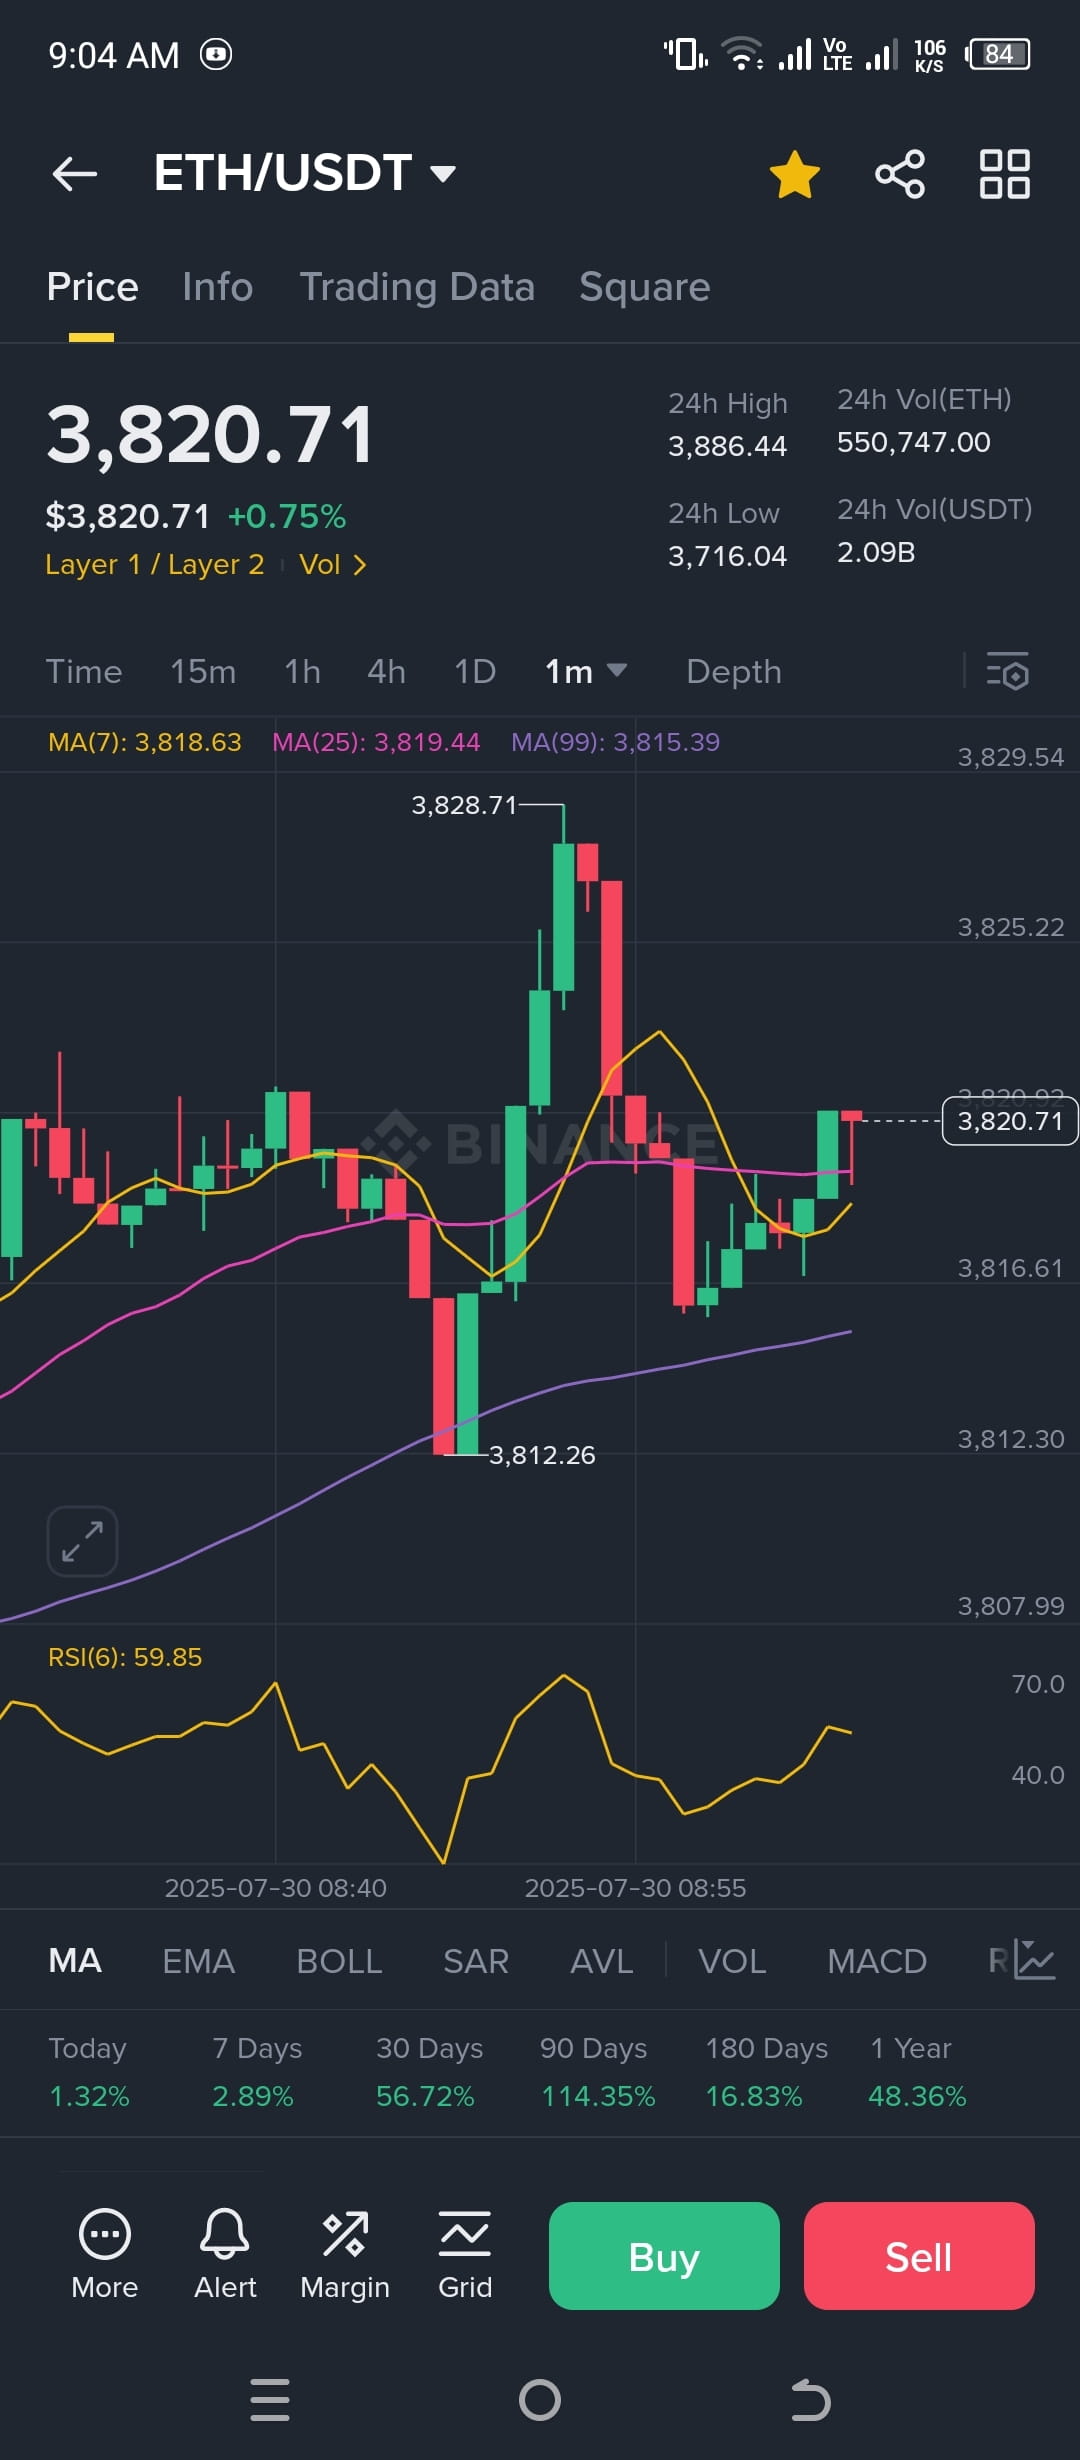
A correção ocorrerá perto de 3000
Hiba _Trader
·
--
Em Alta
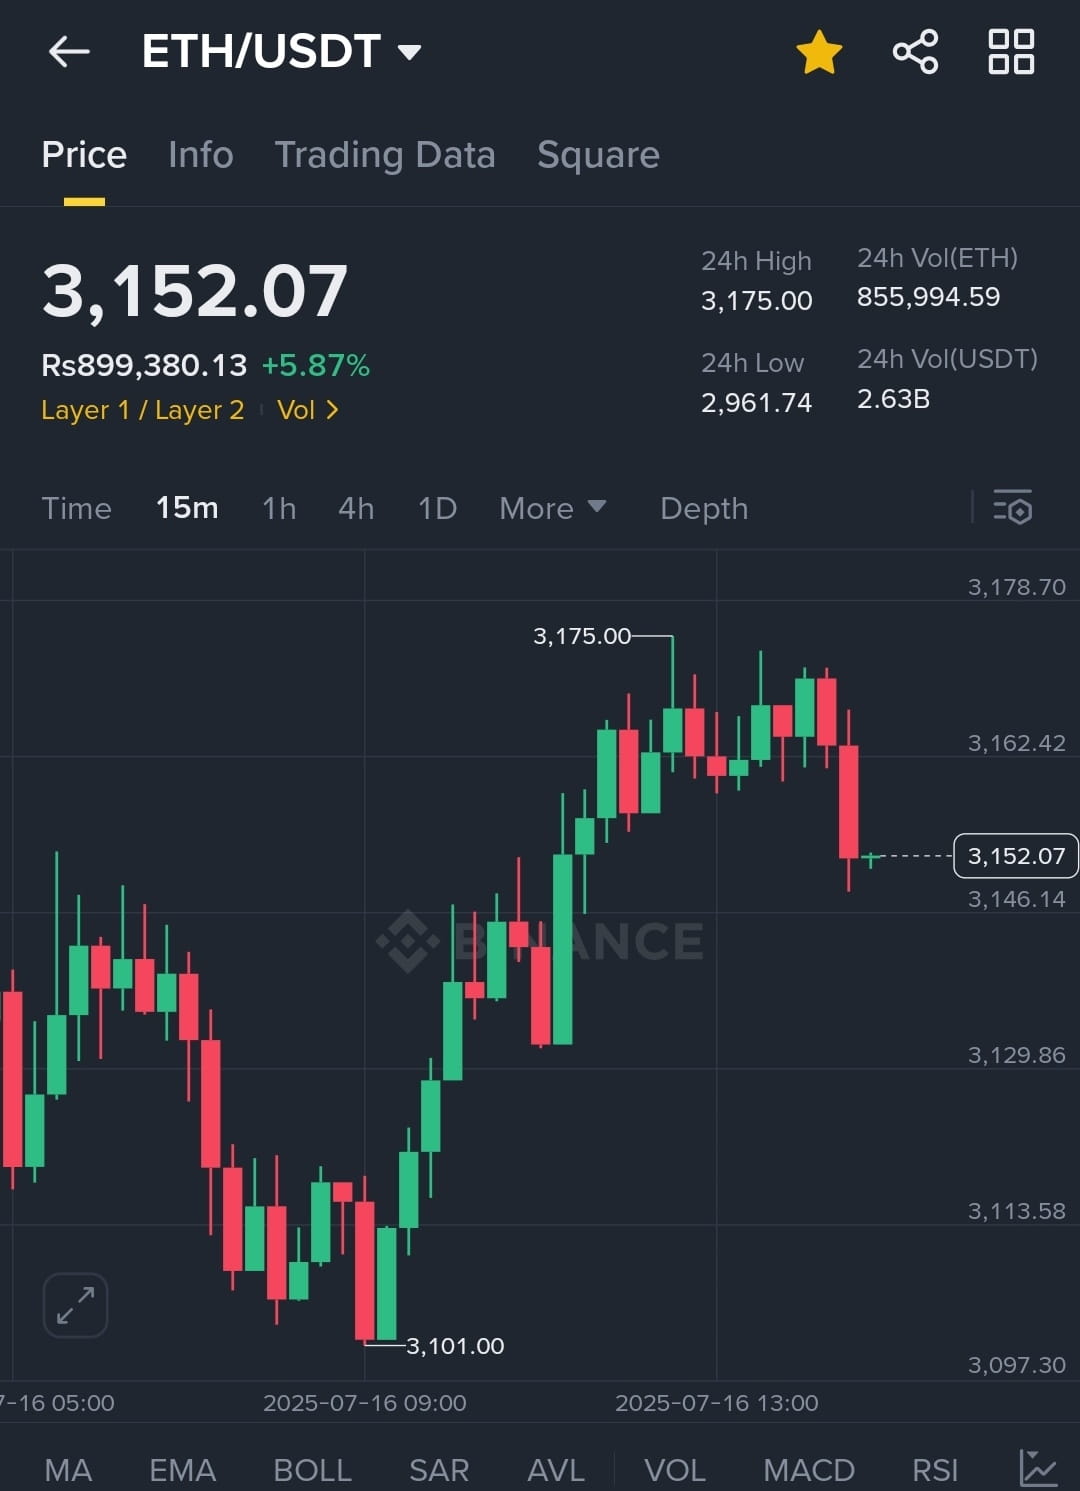
$ETH USDT LONG TRADE SIGNAL🟢

$ETHUSDT subiu do suporte de $3.101,00 e atingiu um novo pico em $3.175,00 antes de recuar ligeiramente. O gráfico de 15 minutos mostra uma forte estrutura de alta, e a ação do preço atual perto de $3.150 pode oferecer uma nova entrada na queda.

Configuração de Negócio:

Ponto de Entrada: $3.150 – $3.135

Stop Loss: $3.100

Take Profit: $3.200 / $3.240

Margem: 2–3% da carteira

Alavancagem: 10x

Perspectiva de Mercado:
ETH permanece em uma tendência de alta apesar do recuo recente. Se o preço se estabilizar acima de $3.140, pode retomar seu avanço em direção a $3.200 e além.

#BinanceHODLerERA #CPIWatch #CPIWatch #BTCWhaleTracker #BTC120kVs125kToday $ETH
Não perca $ICE em 2025
Miss Loiss
·
--
Você já perdeu o trem nesses:

💎 $BNB em 2018
💎 $LINK em 2019
💎 $DOT em 2020
💎 $SHIB em 2021

Não deixe o $DOGE escapar entre seus dedos desta vez. 🚀

Esta notícia terá um impacto positivo no mercado?
Ihtisham_Ul Haq
·
--
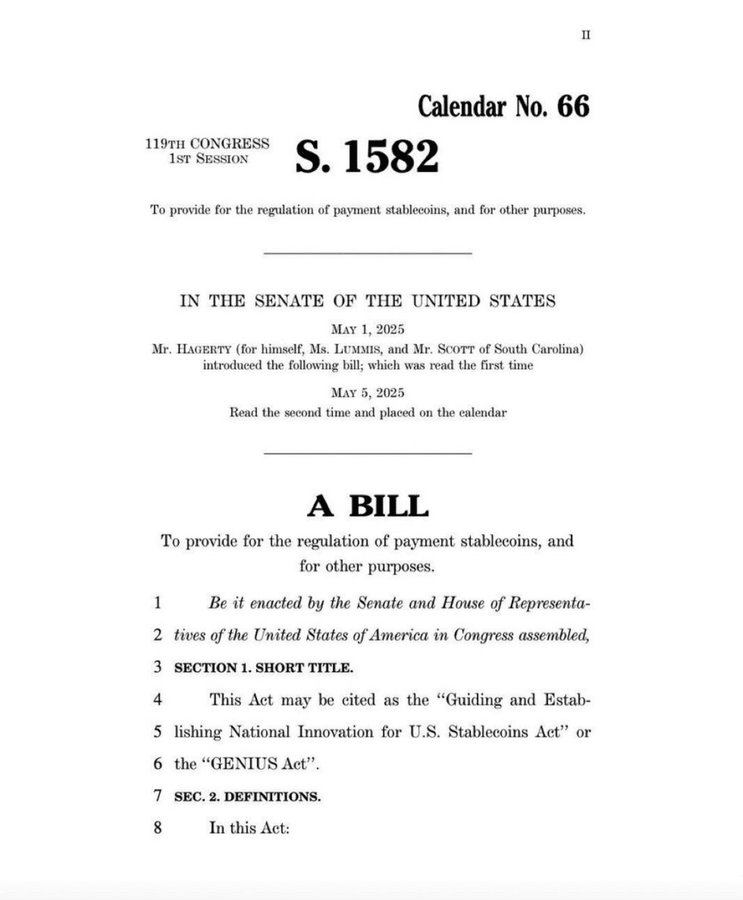
🚨GRANDE DIA PARA CRIPTO

O Senado dos EUA votará sobre a Lei GENIUS hoje às 16:30 (ET).

A regulamentação de stablecoins está chegando e é favorável ao cripto.

A aprovação é o sinal verde para bilhões em capital.

Esse movimento pode desbloquear enormes fluxos institucionais para o cripto.
A correção certamente acontecerá Depois disso, subirá
A correção certamente acontecerá
Depois disso, subirá
moonboyscrypto
·
--
Em Alta
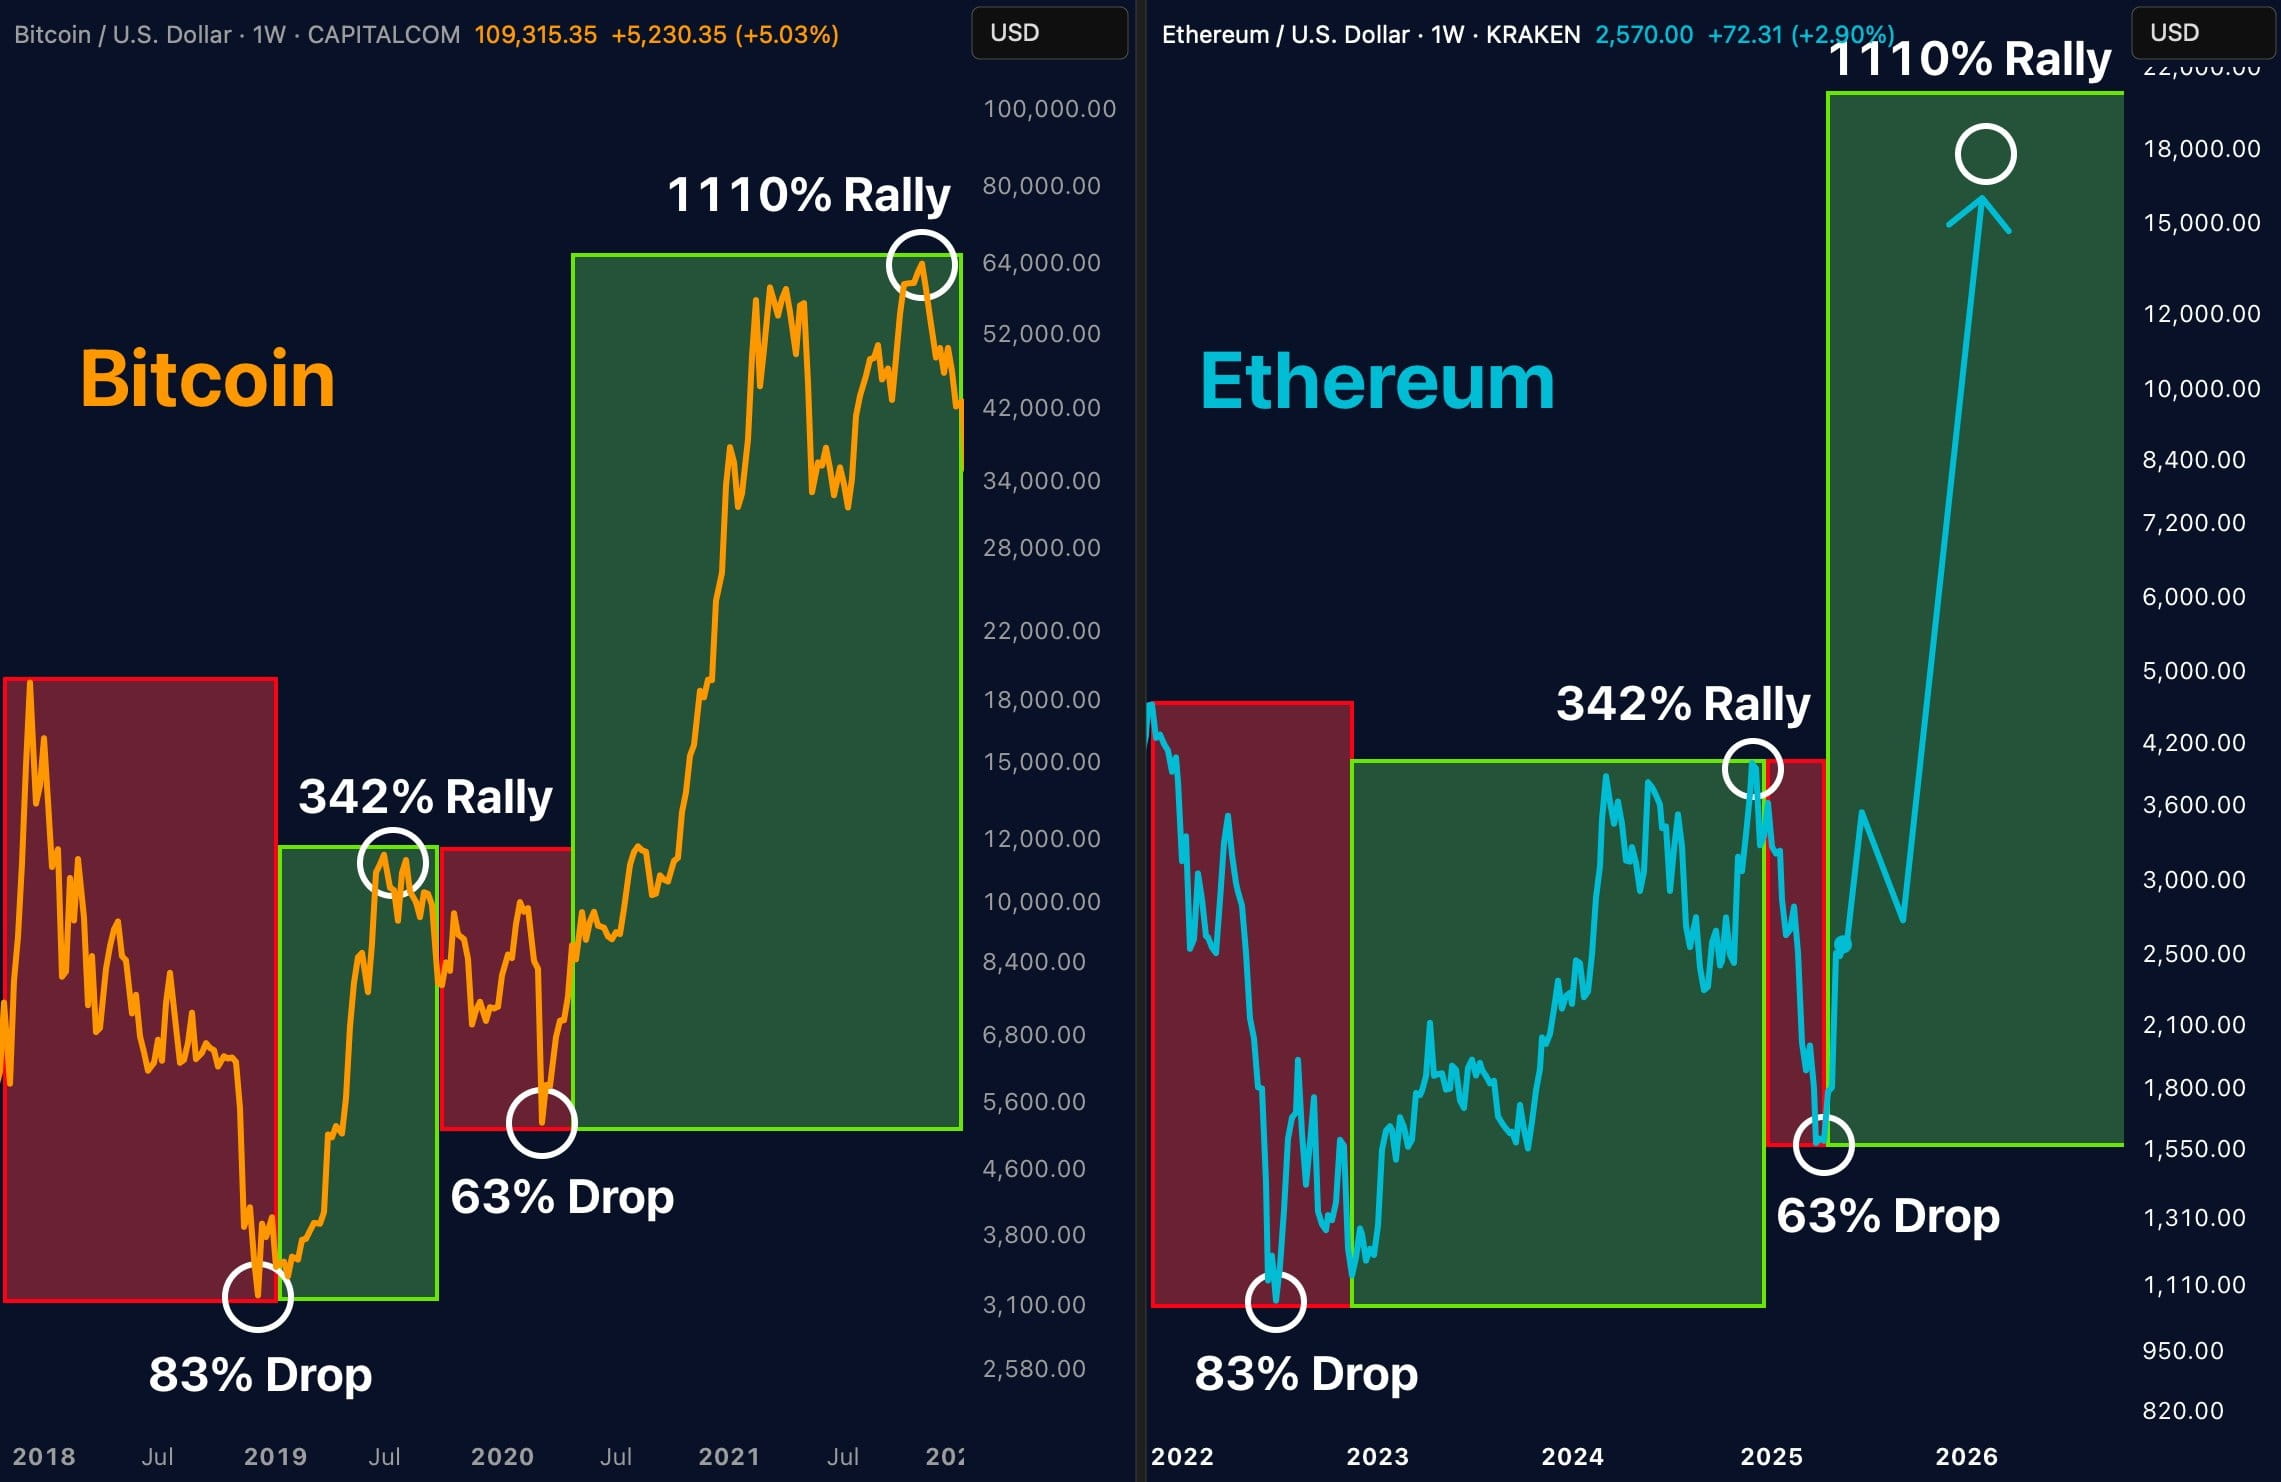
ETHEREUM 2025 É BITCOIN 2021

Mesma queda. Mesma recuperação. Mesma configuração.

Se este fractal se mantiver… $ETH vai em parábola.

+1000% está na mesa.

Você está posicionado ou de fora?

$BTC
Agora não Vai cair para 2350-2400 Depois novamente subir
Agora não
Vai cair para 2350-2400
Depois novamente subir
bikuuuuuuu
·
--
Em Alta
$ETH Vai subir ou descer o que você acha comente agora
Eu acho que vai para a lua 🤑
#ETH
Bro Você já está com um enorme lucro Mas eu acho que você está dormindo
Bro
Você já está com um enorme lucro
Mas eu acho que você está dormindo
MS TRADING QUEEN
·
--
Em Alta
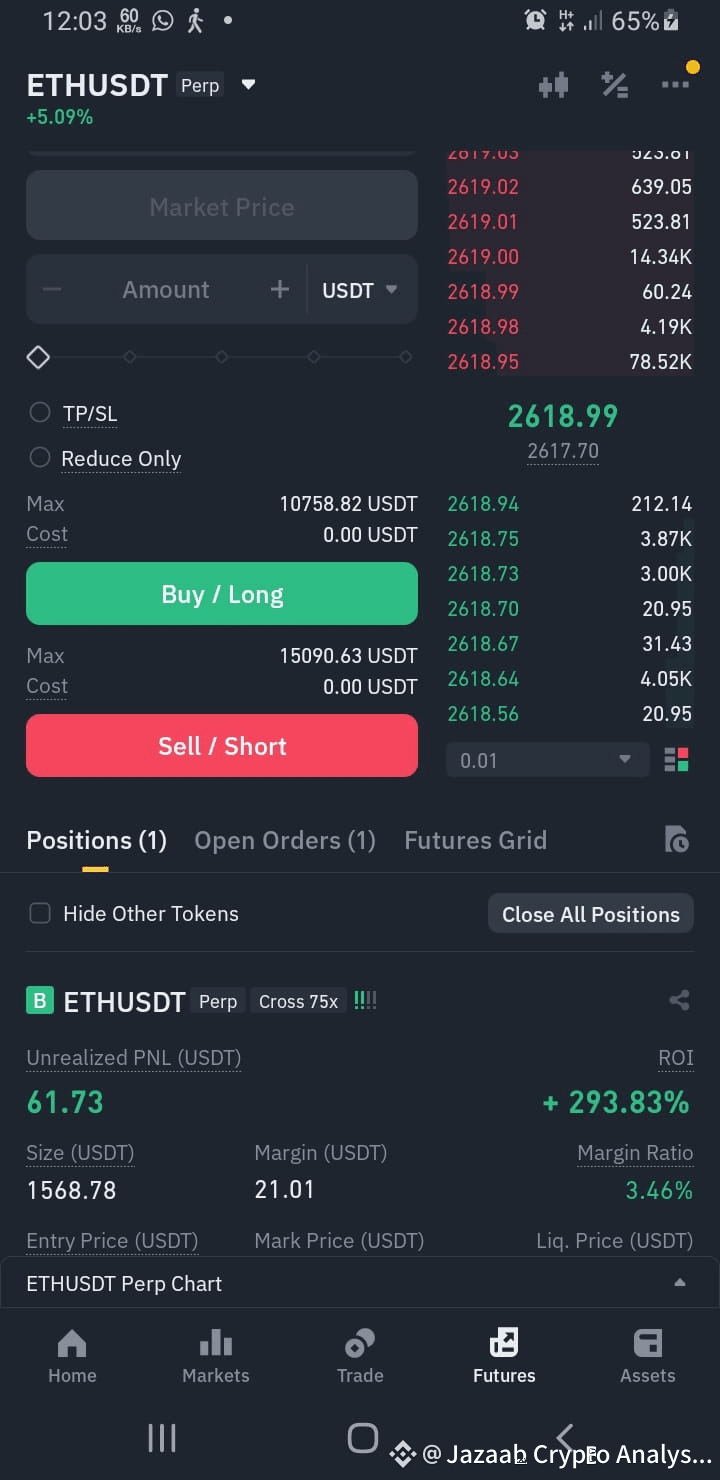
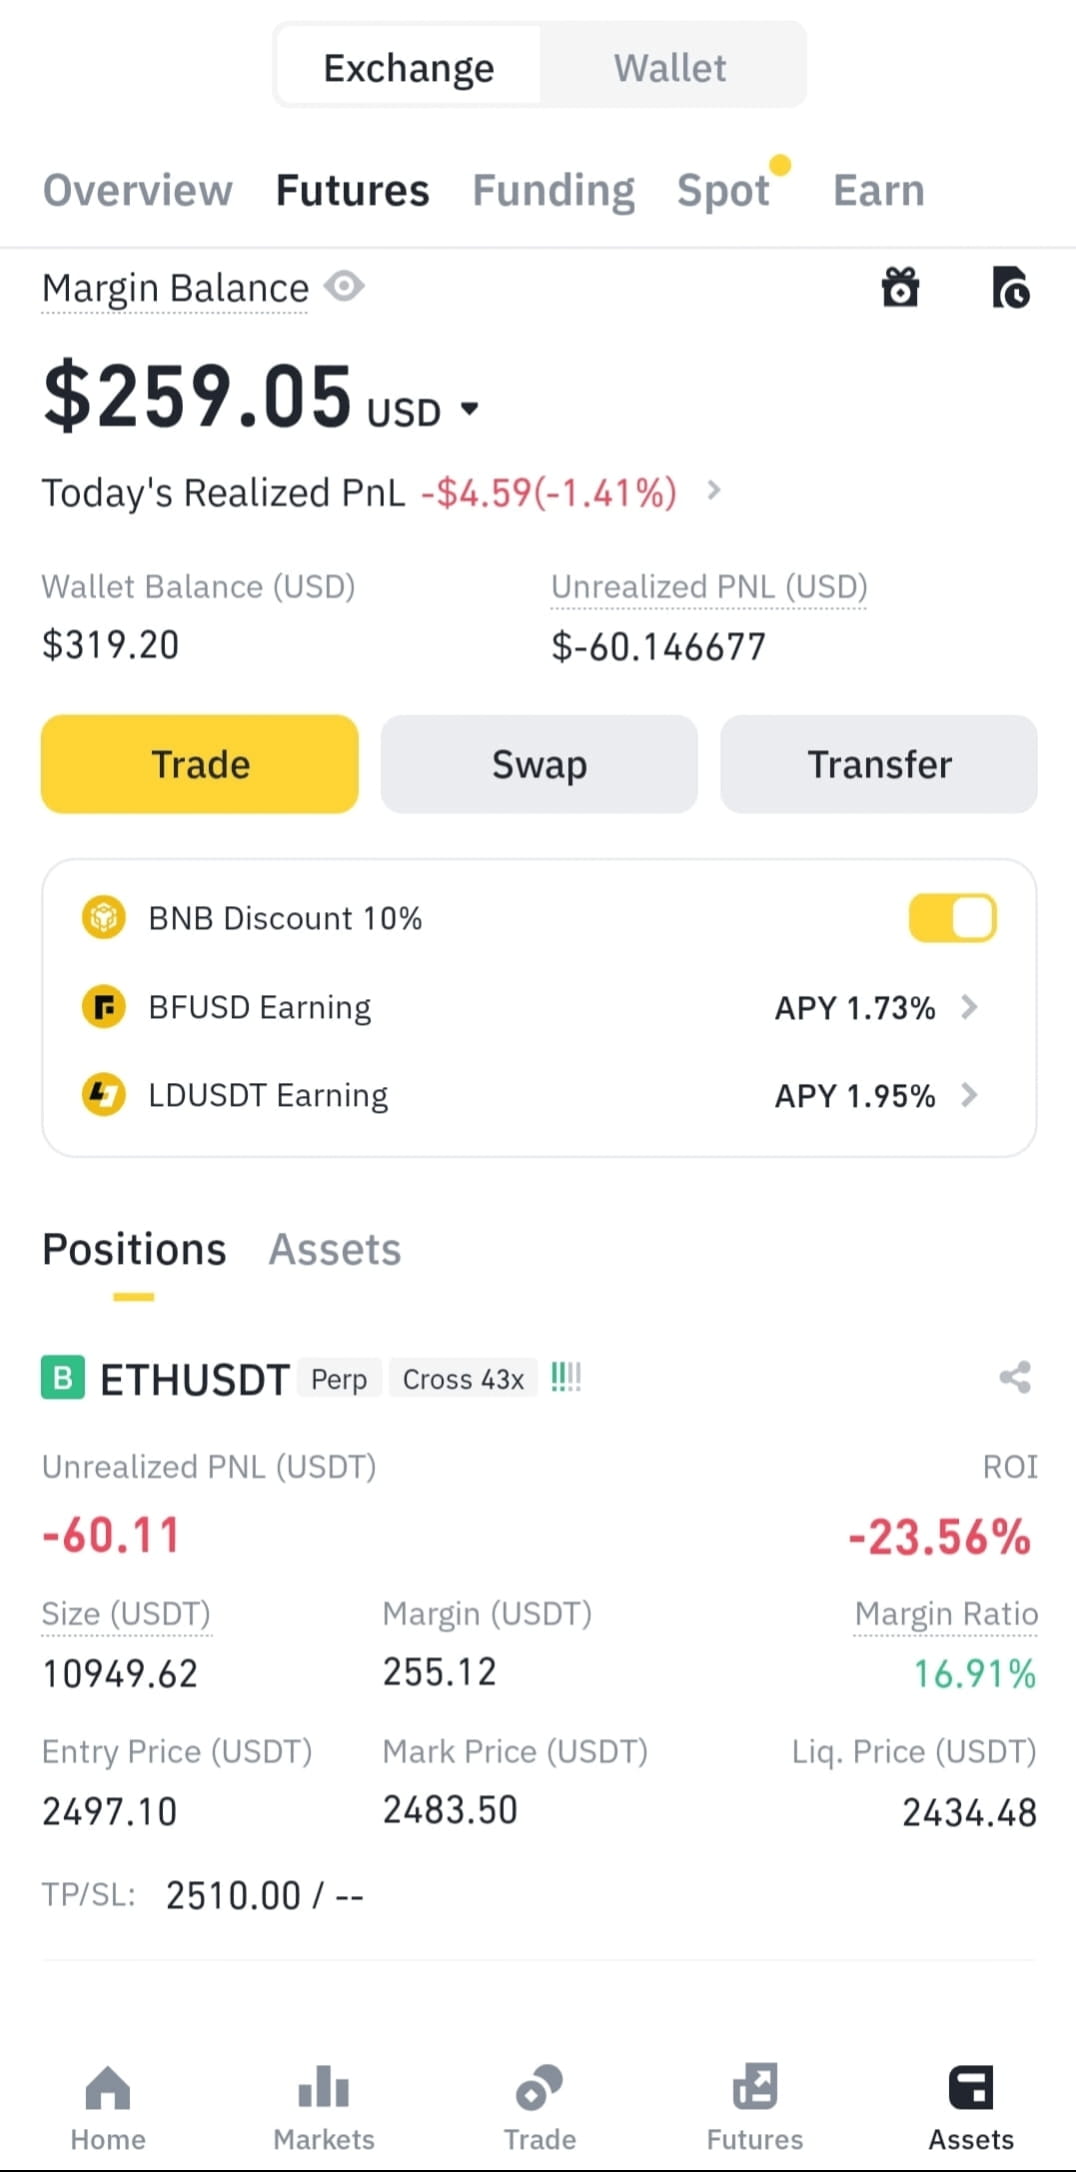
por favor, especialista, me guie. Manter ou fechar 😭😭😭😭😭😭😭😭😭😭😭😭😭😭😭😭😭
just one click and claim your free gift 🎁🎁🎁🎁🎁🎁🎁🎁
Já abaixo de 108k
Já abaixo de 108k
Henry Insights
·
--
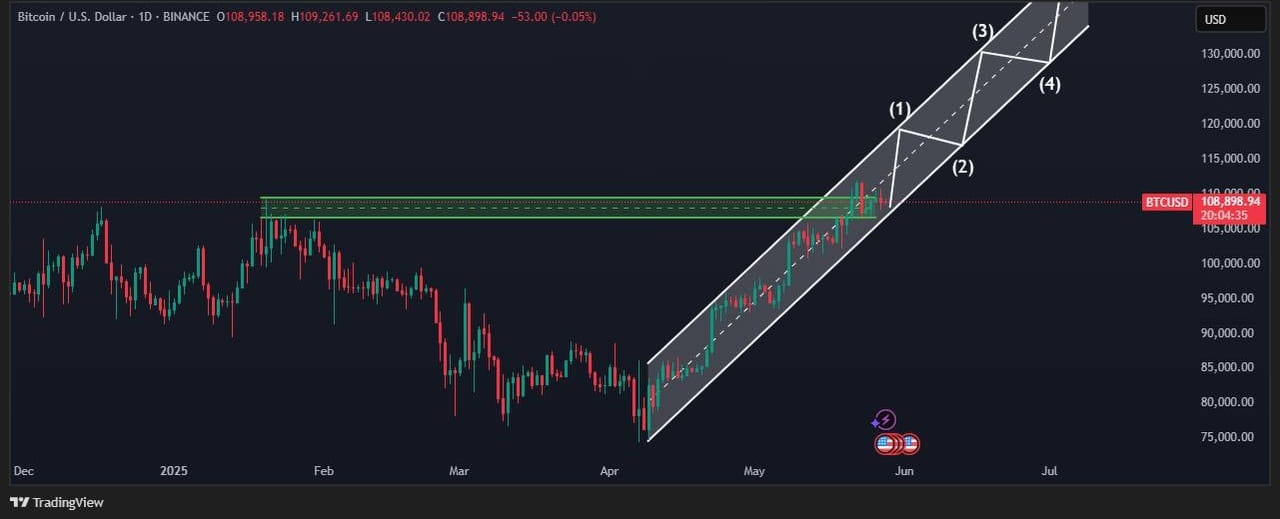
🚨 Análise Técnica do Bitcoin 🚨

$BTC acabou de confirmar uma quebra acima da resistência chave de $108K e está seguindo um canal de alta limpo de 5 ondas.

A Onda (3) está em jogo e os olhos estão em $115K a seguir.
A Onda (5) pode nos levar a $130K+.

O suporte a ser observado é $108K.

Vamos jogar o jogo🔥
Isto significa, mano? Vai subir ou descer?
Isto significa, mano?
Vai subir ou descer?
nick man
·
--
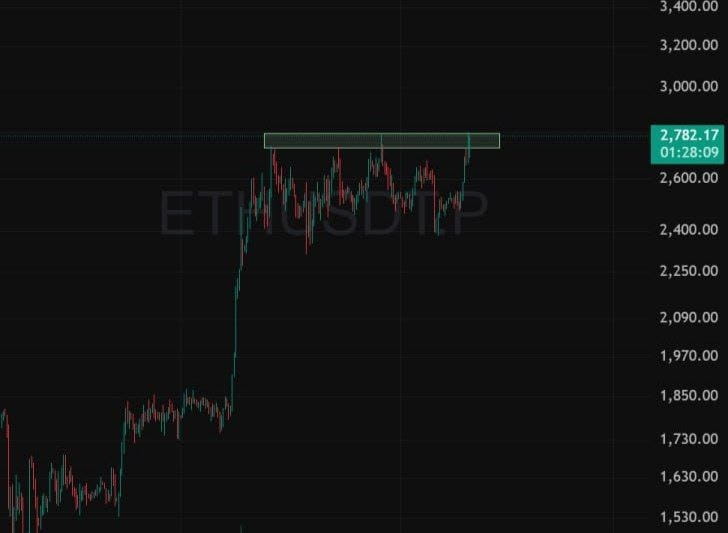
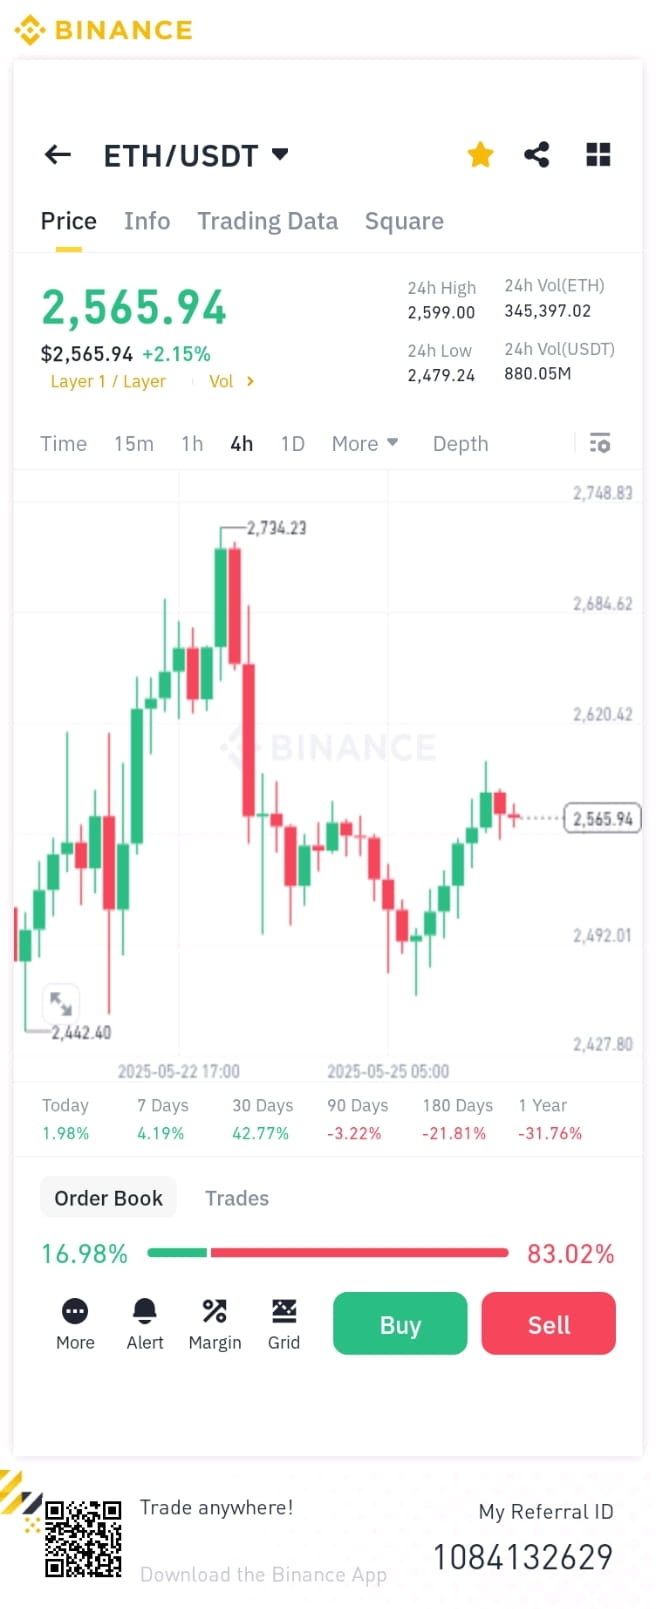
es bar up 2780tak down 2310 ja skti ha market k hesab se tu yehi andaza lga skte hain candall program bhi apni soch de rha ha dosto plan k hesab se chalo $ETH
Vai despejar ou bombear? Noite de domingo ou manhã de segunda-feira?
Vai despejar ou bombear?
Noite de domingo ou manhã de segunda-feira?
Anam Tanveer
·
--
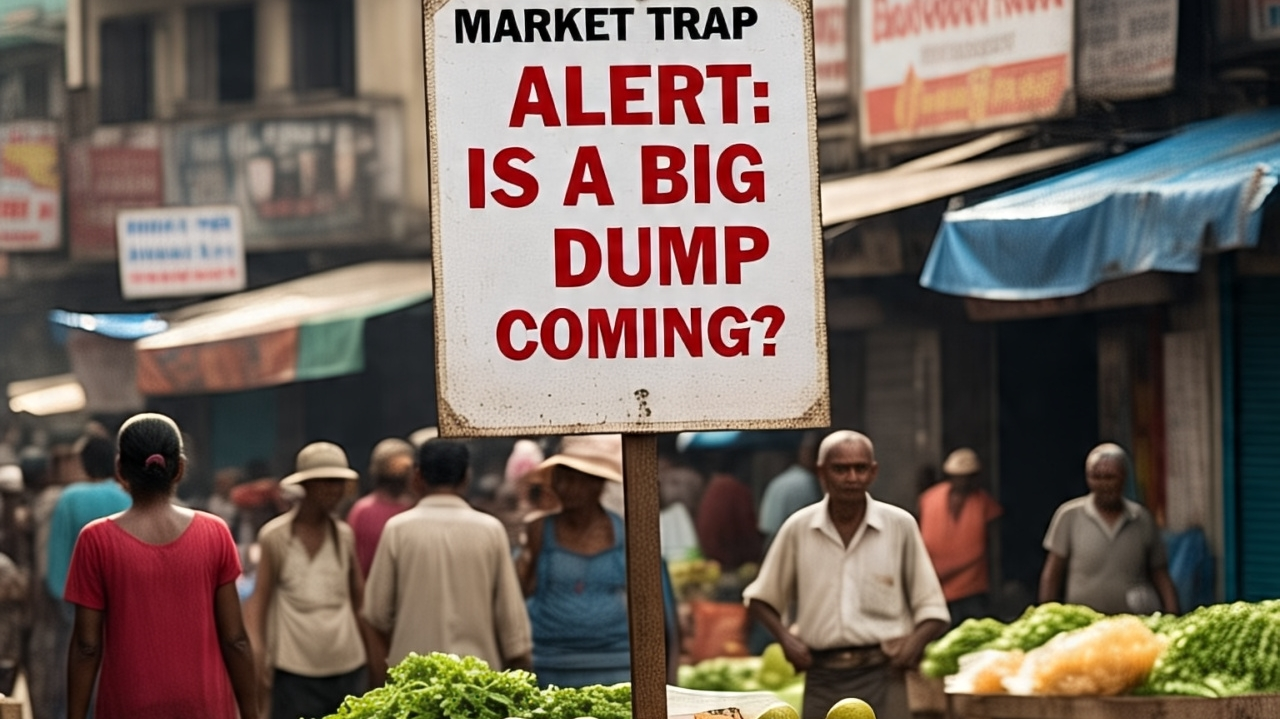
Alerta de Armadilha de Mercado: Um Grande Colapso Está Chegando?
Algo está estranho no mercado. Recentemente, Powell falou, e a reação do mercado foi surpreendentemente calma. Essa calmaria pode ser uma preparação para um grande movimento.
$TRUMP
O que está acontecendo?
- O mercado não reagiu fortemente ao discurso de Powell.
- Há uma falta de convicção entre os traders.
- O mercado está se consolidando, e os traders estão ficando complacentes.
Por que isso pode ser uma armadilha
- Investidores de varejo estão ficando presos em posições.
- A volatilidade está se comprimindo, e os mercados estão se movendo lateralmente.
- A noite de domingo ou a manhã de segunda-feira podem ver um grande movimento devido à liquidez fina.
·
--
Em Alta
2 e 4 Excluir
2 e 4
Excluir
XY_
·
--
Excluir 2 Opções

..
$DOT
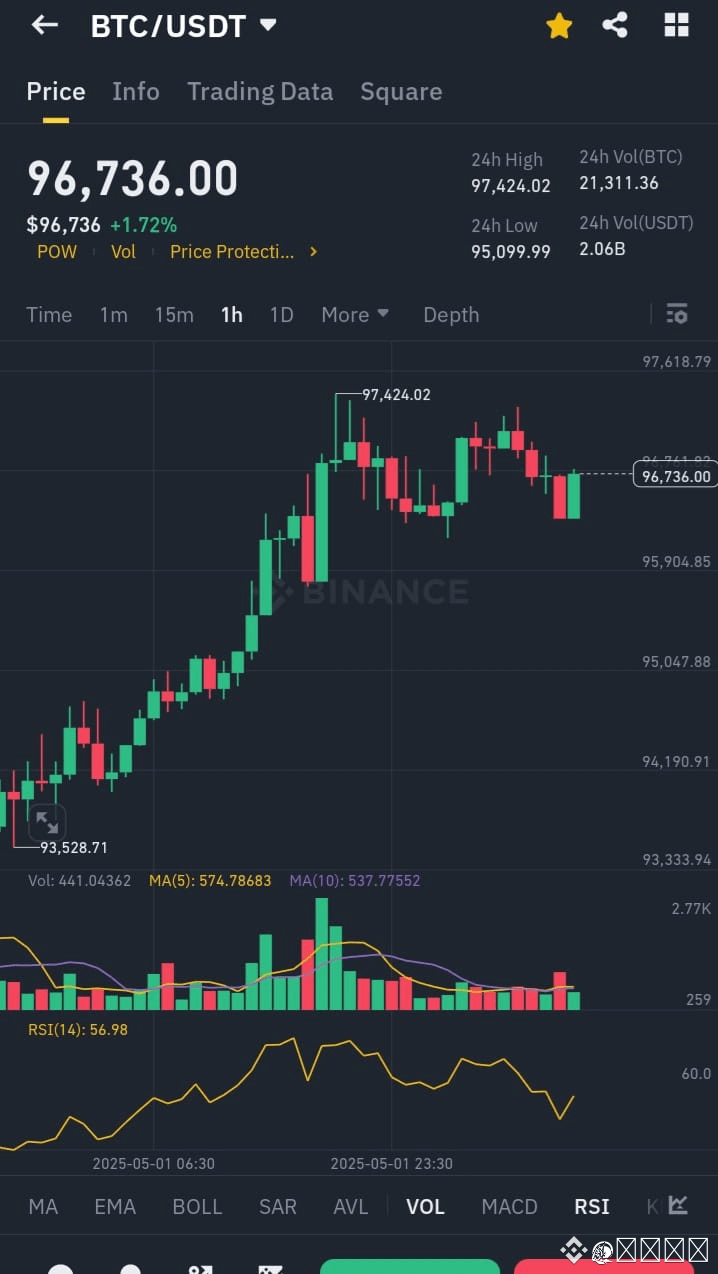
Período: 1H Preço Atual: $96,736 Faixa de 24h: $95,099.99 – $97,424.02 Mudança de Preço (24h): +1.72% Volume (24h): 21,311.36 BTC --- Principais Indicadores Técnicos: 1. Ação do Preço & Estrutura de Candlestick: Tendência de alta clara de cerca de $93,528.71 a $97,424.02. Recentemente enfrentou resistência em $97,424.02. O preço recuou e agora está se consolidando em torno de $96,736. 2. Médias Móveis (MA): MA(5): 574.78 MA(10): 537.77 Como ambos estão relativamente altos em valores de volume (provavelmente referindo-se às médias móveis de volume, não às médias de preço — verifique suas configurações), mas seu comportamento de cruzamento ainda sugeriria força na tendência de curto prazo. 3. RSI (Índice de Força Relativa): RSI Atual: 56.98 Neutro — nem sobrecomprado nem sobrevendido. Uma queda anterior indica um resfriamento após a tendência de alta, mas um salto próximo a 50 sugere que o momento de alta pode retomar se suportado por volume. 4. Volume: Pico durante o rali de preços. Volume em declínio durante o recuo sugere que os vendedores não estão agressivamente no controle, implicando possível continuação após a consolidação. --- Resumo & Possíveis Cenários: Caso Bullish: Se BTC romper acima de $97,424.02 com aumento de volume, pode mirar níveis psicológicos em torno de $98,000 – $99,000. Caso Bearish: Se falhar em manter acima do suporte de $95,900 (resistência menor anterior), pode retrair em direção a $95,050 – $94,200. Neutro/Consolidação: RSI próximo a 57 e baixo volume recente indicam possível movimento lateral entre $95,900 – $97,400 até um rompimento decisivo. --- Minha Sugestão: Observe o comportamento do volume e do RSI. Se o RSI se mover em direção a 60+ com um pico de volume, considere posições longas. Se cair abaixo de 50 com aumento do volume de vendas, aguarde testes de suporte. #BTCRebound $BTC #StrategicBTCReserve
Período: 1H
Preço Atual: $96,736
Faixa de 24h: $95,099.99 – $97,424.02
Mudança de Preço (24h): +1.72%
Volume (24h): 21,311.36 BTC

---

Principais Indicadores Técnicos:

1. Ação do Preço & Estrutura de Candlestick:

Tendência de alta clara de cerca de $93,528.71 a $97,424.02.

Recentemente enfrentou resistência em $97,424.02.

O preço recuou e agora está se consolidando em torno de $96,736.

2. Médias Móveis (MA):

MA(5): 574.78

MA(10): 537.77

Como ambos estão relativamente altos em valores de volume (provavelmente referindo-se às médias móveis de volume, não às médias de preço — verifique suas configurações), mas seu comportamento de cruzamento ainda sugeriria força na tendência de curto prazo.

3. RSI (Índice de Força Relativa):

RSI Atual: 56.98

Neutro — nem sobrecomprado nem sobrevendido.

Uma queda anterior indica um resfriamento após a tendência de alta, mas um salto próximo a 50 sugere que o momento de alta pode retomar se suportado por volume.

4. Volume:

Pico durante o rali de preços.

Volume em declínio durante o recuo sugere que os vendedores não estão agressivamente no controle, implicando possível continuação após a consolidação.
---

Resumo & Possíveis Cenários:

Caso Bullish:

Se BTC romper acima de $97,424.02 com aumento de volume, pode mirar níveis psicológicos em torno de $98,000 – $99,000.

Caso Bearish:

Se falhar em manter acima do suporte de $95,900 (resistência menor anterior), pode retrair em direção a $95,050 – $94,200.

Neutro/Consolidação:

RSI próximo a 57 e baixo volume recente indicam possível movimento lateral entre $95,900 – $97,400 até um rompimento decisivo.
---

Minha Sugestão:
Observe o comportamento do volume e do RSI. Se o RSI se mover em direção a 60+ com um pico de volume, considere posições longas. Se cair abaixo de 50 com aumento do volume de vendas, aguarde testes de suporte.

#BTCRebound $BTC #StrategicBTCReserve
Segure
Segure
Noor_Dawar
·
--
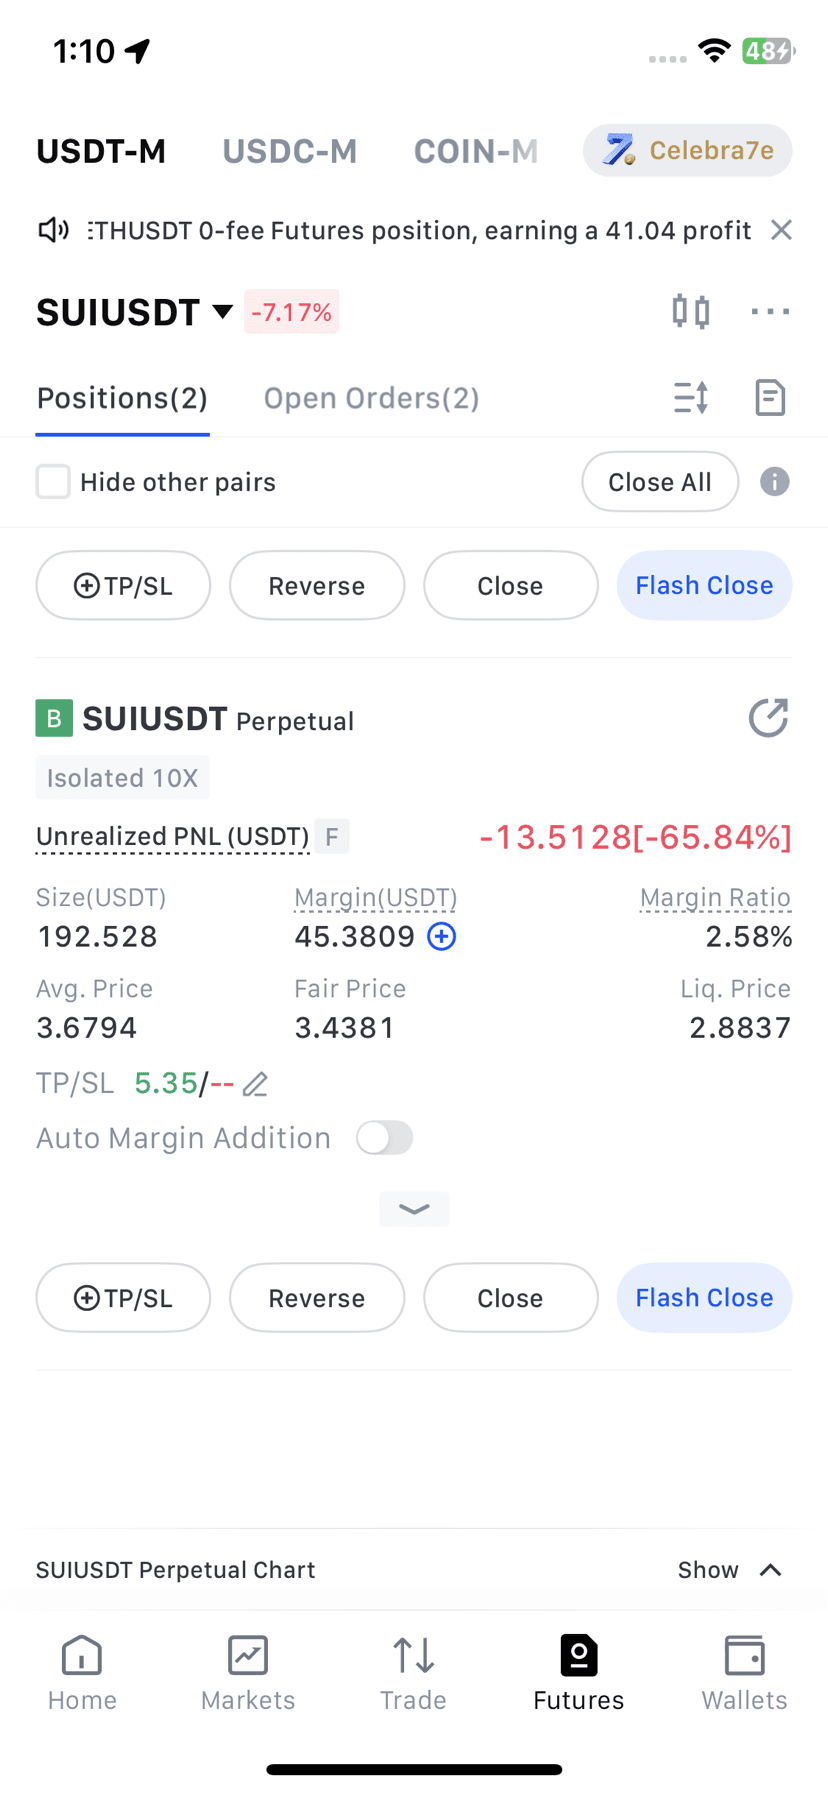
$SUI
Manter ou fechar…..????
Vai subir?
Vai subir?
BlockchainWhale
·
--
Em Alta
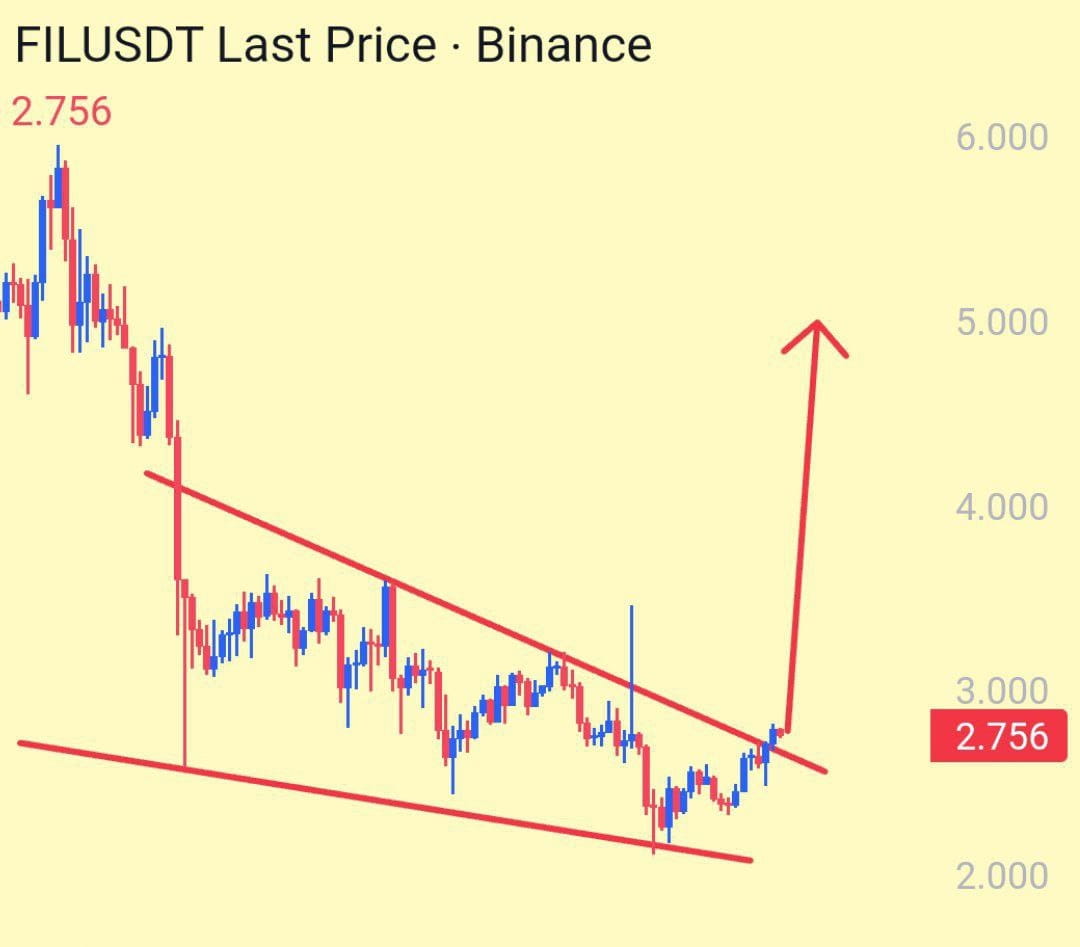
⚡️ $FIL /USDT
📈 Long [Futuros]
🔀 Alavancagem: 10x–20x
💰 Margem: 1%
🏦 Exchange: Binance

🔑 Entrada: 2.69 - 2.60

🚀 Níveis de Lucro:
1️⃣ 2.96
2️⃣ 3.16
3️⃣ 3.36
4️⃣ 3.56

⚠️ Stop Loss:
⭕️ 2.55

💎 Estratégia Spot: Comprar & Manter

#FIL/USDT #cryptowhales69
Curto ou longo? 🤔
Curto ou longo? 🤔
Mudasir Hussain Soomro
·
--
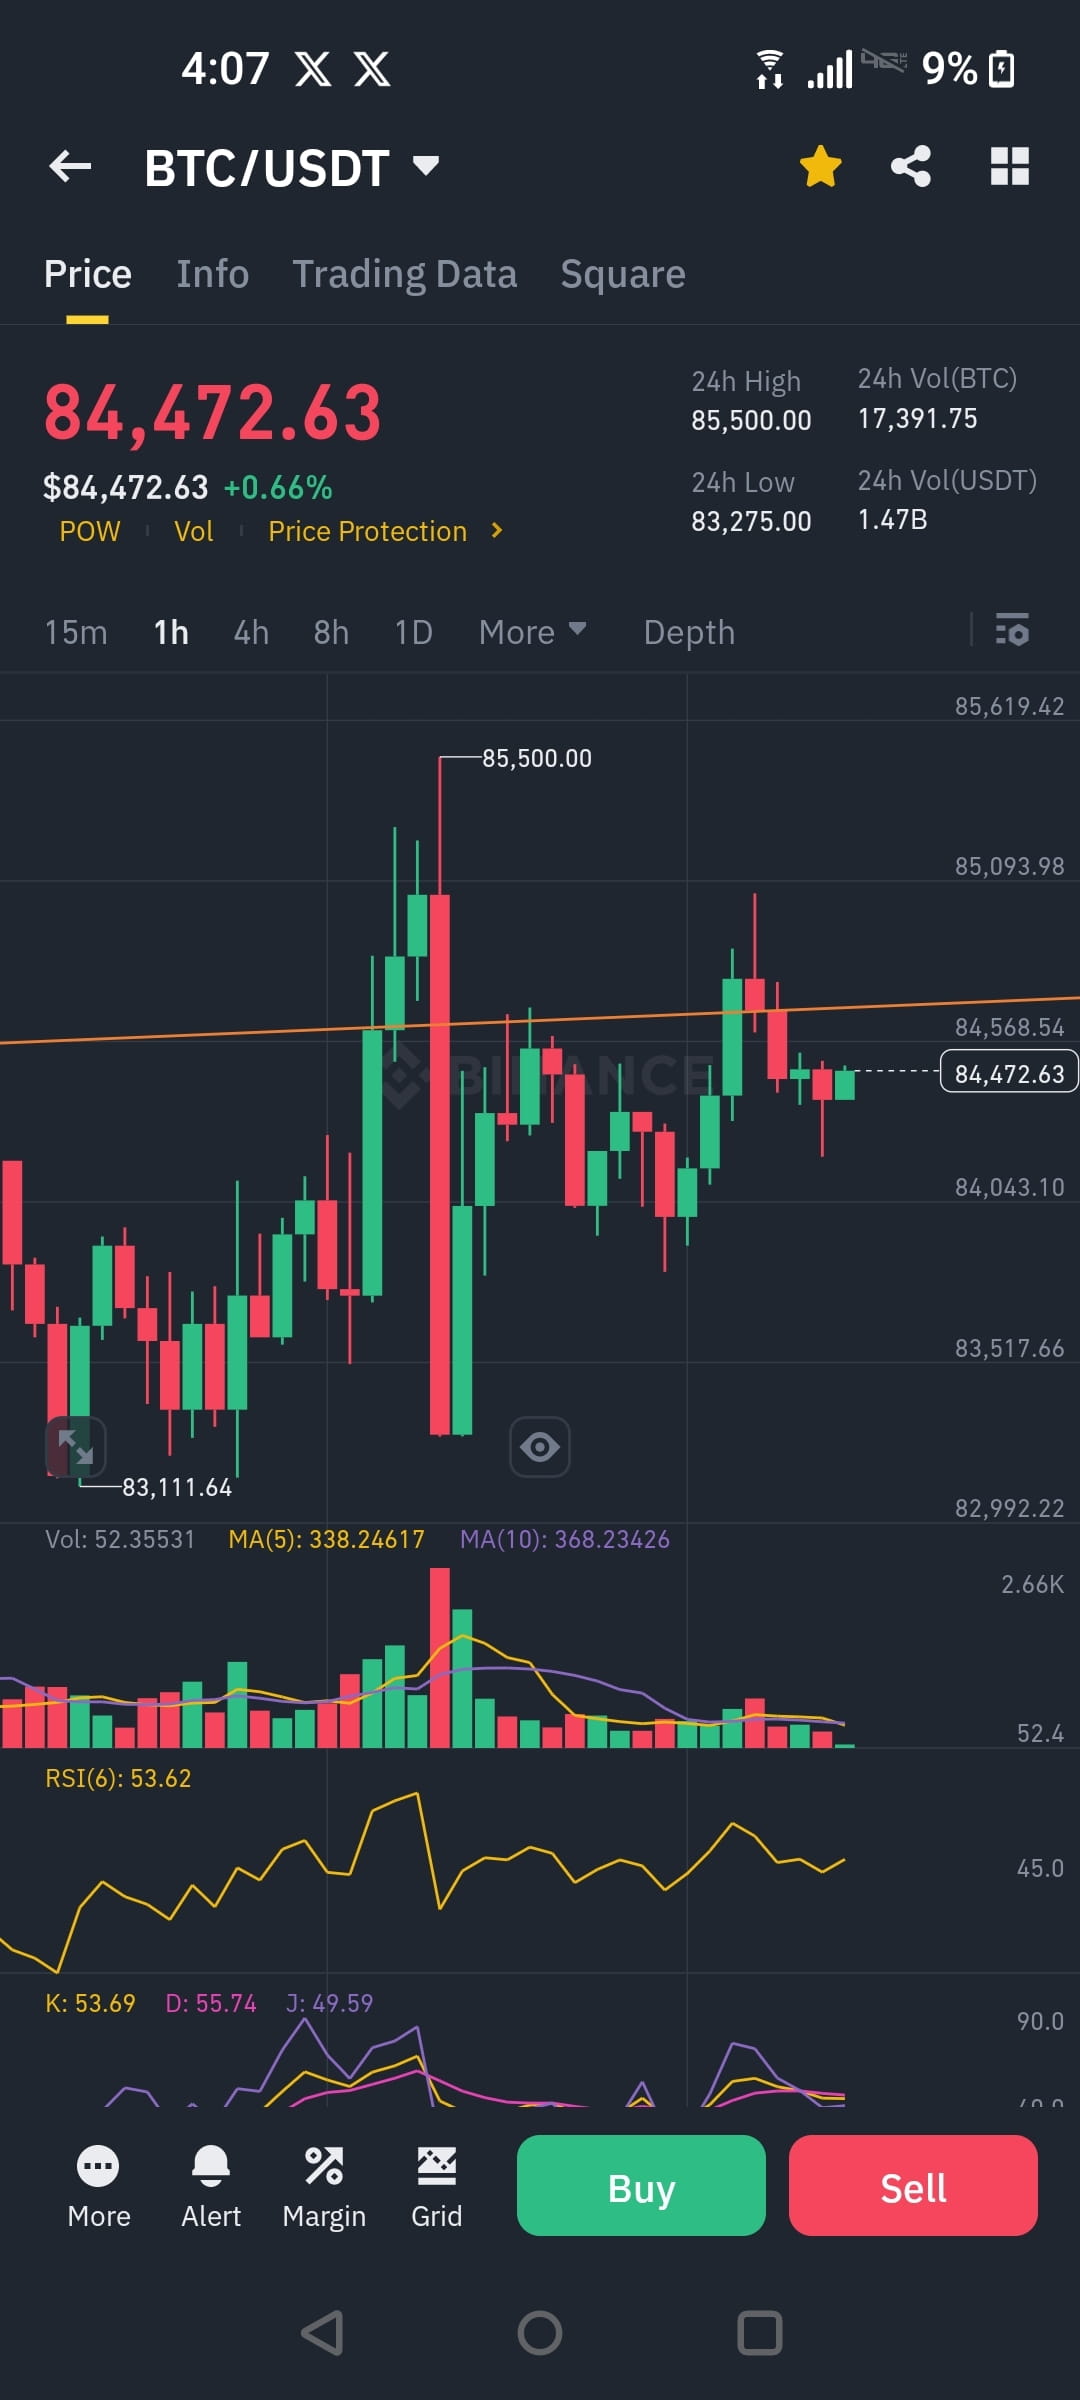
Vender $btc aqui até $88k
Alguém mais já postou essas fotos😂😂
O conteúdo citado foi removido
Inicia sessão para explorar mais conteúdos
Junta-te a utilizadores de criptomoedas de todo o mundo na Binance Square
⚡️ Obtém informações úteis e recentes sobre criptomoedas.
💬 Com a confiança da maior exchange de criptomoedas do mundo.
👍 Descobre perspetivas reais de criadores verificados.
E-mail/Número de telefone
Mapa do sítio
Preferências de cookies
Termos e Condições da Plataforma