

dharztrend
949 Publicações

dharztrend
Denunciar
Bloquear Utilizador
Sharing market analysis, trade ideas, and educational content focused on the Opening Range Breakout (ORB) strategy. Pas
Aberto ao trading
Trader Frequente
4.7 ano(s)
173 A seguir
448 Seguidores
1.5K+ Gostaram
Publicações
Portfólio
Tudo
Cotações
Vídeos
·
--
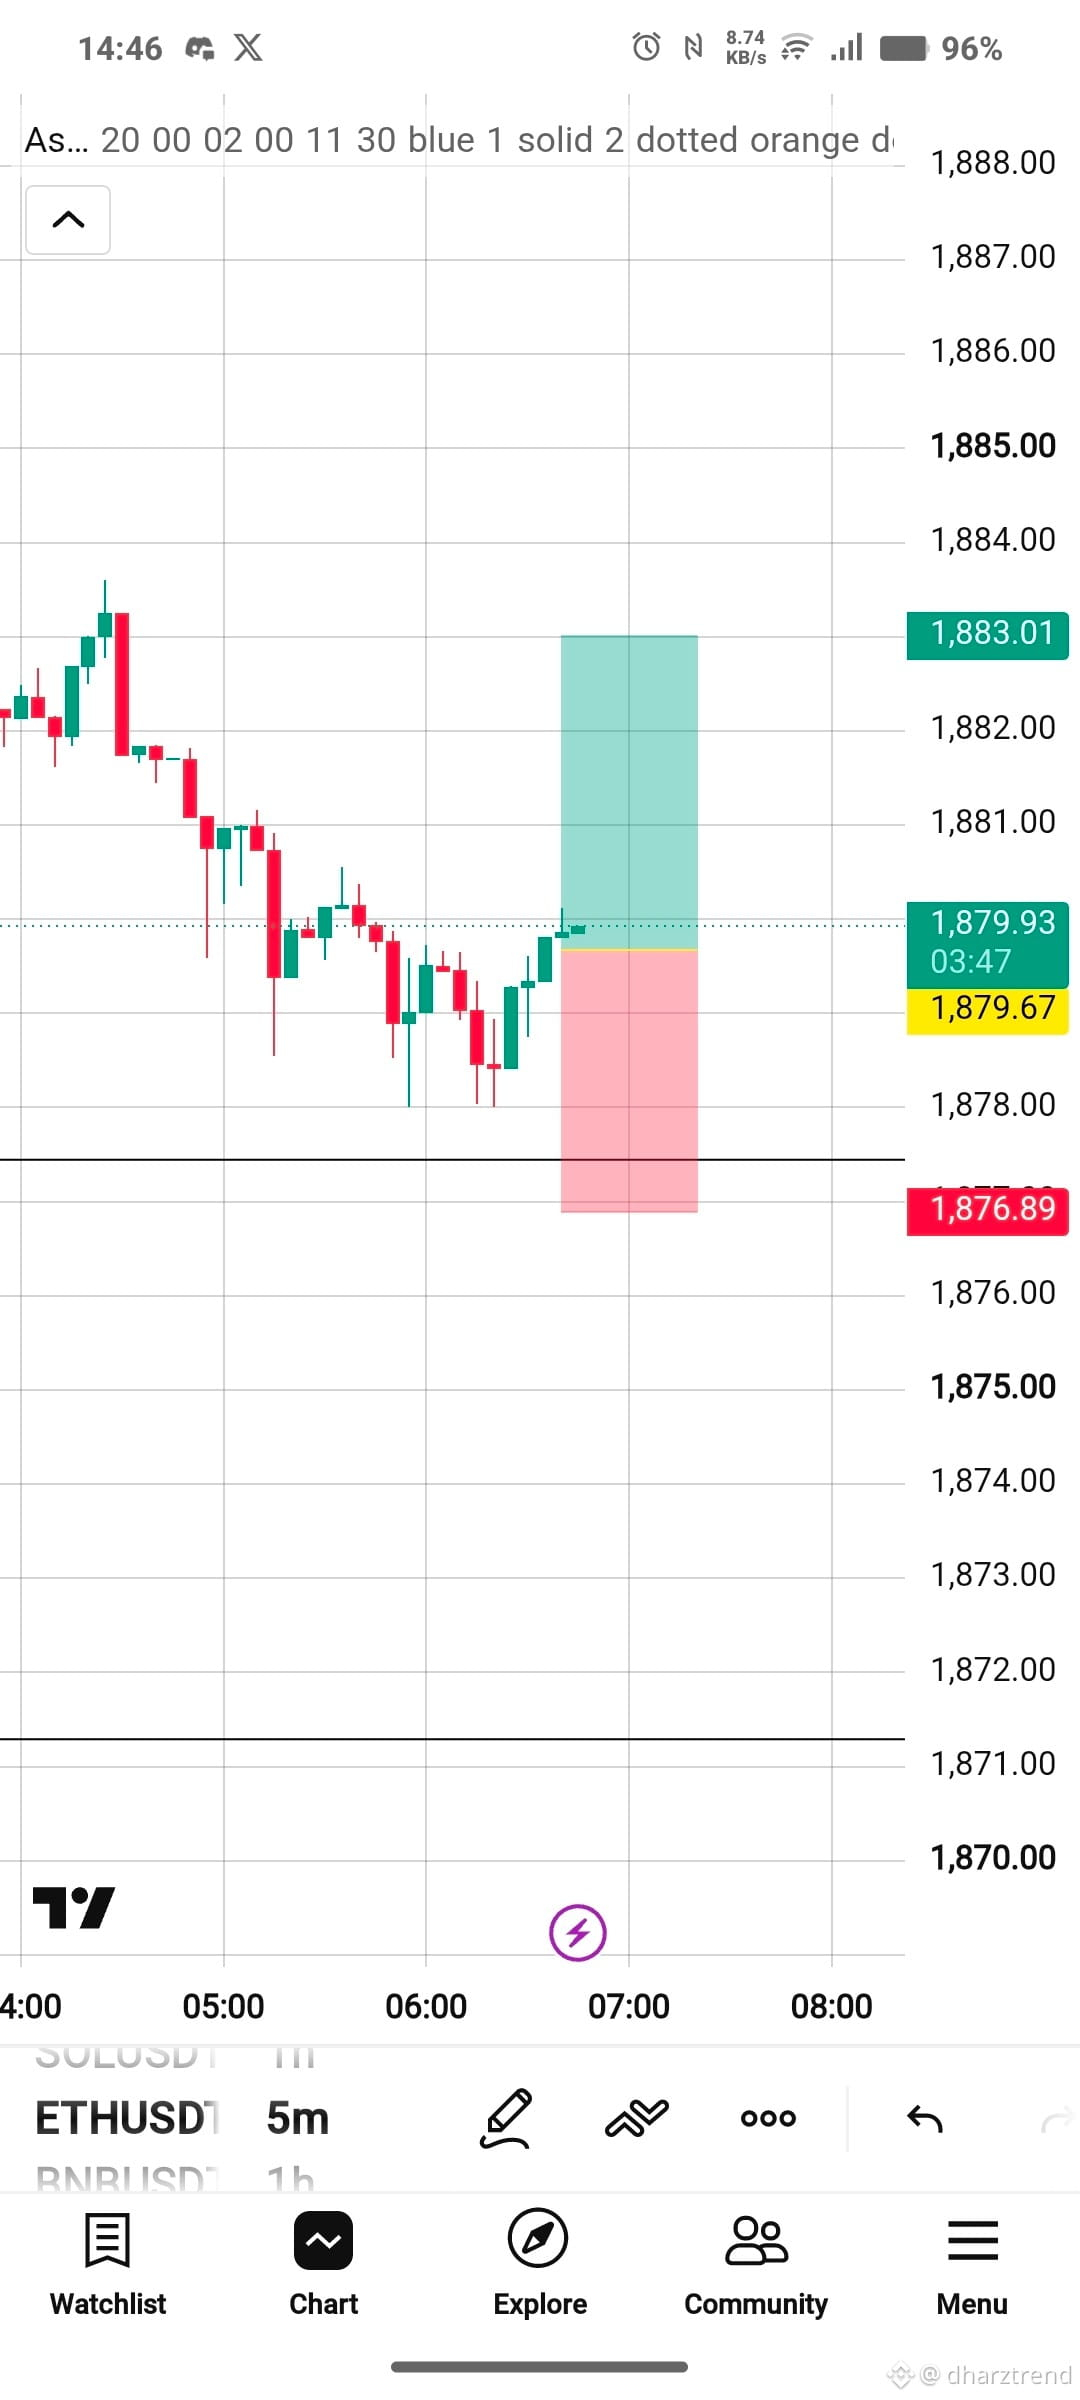
ETHUSDT 5M — SETUP LONG 📈
O preço está mostrando uma reação de alta após testar a área inferior em torno de 1,878–1,879.
🎯 Entrada: 1,879.67
🛑 Stop Loss: 1,876.89
💰 Take Profit: 1,883.01
📊 Risco/Recompensa: ~1:1.2
Ideia de trade: Aguarde a confirmação de que os compradores estão assumindo o controle. Se o preço romper e se mantiver acima da resistência próxima, o próximo alvo fica em torno de 1,883.#ETH #Ethereum #CryptoTrading.
ETHUSDT 5M — SETUP LONG 📈
O preço está mostrando uma reação de alta após testar a área inferior em torno de 1,878–1,879.
🎯 Entrada: 1,879.67
🛑 Stop Loss: 1,876.89
💰 Take Profit: 1,883.01
📊 Risco/Recompensa: ~1:1.2
Ideia de trade: Aguarde a confirmação de que os compradores estão assumindo o controle. Se o preço romper e se mantiver acima da resistência próxima, o próximo alvo fica em torno de 1,883.#ETH #Ethereum #CryptoTrading.
O preço está mostrando uma reação de alta após testar a área inferior em torno de 1,878–1,879.
🎯 Entrada: 1,879.67
🛑 Stop Loss: 1,876.89
💰 Take Profit: 1,883.01
📊 Risco/Recompensa: ~1:1.2
Ideia de trade: Aguarde a confirmação de que os compradores estão assumindo o controle. Se o preço romper e se mantiver acima da resistência próxima, o próximo alvo fica em torno de 1,883.#ETH #Ethereum #CryptoTrading.
68
·
--
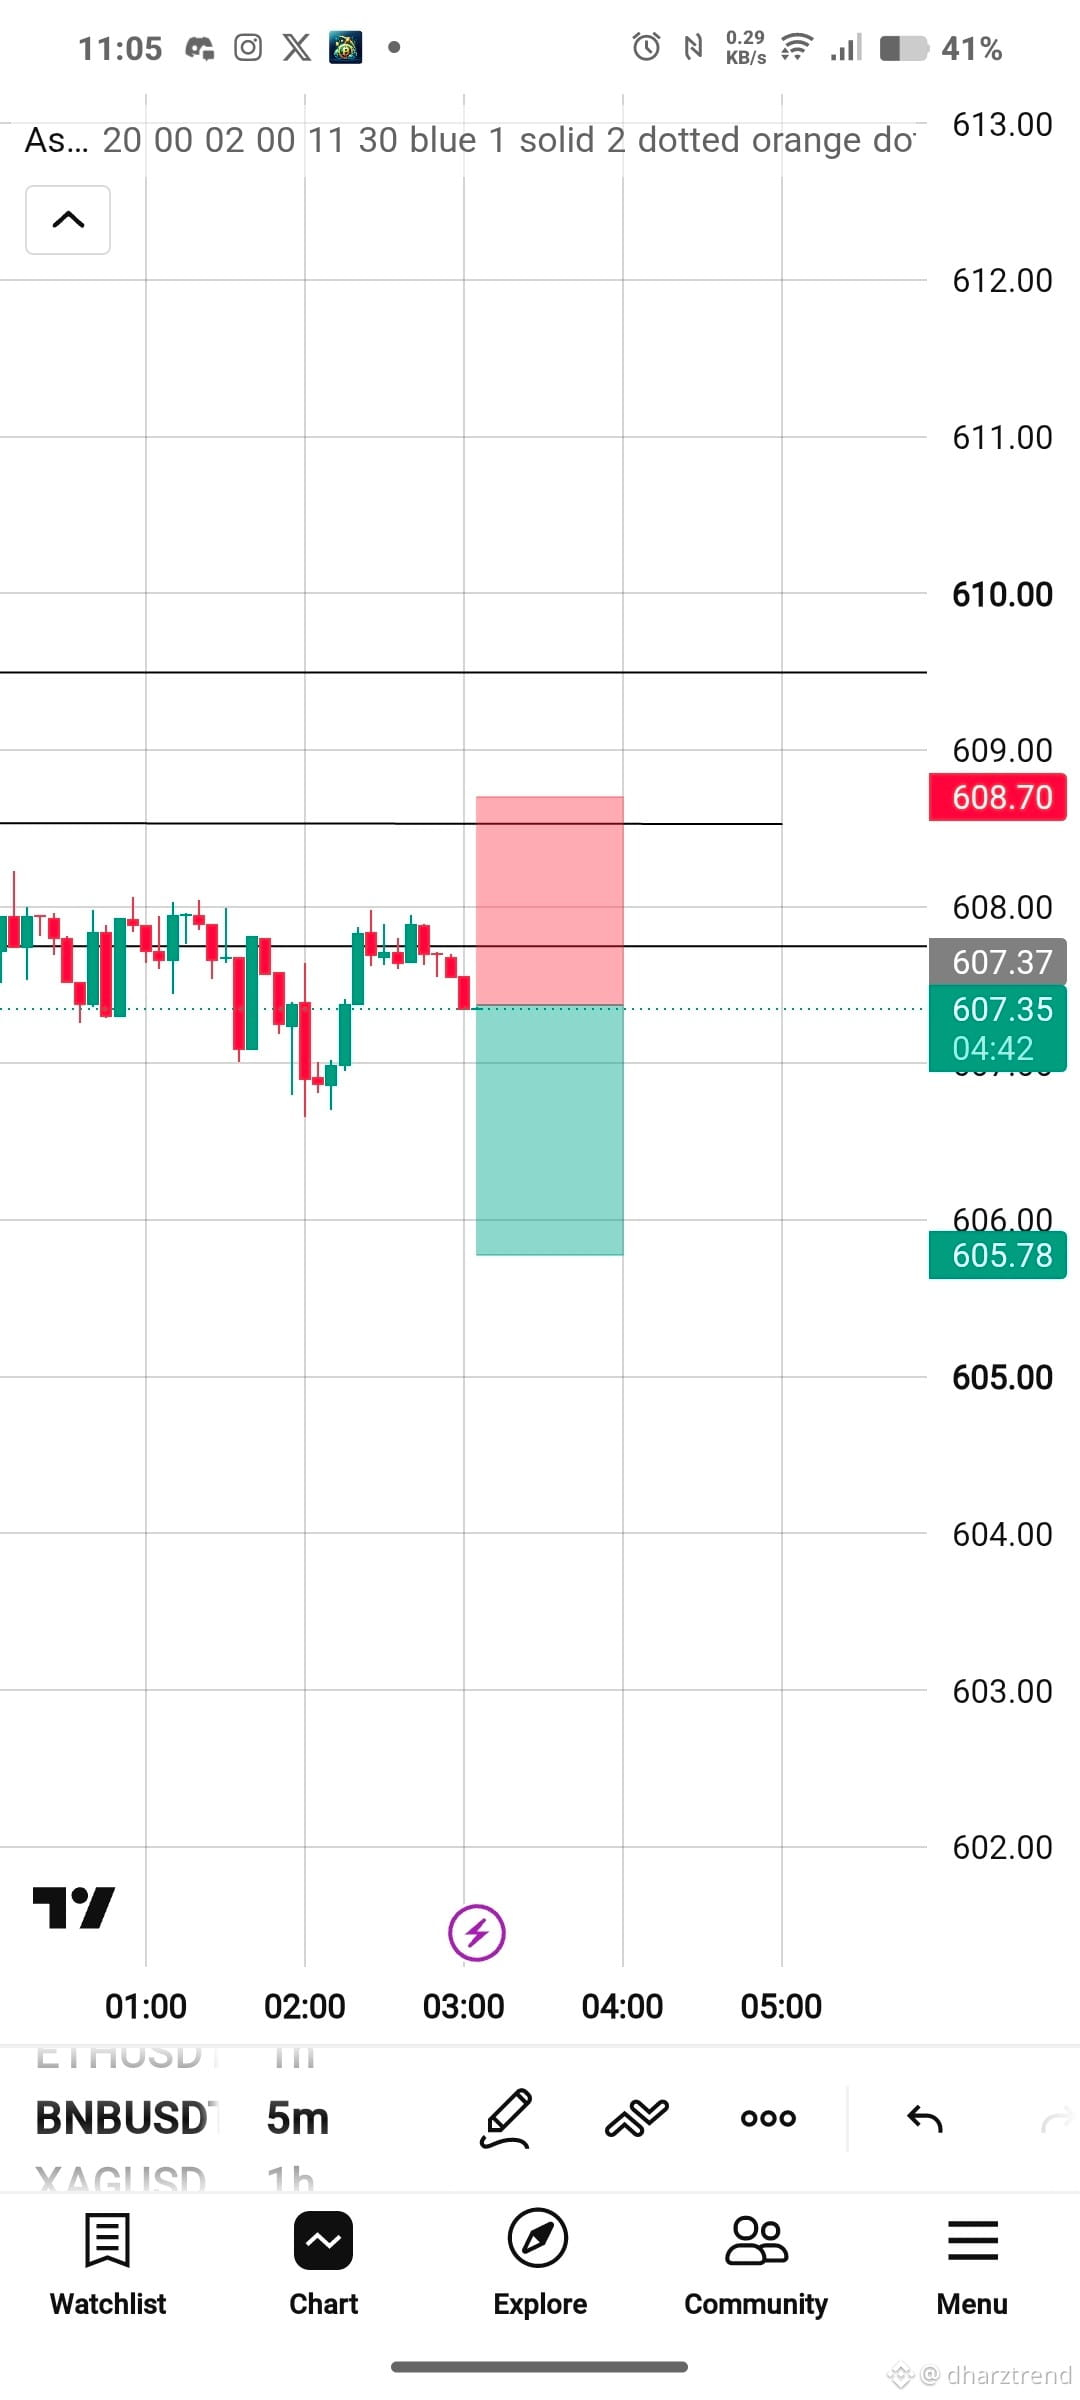
BNBUSD 5M — Setup Short 📉
Acompanhar um possível setup short no BNBUSD.
🔴 Entrada: 607.35
🛑 Stop Loss: 608.70
🎯 Take Profit: 605.78
📊 Risco/Retorno: ~1:1.16
A ideia é procurar rejeição na área de resistência e continuação para baixo. Vou esperar por confirmação antes de entrar—sem confirmação, sem trade.
Sempre gerencie seu risco e nunca arrisque mais do que você pode perder.$BNB
{future}(BNBUSDT)
#bnb #BNBUSDT #Binance #CryptoTrading. #TradingSetup
BNBUSD 5M — Setup Short 📉
Acompanhar um possível setup short no BNBUSD.
🔴 Entrada: 607.35
🛑 Stop Loss: 608.70
🎯 Take Profit: 605.78
📊 Risco/Retorno: ~1:1.16
A ideia é procurar rejeição na área de resistência e continuação para baixo. Vou esperar por confirmação antes de entrar—sem confirmação, sem trade.
Sempre gerencie seu risco e nunca arrisque mais do que você pode perder.$BNB
#bnb #BNBUSDT #Binance #CryptoTrading. #TradingSetup
Acompanhar um possível setup short no BNBUSD.
🔴 Entrada: 607.35
🛑 Stop Loss: 608.70
🎯 Take Profit: 605.78
📊 Risco/Retorno: ~1:1.16
A ideia é procurar rejeição na área de resistência e continuação para baixo. Vou esperar por confirmação antes de entrar—sem confirmação, sem trade.
Sempre gerencie seu risco e nunca arrisque mais do que você pode perder.$BNB
#bnb #BNBUSDT #Binance #CryptoTrading. #TradingSetup
75
·
--
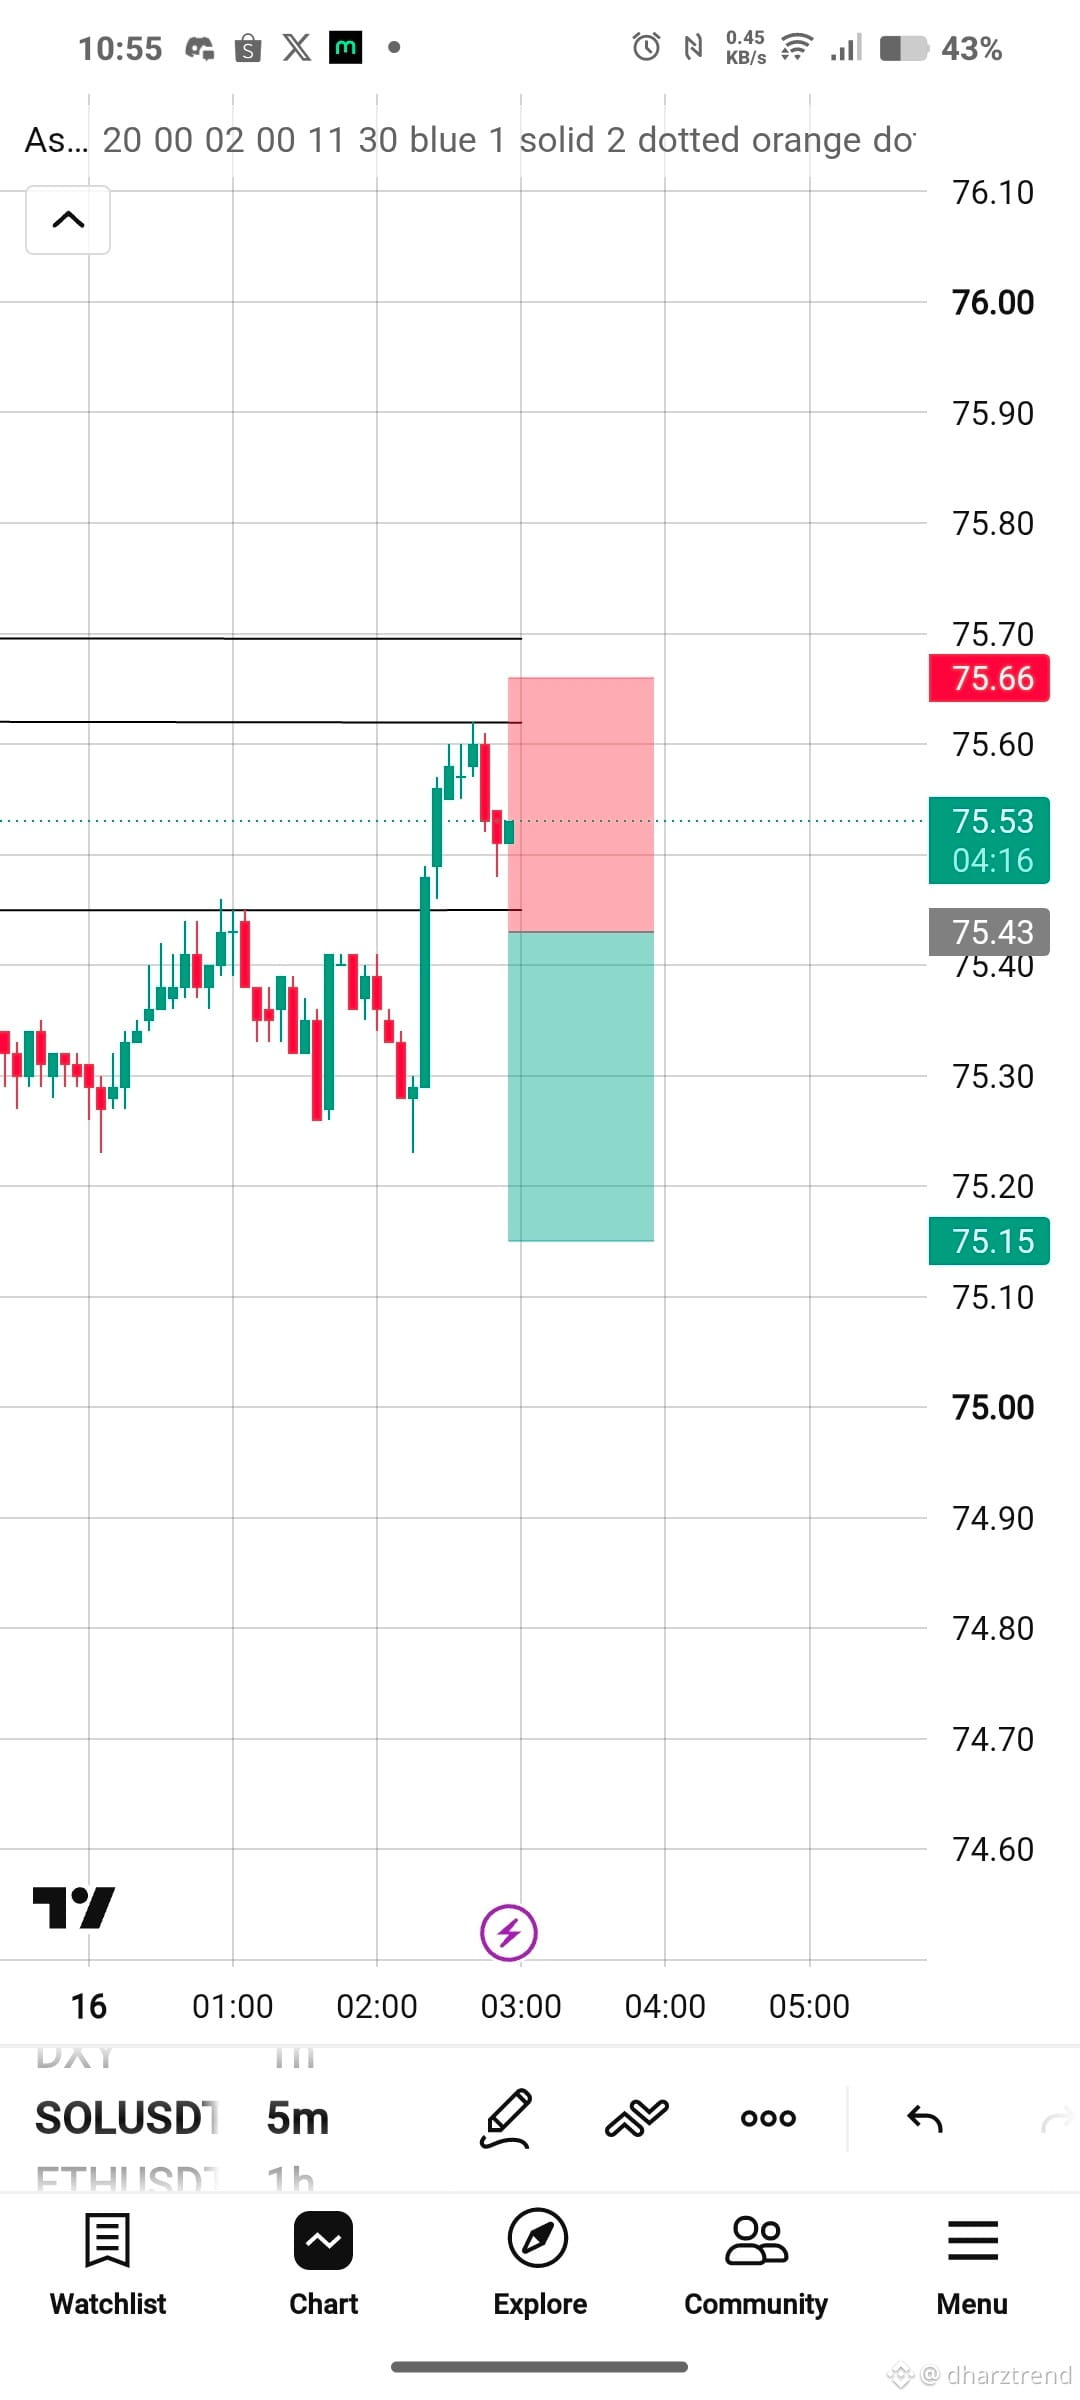
🔥 Configuração SHORT SOL/USDT | 5M
O preço rejeitou a zona de resistência em torno de 75.60–75.65, mostrando sinais de fraqueza após o forte impulso para cima.
📌 Entrada: 75.43
🛑 Stop Loss: 75.66
🎯 Take Profit: 75.15
📊 Risco/Retorno: ~1:1.2
A ideia é esperar a confirmação do momentum de baixa antes de entrar. Se o preço romper o suporte e continuar caindo, o TP vira o próximo alvo.$SOL
{future}(SOLUSDT)
#sol #SOLUSDT #cryptotrading #TradingSetup #Binance
🔥 Configuração SHORT SOL/USDT | 5M
O preço rejeitou a zona de resistência em torno de 75.60–75.65, mostrando sinais de fraqueza após o forte impulso para cima.
📌 Entrada: 75.43
🛑 Stop Loss: 75.66
🎯 Take Profit: 75.15
📊 Risco/Retorno: ~1:1.2
A ideia é esperar a confirmação do momentum de baixa antes de entrar. Se o preço romper o suporte e continuar caindo, o TP vira o próximo alvo.$SOL
#sol #SOLUSDT #cryptotrading #TradingSetup #Binance
O preço rejeitou a zona de resistência em torno de 75.60–75.65, mostrando sinais de fraqueza após o forte impulso para cima.
📌 Entrada: 75.43
🛑 Stop Loss: 75.66
🎯 Take Profit: 75.15
📊 Risco/Retorno: ~1:1.2
A ideia é esperar a confirmação do momentum de baixa antes de entrar. Se o preço romper o suporte e continuar caindo, o TP vira o próximo alvo.$SOL
#sol #SOLUSDT #cryptotrading #TradingSetup #Binance
103
·
--
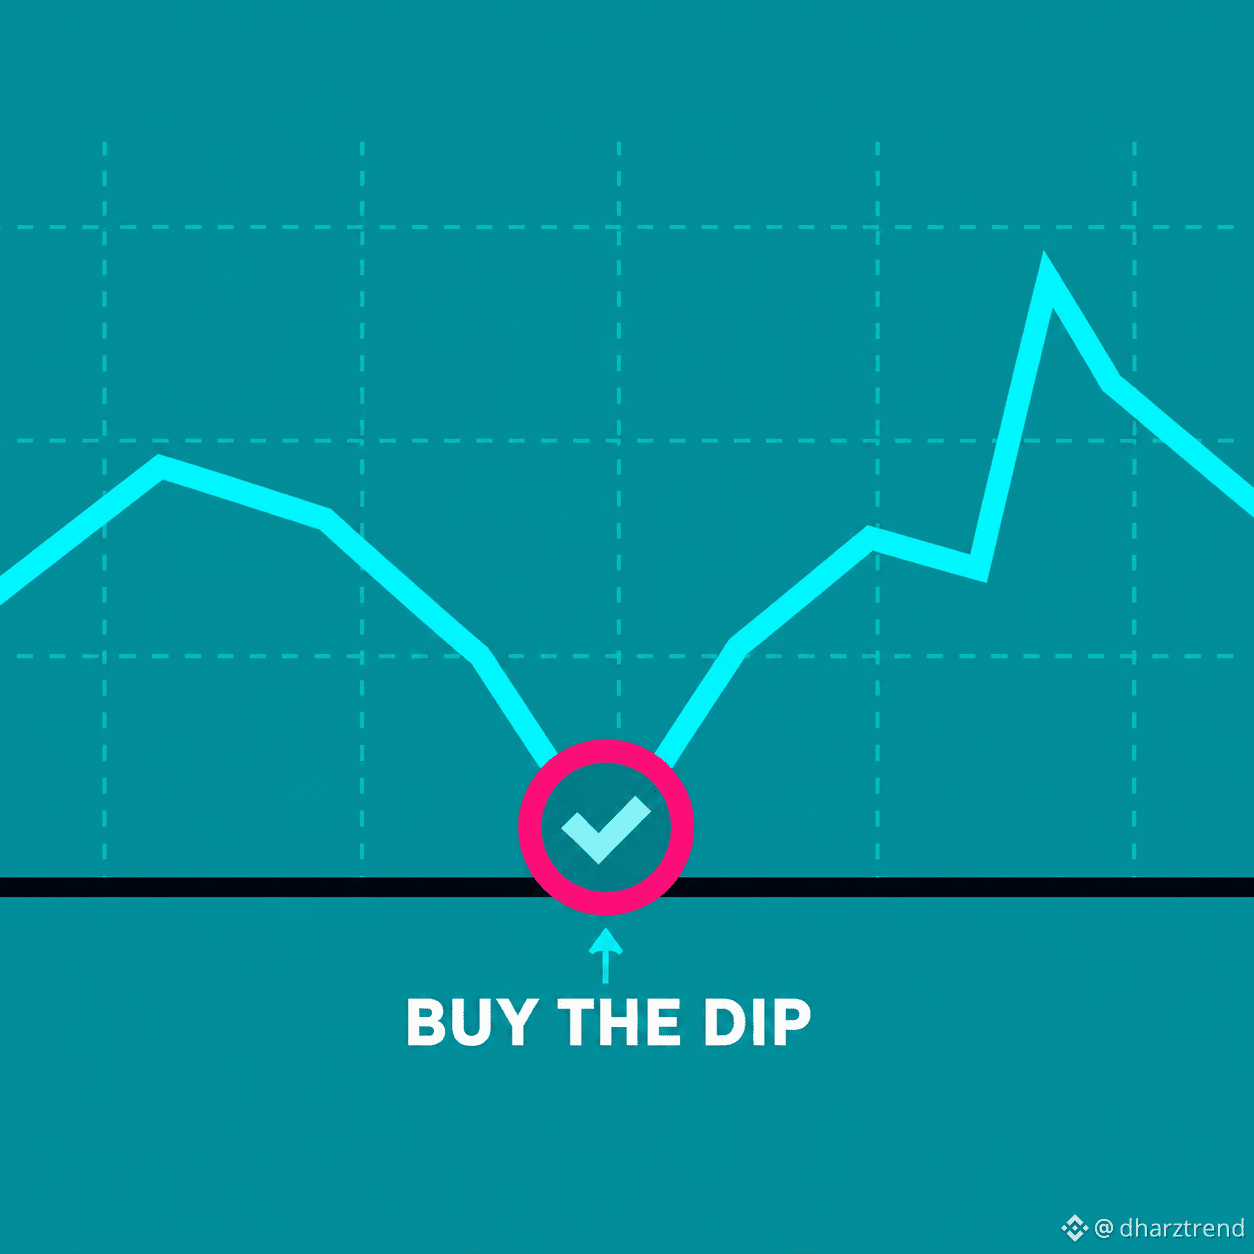
Aproveite a Queda: O que Isso Significa? 📉➡️📈
“Compre a queda” significa comprar um ativo depois que o preço recua temporariamente durante uma tendência geral de alta.
Uma tendência de alta saudável não sobe em linha reta. O preço pode: 📈 Subir
⏸️ Consolidar
📉 Recuar
🚀 Continuar subindo
Para traders e investidores, uma correção pode oferecer uma oportunidade de entrar a um preço melhor — mas nem toda queda é uma compra.
Antes de entrar, verifique: • Tendência e estrutura do mercado
• Zona de suporte / demanda
• Volume e momentum
• Confirmação antes de entrar
• Relação risco-retorno
💡 Lembre-se: uma queda só é uma oportunidade se a estrutura altista continuar intacta. Se a tendência se romper, pode ser uma reversão — e não uma queda para compra.
#BuyTheDip #CryptoTrading #Binance #TradingTips #TechnicalAnalysis
$BTC
{future}(BTCUSDT)
$ETH
{future}(ETHUSDT)
$BNB
{future}(BNBUSDT)
Aproveite a Queda: O que Isso Significa? 📉➡️📈
“Compre a queda” significa comprar um ativo depois que o preço recua temporariamente durante uma tendência geral de alta.
Uma tendência de alta saudável não sobe em linha reta. O preço pode: 📈 Subir
⏸️ Consolidar
📉 Recuar
🚀 Continuar subindo
Para traders e investidores, uma correção pode oferecer uma oportunidade de entrar a um preço melhor — mas nem toda queda é uma compra.
Antes de entrar, verifique: • Tendência e estrutura do mercado
• Zona de suporte / demanda
• Volume e momentum
• Confirmação antes de entrar
• Relação risco-retorno
💡 Lembre-se: uma queda só é uma oportunidade se a estrutura altista continuar intacta. Se a tendência se romper, pode ser uma reversão — e não uma queda para compra.
#BuyTheDip #CryptoTrading #Binance #TradingTips #TechnicalAnalysis
$BTC
$ETH
$BNB
“Compre a queda” significa comprar um ativo depois que o preço recua temporariamente durante uma tendência geral de alta.
Uma tendência de alta saudável não sobe em linha reta. O preço pode: 📈 Subir
⏸️ Consolidar
📉 Recuar
🚀 Continuar subindo
Para traders e investidores, uma correção pode oferecer uma oportunidade de entrar a um preço melhor — mas nem toda queda é uma compra.
Antes de entrar, verifique: • Tendência e estrutura do mercado
• Zona de suporte / demanda
• Volume e momentum
• Confirmação antes de entrar
• Relação risco-retorno
💡 Lembre-se: uma queda só é uma oportunidade se a estrutura altista continuar intacta. Se a tendência se romper, pode ser uma reversão — e não uma queda para compra.
#BuyTheDip #CryptoTrading #Binance #TradingTips #TechnicalAnalysis
$BTC
$ETH
$BNB
113
·
--
Absolutamente. Aqui vai uma postagem estilo tutorial da Binance explicando exatamente o que aconteceu no seu gráfico:
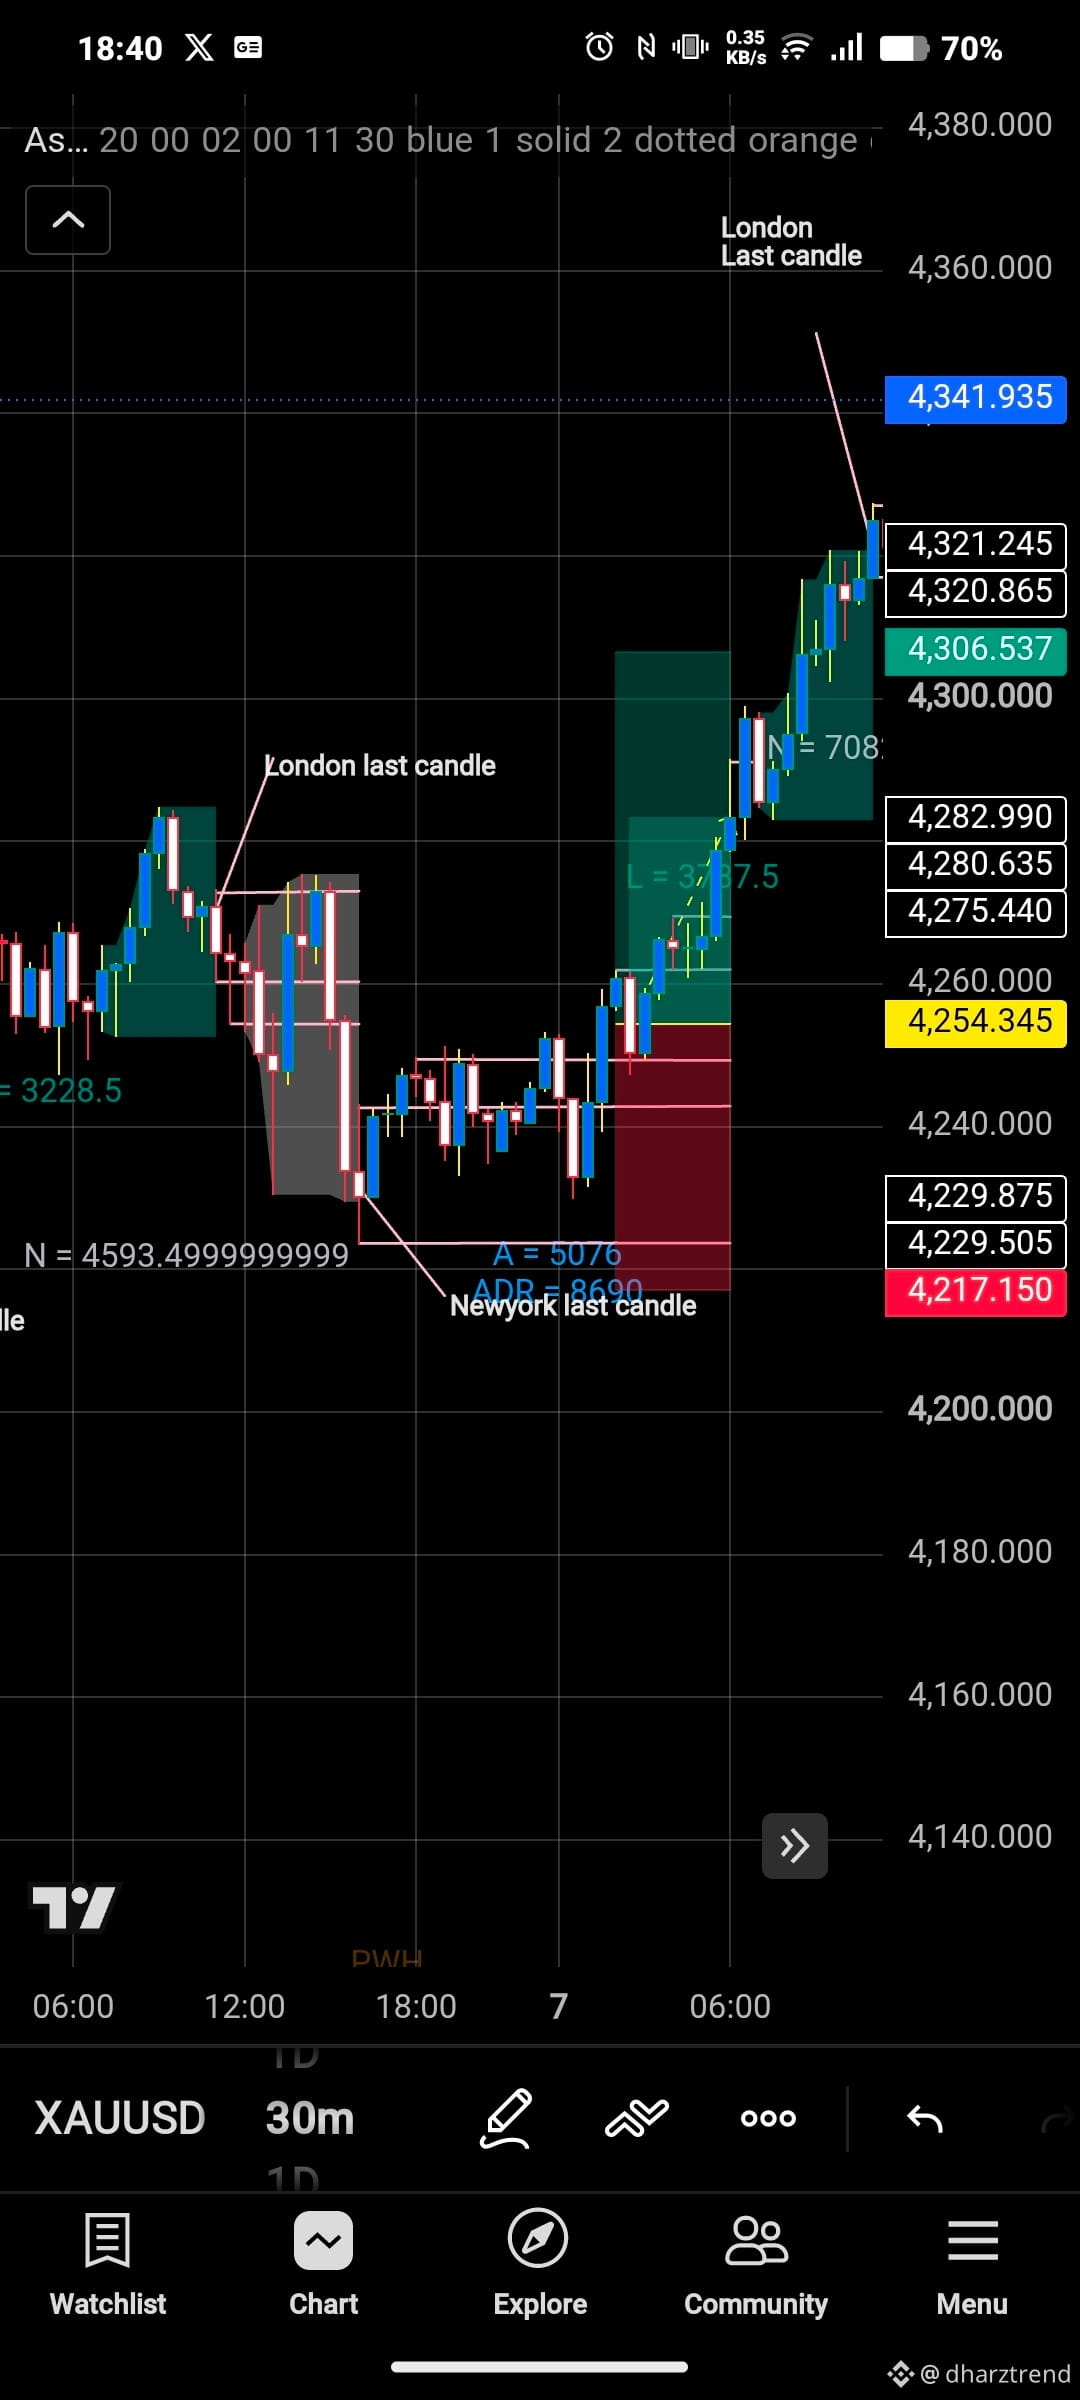
📚 Setup Vencedor de XAUUSD — Tutorial Passo a Passo
Foi assim que identifiquei e executei este setup de rompimento Londres/NY no gráfico de 30 minutos. 📈
1️⃣ Marque a estrutura da sessão anterior
Primeiro, identifique a máxima/mínima da sessão de Londres e de Nova York anteriores.
Esses níveis se tornam áreas importantes onde o preço pode reagir ou romper.
2️⃣ Aguarde a consolidação
Antes do movimento, o XAUUSD estava oscilando na faixa de 4.240–4.260.
Eu não corri atrás do mercado enquanto o preço estava dentro da faixa. Esperei por uma direção clara.
3️⃣ Procure o rompimento
O preço começou a subir e rompeu a resistência anterior.
A parte importante não é apenas a mecha rompendo o nível — eu queria ver fechamentos de candle fortes e momentum comprador.
4️⃣ Confirme a estrutura do mercado
Após o rompimento, o preço começou a formar:
Topo Mais Alto → Fundo Mais Alto → Topo Mais Alto
Isso confirmou que os compradores estavam ganhando controle.
5️⃣ Defina Entrada, SL e TP
📍 Entrada: 4,254.345
🛑 Stop Loss: 4,217.150
🎯 Take Profit: 4,306.537
O SL foi colocado abaixo da estrutura onde a ideia bullish seria invalidada.
6️⃣ Deixe a operação rodar
O preço continuou subindo:
4,275 → 4,283 → 4,300 → 4,306 → 4,321+
🎯 O TP original foi atingido, e o preço continuou subindo depois.
🧠 A Lição
Não entre apenas porque o preço está se movendo.
Aguarde:
Estrutura da sessão → Consolidação → Rompimento → Confirmação → Entrada → Gestão de risco → Alvo
Este setup é um exemplo de paciência e de seguir um plano predefinido em vez de perseguir candles.
⚠️ Conteúdo educacional apenas. Gerencie sempre seu risco e nunca arrisque dinheiro que você não possa perder.
#XAUUSD #GoldTrading #TradingTutorial #PriceAction #Binance
$XAU
{future}(XAUUSDT)
Absolutamente. Aqui vai uma postagem estilo tutorial da Binance explicando exatamente o que aconteceu no seu gráfico:
📚 Setup Vencedor de XAUUSD — Tutorial Passo a Passo
Foi assim que identifiquei e executei este setup de rompimento Londres/NY no gráfico de 30 minutos. 📈
1️⃣ Marque a estrutura da sessão anterior
Primeiro, identifique a máxima/mínima da sessão de Londres e de Nova York anteriores.
Esses níveis se tornam áreas importantes onde o preço pode reagir ou romper.
2️⃣ Aguarde a consolidação
Antes do movimento, o XAUUSD estava oscilando na faixa de 4.240–4.260.
Eu não corri atrás do mercado enquanto o preço estava dentro da faixa. Esperei por uma direção clara.
3️⃣ Procure o rompimento
O preço começou a subir e rompeu a resistência anterior.
A parte importante não é apenas a mecha rompendo o nível — eu queria ver fechamentos de candle fortes e momentum comprador.
4️⃣ Confirme a estrutura do mercado
Após o rompimento, o preço começou a formar:
Topo Mais Alto → Fundo Mais Alto → Topo Mais Alto
Isso confirmou que os compradores estavam ganhando controle.
5️⃣ Defina Entrada, SL e TP
📍 Entrada: 4,254.345
🛑 Stop Loss: 4,217.150
🎯 Take Profit: 4,306.537
O SL foi colocado abaixo da estrutura onde a ideia bullish seria invalidada.
6️⃣ Deixe a operação rodar
O preço continuou subindo:
4,275 → 4,283 → 4,300 → 4,306 → 4,321+
🎯 O TP original foi atingido, e o preço continuou subindo depois.
🧠 A Lição
Não entre apenas porque o preço está se movendo.
Aguarde:
Estrutura da sessão → Consolidação → Rompimento → Confirmação → Entrada → Gestão de risco → Alvo
Este setup é um exemplo de paciência e de seguir um plano predefinido em vez de perseguir candles.
⚠️ Conteúdo educacional apenas. Gerencie sempre seu risco e nunca arrisque dinheiro que você não possa perder.
#XAUUSD #GoldTrading #TradingTutorial #PriceAction #Binance
$XAU
📚 Setup Vencedor de XAUUSD — Tutorial Passo a Passo
Foi assim que identifiquei e executei este setup de rompimento Londres/NY no gráfico de 30 minutos. 📈
1️⃣ Marque a estrutura da sessão anterior
Primeiro, identifique a máxima/mínima da sessão de Londres e de Nova York anteriores.
Esses níveis se tornam áreas importantes onde o preço pode reagir ou romper.
2️⃣ Aguarde a consolidação
Antes do movimento, o XAUUSD estava oscilando na faixa de 4.240–4.260.
Eu não corri atrás do mercado enquanto o preço estava dentro da faixa. Esperei por uma direção clara.
3️⃣ Procure o rompimento
O preço começou a subir e rompeu a resistência anterior.
A parte importante não é apenas a mecha rompendo o nível — eu queria ver fechamentos de candle fortes e momentum comprador.
4️⃣ Confirme a estrutura do mercado
Após o rompimento, o preço começou a formar:
Topo Mais Alto → Fundo Mais Alto → Topo Mais Alto
Isso confirmou que os compradores estavam ganhando controle.
5️⃣ Defina Entrada, SL e TP
📍 Entrada: 4,254.345
🛑 Stop Loss: 4,217.150
🎯 Take Profit: 4,306.537
O SL foi colocado abaixo da estrutura onde a ideia bullish seria invalidada.
6️⃣ Deixe a operação rodar
O preço continuou subindo:
4,275 → 4,283 → 4,300 → 4,306 → 4,321+
🎯 O TP original foi atingido, e o preço continuou subindo depois.
🧠 A Lição
Não entre apenas porque o preço está se movendo.
Aguarde:
Estrutura da sessão → Consolidação → Rompimento → Confirmação → Entrada → Gestão de risco → Alvo
Este setup é um exemplo de paciência e de seguir um plano predefinido em vez de perseguir candles.
⚠️ Conteúdo educacional apenas. Gerencie sempre seu risco e nunca arrisque dinheiro que você não possa perder.
#XAUUSD #GoldTrading #TradingTutorial #PriceAction #Binance
$XAU
127
·
--
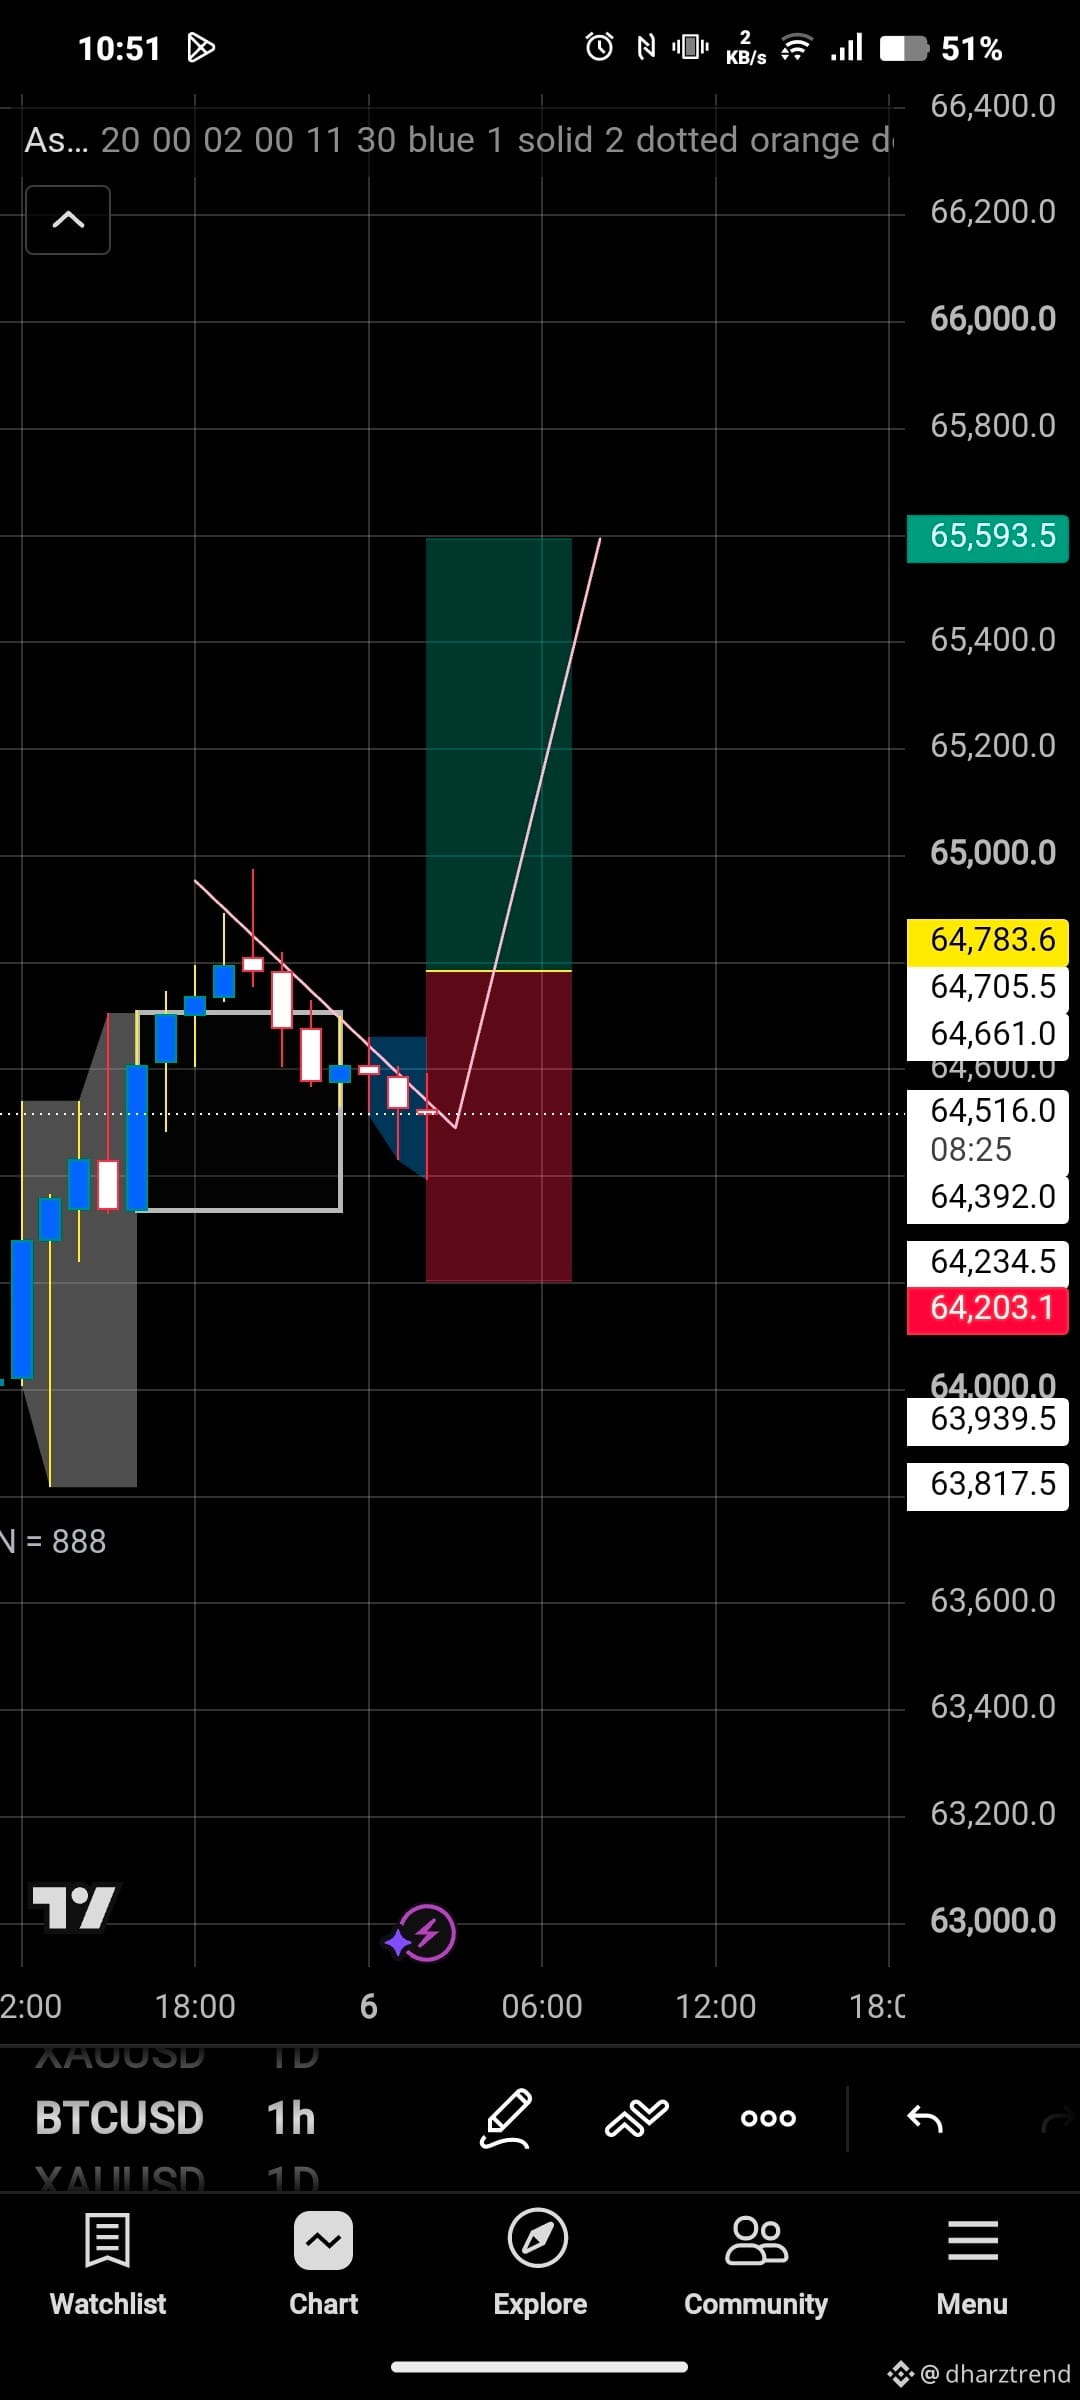
📈 Ideia de Trade BTCUSD | Timeframe de 1H
O BTC está mostrando sinais de uma possível reversão altista após rejeitar uma área-chave de suporte. O preço está consolidando e, se os compradores entrarem com impulso, podemos ver um forte movimento em direção à próxima zona de resistência.
Meu Setup: ✅ Viés: Altista 📍 Entrada: Por volta de 64.500–64.600 🛑 Stop Loss: 64.200 🎯 Take Profit: 65.590 💰 Risco-Retorno: Aproximadamente 1:2
A paciência é fundamental. Aguarde a confirmação antes de entrar na operação e sempre gerencie seu risco. Nenhum setup é garantido — proteja seu capital primeiro.
#Bitcoin #BTC #BTCUSD #CryptoTrading #TechnicalAnalysis #PriceAction #RiskManagement #BinanceSquare #TradingIdea #crypto $BTC
{future}(BTCUSDT)
📈 Ideia de Trade BTCUSD | Timeframe de 1H
O BTC está mostrando sinais de uma possível reversão altista após rejeitar uma área-chave de suporte. O preço está consolidando e, se os compradores entrarem com impulso, podemos ver um forte movimento em direção à próxima zona de resistência.
Meu Setup: ✅ Viés: Altista 📍 Entrada: Por volta de 64.500–64.600 🛑 Stop Loss: 64.200 🎯 Take Profit: 65.590 💰 Risco-Retorno: Aproximadamente 1:2
A paciência é fundamental. Aguarde a confirmação antes de entrar na operação e sempre gerencie seu risco. Nenhum setup é garantido — proteja seu capital primeiro.
#Bitcoin #BTC #BTCUSD #CryptoTrading #TechnicalAnalysis #PriceAction #RiskManagement #BinanceSquare #TradingIdea #crypto $BTC
O BTC está mostrando sinais de uma possível reversão altista após rejeitar uma área-chave de suporte. O preço está consolidando e, se os compradores entrarem com impulso, podemos ver um forte movimento em direção à próxima zona de resistência.
Meu Setup: ✅ Viés: Altista 📍 Entrada: Por volta de 64.500–64.600 🛑 Stop Loss: 64.200 🎯 Take Profit: 65.590 💰 Risco-Retorno: Aproximadamente 1:2
A paciência é fundamental. Aguarde a confirmação antes de entrar na operação e sempre gerencie seu risco. Nenhum setup é garantido — proteja seu capital primeiro.
#Bitcoin #BTC #BTCUSD #CryptoTrading #TechnicalAnalysis #PriceAction #RiskManagement #BinanceSquare #TradingIdea #crypto $BTC
101
·
--
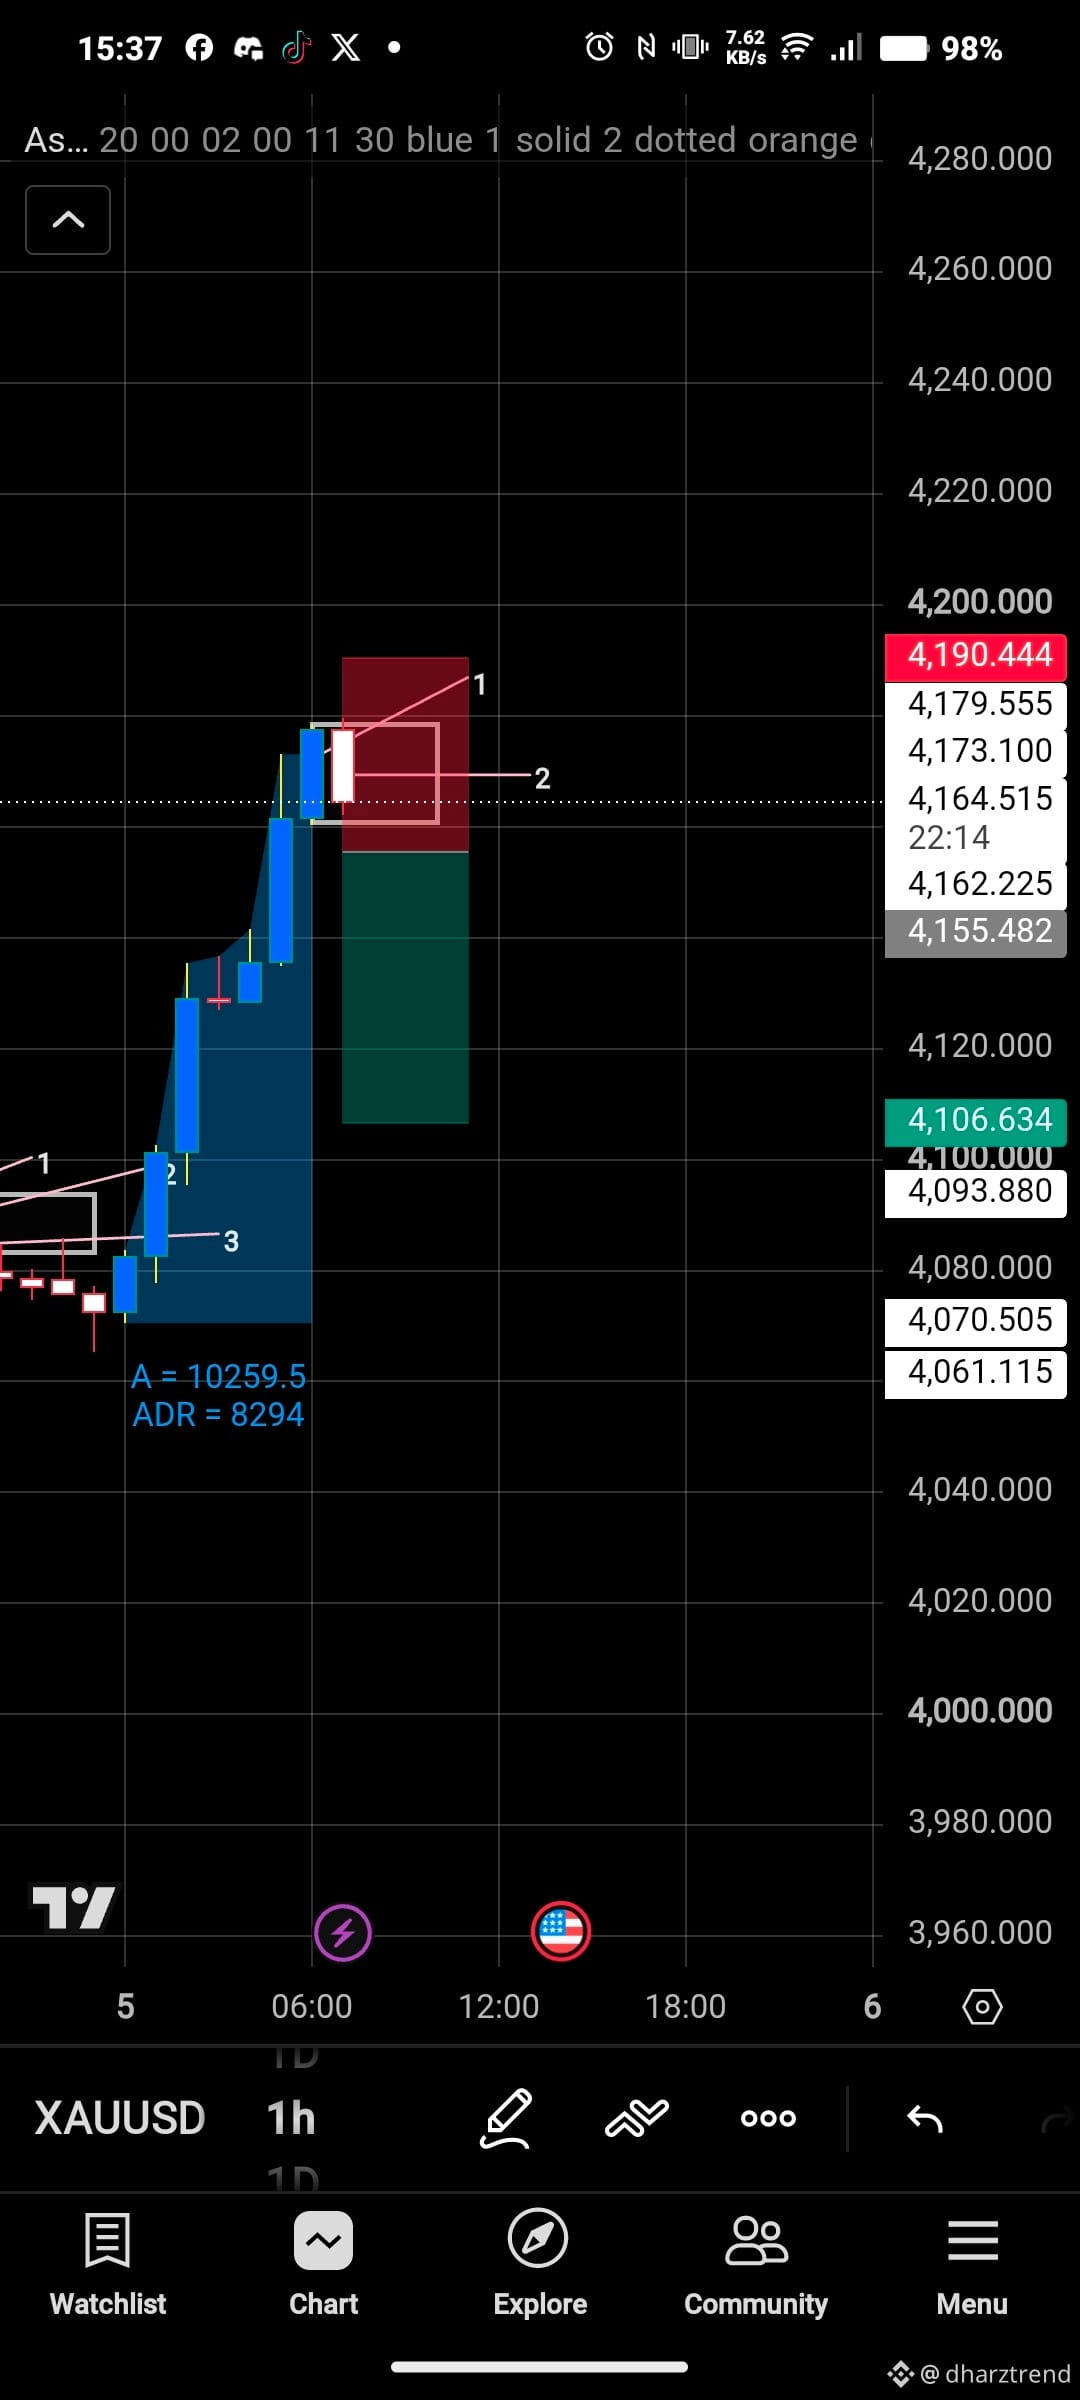
Análise do Mercado XAUUSD (1H)
O XAUUSD está mostrando sinais de exaustão após um forte impulso de alta. O preço subiu de forma agressiva da região de 4.070 para cerca de 4.180+, mas o mais recente candle de 1 hora formou uma rejeição de baixa, sugerindo que os compradores podem estar perdendo o ritmo.
A zona destacada atua como uma possível área de oferta/resistência, onde os vendedores começam a defender o preço. Se o candle atual fechar em baixa e o próximo confirmar com topos mais baixos e fundos mais baixos, um recuo de curto prazo se torna mais provável.
Cenário de baixa 📉
A rejeição permanece abaixo da zona de resistência.
Os vendedores ganham impulso com confirmação de baixa.
Possíveis alvos de queda:
4.155
4.140
4.120
Extensão para 4.106 caso a pressão vendedora aumente.
Cenário de alta 📈
Os compradores invalidam a rejeição fechando acima da resistência.
Uma ruptura acima de 4.180–4.190 pode desencadear mais um movimento de alta em direção à resistência psicológica.
Plano de Trading
Aguarde a confirmação antes de entrar.
Evite perseguir o mercado após um forte impulso.
Foque em gerenciamento de risco e mantenha pelo menos uma relação risco-retorno de 1:2.
Deixe o preço chegar até o seu nível em vez de forçar uma operação.
Lembre-se: Esta é uma análise técnica baseada na ação do preço atual e não é aconselhamento financeiro. Siga sempre o seu plano de trading e gerencie o seu risco.$XAU
{future}(XAUUSDT)
Análise do Mercado XAUUSD (1H)
O XAUUSD está mostrando sinais de exaustão após um forte impulso de alta. O preço subiu de forma agressiva da região de 4.070 para cerca de 4.180+, mas o mais recente candle de 1 hora formou uma rejeição de baixa, sugerindo que os compradores podem estar perdendo o ritmo.
A zona destacada atua como uma possível área de oferta/resistência, onde os vendedores começam a defender o preço. Se o candle atual fechar em baixa e o próximo confirmar com topos mais baixos e fundos mais baixos, um recuo de curto prazo se torna mais provável.
Cenário de baixa 📉
A rejeição permanece abaixo da zona de resistência.
Os vendedores ganham impulso com confirmação de baixa.
Possíveis alvos de queda:
4.155
4.140
4.120
Extensão para 4.106 caso a pressão vendedora aumente.
Cenário de alta 📈
Os compradores invalidam a rejeição fechando acima da resistência.
Uma ruptura acima de 4.180–4.190 pode desencadear mais um movimento de alta em direção à resistência psicológica.
Plano de Trading
Aguarde a confirmação antes de entrar.
Evite perseguir o mercado após um forte impulso.
Foque em gerenciamento de risco e mantenha pelo menos uma relação risco-retorno de 1:2.
Deixe o preço chegar até o seu nível em vez de forçar uma operação.
Lembre-se: Esta é uma análise técnica baseada na ação do preço atual e não é aconselhamento financeiro. Siga sempre o seu plano de trading e gerencie o seu risco.$XAU
O XAUUSD está mostrando sinais de exaustão após um forte impulso de alta. O preço subiu de forma agressiva da região de 4.070 para cerca de 4.180+, mas o mais recente candle de 1 hora formou uma rejeição de baixa, sugerindo que os compradores podem estar perdendo o ritmo.
A zona destacada atua como uma possível área de oferta/resistência, onde os vendedores começam a defender o preço. Se o candle atual fechar em baixa e o próximo confirmar com topos mais baixos e fundos mais baixos, um recuo de curto prazo se torna mais provável.
Cenário de baixa 📉
A rejeição permanece abaixo da zona de resistência.
Os vendedores ganham impulso com confirmação de baixa.
Possíveis alvos de queda:
4.155
4.140
4.120
Extensão para 4.106 caso a pressão vendedora aumente.
Cenário de alta 📈
Os compradores invalidam a rejeição fechando acima da resistência.
Uma ruptura acima de 4.180–4.190 pode desencadear mais um movimento de alta em direção à resistência psicológica.
Plano de Trading
Aguarde a confirmação antes de entrar.
Evite perseguir o mercado após um forte impulso.
Foque em gerenciamento de risco e mantenha pelo menos uma relação risco-retorno de 1:2.
Deixe o preço chegar até o seu nível em vez de forçar uma operação.
Lembre-se: Esta é uma análise técnica baseada na ação do preço atual e não é aconselhamento financeiro. Siga sempre o seu plano de trading e gerencie o seu risco.$XAU
118
·
--
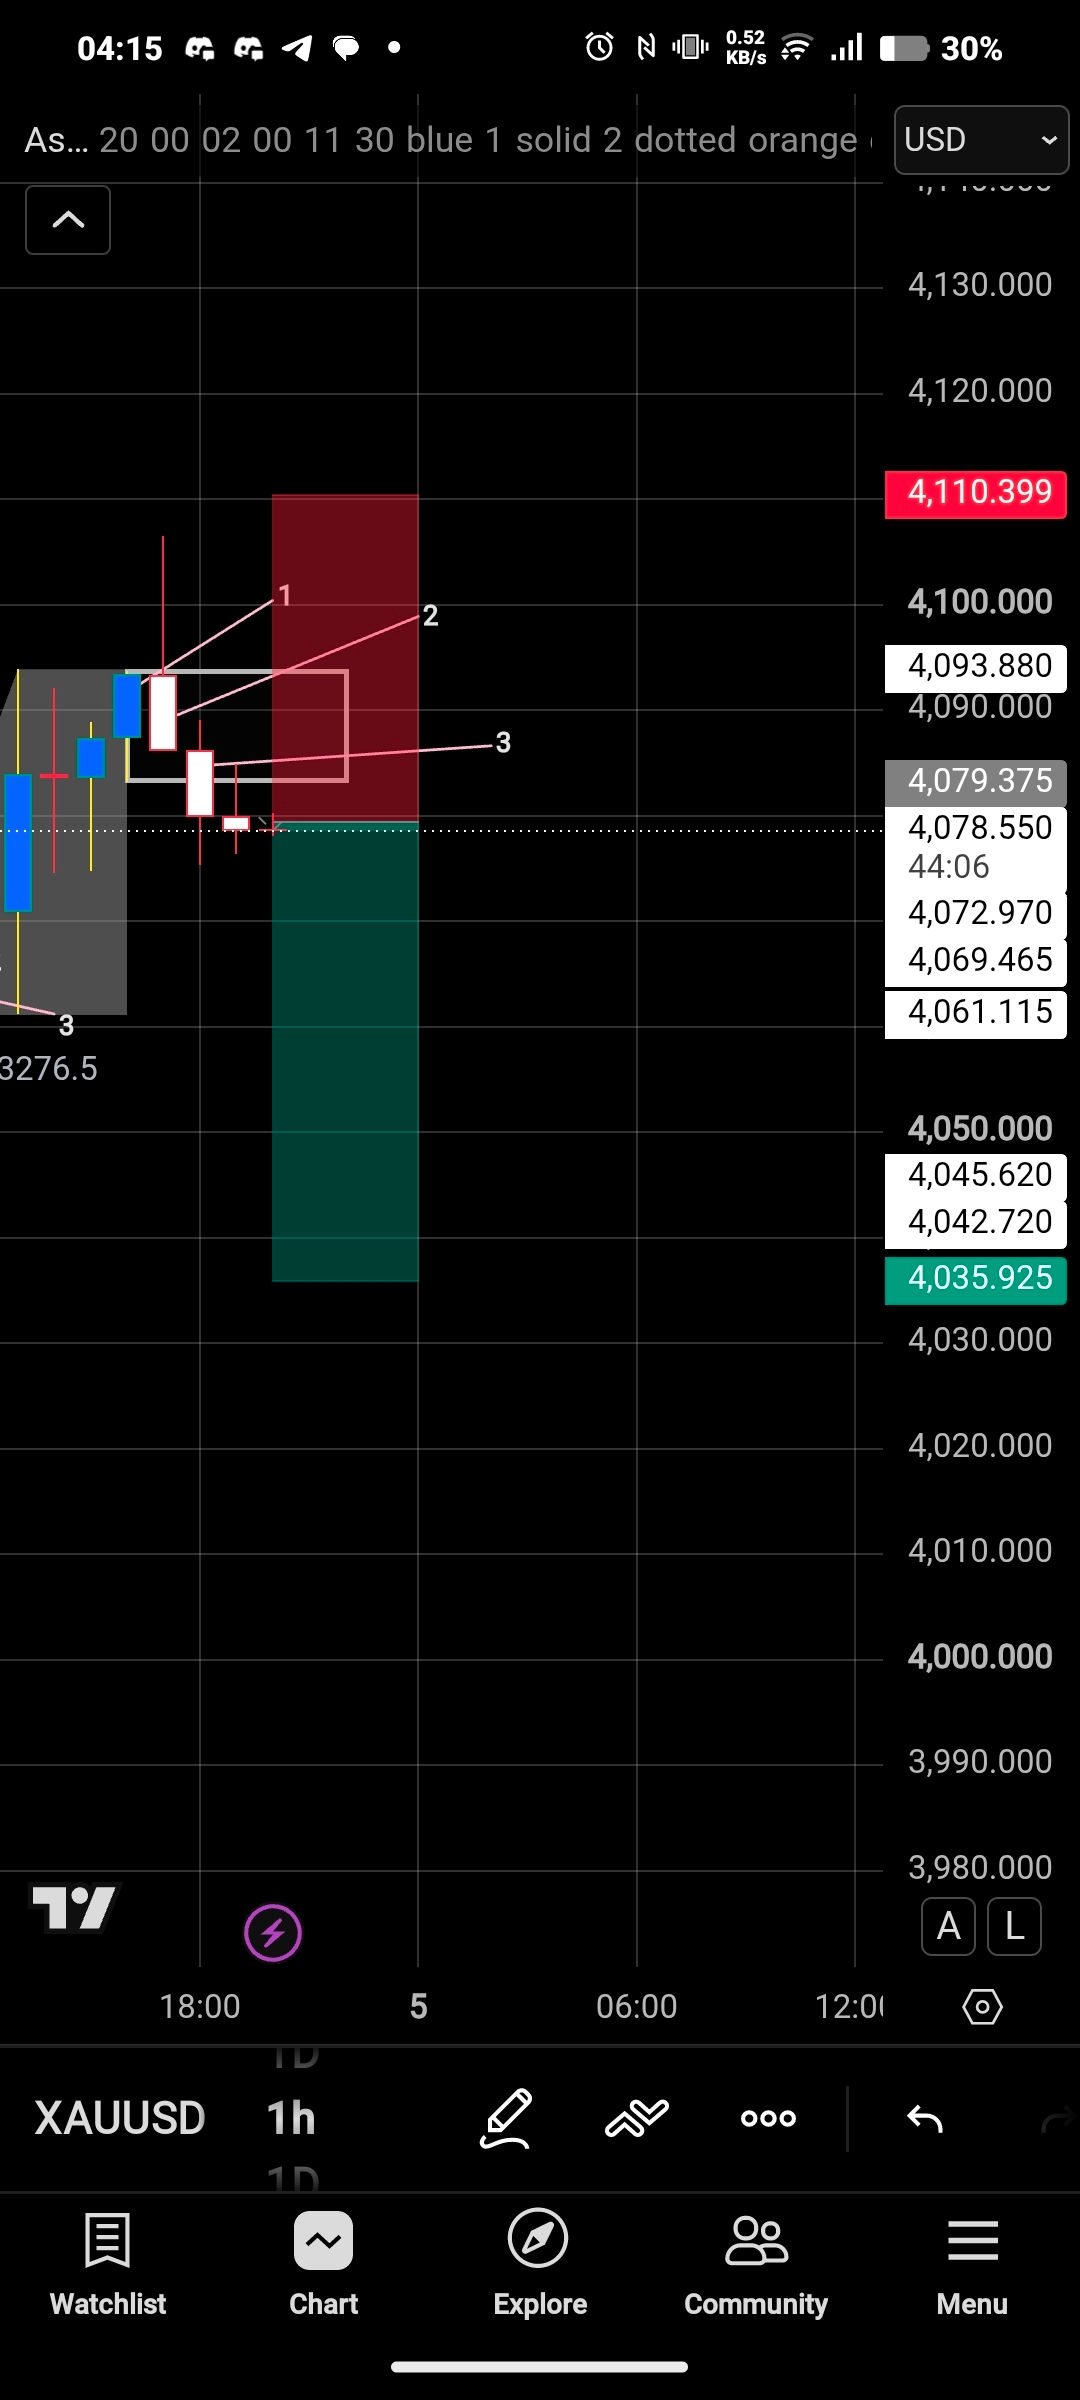
Análise Técnica XAUUSD – Estratégia ORB (1H)
O XAUUSD está mostrando sinais de continuação de queda após rejeitar uma área-chave de resistência. Com base na minha Estratégia de Opening Range Breakout (ORB), os vendedores entraram em cena após uma tentativa fracassada de empurrar o preço para cima, dando aos ursos o controle no curto prazo.
O preço foi rejeitado da zona de resistência de 4.093–4.100, formando um momento de baixa e rompendo abaixo da consolidação recente. Essa rejeição sugere que os compradores estão perdendo força, enquanto os vendedores continuam defendendo as máximas.
📊 Ideia de Trade
Viés: Bearish (Baixista)
Entrada: Por volta de 4.078,50
Stop Loss: 4.110,40 (acima da resistência)
Take Profit: 4.035,90
Risco para Retorno: Aproximadamente 1:1,3
Enquanto o preço permanecer abaixo da zona de resistência, a visão baixista continua válida. Uma ruptura limpa abaixo das mínimas recentes pode acelerar a pressão de venda em direção ao alvo.
⚠️ Invalidção
Se o XAUUSD fechar forte acima de 4.093–4.100, a configuração baixista pode falhar e os compradores podem recuperar o impulso.
💡 Considerações Finais
A paciência é fundamental. Espere por confirmação antes de entrar na operação e sempre gerencie seu risco. Nenhuma configuração é garantida; portanto, proteja seu capital e siga seu plano de trading.
#XAUUSD #Gold #Forex #Trading #PriceAction #ORBStrategy #TechnicalAnalysis #RiskManagement #TradingView
$XAU
{future}(XAUUSDT)
Análise Técnica XAUUSD – Estratégia ORB (1H)
O XAUUSD está mostrando sinais de continuação de queda após rejeitar uma área-chave de resistência. Com base na minha Estratégia de Opening Range Breakout (ORB), os vendedores entraram em cena após uma tentativa fracassada de empurrar o preço para cima, dando aos ursos o controle no curto prazo.
O preço foi rejeitado da zona de resistência de 4.093–4.100, formando um momento de baixa e rompendo abaixo da consolidação recente. Essa rejeição sugere que os compradores estão perdendo força, enquanto os vendedores continuam defendendo as máximas.
📊 Ideia de Trade
Viés: Bearish (Baixista)
Entrada: Por volta de 4.078,50
Stop Loss: 4.110,40 (acima da resistência)
Take Profit: 4.035,90
Risco para Retorno: Aproximadamente 1:1,3
Enquanto o preço permanecer abaixo da zona de resistência, a visão baixista continua válida. Uma ruptura limpa abaixo das mínimas recentes pode acelerar a pressão de venda em direção ao alvo.
⚠️ Invalidção
Se o XAUUSD fechar forte acima de 4.093–4.100, a configuração baixista pode falhar e os compradores podem recuperar o impulso.
💡 Considerações Finais
A paciência é fundamental. Espere por confirmação antes de entrar na operação e sempre gerencie seu risco. Nenhuma configuração é garantida; portanto, proteja seu capital e siga seu plano de trading.
#XAUUSD #Gold #Forex #Trading #PriceAction #ORBStrategy #TechnicalAnalysis #RiskManagement #TradingView
$XAU
O XAUUSD está mostrando sinais de continuação de queda após rejeitar uma área-chave de resistência. Com base na minha Estratégia de Opening Range Breakout (ORB), os vendedores entraram em cena após uma tentativa fracassada de empurrar o preço para cima, dando aos ursos o controle no curto prazo.
O preço foi rejeitado da zona de resistência de 4.093–4.100, formando um momento de baixa e rompendo abaixo da consolidação recente. Essa rejeição sugere que os compradores estão perdendo força, enquanto os vendedores continuam defendendo as máximas.
📊 Ideia de Trade
Viés: Bearish (Baixista)
Entrada: Por volta de 4.078,50
Stop Loss: 4.110,40 (acima da resistência)
Take Profit: 4.035,90
Risco para Retorno: Aproximadamente 1:1,3
Enquanto o preço permanecer abaixo da zona de resistência, a visão baixista continua válida. Uma ruptura limpa abaixo das mínimas recentes pode acelerar a pressão de venda em direção ao alvo.
⚠️ Invalidção
Se o XAUUSD fechar forte acima de 4.093–4.100, a configuração baixista pode falhar e os compradores podem recuperar o impulso.
💡 Considerações Finais
A paciência é fundamental. Espere por confirmação antes de entrar na operação e sempre gerencie seu risco. Nenhuma configuração é garantida; portanto, proteja seu capital e siga seu plano de trading.
#XAUUSD #Gold #Forex #Trading #PriceAction #ORBStrategy #TechnicalAnalysis #RiskManagement #TradingView
$XAU
105
·
--
Análise Técnica XAUUSD – Estratégia ORB
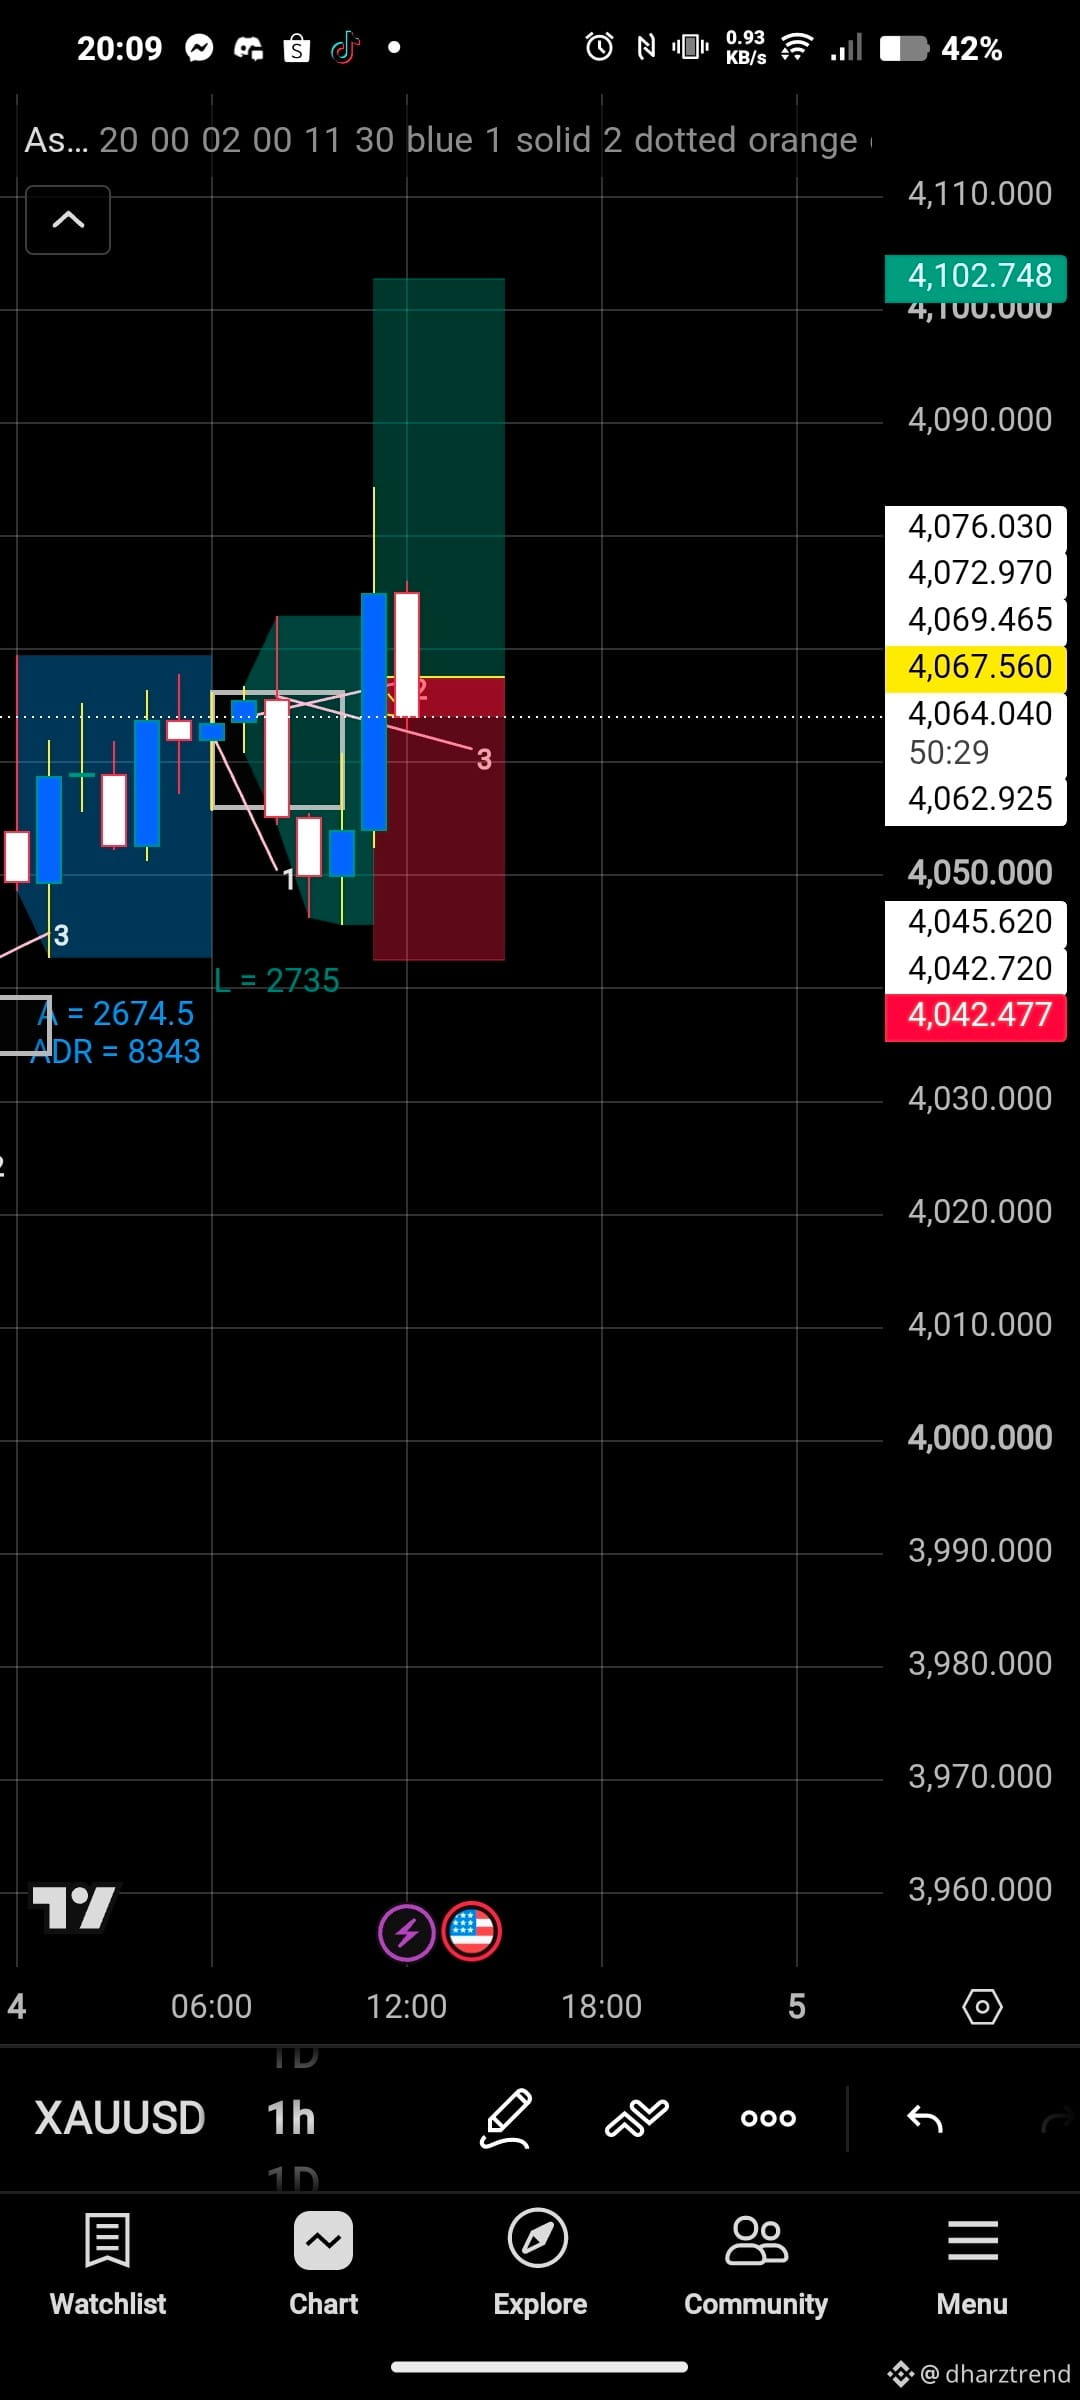
O XAUUSD permanece em alta após uma forte Quebra de Faixa de Abertura (ORB), com os compradores defendendo com sucesso a zona de rompimento apesar de um recuo de curto prazo.
No gráfico de 1 hora, o ouro gerou uma vela de alta impulsiva que rompeu acima da faixa de abertura, confirmando um forte momento de compra. Após atingir novas máximas intradiárias, o preço retraiu de volta em direção à área do rompimento, onde os compradores entraram e impediram uma correção mais profunda.
Este recuo parece ser um reteste saudável, e não uma reversão. Enquanto o preço permanecer acima da zona de suporte do ORB, a estrutura de alta continua intacta e é possível um novo avanço em direção a níveis de resistência mais elevados.
Perspectiva ORB
✅ Viés: Altista
📈 Estrutura de Mercado: Máximas mais altas e mínimas mais altas permanecem intactas.
🔑 Suporte-chave: Zona de rompimento do ORB na faixa de 4064–4068.
🎯 Alvo Altista: 4100–4105 se os compradores recuperarem o impulso.
⚠️ Invalidação: Uma forte vela de 1H fechando abaixo do suporte do ORB pode mudar o momentum para baixo.
Plano de Trading
A paciência é importante aqui. Em vez de perseguir o rompimento, aguarde a confirmação de que os compradores estão defendendo a área do reteste. Se ocorrer ação de preço altista no suporte, isso pode oferecer uma configuração de continuação com maior probabilidade. Se o suporte falhar, evite forçar posições compradas e aguarde o surgimento de uma nova estrutura de mercado.
Aviso: Esta análise é apenas para fins educacionais e não é aconselhamento financeiro. Sempre gerencie seu risco e negocie de acordo com seu próprio plano.
$XAU
{future}(XAUUSDT)
Análise Técnica XAUUSD – Estratégia ORB
O XAUUSD permanece em alta após uma forte Quebra de Faixa de Abertura (ORB), com os compradores defendendo com sucesso a zona de rompimento apesar de um recuo de curto prazo.
No gráfico de 1 hora, o ouro gerou uma vela de alta impulsiva que rompeu acima da faixa de abertura, confirmando um forte momento de compra. Após atingir novas máximas intradiárias, o preço retraiu de volta em direção à área do rompimento, onde os compradores entraram e impediram uma correção mais profunda.
Este recuo parece ser um reteste saudável, e não uma reversão. Enquanto o preço permanecer acima da zona de suporte do ORB, a estrutura de alta continua intacta e é possível um novo avanço em direção a níveis de resistência mais elevados.
Perspectiva ORB
✅ Viés: Altista
📈 Estrutura de Mercado: Máximas mais altas e mínimas mais altas permanecem intactas.
🔑 Suporte-chave: Zona de rompimento do ORB na faixa de 4064–4068.
🎯 Alvo Altista: 4100–4105 se os compradores recuperarem o impulso.
⚠️ Invalidação: Uma forte vela de 1H fechando abaixo do suporte do ORB pode mudar o momentum para baixo.
Plano de Trading
A paciência é importante aqui. Em vez de perseguir o rompimento, aguarde a confirmação de que os compradores estão defendendo a área do reteste. Se ocorrer ação de preço altista no suporte, isso pode oferecer uma configuração de continuação com maior probabilidade. Se o suporte falhar, evite forçar posições compradas e aguarde o surgimento de uma nova estrutura de mercado.
Aviso: Esta análise é apenas para fins educacionais e não é aconselhamento financeiro. Sempre gerencie seu risco e negocie de acordo com seu próprio plano.
$XAU
O XAUUSD permanece em alta após uma forte Quebra de Faixa de Abertura (ORB), com os compradores defendendo com sucesso a zona de rompimento apesar de um recuo de curto prazo.
No gráfico de 1 hora, o ouro gerou uma vela de alta impulsiva que rompeu acima da faixa de abertura, confirmando um forte momento de compra. Após atingir novas máximas intradiárias, o preço retraiu de volta em direção à área do rompimento, onde os compradores entraram e impediram uma correção mais profunda.
Este recuo parece ser um reteste saudável, e não uma reversão. Enquanto o preço permanecer acima da zona de suporte do ORB, a estrutura de alta continua intacta e é possível um novo avanço em direção a níveis de resistência mais elevados.
Perspectiva ORB
✅ Viés: Altista
📈 Estrutura de Mercado: Máximas mais altas e mínimas mais altas permanecem intactas.
🔑 Suporte-chave: Zona de rompimento do ORB na faixa de 4064–4068.
🎯 Alvo Altista: 4100–4105 se os compradores recuperarem o impulso.
⚠️ Invalidação: Uma forte vela de 1H fechando abaixo do suporte do ORB pode mudar o momentum para baixo.
Plano de Trading
A paciência é importante aqui. Em vez de perseguir o rompimento, aguarde a confirmação de que os compradores estão defendendo a área do reteste. Se ocorrer ação de preço altista no suporte, isso pode oferecer uma configuração de continuação com maior probabilidade. Se o suporte falhar, evite forçar posições compradas e aguarde o surgimento de uma nova estrutura de mercado.
Aviso: Esta análise é apenas para fins educacionais e não é aconselhamento financeiro. Sempre gerencie seu risco e negocie de acordo com seu próprio plano.
$XAU
119
·
--
Artigo
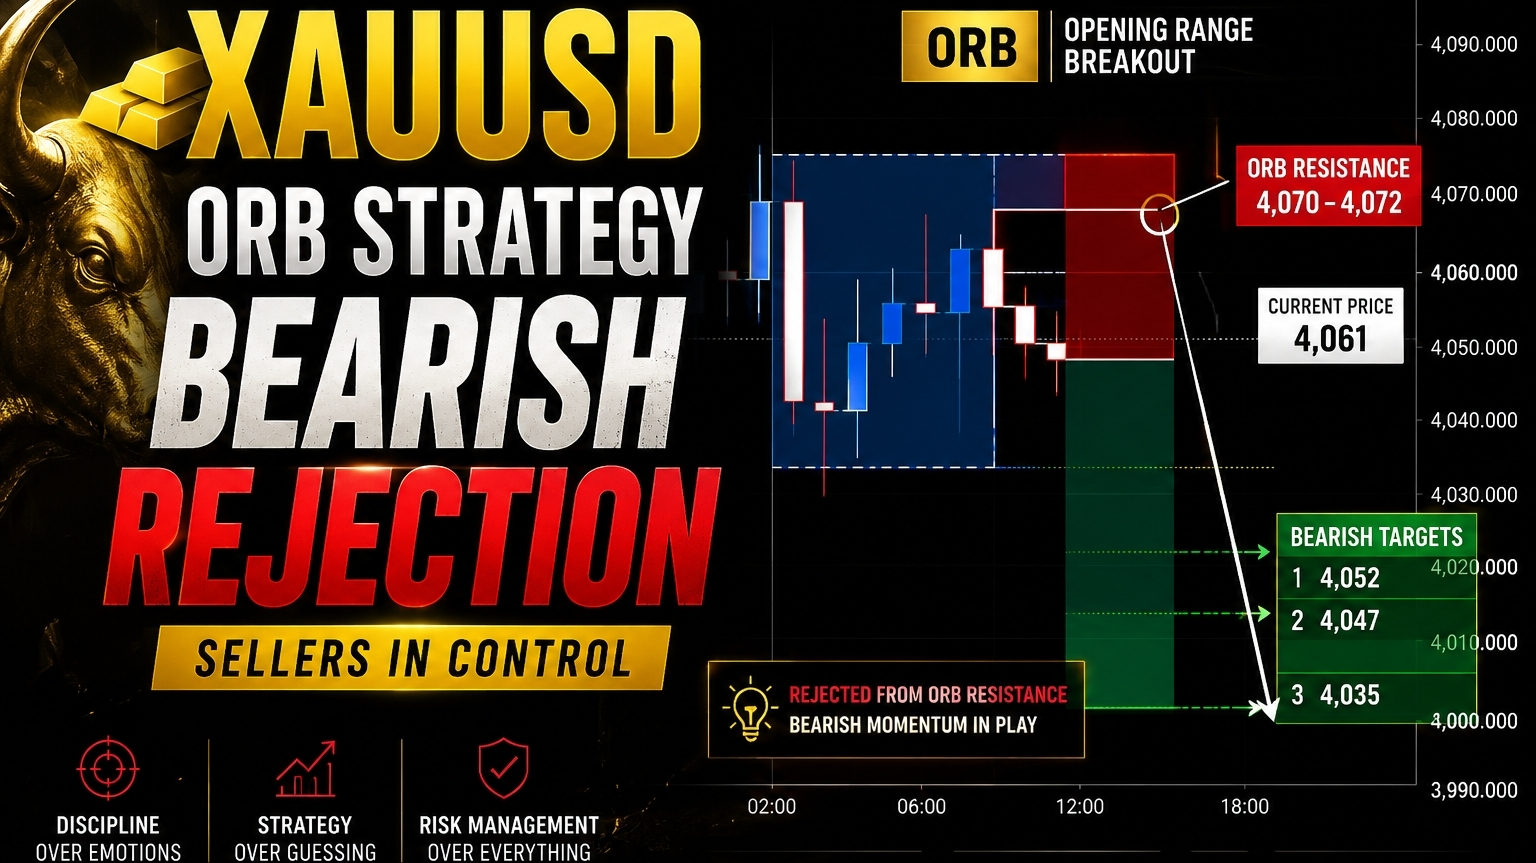
Estratégia de ORB no XAUUSD: Rejeição Baixista na Faixa de AberturaO mais recente gráfico de 1 hora do XAUUSD apresenta uma oportunidade baixista clara usando minha estratégia de ORB (Opening Range Breakout). Depois que o preço testou a resistência da faixa de abertura, os compradores não conseguiram manter o impulso, levando a uma forte rejeição e a uma possível continuação para a desvantagem.
Análise de ORB
Minha estratégia de ORB identificou a faixa de abertura como uma zona-chave de decisão. Em vez de romper para cima, o preço foi rejeitado na resistência do ORB, confirmando que os vendedores haviam assumido o controle. Essa rejeição aumenta a probabilidade de uma continuação baixista.
Estratégia de ORB no XAUUSD: Rejeição Baixista na Faixa de Abertura
O mais recente gráfico de 1 hora do XAUUSD apresenta uma oportunidade baixista clara usando minha estratégia de ORB (Opening Range Breakout). Depois que o preço testou a resistência da faixa de abertura, os compradores não conseguiram manter o impulso, levando a uma forte rejeição e a uma possível continuação para a desvantagem.
Análise de ORB
Minha estratégia de ORB identificou a faixa de abertura como uma zona-chave de decisão. Em vez de romper para cima, o preço foi rejeitado na resistência do ORB, confirmando que os vendedores haviam assumido o controle. Essa rejeição aumenta a probabilidade de uma continuação baixista.
Análise de ORB
Minha estratégia de ORB identificou a faixa de abertura como uma zona-chave de decisão. Em vez de romper para cima, o preço foi rejeitado na resistência do ORB, confirmando que os vendedores haviam assumido o controle. Essa rejeição aumenta a probabilidade de uma continuação baixista.
74
·
--
Artigo
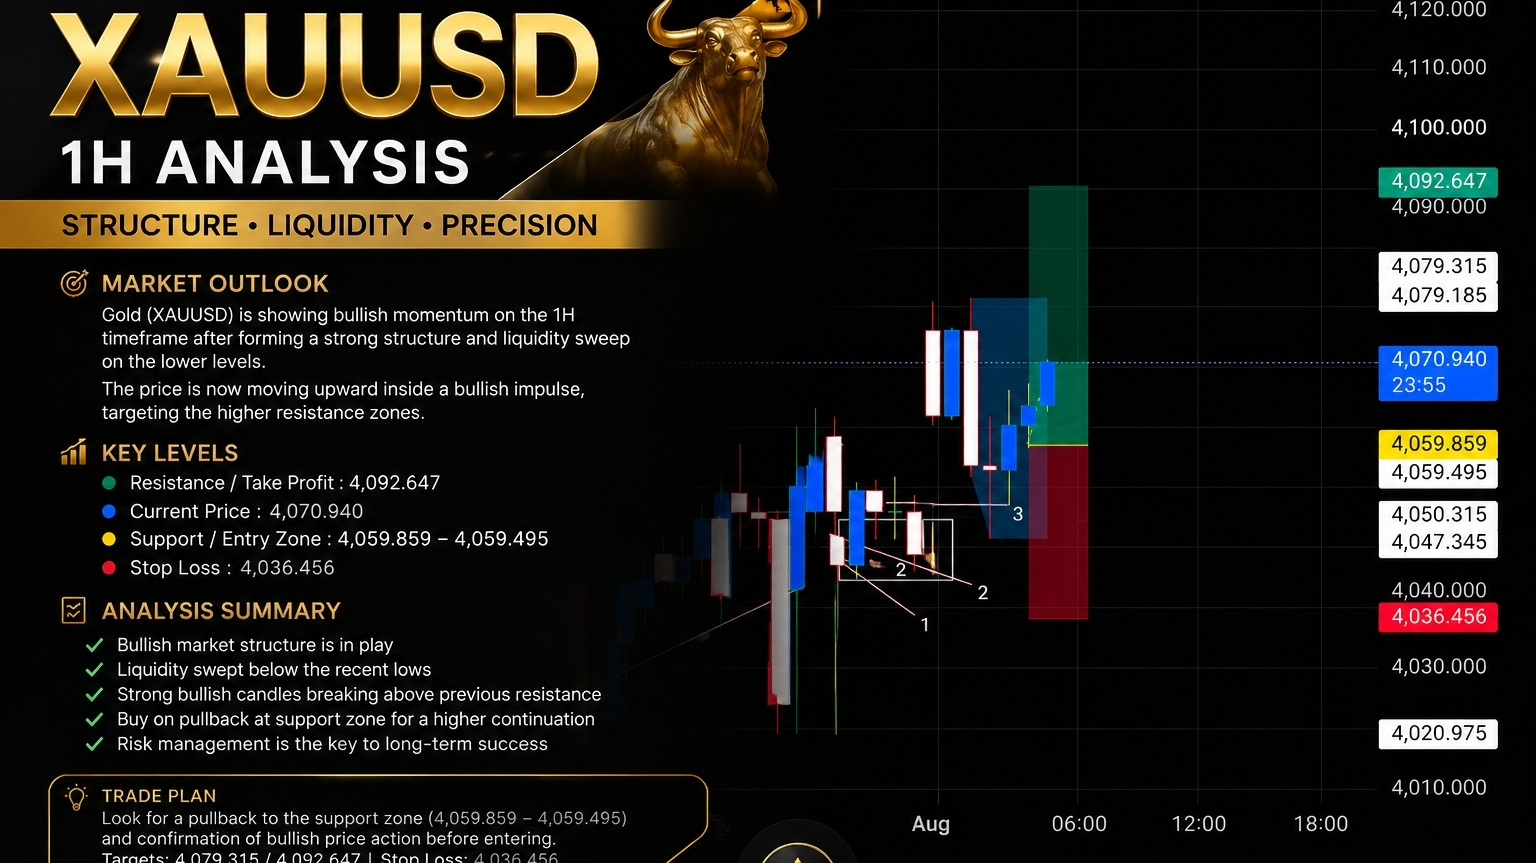
Análise XAUUSD 1H – Continuação Altista Após Varredura de LiquidezO ouro (XAUUSD) está mostrando um novo impulso de alta no período de 1 hora após varrer a liquidez abaixo das mínimas recentes e recuperar o suporte. As fortes velas de alta sugerem que os compradores estão de volta ao controle, aumentando a probabilidade de continuação em direção a resistências mais elevadas.
A estrutura atual permanece altista enquanto o preço estiver acima da zona de suporte recente em torno de 4059–4060. Essa área pode oferecer uma entrada de pullback favorável se os compradores a defenderem.
Níveis-chave
Viés: Altista
Suporte: 4059,50–4060,00
Análise XAUUSD 1H – Continuação Altista Após Varredura de Liquidez
O ouro (XAUUSD) está mostrando um novo impulso de alta no período de 1 hora após varrer a liquidez abaixo das mínimas recentes e recuperar o suporte. As fortes velas de alta sugerem que os compradores estão de volta ao controle, aumentando a probabilidade de continuação em direção a resistências mais elevadas.
A estrutura atual permanece altista enquanto o preço estiver acima da zona de suporte recente em torno de 4059–4060. Essa área pode oferecer uma entrada de pullback favorável se os compradores a defenderem.
Níveis-chave
Viés: Altista
Suporte: 4059,50–4060,00
A estrutura atual permanece altista enquanto o preço estiver acima da zona de suporte recente em torno de 4059–4060. Essa área pode oferecer uma entrada de pullback favorável se os compradores a defenderem.
Níveis-chave
Viés: Altista
Suporte: 4059,50–4060,00
100
·
--
🚀 Quer pegar a próxima configuração de Ouro e Bitcoin antes do movimento?
Estou preparando novas ideias de setup de trade para XAUUSD (Ouro) e BTCUSD (Bitcoin) que vou publicar mais tarde hoje, com base em análise técnica e na minha estratégia ORB.
📈 Se você gosta de análises de gráfico bem limpas e conteúdo educacional de trading, siga-me agora para não perder a próxima atualização.
⚠️ Este conteúdo é apenas para fins educacionais e não é aconselhamento financeiro. Gerencie sempre seu risco.$BTC
{future}(BTCUSDT)
$XAU
{future}(XAUUSDT)
🚀 Quer pegar a próxima configuração de Ouro e Bitcoin antes do movimento?
Estou preparando novas ideias de setup de trade para XAUUSD (Ouro) e BTCUSD (Bitcoin) que vou publicar mais tarde hoje, com base em análise técnica e na minha estratégia ORB.
📈 Se você gosta de análises de gráfico bem limpas e conteúdo educacional de trading, siga-me agora para não perder a próxima atualização.
⚠️ Este conteúdo é apenas para fins educacionais e não é aconselhamento financeiro. Gerencie sempre seu risco.$BTC
$XAU
Estou preparando novas ideias de setup de trade para XAUUSD (Ouro) e BTCUSD (Bitcoin) que vou publicar mais tarde hoje, com base em análise técnica e na minha estratégia ORB.
📈 Se você gosta de análises de gráfico bem limpas e conteúdo educacional de trading, siga-me agora para não perder a próxima atualização.
⚠️ Este conteúdo é apenas para fins educacionais e não é aconselhamento financeiro. Gerencie sempre seu risco.$BTC
$XAU

97
·
--
Artigo
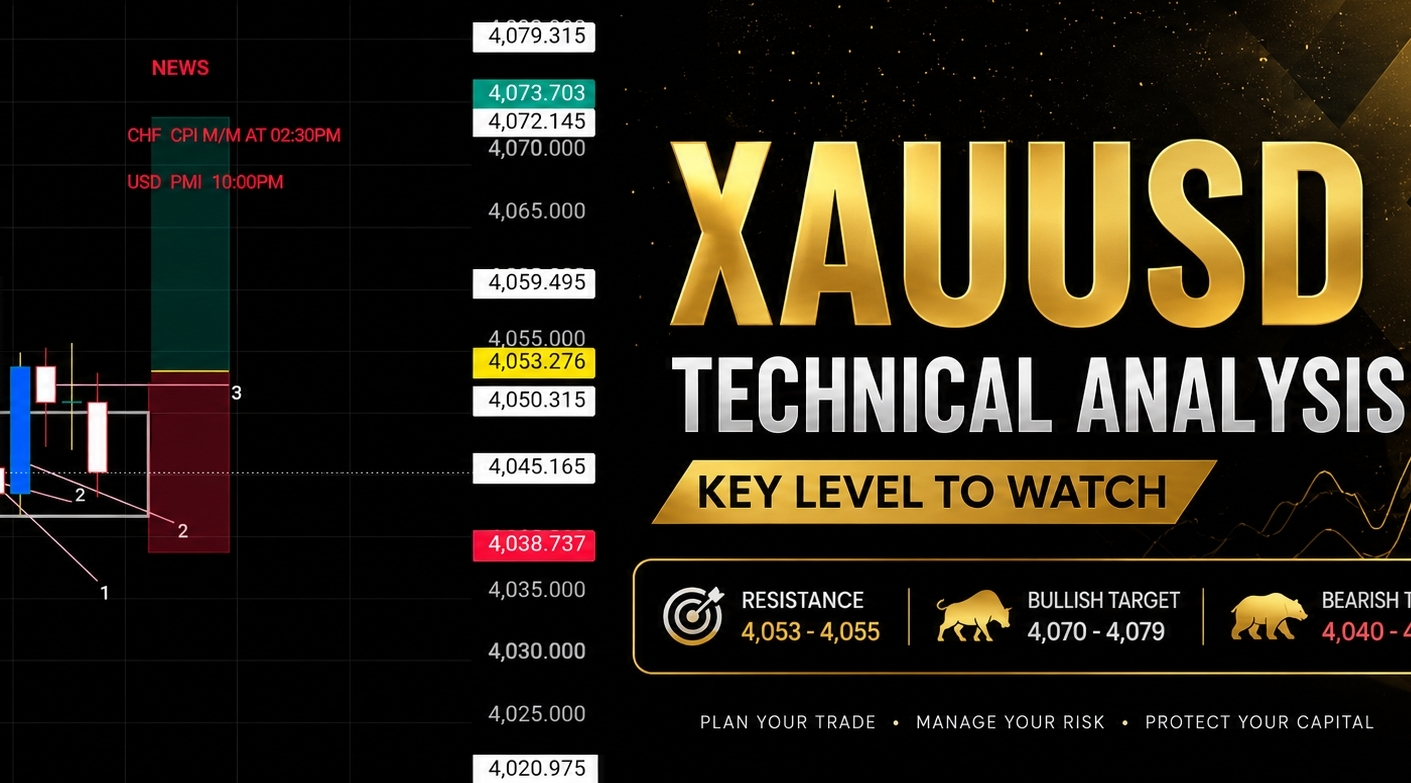
Análise Técnica do XAUUSD: O Ouro Vai Romper Mais Alto ou Rejeitar?O ouro (XAUUSD) está atualmente sendo negociado dentro de uma zona-chave de resistência após uma forte recuperação. No timeframe de 1 hora, o preço está demonstrando hesitação, pois os vendedores defendem a região em torno de 4050–4055, enquanto os compradores continuam tentando manter o impulso de alta.
A partir deste gráfico, o mercado parece estar consolidando logo abaixo da resistência. Se os compradores conseguirem fechar uma forte vela de alta acima desse nível, os próximos alvos de alta poderiam estar por volta de 4070 e 4079. No entanto, se o preço falhar em romper e formar confirmação de baixa, um recuo em direção a 4040 ou mais baixo se torna mais provável.
Análise Técnica do XAUUSD: O Ouro Vai Romper Mais Alto ou Rejeitar?
O ouro (XAUUSD) está atualmente sendo negociado dentro de uma zona-chave de resistência após uma forte recuperação. No timeframe de 1 hora, o preço está demonstrando hesitação, pois os vendedores defendem a região em torno de 4050–4055, enquanto os compradores continuam tentando manter o impulso de alta.
A partir deste gráfico, o mercado parece estar consolidando logo abaixo da resistência. Se os compradores conseguirem fechar uma forte vela de alta acima desse nível, os próximos alvos de alta poderiam estar por volta de 4070 e 4079. No entanto, se o preço falhar em romper e formar confirmação de baixa, um recuo em direção a 4040 ou mais baixo se torna mais provável.
A partir deste gráfico, o mercado parece estar consolidando logo abaixo da resistência. Se os compradores conseguirem fechar uma forte vela de alta acima desse nível, os próximos alvos de alta poderiam estar por volta de 4070 e 4079. No entanto, se o preço falhar em romper e formar confirmação de baixa, um recuo em direção a 4040 ou mais baixo se torna mais provável.
115
·
--
Artigo
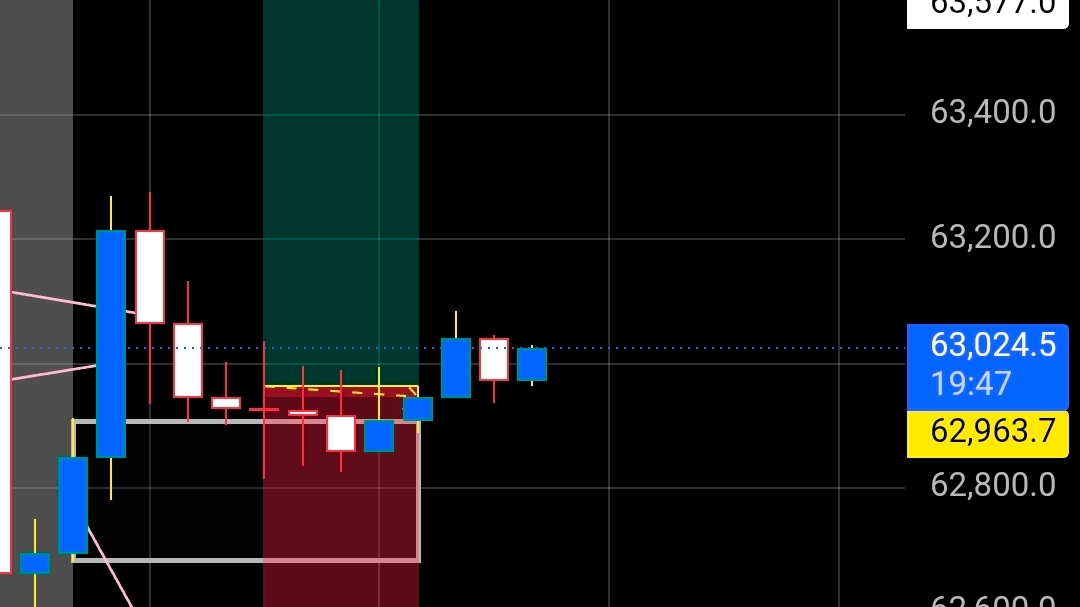
Análise de ORB BTCUSD 1H: Compradores Defendem a Zona de RompimentoBTCUSD está mostrando sinais de força depois de respeitar a área de suporte do Opening Range Breakout (ORB) no gráfico de 1 hora. Em vez de romper para baixo, o preço encontrou compradores perto da faixa inferior e começou a imprimir candles mais altos, sugerindo que um possível momentum comprador pode estar se formando.
A estrutura atual indica que o nível de rompimento está atuando como suporte. Enquanto o preço permanecer acima dessa zona, os compradores ainda têm a oportunidade de impulsionar o BTC em direção aos próximos níveis de resistência.
Principais Observações
✅ O suporte do ORB permanece intacto.
Análise de ORB BTCUSD 1H: Compradores Defendem a Zona de Rompimento
BTCUSD está mostrando sinais de força depois de respeitar a área de suporte do Opening Range Breakout (ORB) no gráfico de 1 hora. Em vez de romper para baixo, o preço encontrou compradores perto da faixa inferior e começou a imprimir candles mais altos, sugerindo que um possível momentum comprador pode estar se formando.
A estrutura atual indica que o nível de rompimento está atuando como suporte. Enquanto o preço permanecer acima dessa zona, os compradores ainda têm a oportunidade de impulsionar o BTC em direção aos próximos níveis de resistência.
Principais Observações
✅ O suporte do ORB permanece intacto.
A estrutura atual indica que o nível de rompimento está atuando como suporte. Enquanto o preço permanecer acima dessa zona, os compradores ainda têm a oportunidade de impulsionar o BTC em direção aos próximos níveis de resistência.
Principais Observações
✅ O suporte do ORB permanece intacto.
66
·
--
Assista como BTCUSD respeita a zona de Quebra da Faixa de Abertura (Opening Range Breakout - ORB) no timeframe de 1 hora. Este vídeo analisa a ação de preço atual, os principais suportes e uma possível continuação altista usando a estratégia ORB.$BTC
Assista como BTCUSD respeita a zona de Quebra da Faixa de Abertura (Opening Range Breakout - ORB) no timeframe de 1 hora. Este vídeo analisa a ação de preço atual, os principais suportes e uma possível continuação altista usando a estratégia ORB.$BTC
3
1
252
·
--
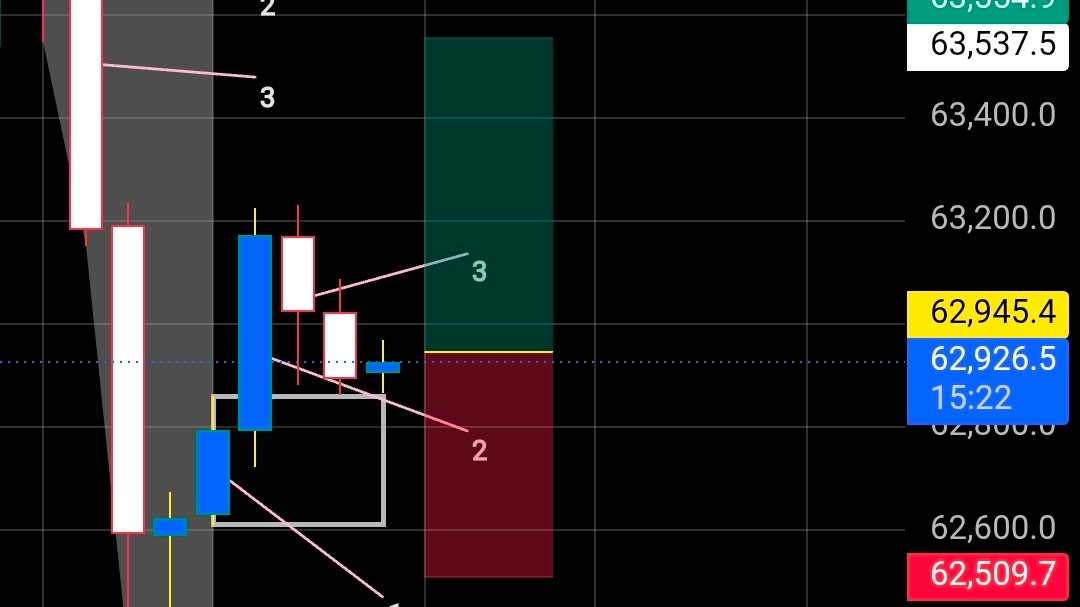
Ideia de Trade
Viés: Touro 📈
Entrada: Por volta de 62.926
Stop Loss: 62.510
Take Profit: 63.555
Gestão de Risco: Aguarde um fechamento de candle de alta confirmado antes de entrar. Evite perseguir o preço e siga sempre seu plano de trading.
Ideia de Trade
Viés: Touro 📈
Entrada: Por volta de 62.926
Stop Loss: 62.510
Take Profit: 63.555
Gestão de Risco: Aguarde um fechamento de candle de alta confirmado antes de entrar. Evite perseguir o preço e siga sempre seu plano de trading.
Viés: Touro 📈
Entrada: Por volta de 62.926
Stop Loss: 62.510
Take Profit: 63.555
Gestão de Risco: Aguarde um fechamento de candle de alta confirmado antes de entrar. Evite perseguir o preço e siga sempre seu plano de trading.
26
·
--
Artigo
Análise de ORB de BTCUSD em 1H – Configuração de Reversão de AltaO BTCUSD está mostrando sinais de uma reversão de alta no timeframe de 1 hora. Após uma forte liquidação, os compradores entraram para defender a zona de suporte, e o preço começa a formar mínimas mais altas. Isso sugere que a pressão vendedora está enfraquecendo e que uma possível recuperação pode estar em andamento.
Com a sua estratégia ORB, esta configuração representa uma possível oportunidade de compra (long) se os compradores mantiverem o controle e o preço continuar sustentando acima do nível de rompimento. A confirmação é fundamental—esperar por um impulso de alta pode aumentar a probabilidade de uma negociação bem-sucedida.
Análise de ORB de BTCUSD em 1H – Configuração de Reversão de Alta
O BTCUSD está mostrando sinais de uma reversão de alta no timeframe de 1 hora. Após uma forte liquidação, os compradores entraram para defender a zona de suporte, e o preço começa a formar mínimas mais altas. Isso sugere que a pressão vendedora está enfraquecendo e que uma possível recuperação pode estar em andamento.
Com a sua estratégia ORB, esta configuração representa uma possível oportunidade de compra (long) se os compradores mantiverem o controle e o preço continuar sustentando acima do nível de rompimento. A confirmação é fundamental—esperar por um impulso de alta pode aumentar a probabilidade de uma negociação bem-sucedida.
Com a sua estratégia ORB, esta configuração representa uma possível oportunidade de compra (long) se os compradores mantiverem o controle e o preço continuar sustentando acima do nível de rompimento. A confirmação é fundamental—esperar por um impulso de alta pode aumentar a probabilidade de uma negociação bem-sucedida.
15
·
--
Artigo
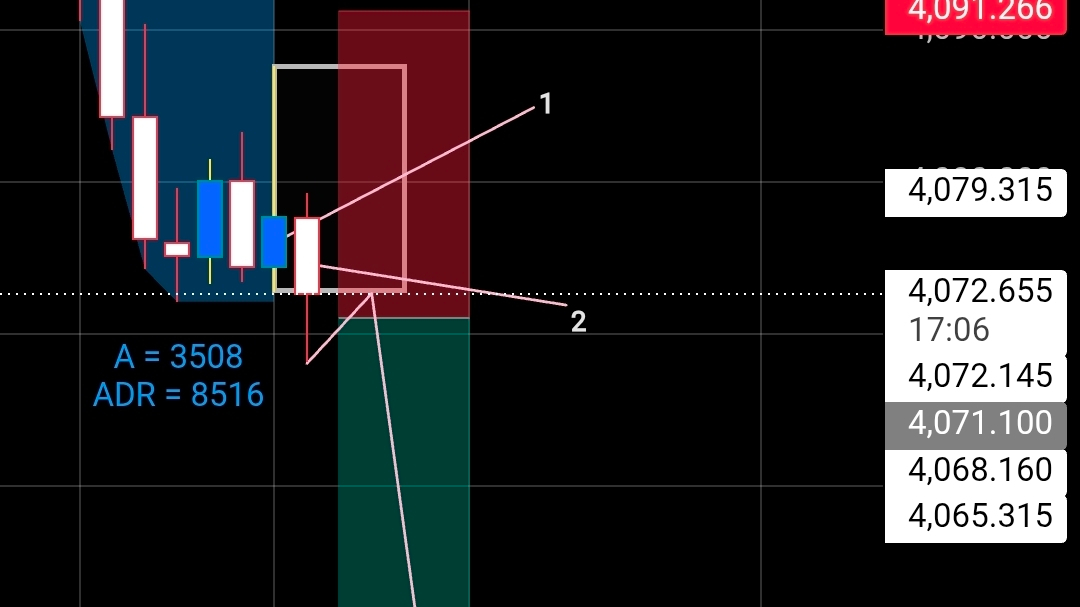
📉 Estratégia de ORB no XAUUSD – Setup de Rejeição BaixistaO ouro respeitou a resistência da ORB após falhar em romper acima da faixa de abertura. Seguindo o forte momentum baixista, o preço tentou um pequeno pullback, mas foi rapidamente rejeitado, confirmando que os vendedores continuavam no controle.
Minha entrada foi baseada na vela de rejeição na resistência da ORB, alinhando com a estrutura geral de mercado baixista. Em vez de correr atrás do primeiro movimento de queda, esperei pacientemente por confirmação antes de entrar na operação.
🎯 Plano de Trade:
Viés: Baixista
Entrada: Rejeição na resistência da ORB
📉 Estratégia de ORB no XAUUSD – Setup de Rejeição Baixista
O ouro respeitou a resistência da ORB após falhar em romper acima da faixa de abertura. Seguindo o forte momentum baixista, o preço tentou um pequeno pullback, mas foi rapidamente rejeitado, confirmando que os vendedores continuavam no controle.
Minha entrada foi baseada na vela de rejeição na resistência da ORB, alinhando com a estrutura geral de mercado baixista. Em vez de correr atrás do primeiro movimento de queda, esperei pacientemente por confirmação antes de entrar na operação.
🎯 Plano de Trade:
Viés: Baixista
Entrada: Rejeição na resistência da ORB
Minha entrada foi baseada na vela de rejeição na resistência da ORB, alinhando com a estrutura geral de mercado baixista. Em vez de correr atrás do primeiro movimento de queda, esperei pacientemente por confirmação antes de entrar na operação.
🎯 Plano de Trade:
Viés: Baixista
Entrada: Rejeição na resistência da ORB
45
·
--
Trading não é sobre vencer cada trade. É sobre seguir seu plano com consistência. Uma configuração de qualidade é melhor do que dez entradas aleatórias."$BTC $BABY
Trading não é sobre vencer cada trade. É sobre seguir seu plano com consistência. Uma configuração de qualidade é melhor do que dez entradas aleatórias."$BTC $BABY
86
·
--
Artigo
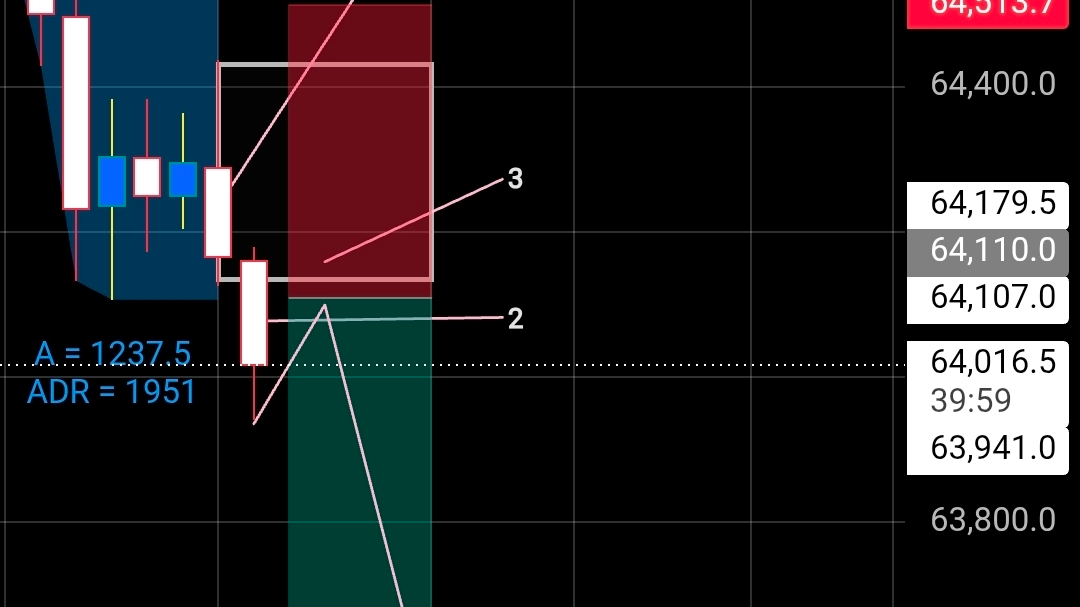
Configuração de Rejeição do ORB BTCUSD 1H – Continuação de BaixaO mercado rejeitou a Faixa de Abertura (ORB) depois de não conseguir recuperar uma resistência-chave, dando aos vendedores o controle da sessão. Em vez de correr atrás do movimento inicial, a paciência permitiu uma entrada de maior probabilidade quando o preço confirmou a fraqueza.
Nesta configuração, a rejeição da zona de resistência do ORB se alinhou com o momentum de baixa, tornando-a uma oportunidade de short limpa. O stop loss foi colocado acima da área de rejeição para se proteger contra uma falsa ruptura, enquanto o take-profit mirou o próximo nível principal de suporte, oferecendo uma relação risco-recompensa favorável.
Configuração de Rejeição do ORB BTCUSD 1H – Continuação de Baixa
O mercado rejeitou a Faixa de Abertura (ORB) depois de não conseguir recuperar uma resistência-chave, dando aos vendedores o controle da sessão. Em vez de correr atrás do movimento inicial, a paciência permitiu uma entrada de maior probabilidade quando o preço confirmou a fraqueza.
Nesta configuração, a rejeição da zona de resistência do ORB se alinhou com o momentum de baixa, tornando-a uma oportunidade de short limpa. O stop loss foi colocado acima da área de rejeição para se proteger contra uma falsa ruptura, enquanto o take-profit mirou o próximo nível principal de suporte, oferecendo uma relação risco-recompensa favorável.
Nesta configuração, a rejeição da zona de resistência do ORB se alinhou com o momentum de baixa, tornando-a uma oportunidade de short limpa. O stop loss foi colocado acima da área de rejeição para se proteger contra uma falsa ruptura, enquanto o take-profit mirou o próximo nível principal de suporte, oferecendo uma relação risco-recompensa favorável.
2
1
512
Inicia sessão para explorar mais conteúdos
Junta-te a utilizadores de criptomoedas de todo o mundo na Binance Square
⚡️ Obtém informações úteis e recentes sobre criptomoedas.
💬 Com a confiança da maior exchange de criptomoedas do mundo.
👍 Descobre perspetivas reais de criadores verificados.
E-mail/Número de telefone
Tópicos em Tendência
BitcoinClears$85200
5,955 visualizações
164 a discutir
Recebemos o movimento, e $BTC está exatamente onde estava antes dos dados. É assim que a paciência real para uma operação funciona.
Os dados chegaram misturados, mas com alguns números importantes. A variação do emprego não-agrícola (ADP) veio em 90K contra 73K previstos, enquanto o núcleo do PCE veio em 0,2% contra 0,3% esperados. O PIB final também veio mais forte, em 2,2% contra 1,5% previsto, enquanto os gastos pessoais vieram em 0,9% contra 0,8% esperados. Ao mesmo tempo, a renda pessoal ficou abaixo do esperado, em 0,2% contra 0,5% previsto.
O BTC inicialmente disparou para US$ 85.600 e agora voltou para onde precisava estar. Ainda estou de olho nas faixas mais baixas, em US$ 82.759 e na liquidez de US$ 80.000, porque a liquidez acima já foi concluída, sem volta.
Tivemos uma sessão ao vivo durante os dados e, durante essa sessão, vimos o mercado em US$ 83.800, depois US$ 85.600, e então voltando para cerca de US$ 83.000 — e ainda assim não entramos em uma operação.
É isso que é paciência.
Não dá para forçar uma entrada quando o mercado não tem uma direção clara. A mesma faixa ainda está em foco, e vamos esperar o mercado nos dar o setup.
Me digam, pessoal, como foi a sessão? E devemos ter mais sessões regulares com nossos membros respeitados para conseguirmos ter discussões adequadas sobre o mercado?
#BitcoinClears$85200 #AltcoinSeasonIndexHoldsAbove60For5Days #USADPAdds90000JobsInSeptember #BitcoinSlipsBelow$84000 #SECToClarifyOnChainFundraisingRules
Crypto_LUX
·24 gostos
·12.3k visualizações
AltcoinSeasonIndexHoldsAbove60For5Days
33,979 visualizações
945 a discutir
USADPAdds90000JobsInSeptember
15,089 visualizações
537 a discutir