

ScalpingX TG Channel
4k Publicações

ScalpingX TG Channel
Denunciar
Bloquear Utilizador
1 scalper with unconventional mindset, loves big risks with big profits. Don't ask about the leverage I use, it's always maximum!
0 A seguir
11 Seguidores
9 Gostaram
Publicações
Ver tradução
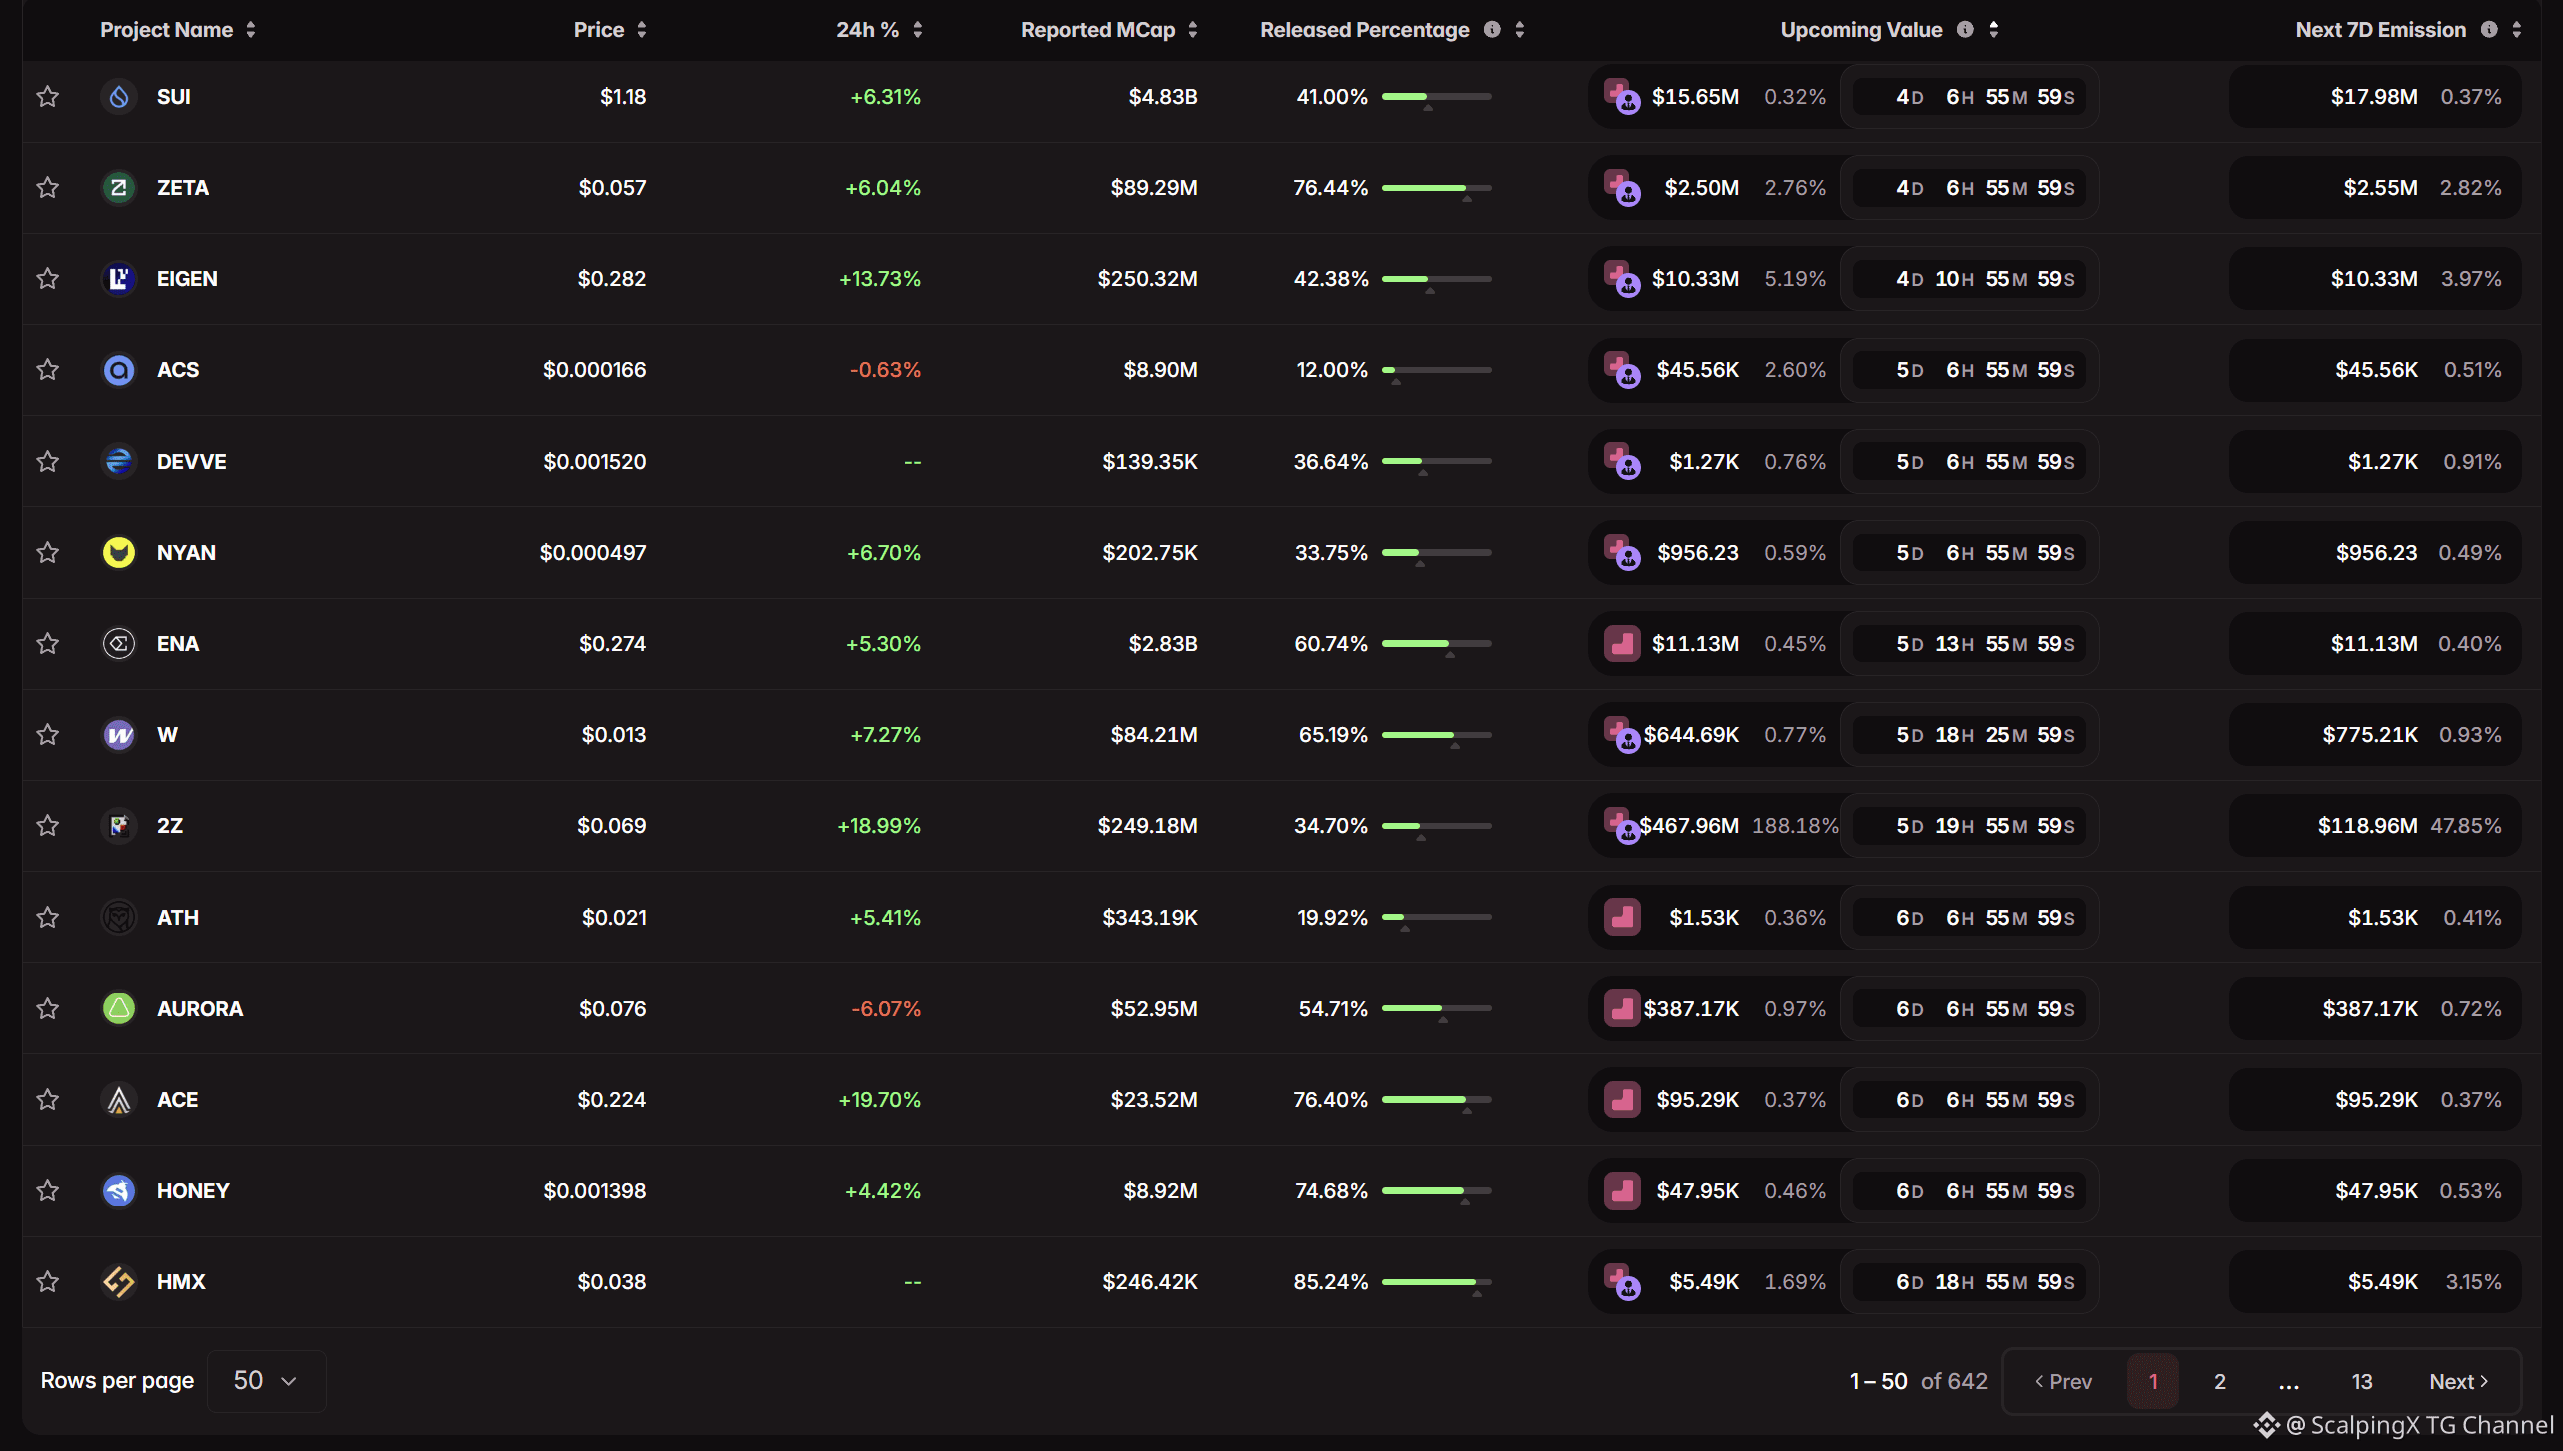
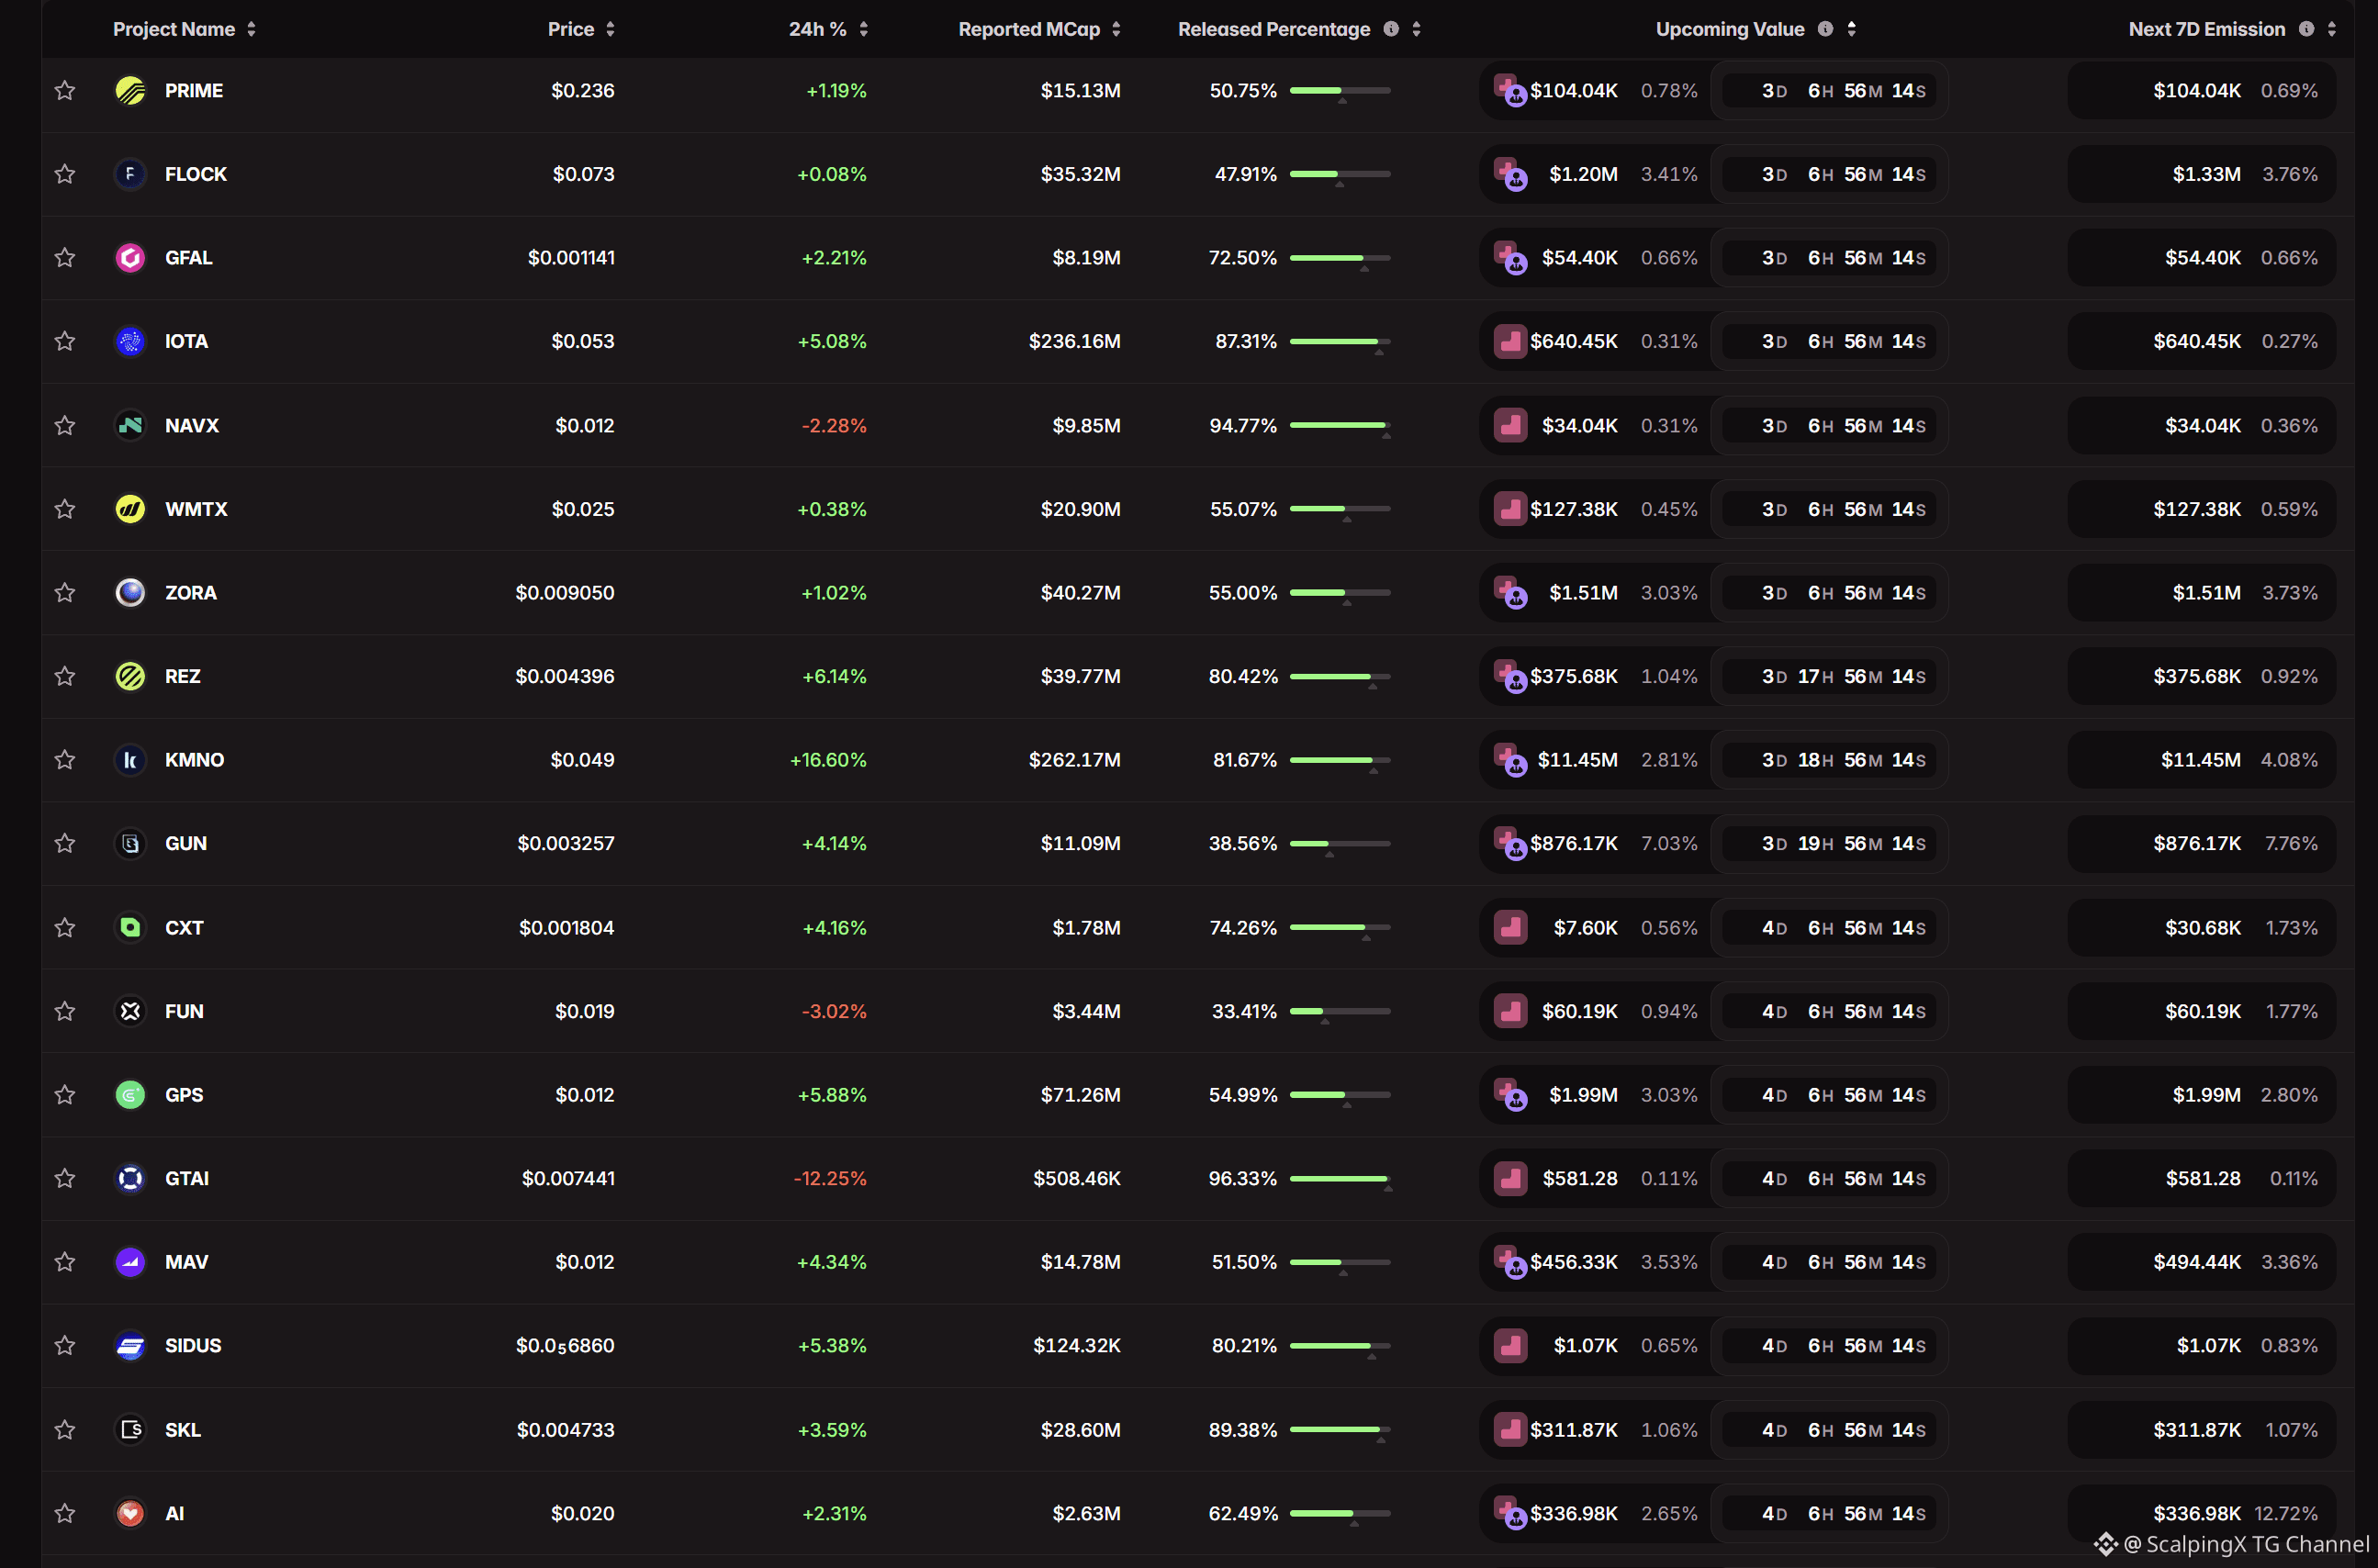
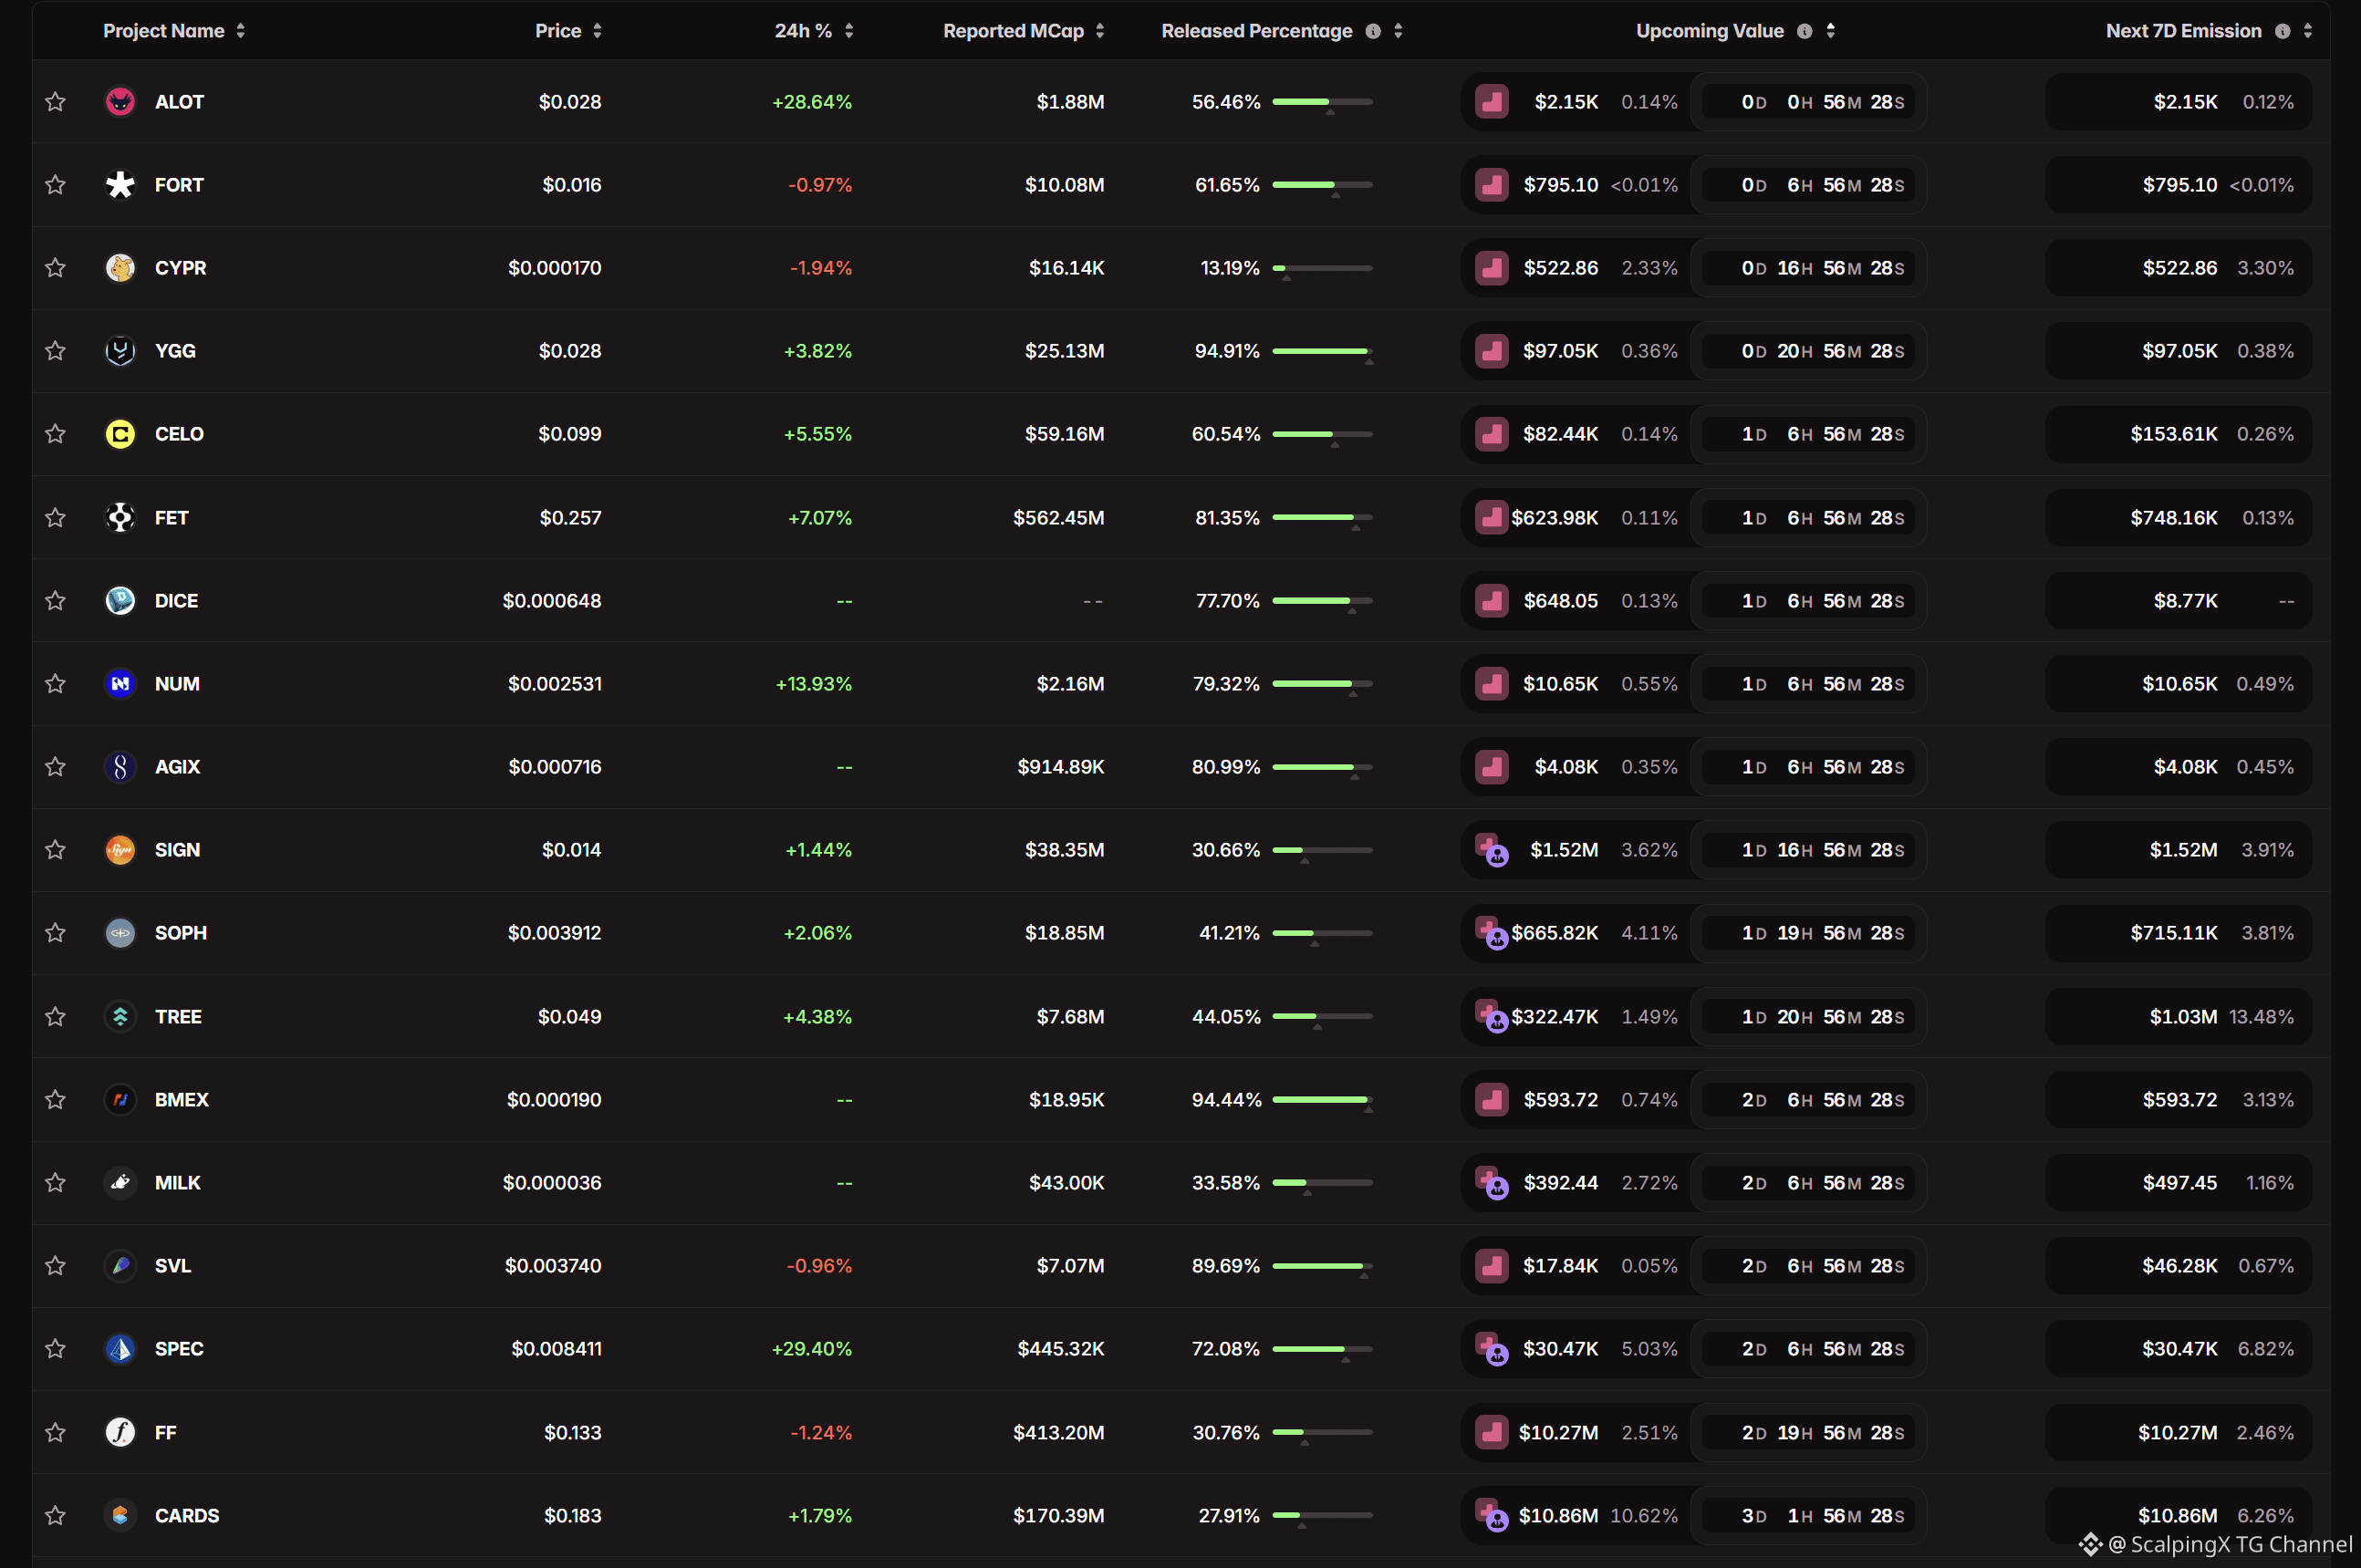
Upcoming unlock schedule for 50 tokens. Personally, I only consider Futures trading opportunities when the event is a Cliff Unlock and the unlock volume exceeds 50% of daily trading volume. If you are focused on long-term investing, however, these events are worth monitoring to optimize entry points after each unlock. Currently, there are 2 unlock events worth watching due to their high unlock volume relative to daily trading volume: $FF - 158.00% $2Z - 476.54% #TokenUnlock
Upcoming unlock schedule for 50 tokens. Personally, I only consider Futures trading opportunities when the event is a Cliff Unlock and the unlock volume exceeds 50% of daily trading volume. If you are focused on long-term investing, however, these events are worth monitoring to optimize entry points after each unlock. Currently, there are 2 unlock events worth watching due to their high unlock volume relative to daily trading volume: $FF - 158.00% $2Z - 476.54% #TokenUnlock
Ver tradução
Crypto week of Sep 21–25: ETFs pushed prices higher, short squeeze amplified the move, but BTC failed to hold the $87,400 area
📈 Bitcoin opened the week around $80,000–81,000, surged to roughly $87,300–87,400, then eased back toward $84,000 by the end of the week. The rally coincided with strong ETF inflows and heavy short liquidations, while several altcoins outperformed BTC.
💰 U.S. spot Bitcoin ETFs attracted about $2.4 billion across five sessions, including nearly $1 billion on Sep 21 alone. Importantly, flows remained positive in the final two sessions even as BTC moved away from its peak, suggesting the pullback was not accompanied by a clear reversal in ETF demand.
⚡ Around $635 million in short positions were liquidated within 24 hours on Sep 21, amplifying the upside move. Afterward, BTC open interest on Binance fell nearly 13% while price declined only modestly, indicating much of the squeeze-driven positioning had been cleared rather than immediately replaced by a new layer of leveraged longs.
🏦 On-chain data also showed roughly 29,800 BTC leaving exchanges over seven days. BTC falling from $87,400 toward $84,000 while exchange flows remained net negative suggests readily available sell-side supply on CEXs did not rise in proportion to the price decline.
🔄 Ethereum ETFs also recorded around $690 million in inflows over five sessions. ETH price performance lagged some altcoins, but improving ETF demand showed that institutional buying was not limited to Bitcoin.
📊 After the squeeze, funding on several exchanges moved back toward low or negative levels, while total stablecoin supply remained around $305–312 billion. The structure suggests underlying liquidity remains in the market, but a sustained break above $87,400 may require renewed spot demand rather than another short squeeze alone.
#CryptoInsights $BTC
Crypto week of Sep 21–25: ETFs pushed prices higher, short squeeze amplified the move, but BTC failed to hold the $87,400 area
📈 Bitcoin opened the week around $80,000–81,000, surged to roughly $87,300–87,400, then eased back toward $84,000 by the end of the week. The rally coincided with strong ETF inflows and heavy short liquidations, while several altcoins outperformed BTC.
💰 U.S. spot Bitcoin ETFs attracted about $2.4 billion across five sessions, including nearly $1 billion on Sep 21 alone. Importantly, flows remained positive in the final two sessions even as BTC moved away from its peak, suggesting the pullback was not accompanied by a clear reversal in ETF demand.
⚡ Around $635 million in short positions were liquidated within 24 hours on Sep 21, amplifying the upside move. Afterward, BTC open interest on Binance fell nearly 13% while price declined only modestly, indicating much of the squeeze-driven positioning had been cleared rather than immediately replaced by a new layer of leveraged longs.
🏦 On-chain data also showed roughly 29,800 BTC leaving exchanges over seven days. BTC falling from $87,400 toward $84,000 while exchange flows remained net negative suggests readily available sell-side supply on CEXs did not rise in proportion to the price decline.
🔄 Ethereum ETFs also recorded around $690 million in inflows over five sessions. ETH price performance lagged some altcoins, but improving ETF demand showed that institutional buying was not limited to Bitcoin.
📊 After the squeeze, funding on several exchanges moved back toward low or negative levels, while total stablecoin supply remained around $305–312 billion. The structure suggests underlying liquidity remains in the market, but a sustained break above $87,400 may require renewed spot demand rather than another short squeeze alone.
#CryptoInsights $BTC
📈 Bitcoin opened the week around $80,000–81,000, surged to roughly $87,300–87,400, then eased back toward $84,000 by the end of the week. The rally coincided with strong ETF inflows and heavy short liquidations, while several altcoins outperformed BTC.
💰 U.S. spot Bitcoin ETFs attracted about $2.4 billion across five sessions, including nearly $1 billion on Sep 21 alone. Importantly, flows remained positive in the final two sessions even as BTC moved away from its peak, suggesting the pullback was not accompanied by a clear reversal in ETF demand.
⚡ Around $635 million in short positions were liquidated within 24 hours on Sep 21, amplifying the upside move. Afterward, BTC open interest on Binance fell nearly 13% while price declined only modestly, indicating much of the squeeze-driven positioning had been cleared rather than immediately replaced by a new layer of leveraged longs.
🏦 On-chain data also showed roughly 29,800 BTC leaving exchanges over seven days. BTC falling from $87,400 toward $84,000 while exchange flows remained net negative suggests readily available sell-side supply on CEXs did not rise in proportion to the price decline.
🔄 Ethereum ETFs also recorded around $690 million in inflows over five sessions. ETH price performance lagged some altcoins, but improving ETF demand showed that institutional buying was not limited to Bitcoin.
📊 After the squeeze, funding on several exchanges moved back toward low or negative levels, while total stablecoin supply remained around $305–312 billion. The structure suggests underlying liquidity remains in the market, but a sustained break above $87,400 may require renewed spot demand rather than another short squeeze alone.
#CryptoInsights $BTC

Ver tradução
Chemicals Sep 21–25: feedstock costs rise faster than finished-product prices
🛢 Oil holding above USD 100/bbl and elevated Hormuz freight costs continued to lift naphtha, methanol, benzene and ethylene costs. In China, mid-month methanol rose 9.4%, benzene 6.5% and acetic acid 17.4%, clearly outpacing many polymer products.
📉 In contrast, PP and LLDPE futures on Dalian fell on Sep 21 as downstream demand remained too weak to absorb higher input costs. Oil-based PE margins were estimated near −335 yuan/t, while coal-based PE still generated around +1,501 yuan/t, highlighting the widening gap between feedstock routes.
🏭 Asian ethylene supply remained relatively tight due to maintenance and reduced Middle Eastern cargoes, but propylene and PP weakened as demand lagged. MTO/MTP economics also deteriorated as methanol rose faster than olefin output prices, prompting some producers to cut operating rates or shut units.
🌾 Chinese urea showed a similar pattern. Coal-based production costs rose about 10% while urea prices increased only around 1%, pushing theoretical margins down to roughly 24 yuan/t. This indicates that higher input costs are still not being fully passed through.
🇪🇺 In Europe, Ineos’ temporary shutdown of three Hull plants, alongside EU chemical operating rates near 75%, continues to reflect structural pressure from expensive gas, electricity and feedstocks. Low Rhine water levels and the EU’s anti-dumping investigation into PVC add further logistics and trade risks.
🔎 Looking ahead, China’s Golden Week, oil prices and Hormuz freight will be key variables. If energy costs remain elevated, PP/PE and urea margins may stay compressed even as basic chemical feedstocks remain firm.
#Chemicals $CL
Chemicals Sep 21–25: feedstock costs rise faster than finished-product prices
🛢 Oil holding above USD 100/bbl and elevated Hormuz freight costs continued to lift naphtha, methanol, benzene and ethylene costs. In China, mid-month methanol rose 9.4%, benzene 6.5% and acetic acid 17.4%, clearly outpacing many polymer products.
📉 In contrast, PP and LLDPE futures on Dalian fell on Sep 21 as downstream demand remained too weak to absorb higher input costs. Oil-based PE margins were estimated near −335 yuan/t, while coal-based PE still generated around +1,501 yuan/t, highlighting the widening gap between feedstock routes.
🏭 Asian ethylene supply remained relatively tight due to maintenance and reduced Middle Eastern cargoes, but propylene and PP weakened as demand lagged. MTO/MTP economics also deteriorated as methanol rose faster than olefin output prices, prompting some producers to cut operating rates or shut units.
🌾 Chinese urea showed a similar pattern. Coal-based production costs rose about 10% while urea prices increased only around 1%, pushing theoretical margins down to roughly 24 yuan/t. This indicates that higher input costs are still not being fully passed through.
🇪🇺 In Europe, Ineos’ temporary shutdown of three Hull plants, alongside EU chemical operating rates near 75%, continues to reflect structural pressure from expensive gas, electricity and feedstocks. Low Rhine water levels and the EU’s anti-dumping investigation into PVC add further logistics and trade risks.
🔎 Looking ahead, China’s Golden Week, oil prices and Hormuz freight will be key variables. If energy costs remain elevated, PP/PE and urea margins may stay compressed even as basic chemical feedstocks remain firm.
#Chemicals $CL
🛢 Oil holding above USD 100/bbl and elevated Hormuz freight costs continued to lift naphtha, methanol, benzene and ethylene costs. In China, mid-month methanol rose 9.4%, benzene 6.5% and acetic acid 17.4%, clearly outpacing many polymer products.
📉 In contrast, PP and LLDPE futures on Dalian fell on Sep 21 as downstream demand remained too weak to absorb higher input costs. Oil-based PE margins were estimated near −335 yuan/t, while coal-based PE still generated around +1,501 yuan/t, highlighting the widening gap between feedstock routes.
🏭 Asian ethylene supply remained relatively tight due to maintenance and reduced Middle Eastern cargoes, but propylene and PP weakened as demand lagged. MTO/MTP economics also deteriorated as methanol rose faster than olefin output prices, prompting some producers to cut operating rates or shut units.
🌾 Chinese urea showed a similar pattern. Coal-based production costs rose about 10% while urea prices increased only around 1%, pushing theoretical margins down to roughly 24 yuan/t. This indicates that higher input costs are still not being fully passed through.
🇪🇺 In Europe, Ineos’ temporary shutdown of three Hull plants, alongside EU chemical operating rates near 75%, continues to reflect structural pressure from expensive gas, electricity and feedstocks. Low Rhine water levels and the EU’s anti-dumping investigation into PVC add further logistics and trade risks.
🔎 Looking ahead, China’s Golden Week, oil prices and Hormuz freight will be key variables. If energy costs remain elevated, PP/PE and urea margins may stay compressed even as basic chemical feedstocks remain firm.
#Chemicals $CL
2
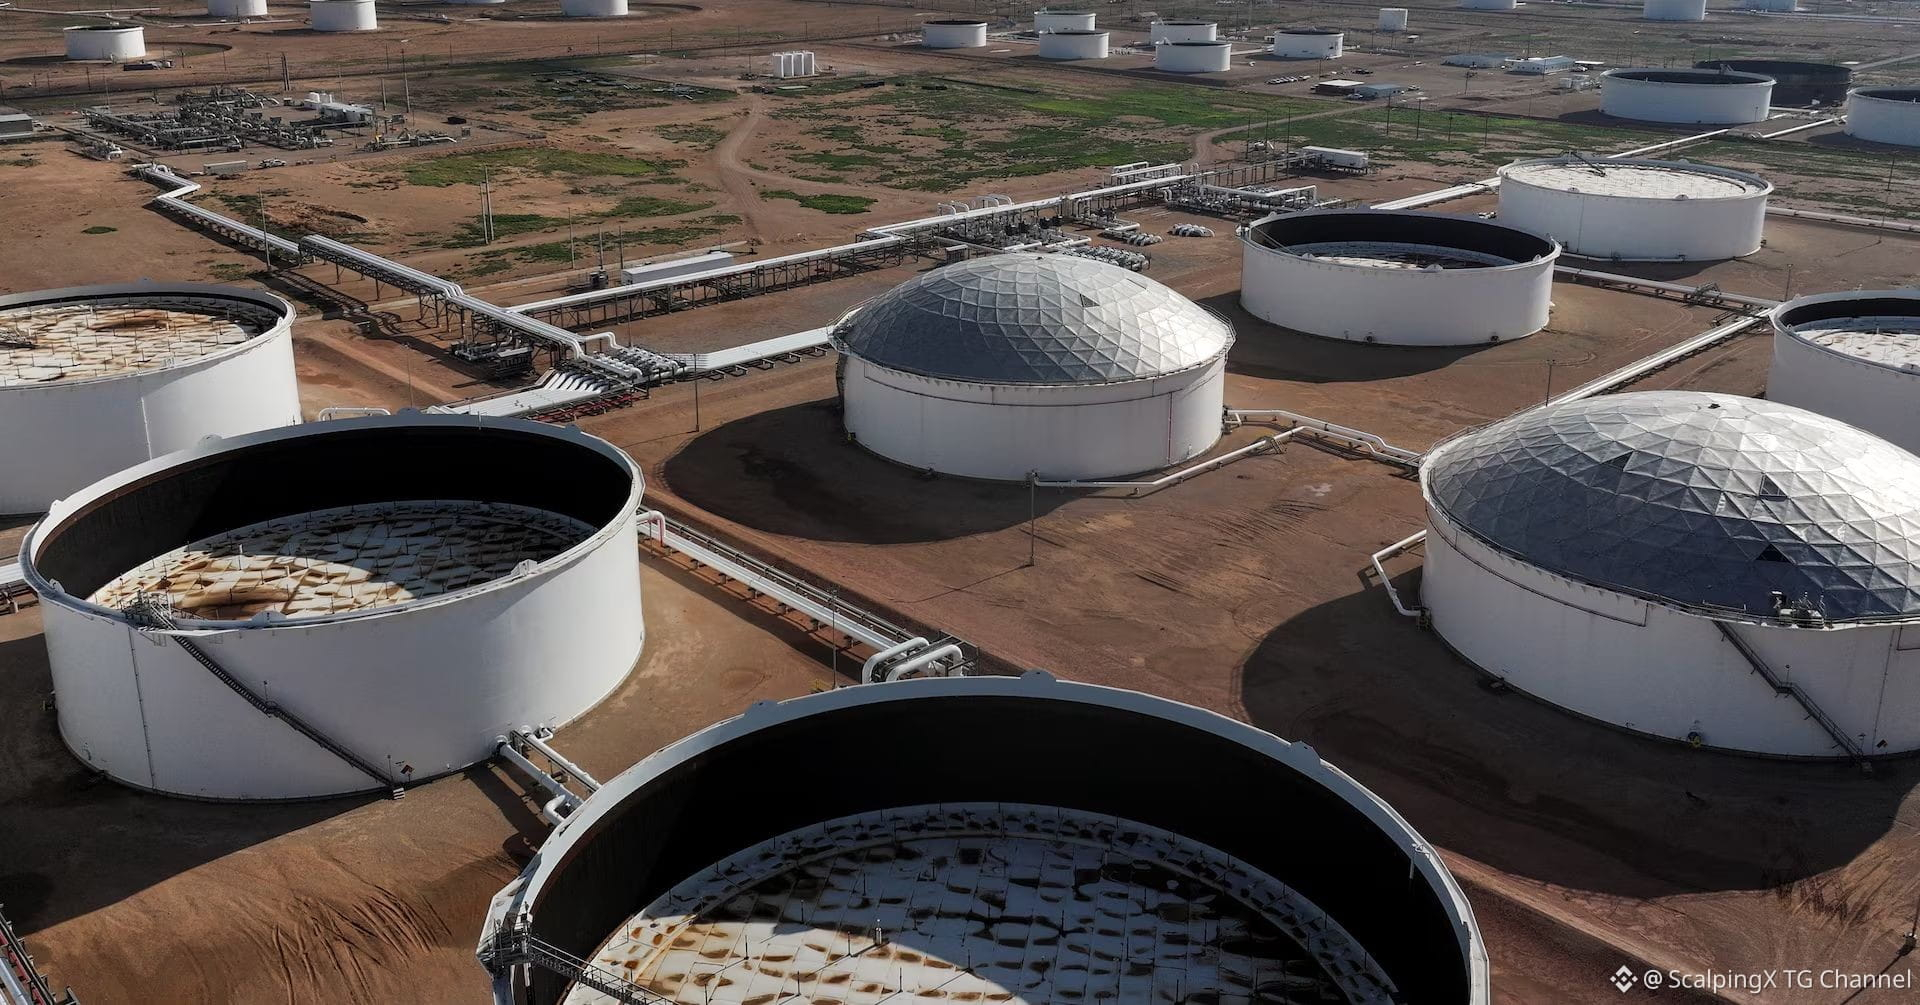
O petróleo de papel esfria, mas o diesel e a logística mantêm o mercado físico apertado
🛢 A Brent encerrou a semana perto de US$ 104,32/barril, enquanto a WTI caiu para US$ 92,41, alargando o diferencial Brent–WTI para quase US$ 12/barril, o maior desde maio. A divergência mostra que o petróleo dos EUA enfrenta sua própria pressão de estoques e riscos de exportação de diesel, enquanto barris internacionais ainda comandam um prêmio físico mais alto.
🤝 As conversas EUA–Irã em Nova York ajudaram a retirar parte do prêmio de risco associado a Ormuz, mas os fluxos físicos não melhoraram de forma material. A Kpler estimou que os movimentos de petróleo pelo estreito ficaram em torno de 33,7 milhões de barris na semana que começou em 20 de setembro, praticamente inalterados ante a semana anterior.
📉 Ao mesmo tempo, a AIE estima que os estoques globais de petróleo caíram cerca de 507 milhões de barris desde o início do conflito. Nos EUA, os estoques de destilados estão em apenas 107,4 milhões de barris, cerca de 12% abaixo da média de cinco anos, mesmo com os estoques comerciais de petróleo bruto tendo subido em 3 milhões de barris.
⛽ A maior pressão permanece nos produtos refinados. As margens (cracks) do diesel do sul da Europa subiram acima de US$ 100/barril, enquanto notícias de que Washington está considerando um banimento de exportação de diesel por 90 dias enfraqueceram fortemente os cracks do diesel nos EUA. Se for implementada, a medida poderia aliviar a oferta doméstica dos EUA, ao mesmo tempo em que apertaria ainda mais a Europa.
🚢 A logística também segue constrangida. As taxas de VLCC do Golfo para a Ásia atingiram brevemente cerca de US$ 1,27 milhão por dia, enquanto a capacidade de transferência navio a navio ao longo de Omã foi intensamente utilizada. Isso sugere que, mesmo com uma travessia de Ormuz mais suave, o gargalo físico não seria removido imediatamente.
📌 Portanto, a semana não pode ser lida apenas como petróleo caindo por causa da diplomacia. A WTI reflete disponibilidade de petróleo dos EUA e riscos domésticos do diesel, enquanto a Brent permanece sustentada por estoques globais em queda, oferta apertada de produtos refinados e custos logísticos elevados.
#MercadosDeEnergia $CL $NATGAS
O petróleo de papel esfria, mas o diesel e a logística mantêm o mercado físico apertado
🛢 A Brent encerrou a semana perto de US$ 104,32/barril, enquanto a WTI caiu para US$ 92,41, alargando o diferencial Brent–WTI para quase US$ 12/barril, o maior desde maio. A divergência mostra que o petróleo dos EUA enfrenta sua própria pressão de estoques e riscos de exportação de diesel, enquanto barris internacionais ainda comandam um prêmio físico mais alto.
🤝 As conversas EUA–Irã em Nova York ajudaram a retirar parte do prêmio de risco associado a Ormuz, mas os fluxos físicos não melhoraram de forma material. A Kpler estimou que os movimentos de petróleo pelo estreito ficaram em torno de 33,7 milhões de barris na semana que começou em 20 de setembro, praticamente inalterados ante a semana anterior.
📉 Ao mesmo tempo, a AIE estima que os estoques globais de petróleo caíram cerca de 507 milhões de barris desde o início do conflito. Nos EUA, os estoques de destilados estão em apenas 107,4 milhões de barris, cerca de 12% abaixo da média de cinco anos, mesmo com os estoques comerciais de petróleo bruto tendo subido em 3 milhões de barris.
⛽ A maior pressão permanece nos produtos refinados. As margens (cracks) do diesel do sul da Europa subiram acima de US$ 100/barril, enquanto notícias de que Washington está considerando um banimento de exportação de diesel por 90 dias enfraqueceram fortemente os cracks do diesel nos EUA. Se for implementada, a medida poderia aliviar a oferta doméstica dos EUA, ao mesmo tempo em que apertaria ainda mais a Europa.
🚢 A logística também segue constrangida. As taxas de VLCC do Golfo para a Ásia atingiram brevemente cerca de US$ 1,27 milhão por dia, enquanto a capacidade de transferência navio a navio ao longo de Omã foi intensamente utilizada. Isso sugere que, mesmo com uma travessia de Ormuz mais suave, o gargalo físico não seria removido imediatamente.
📌 Portanto, a semana não pode ser lida apenas como petróleo caindo por causa da diplomacia. A WTI reflete disponibilidade de petróleo dos EUA e riscos domésticos do diesel, enquanto a Brent permanece sustentada por estoques globais em queda, oferta apertada de produtos refinados e custos logísticos elevados.
#MercadosDeEnergia $CL $NATGAS
🛢 A Brent encerrou a semana perto de US$ 104,32/barril, enquanto a WTI caiu para US$ 92,41, alargando o diferencial Brent–WTI para quase US$ 12/barril, o maior desde maio. A divergência mostra que o petróleo dos EUA enfrenta sua própria pressão de estoques e riscos de exportação de diesel, enquanto barris internacionais ainda comandam um prêmio físico mais alto.
🤝 As conversas EUA–Irã em Nova York ajudaram a retirar parte do prêmio de risco associado a Ormuz, mas os fluxos físicos não melhoraram de forma material. A Kpler estimou que os movimentos de petróleo pelo estreito ficaram em torno de 33,7 milhões de barris na semana que começou em 20 de setembro, praticamente inalterados ante a semana anterior.
📉 Ao mesmo tempo, a AIE estima que os estoques globais de petróleo caíram cerca de 507 milhões de barris desde o início do conflito. Nos EUA, os estoques de destilados estão em apenas 107,4 milhões de barris, cerca de 12% abaixo da média de cinco anos, mesmo com os estoques comerciais de petróleo bruto tendo subido em 3 milhões de barris.
⛽ A maior pressão permanece nos produtos refinados. As margens (cracks) do diesel do sul da Europa subiram acima de US$ 100/barril, enquanto notícias de que Washington está considerando um banimento de exportação de diesel por 90 dias enfraqueceram fortemente os cracks do diesel nos EUA. Se for implementada, a medida poderia aliviar a oferta doméstica dos EUA, ao mesmo tempo em que apertaria ainda mais a Europa.
🚢 A logística também segue constrangida. As taxas de VLCC do Golfo para a Ásia atingiram brevemente cerca de US$ 1,27 milhão por dia, enquanto a capacidade de transferência navio a navio ao longo de Omã foi intensamente utilizada. Isso sugere que, mesmo com uma travessia de Ormuz mais suave, o gargalo físico não seria removido imediatamente.
📌 Portanto, a semana não pode ser lida apenas como petróleo caindo por causa da diplomacia. A WTI reflete disponibilidade de petróleo dos EUA e riscos domésticos do diesel, enquanto a Brent permanece sustentada por estoques globais em queda, oferta apertada de produtos refinados e custos logísticos elevados.
#MercadosDeEnergia $CL $NATGAS

8
Ver tradução
Agricultural commodities diverge as soybeans gain on China expectations while wheat faces supply pressure
🌱 U.S. soybeans were a key outperformer during September 21–25, with November futures closing near 13.19 USD/bu, up 15.5 cents for the week. Support came mainly from expectations of stronger Chinese purchases following fresh trade signals, although the roughly 17 billion USD agricultural commitment still lacks a detailed product breakdown or shipment schedule.
📊 Positioning shows that speculators have already leaned heavily into this theme. Managed money holds a net long of around 281,000 soybean contracts, the highest level in 52 weeks, increasing the potential for a sharp reaction if upcoming purchase details differ from expectations.
🌾 Wheat moved in the opposite direction. SRW fell about 11 cents for the week, HRW lost more than 21 cents, and spring wheat declined nearly 28 cents. Russian and Ukrainian exports remain well below year-ago levels, but Russian grain is still reaching the market through Baltic routes, limiting the premium for a severe supply disruption.
🌽 Corn finished nearly flat as supportive and bearish factors offset each other. USDA has reduced its U.S. production outlook on weaker yields, while harvest progress remains ahead of average and Argentine supply continues moving into export channels.
☕ In soft commodities, Arabica remained under pressure as Brazil’s weather outlook improved and ICE inventories recovered from multi-year lows. Cocoa gained around 5.5% for the week, although the 2025/26 supply outlook still points toward a surplus, making the move look more like a recovery than a renewed shortage cycle.
🔎 Next week, attention turns to details on Chinese agricultural purchases and the USDA Grain Stocks report, which could determine whether the current soybean premium has enough fundamental support to persist.
#Commodities $SUSHI
Agricultural commodities diverge as soybeans gain on China expectations while wheat faces supply pressure
🌱 U.S. soybeans were a key outperformer during September 21–25, with November futures closing near 13.19 USD/bu, up 15.5 cents for the week. Support came mainly from expectations of stronger Chinese purchases following fresh trade signals, although the roughly 17 billion USD agricultural commitment still lacks a detailed product breakdown or shipment schedule.
📊 Positioning shows that speculators have already leaned heavily into this theme. Managed money holds a net long of around 281,000 soybean contracts, the highest level in 52 weeks, increasing the potential for a sharp reaction if upcoming purchase details differ from expectations.
🌾 Wheat moved in the opposite direction. SRW fell about 11 cents for the week, HRW lost more than 21 cents, and spring wheat declined nearly 28 cents. Russian and Ukrainian exports remain well below year-ago levels, but Russian grain is still reaching the market through Baltic routes, limiting the premium for a severe supply disruption.
🌽 Corn finished nearly flat as supportive and bearish factors offset each other. USDA has reduced its U.S. production outlook on weaker yields, while harvest progress remains ahead of average and Argentine supply continues moving into export channels.
☕ In soft commodities, Arabica remained under pressure as Brazil’s weather outlook improved and ICE inventories recovered from multi-year lows. Cocoa gained around 5.5% for the week, although the 2025/26 supply outlook still points toward a surplus, making the move look more like a recovery than a renewed shortage cycle.
🔎 Next week, attention turns to details on Chinese agricultural purchases and the USDA Grain Stocks report, which could determine whether the current soybean premium has enough fundamental support to persist.
#Commodities $SUSHI
🌱 U.S. soybeans were a key outperformer during September 21–25, with November futures closing near 13.19 USD/bu, up 15.5 cents for the week. Support came mainly from expectations of stronger Chinese purchases following fresh trade signals, although the roughly 17 billion USD agricultural commitment still lacks a detailed product breakdown or shipment schedule.
📊 Positioning shows that speculators have already leaned heavily into this theme. Managed money holds a net long of around 281,000 soybean contracts, the highest level in 52 weeks, increasing the potential for a sharp reaction if upcoming purchase details differ from expectations.
🌾 Wheat moved in the opposite direction. SRW fell about 11 cents for the week, HRW lost more than 21 cents, and spring wheat declined nearly 28 cents. Russian and Ukrainian exports remain well below year-ago levels, but Russian grain is still reaching the market through Baltic routes, limiting the premium for a severe supply disruption.
🌽 Corn finished nearly flat as supportive and bearish factors offset each other. USDA has reduced its U.S. production outlook on weaker yields, while harvest progress remains ahead of average and Argentine supply continues moving into export channels.
☕ In soft commodities, Arabica remained under pressure as Brazil’s weather outlook improved and ICE inventories recovered from multi-year lows. Cocoa gained around 5.5% for the week, although the 2025/26 supply outlook still points toward a surplus, making the move look more like a recovery than a renewed shortage cycle.
🔎 Next week, attention turns to details on Chinese agricultural purchases and the USDA Grain Stocks report, which could determine whether the current soybean premium has enough fundamental support to persist.
#Commodities $SUSHI

As ações globais mantêm ganhos, mas a dinâmica do mercado continua estreita
📈 As ações dos EUA terminaram a semana de 21 a 25 de setembro em alta, com o S&P 500 subindo cerca de 1,2%, o Nasdaq avançando mais de 2% e o Dow subindo apenas cerca de 0,3%. Tecnologia e nomes ligados à IA permaneceram como principais motores, ajudando os índices de large caps a avançarem apesar da pressão persistente de rendimentos elevados.
📊 O rendimento do Tesouro dos EUA de 10 anos chegou a subir rapidamente acima de 5,2%, enquanto o petróleo permaneceu perto de níveis elevados antes de ceder no fim da semana. A queda tanto nos rendimentos quanto nos preços de energia na sexta-feira reduziu a pressão sobre as ações, mas não foi suficiente para gerar um movimento amplo de aversão ao risco.
🔍 A dinâmica do mercado continua sendo um ponto-chave a observar. O Nasdaq e o S&P 500 avançaram enquanto small caps, value, utilities e vários grupos não ligados à tecnologia ficaram para trás. Assim, o capital continua concentrando-se em nomes de mega-cap e em infraestrutura de IA, em vez de se espalhar de forma uniforme pelo mercado.
🌍 A Europa se recuperou modestamente após três semanas de quedas, enquanto o Japão continuou amparado por ações de tecnologia e por um iene mais fraco. Hong Kong e vários mercados emergentes foram menos construtivos, destacando a divergência regional que persiste.
📌 Os dados de PCE dos EUA de 30 de setembro serão um dos principais catalisadores da próxima semana. Inflação mais fraca pode aliviar a pressão dos rendimentos, enquanto taxas persistentemente altas continuariam testando as avaliações em ações de crescimento.
#MarketInsights $NVDA $MU $GOOGL
As ações globais mantêm ganhos, mas a dinâmica do mercado continua estreita
📈 As ações dos EUA terminaram a semana de 21 a 25 de setembro em alta, com o S&P 500 subindo cerca de 1,2%, o Nasdaq avançando mais de 2% e o Dow subindo apenas cerca de 0,3%. Tecnologia e nomes ligados à IA permaneceram como principais motores, ajudando os índices de large caps a avançarem apesar da pressão persistente de rendimentos elevados.
📊 O rendimento do Tesouro dos EUA de 10 anos chegou a subir rapidamente acima de 5,2%, enquanto o petróleo permaneceu perto de níveis elevados antes de ceder no fim da semana. A queda tanto nos rendimentos quanto nos preços de energia na sexta-feira reduziu a pressão sobre as ações, mas não foi suficiente para gerar um movimento amplo de aversão ao risco.
🔍 A dinâmica do mercado continua sendo um ponto-chave a observar. O Nasdaq e o S&P 500 avançaram enquanto small caps, value, utilities e vários grupos não ligados à tecnologia ficaram para trás. Assim, o capital continua concentrando-se em nomes de mega-cap e em infraestrutura de IA, em vez de se espalhar de forma uniforme pelo mercado.
🌍 A Europa se recuperou modestamente após três semanas de quedas, enquanto o Japão continuou amparado por ações de tecnologia e por um iene mais fraco. Hong Kong e vários mercados emergentes foram menos construtivos, destacando a divergência regional que persiste.
📌 Os dados de PCE dos EUA de 30 de setembro serão um dos principais catalisadores da próxima semana. Inflação mais fraca pode aliviar a pressão dos rendimentos, enquanto taxas persistentemente altas continuariam testando as avaliações em ações de crescimento.
#MarketInsights $NVDA $MU $GOOGL
📈 As ações dos EUA terminaram a semana de 21 a 25 de setembro em alta, com o S&P 500 subindo cerca de 1,2%, o Nasdaq avançando mais de 2% e o Dow subindo apenas cerca de 0,3%. Tecnologia e nomes ligados à IA permaneceram como principais motores, ajudando os índices de large caps a avançarem apesar da pressão persistente de rendimentos elevados.
📊 O rendimento do Tesouro dos EUA de 10 anos chegou a subir rapidamente acima de 5,2%, enquanto o petróleo permaneceu perto de níveis elevados antes de ceder no fim da semana. A queda tanto nos rendimentos quanto nos preços de energia na sexta-feira reduziu a pressão sobre as ações, mas não foi suficiente para gerar um movimento amplo de aversão ao risco.
🔍 A dinâmica do mercado continua sendo um ponto-chave a observar. O Nasdaq e o S&P 500 avançaram enquanto small caps, value, utilities e vários grupos não ligados à tecnologia ficaram para trás. Assim, o capital continua concentrando-se em nomes de mega-cap e em infraestrutura de IA, em vez de se espalhar de forma uniforme pelo mercado.
🌍 A Europa se recuperou modestamente após três semanas de quedas, enquanto o Japão continuou amparado por ações de tecnologia e por um iene mais fraco. Hong Kong e vários mercados emergentes foram menos construtivos, destacando a divergência regional que persiste.
📌 Os dados de PCE dos EUA de 30 de setembro serão um dos principais catalisadores da próxima semana. Inflação mais fraca pode aliviar a pressão dos rendimentos, enquanto taxas persistentemente altas continuariam testando as avaliações em ações de crescimento.
#MarketInsights $NVDA $MU $GOOGL
13
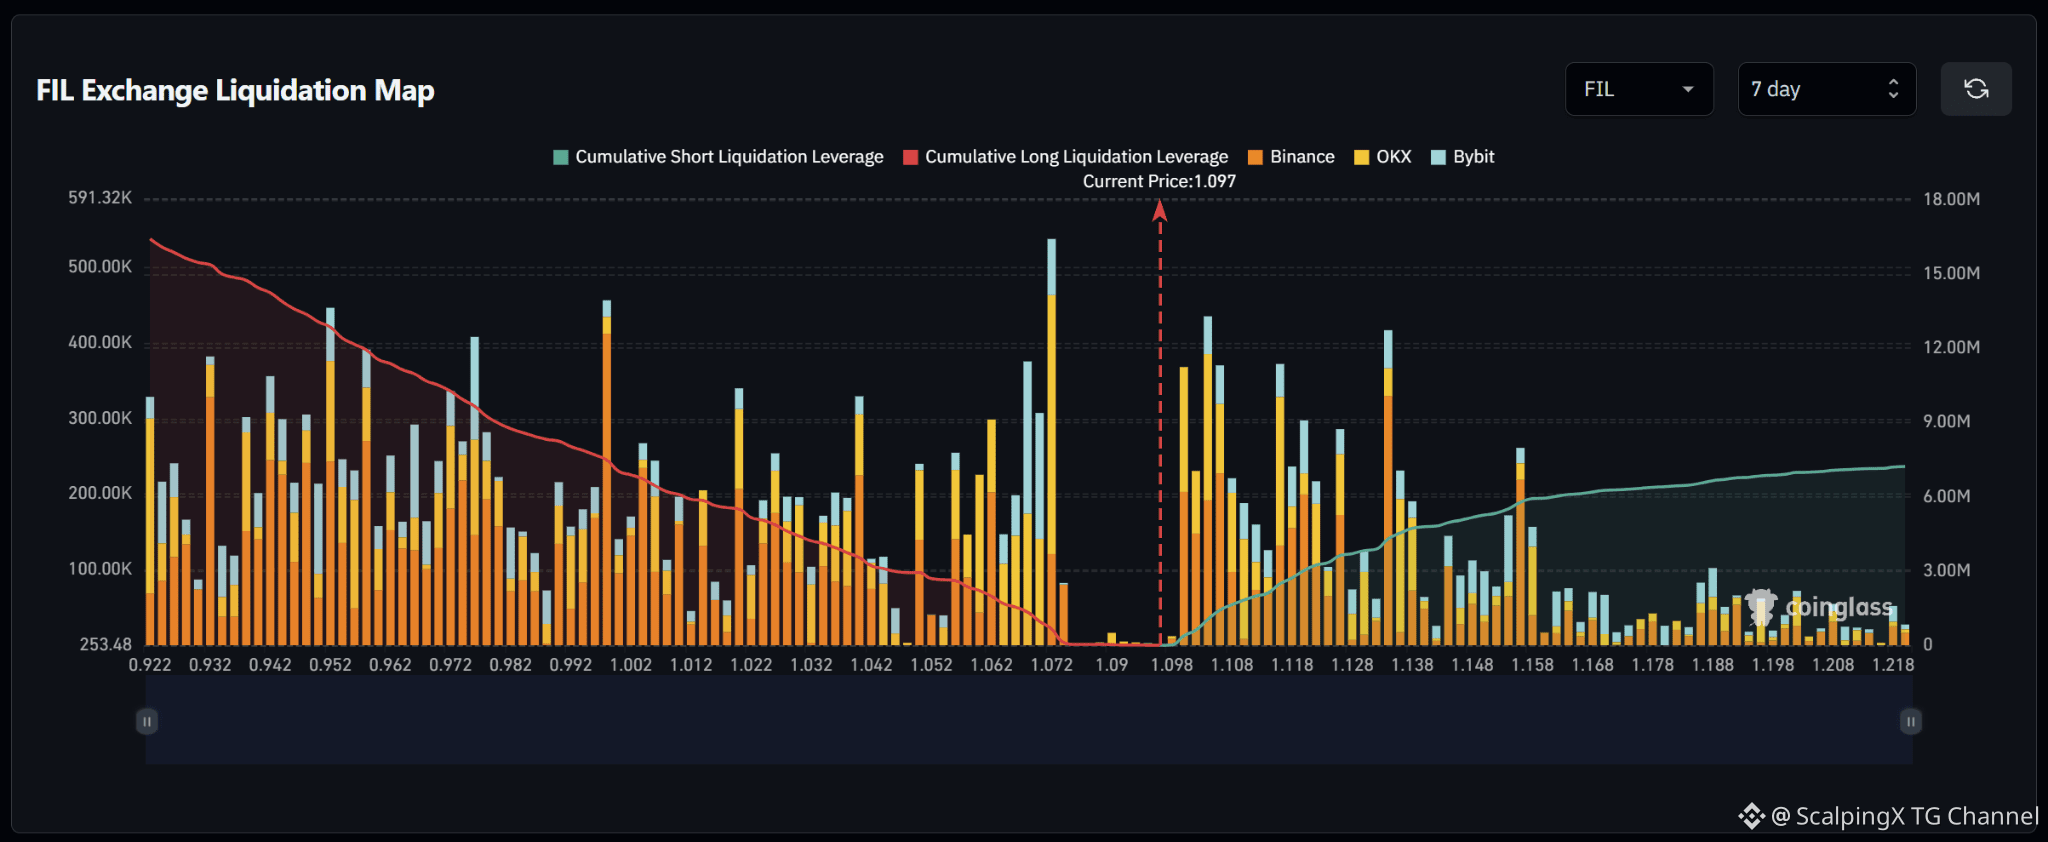
$FIL – Mapa de Liquidações (7 Dias) – Preço Atual 1.097 🔎 O mapa de liquidações de 7 dias mostra aproximadamente 16–17 milhões USD em liquidações longas abaixo do preço atual, superando significativamente cerca de 7 milhões USD em liquidações curtas acima. A estrutura de liquidez, portanto, favorece claramente a desvalorização, com cerca de 2,3 vezes mais liquidez cumulativa abaixo do mercado. 📉 Abaixo do mercado, a liquidez de liquidações longas está amplamente distribuída, mas concentrada principalmente em 0,95–1,07. O cluster mais forte está em torno de 1,071–1,073 com uma barra acima de 0,5 milhão USD, enquanto 0,995–0,998 e 0,950–0,953 também têm barras por volta de 0,44–0,45 milhão USD. Perder 1,09 faria a atenção se voltar para 1,072–1,062 e depois para 1,042–1,022. 📈 Acima do mercado, a liquidez de liquidações curtas está concentrada principalmente em 1,10–1,14. Clusters notáveis aparecem em torno de 1,103–1,106 com uma barra perto de 0,43 milhão USD, 1,116–1,119 perto de 0,37 milhão USD e 1,132–1,135 por volta de 0,42 milhão USD. Mais ao longe, 1,155–1,158 ainda mantém mais um bolsão relevante. 🧭 O cenário mais amplo favorece a desvalorização porque a exposição abaixo, via liquidações longas, domina claramente. Perder 1,09 aumentaria a probabilidade de uma varredura em direção a 1,072–1,062, seguida de 1,042–1,022. Romper acima de 1,105, por outro lado, exporia 1,118 e depois 1,132–1,135.
$FIL – Mapa de Liquidações (7 Dias) – Preço Atual 1.097 🔎 O mapa de liquidações de 7 dias mostra aproximadamente 16–17 milhões USD em liquidações longas abaixo do preço atual, superando significativamente cerca de 7 milhões USD em liquidações curtas acima. A estrutura de liquidez, portanto, favorece claramente a desvalorização, com cerca de 2,3 vezes mais liquidez cumulativa abaixo do mercado. 📉 Abaixo do mercado, a liquidez de liquidações longas está amplamente distribuída, mas concentrada principalmente em 0,95–1,07. O cluster mais forte está em torno de 1,071–1,073 com uma barra acima de 0,5 milhão USD, enquanto 0,995–0,998 e 0,950–0,953 também têm barras por volta de 0,44–0,45 milhão USD. Perder 1,09 faria a atenção se voltar para 1,072–1,062 e depois para 1,042–1,022. 📈 Acima do mercado, a liquidez de liquidações curtas está concentrada principalmente em 1,10–1,14. Clusters notáveis aparecem em torno de 1,103–1,106 com uma barra perto de 0,43 milhão USD, 1,116–1,119 perto de 0,37 milhão USD e 1,132–1,135 por volta de 0,42 milhão USD. Mais ao longe, 1,155–1,158 ainda mantém mais um bolsão relevante. 🧭 O cenário mais amplo favorece a desvalorização porque a exposição abaixo, via liquidações longas, domina claramente. Perder 1,09 aumentaria a probabilidade de uma varredura em direção a 1,072–1,062, seguida de 1,042–1,022. Romper acima de 1,105, por outro lado, exporia 1,118 e depois 1,132–1,135.
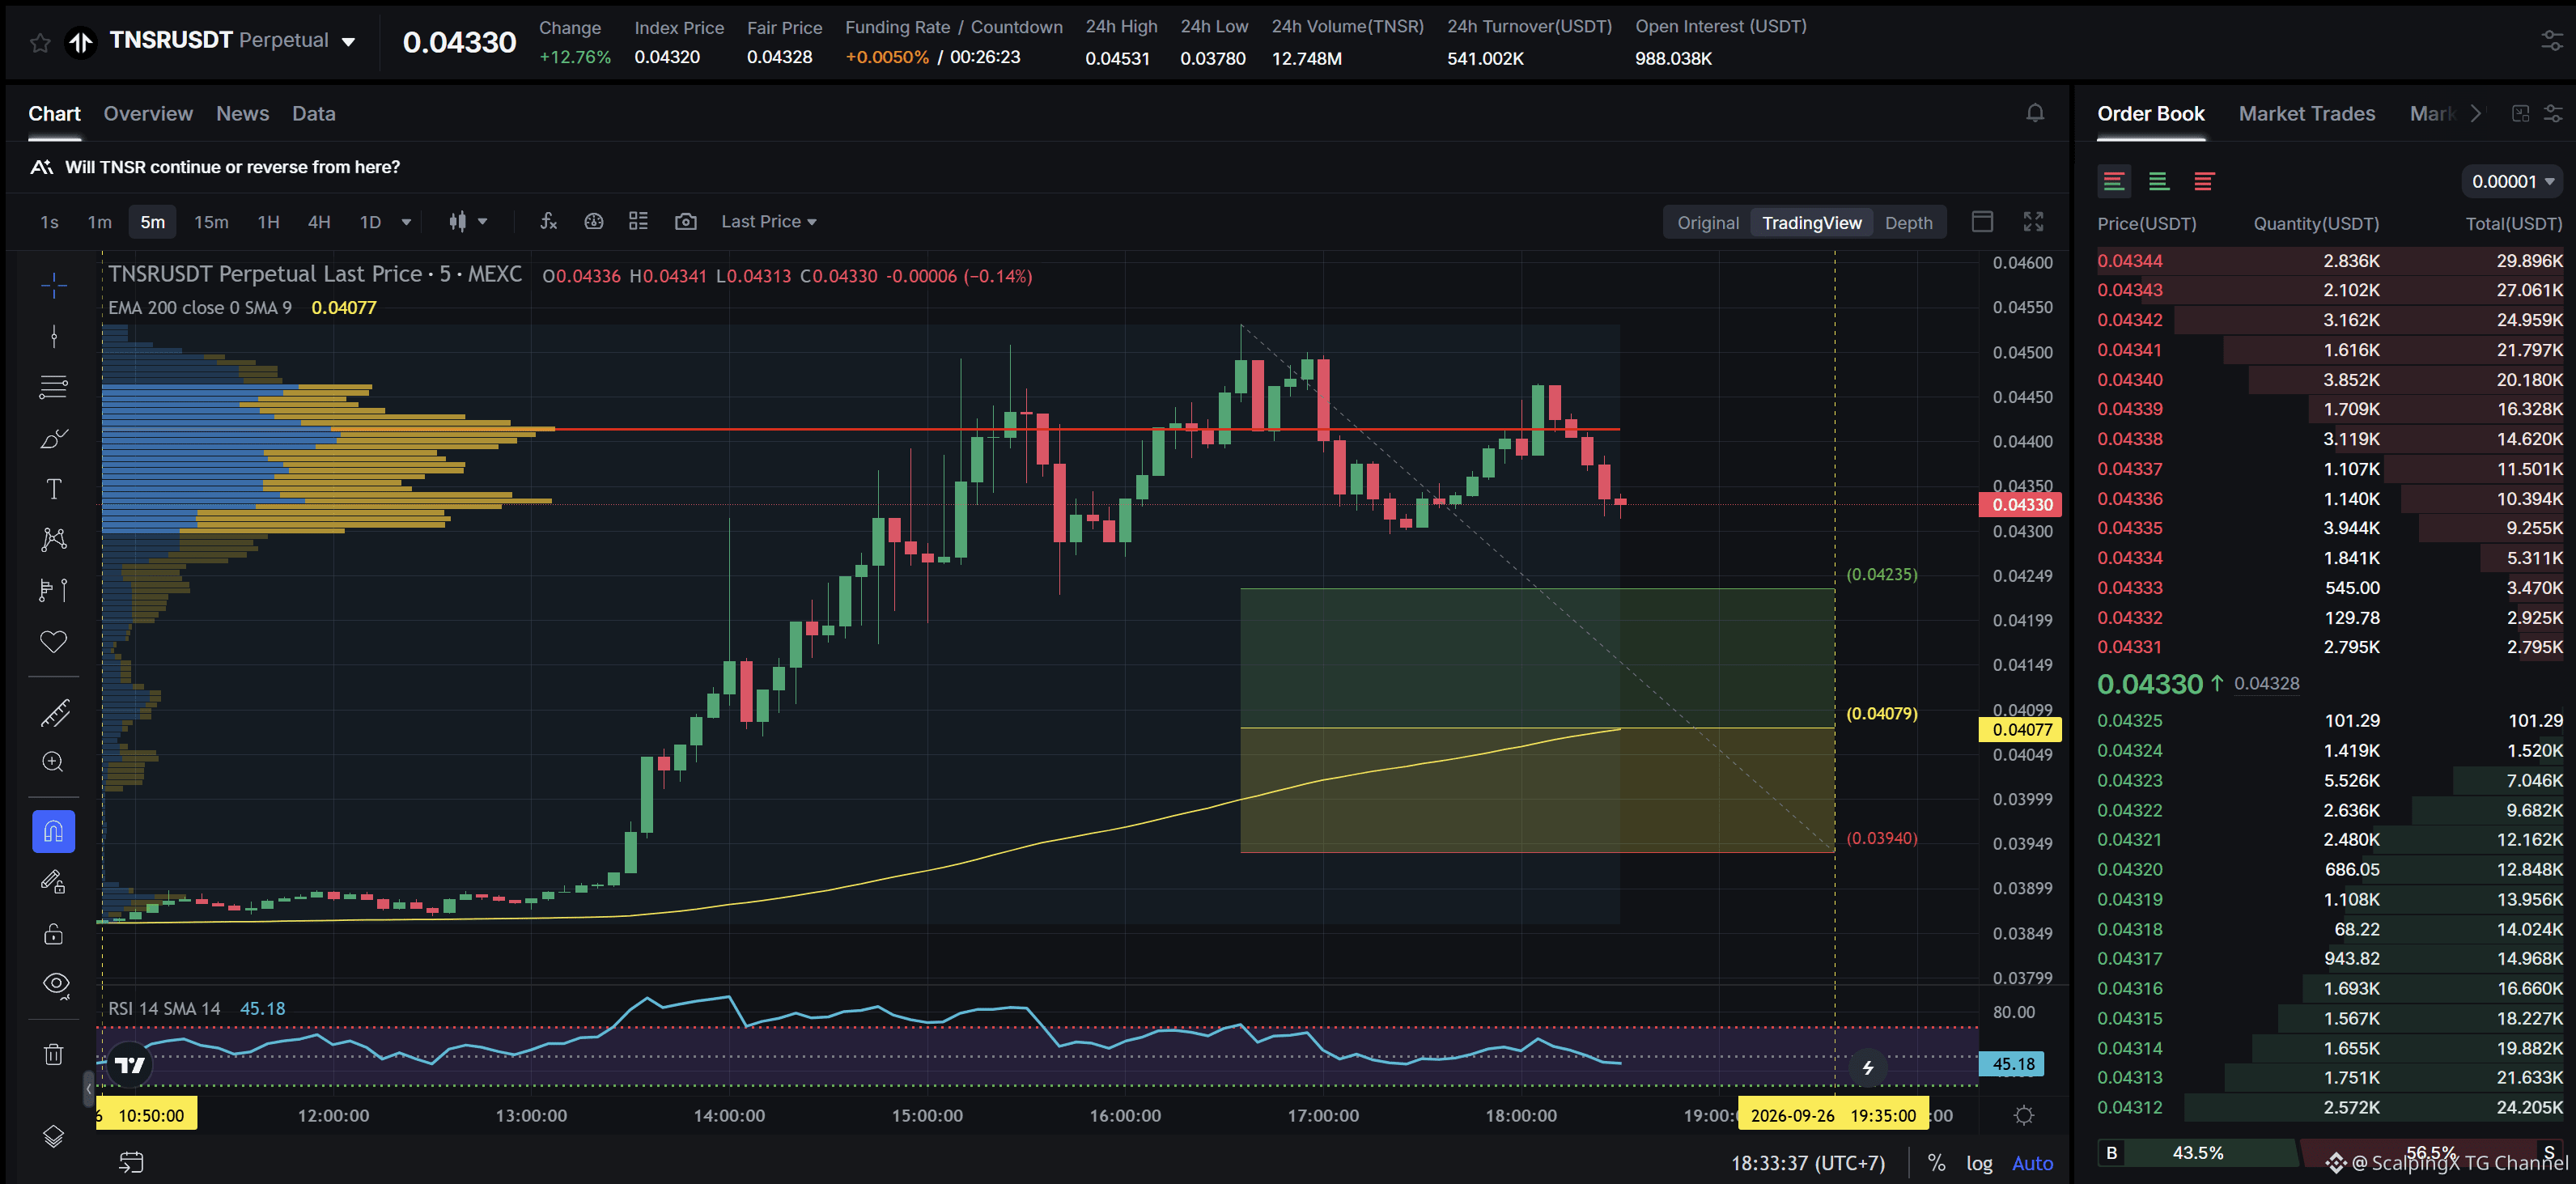
$TNSR - Mcap 22.32M$ - 24h Sentimento +5.81 Touro SC02 M5 - pendente Ordem de compra. A entrada está dentro do LVN e não é afetada por nenhuma zona fraca; a zona de suporte atual tem aproximadamente 3,38% de largura. A tendência de alta durou 7 horas e 40 minutos, com um aumento máximo registrado do preço de 17,32%. Se o preço perder essa zona de suporte, é altamente provável que a tendência reverta para baixo.
$TNSR - Mcap 22.32M$ - 24h Sentimento +5.81 Touro SC02 M5 - pendente Ordem de compra. A entrada está dentro do LVN e não é afetada por nenhuma zona fraca; a zona de suporte atual tem aproximadamente 3,38% de largura. A tendência de alta durou 7 horas e 40 minutos, com um aumento máximo registrado do preço de 17,32%. Se o preço perder essa zona de suporte, é altamente provável que a tendência reverta para baixo.
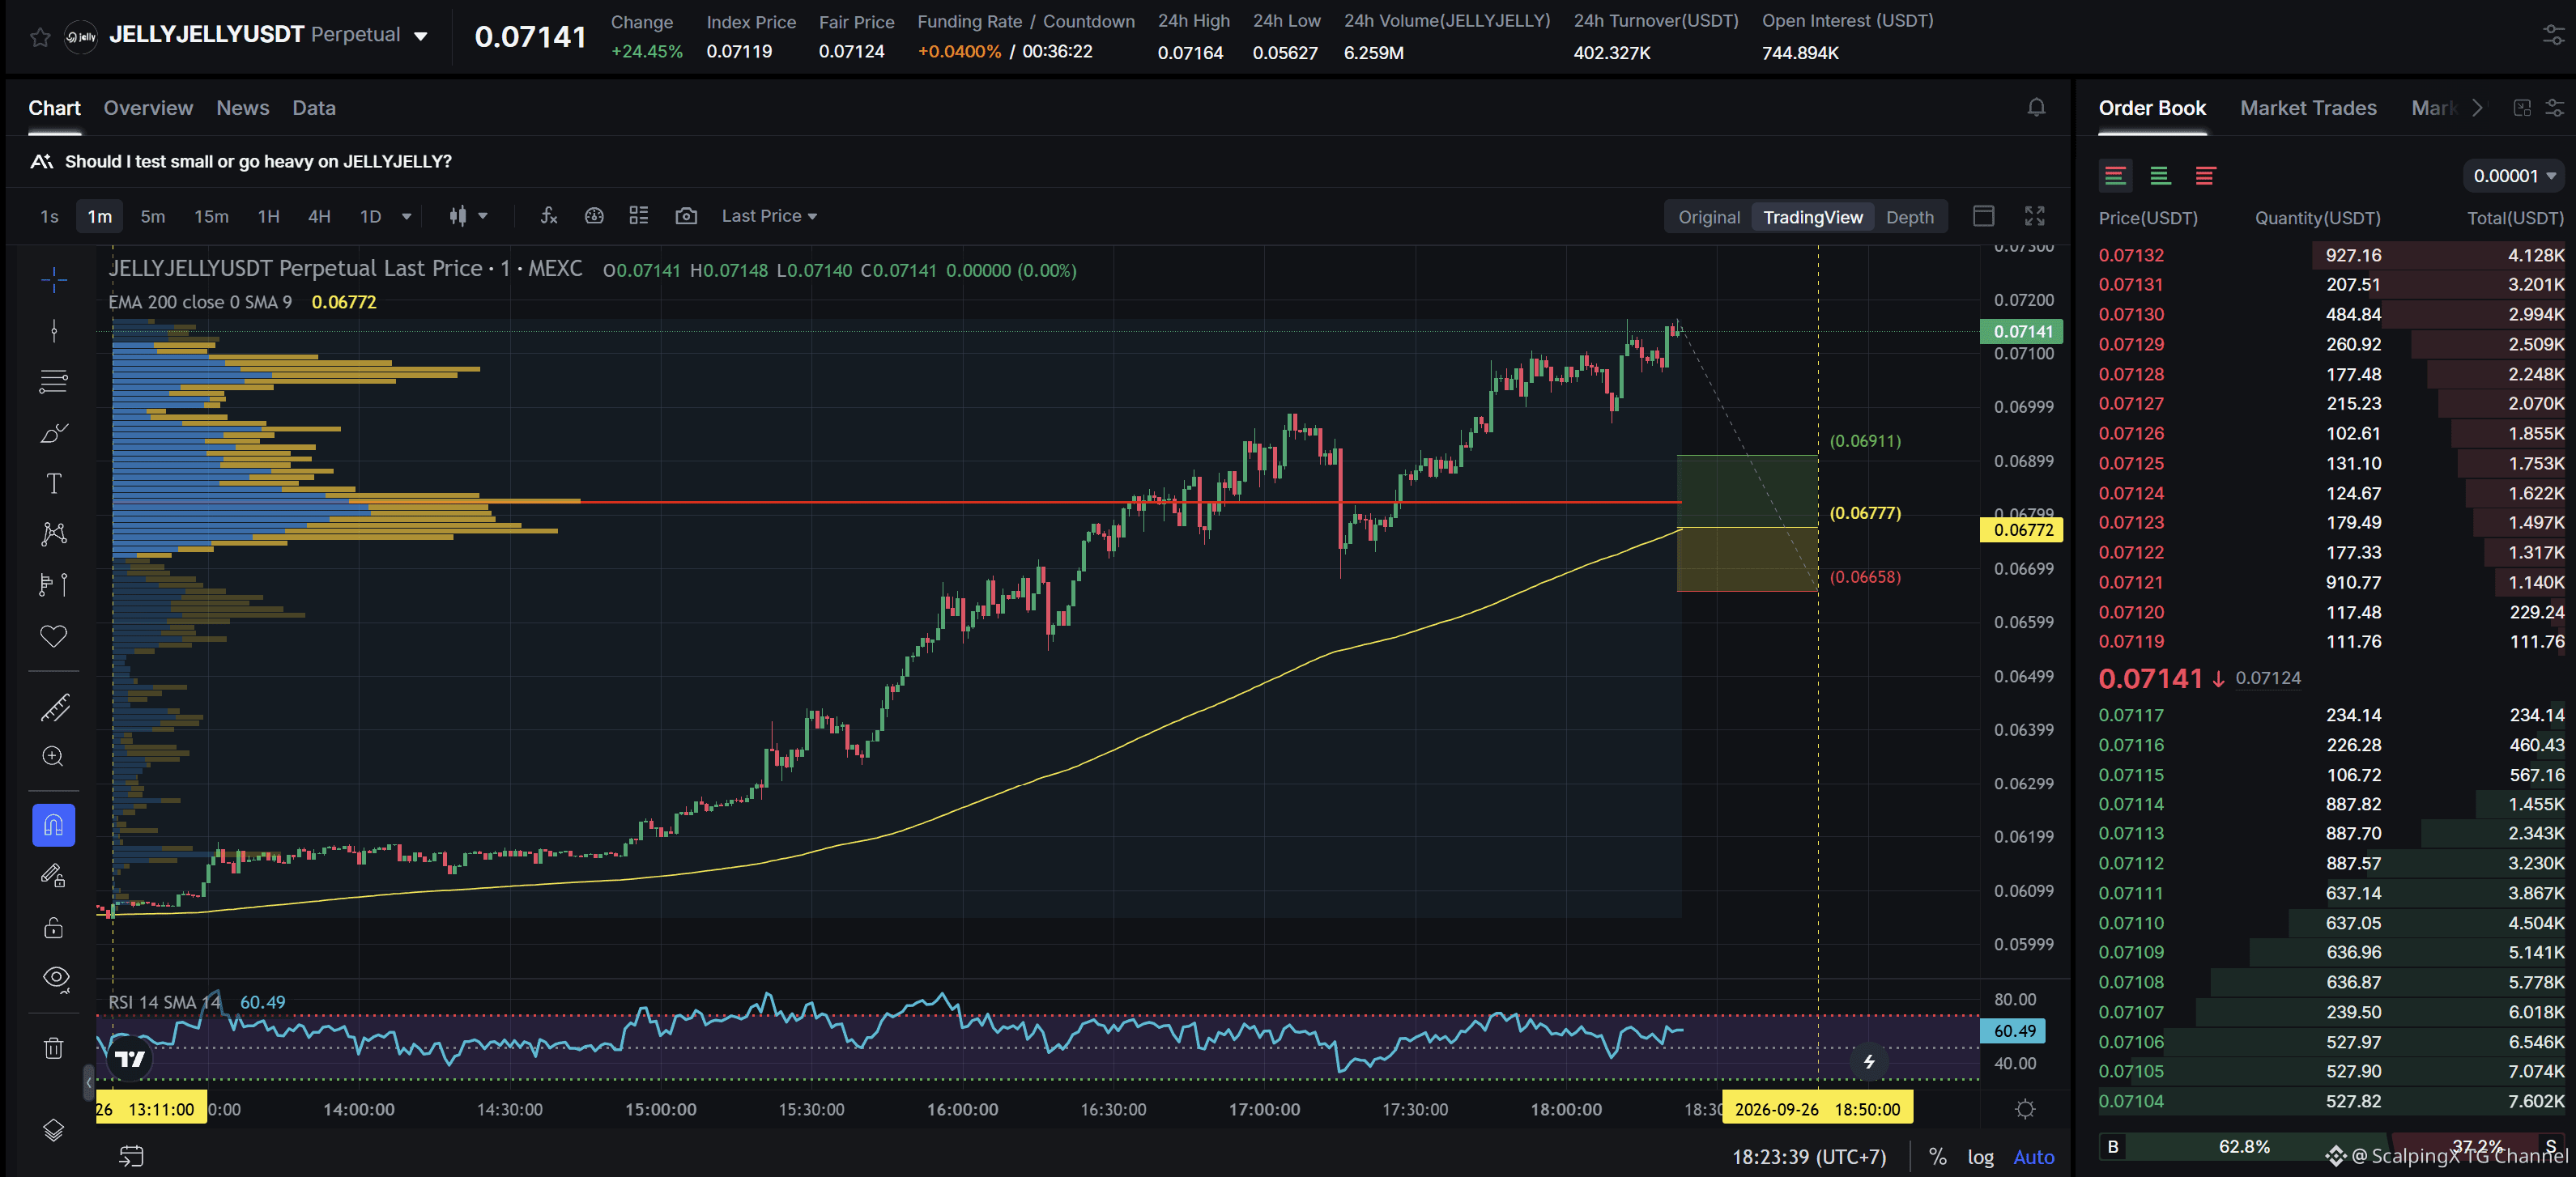
$JELLYJELLY - Mcap 70.41M$ - 24h Sentimento +6.00 Touro SC02 M1 - pendente Ordem Longa. A entrada está dentro da HVN e não é afetada por nenhuma zona fraca; a zona de suporte atual tem aproximadamente 1,71% de largura. A tendência de alta durou 5 horas e 14 minutos, com um aumento máximo de preço registrado de 18,30%. Se o preço perder esta zona de suporte, a tendência tem grande probabilidade de reverter para baixo.
$JELLYJELLY - Mcap 70.41M$ - 24h Sentimento +6.00 Touro SC02 M1 - pendente Ordem Longa. A entrada está dentro da HVN e não é afetada por nenhuma zona fraca; a zona de suporte atual tem aproximadamente 1,71% de largura. A tendência de alta durou 5 horas e 14 minutos, com um aumento máximo de preço registrado de 18,30%. Se o preço perder esta zona de suporte, a tendência tem grande probabilidade de reverter para baixo.
Os metais divergem: o ouro enfrenta pressão à medida que a oferta cede, enquanto cobre e zinco permanecem sustentados pela firmeza física
🟡 O ouro caiu cerca de 2%–2,3% entre 21 e 25 de setembro, para cerca de US$ 4.280–4.288/oz, enquanto a prata perdeu aproximadamente 4%. A principal pressão veio do aumento da taxa dos Treasuries dos EUA de 10 anos, acima de 5%, e do DXY em torno de 101, elevando o custo de oportunidade dos ativos que não rendem juros, apesar dos riscos contínuos no Oriente Médio.
📉 O movimento parece mais um reajuste das expectativas de juros do que uma saída ampla dos metais preciosos. O posicionamento especulativo do ouro segue fortemente comprado líquido, enquanto as holdings da GLD apenas caíram modestamente em 24 de setembro.
🔶 O cobre seguiu na direção oposta. O cobre LME de 3 meses ficou perto de US$ 14.620–14.630/t, enquanto o COMEX chegou brevemente a cerca de US$ 15.060/t. O backwardation de caixa para 3 meses aumentou para aproximadamente US$ 125/t, mostrando que o metal disponível imediatamente ainda exige um prêmio forte, apesar de um dólar mais firme.
⚙️ O zinco também permaneceu relativamente apertado, com backwardation perto de US$ 106/t. Cargas de tratamento profundamente negativas na China e a revisão da Nyrstar sobre a usina de beneficiamento Budel adicionaram mais preocupações com a oferta. O níquel ficou mais fraco, já que os estoques continuaram a se acumular.
🏗️ O minério de ferro não acompanhou a alta do cobre. Os preços ficaram perto de CNY 713–715/t na Dalian e de US$ 95–96/t no SGX, enquanto os estoques nos portos chineses subiram para cerca de 145,45 milhões de toneladas. O abastecimento antes do Golden Week ajudou, mas margens fracas do aço e manutenção das coquerias limitaram a demanda.
📌 Esta não foi uma semana uniformemente de aversão ao risco para os metais. Os metais preciosos seguem sendo impulsionados principalmente por taxas e pelo dólar, enquanto cobre e zinco ainda são sustentados pela firmeza física. O PCE dos EUA será fundamental para o ouro e a prata, enquanto a demanda pós-férias na China pesará mais para o cobre e o minério de ferro.
#Metals $XAU $XAG $XCU
Os metais divergem: o ouro enfrenta pressão à medida que a oferta cede, enquanto cobre e zinco permanecem sustentados pela firmeza física
🟡 O ouro caiu cerca de 2%–2,3% entre 21 e 25 de setembro, para cerca de US$ 4.280–4.288/oz, enquanto a prata perdeu aproximadamente 4%. A principal pressão veio do aumento da taxa dos Treasuries dos EUA de 10 anos, acima de 5%, e do DXY em torno de 101, elevando o custo de oportunidade dos ativos que não rendem juros, apesar dos riscos contínuos no Oriente Médio.
📉 O movimento parece mais um reajuste das expectativas de juros do que uma saída ampla dos metais preciosos. O posicionamento especulativo do ouro segue fortemente comprado líquido, enquanto as holdings da GLD apenas caíram modestamente em 24 de setembro.
🔶 O cobre seguiu na direção oposta. O cobre LME de 3 meses ficou perto de US$ 14.620–14.630/t, enquanto o COMEX chegou brevemente a cerca de US$ 15.060/t. O backwardation de caixa para 3 meses aumentou para aproximadamente US$ 125/t, mostrando que o metal disponível imediatamente ainda exige um prêmio forte, apesar de um dólar mais firme.
⚙️ O zinco também permaneceu relativamente apertado, com backwardation perto de US$ 106/t. Cargas de tratamento profundamente negativas na China e a revisão da Nyrstar sobre a usina de beneficiamento Budel adicionaram mais preocupações com a oferta. O níquel ficou mais fraco, já que os estoques continuaram a se acumular.
🏗️ O minério de ferro não acompanhou a alta do cobre. Os preços ficaram perto de CNY 713–715/t na Dalian e de US$ 95–96/t no SGX, enquanto os estoques nos portos chineses subiram para cerca de 145,45 milhões de toneladas. O abastecimento antes do Golden Week ajudou, mas margens fracas do aço e manutenção das coquerias limitaram a demanda.
📌 Esta não foi uma semana uniformemente de aversão ao risco para os metais. Os metais preciosos seguem sendo impulsionados principalmente por taxas e pelo dólar, enquanto cobre e zinco ainda são sustentados pela firmeza física. O PCE dos EUA será fundamental para o ouro e a prata, enquanto a demanda pós-férias na China pesará mais para o cobre e o minério de ferro.
#Metals $XAU $XAG $XCU
🟡 O ouro caiu cerca de 2%–2,3% entre 21 e 25 de setembro, para cerca de US$ 4.280–4.288/oz, enquanto a prata perdeu aproximadamente 4%. A principal pressão veio do aumento da taxa dos Treasuries dos EUA de 10 anos, acima de 5%, e do DXY em torno de 101, elevando o custo de oportunidade dos ativos que não rendem juros, apesar dos riscos contínuos no Oriente Médio.
📉 O movimento parece mais um reajuste das expectativas de juros do que uma saída ampla dos metais preciosos. O posicionamento especulativo do ouro segue fortemente comprado líquido, enquanto as holdings da GLD apenas caíram modestamente em 24 de setembro.
🔶 O cobre seguiu na direção oposta. O cobre LME de 3 meses ficou perto de US$ 14.620–14.630/t, enquanto o COMEX chegou brevemente a cerca de US$ 15.060/t. O backwardation de caixa para 3 meses aumentou para aproximadamente US$ 125/t, mostrando que o metal disponível imediatamente ainda exige um prêmio forte, apesar de um dólar mais firme.
⚙️ O zinco também permaneceu relativamente apertado, com backwardation perto de US$ 106/t. Cargas de tratamento profundamente negativas na China e a revisão da Nyrstar sobre a usina de beneficiamento Budel adicionaram mais preocupações com a oferta. O níquel ficou mais fraco, já que os estoques continuaram a se acumular.
🏗️ O minério de ferro não acompanhou a alta do cobre. Os preços ficaram perto de CNY 713–715/t na Dalian e de US$ 95–96/t no SGX, enquanto os estoques nos portos chineses subiram para cerca de 145,45 milhões de toneladas. O abastecimento antes do Golden Week ajudou, mas margens fracas do aço e manutenção das coquerias limitaram a demanda.
📌 Esta não foi uma semana uniformemente de aversão ao risco para os metais. Os metais preciosos seguem sendo impulsionados principalmente por taxas e pelo dólar, enquanto cobre e zinco ainda são sustentados pela firmeza física. O PCE dos EUA será fundamental para o ouro e a prata, enquanto a demanda pós-férias na China pesará mais para o cobre e o minério de ferro.
#Metals $XAU $XAG $XCU

34
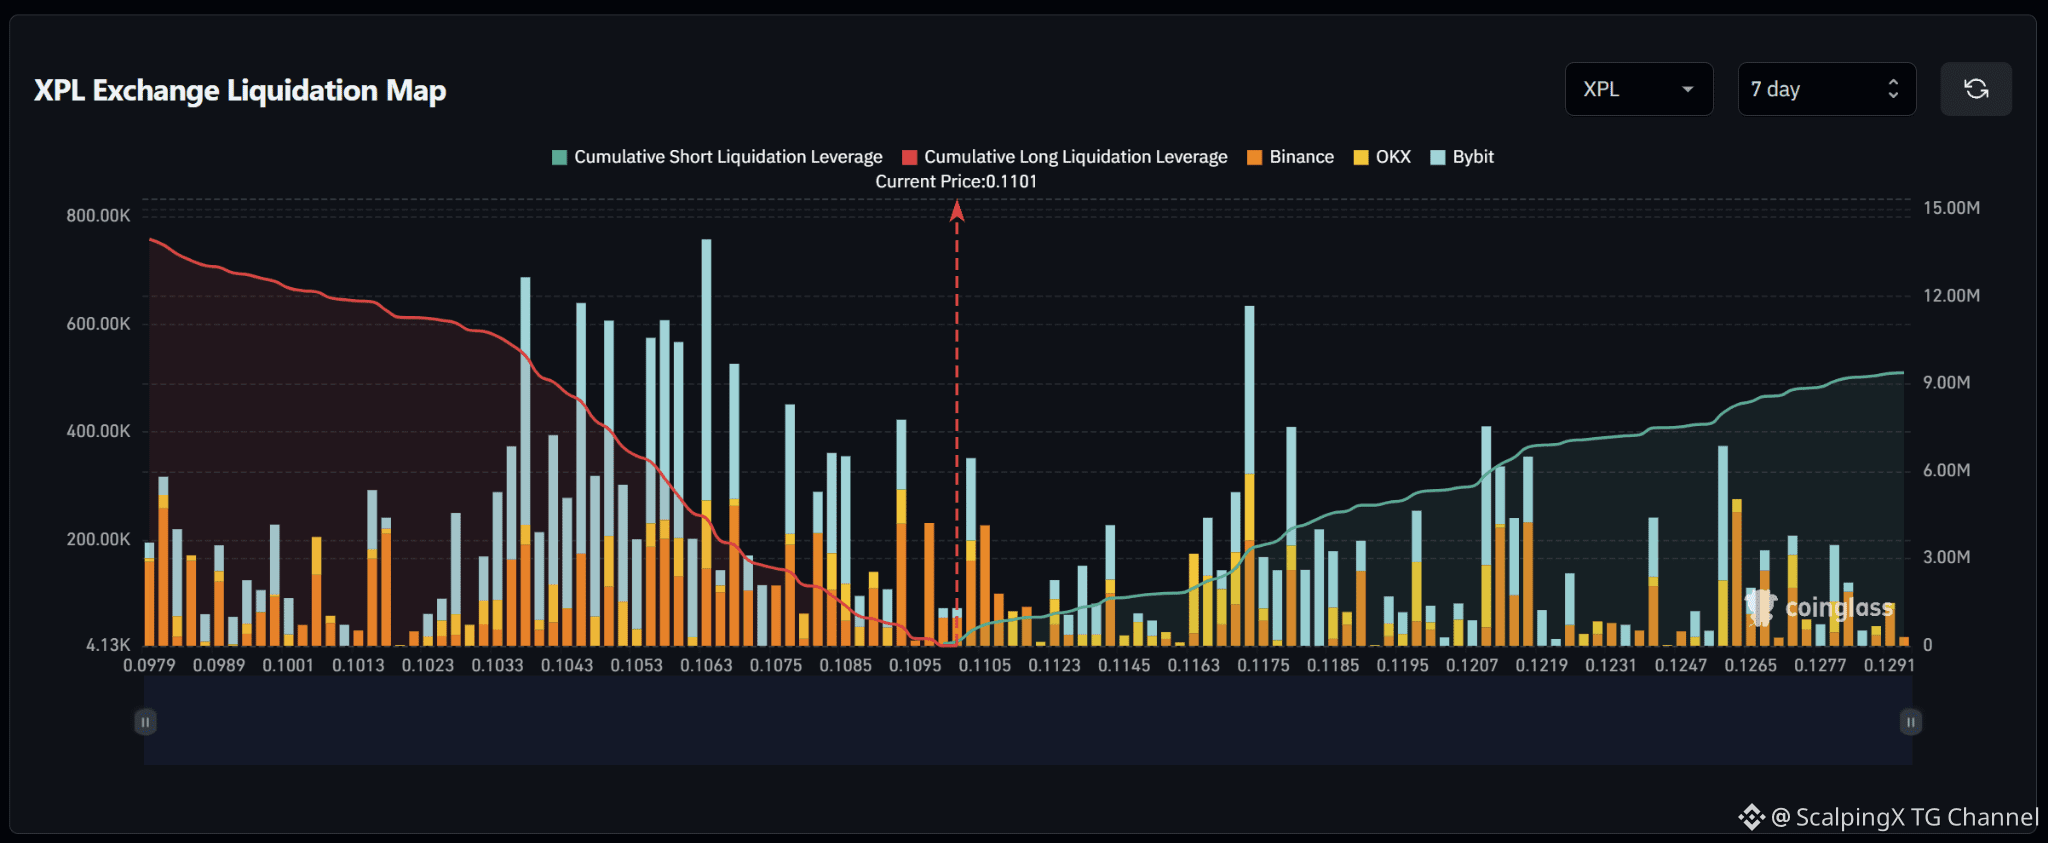
$XPL – Mapa de Liquidações (7 Dias) – Preço Atual 0.1101 🔎 O mapa de liquidações de 7 dias mostra aproximadamente 13–14 milhões USD em liquidações longas abaixo do preço atual, excedendo cerca de 9 milhões USD em liquidações curtas acima. A estrutura de liquidez, portanto, favorece a queda, com cerca de 1,5 vez mais liquidez acumulada abaixo do mercado. 📉 Abaixo do mercado, a liquidez de liquidações longas está concentrada fortemente em 0.103–0.108. O cluster mais forte está em torno de 0.1062–0.1065, com uma barra perto de 0,75 milhão USD, enquanto 0.1035–0.1055 contém várias barras por volta de 0,55–0,68 milhão USD. Ao perder 0.1095, a atenção mudaria para 0.1085–0.1075 e então para 0.1065–0.1045. 📈 Acima do mercado, a liquidez de liquidações curtas está concentrada principalmente em 0.116–0.122. O cluster mais forte está em torno de 0.1172–0.1175, com uma barra perto de 0,63 milhão USD, enquanto 0.1208–0.1218 contém várias barras por volta de 0,35–0,40 milhão USD. Mais ao longe, 0.1260–0.1266 mantém outro bolsão de liquidez notável. 🧭 O cenário mais amplo favorece a queda porque a exposição a liquidações longas abaixo é maior. Perder 0.1095 aumentaria a probabilidade de uma varredura em direção a 0.1085–0.1075, seguida de 0.1065–0.1045. Romper acima de 0.1145, por sua vez, exporia 0.1172–0.1175 e depois 0.1208–0.1218.
$XPL – Mapa de Liquidações (7 Dias) – Preço Atual 0.1101 🔎 O mapa de liquidações de 7 dias mostra aproximadamente 13–14 milhões USD em liquidações longas abaixo do preço atual, excedendo cerca de 9 milhões USD em liquidações curtas acima. A estrutura de liquidez, portanto, favorece a queda, com cerca de 1,5 vez mais liquidez acumulada abaixo do mercado. 📉 Abaixo do mercado, a liquidez de liquidações longas está concentrada fortemente em 0.103–0.108. O cluster mais forte está em torno de 0.1062–0.1065, com uma barra perto de 0,75 milhão USD, enquanto 0.1035–0.1055 contém várias barras por volta de 0,55–0,68 milhão USD. Ao perder 0.1095, a atenção mudaria para 0.1085–0.1075 e então para 0.1065–0.1045. 📈 Acima do mercado, a liquidez de liquidações curtas está concentrada principalmente em 0.116–0.122. O cluster mais forte está em torno de 0.1172–0.1175, com uma barra perto de 0,63 milhão USD, enquanto 0.1208–0.1218 contém várias barras por volta de 0,35–0,40 milhão USD. Mais ao longe, 0.1260–0.1266 mantém outro bolsão de liquidez notável. 🧭 O cenário mais amplo favorece a queda porque a exposição a liquidações longas abaixo é maior. Perder 0.1095 aumentaria a probabilidade de uma varredura em direção a 0.1085–0.1075, seguida de 0.1065–0.1045. Romper acima de 0.1145, por sua vez, exporia 0.1172–0.1175 e depois 0.1208–0.1218.
5
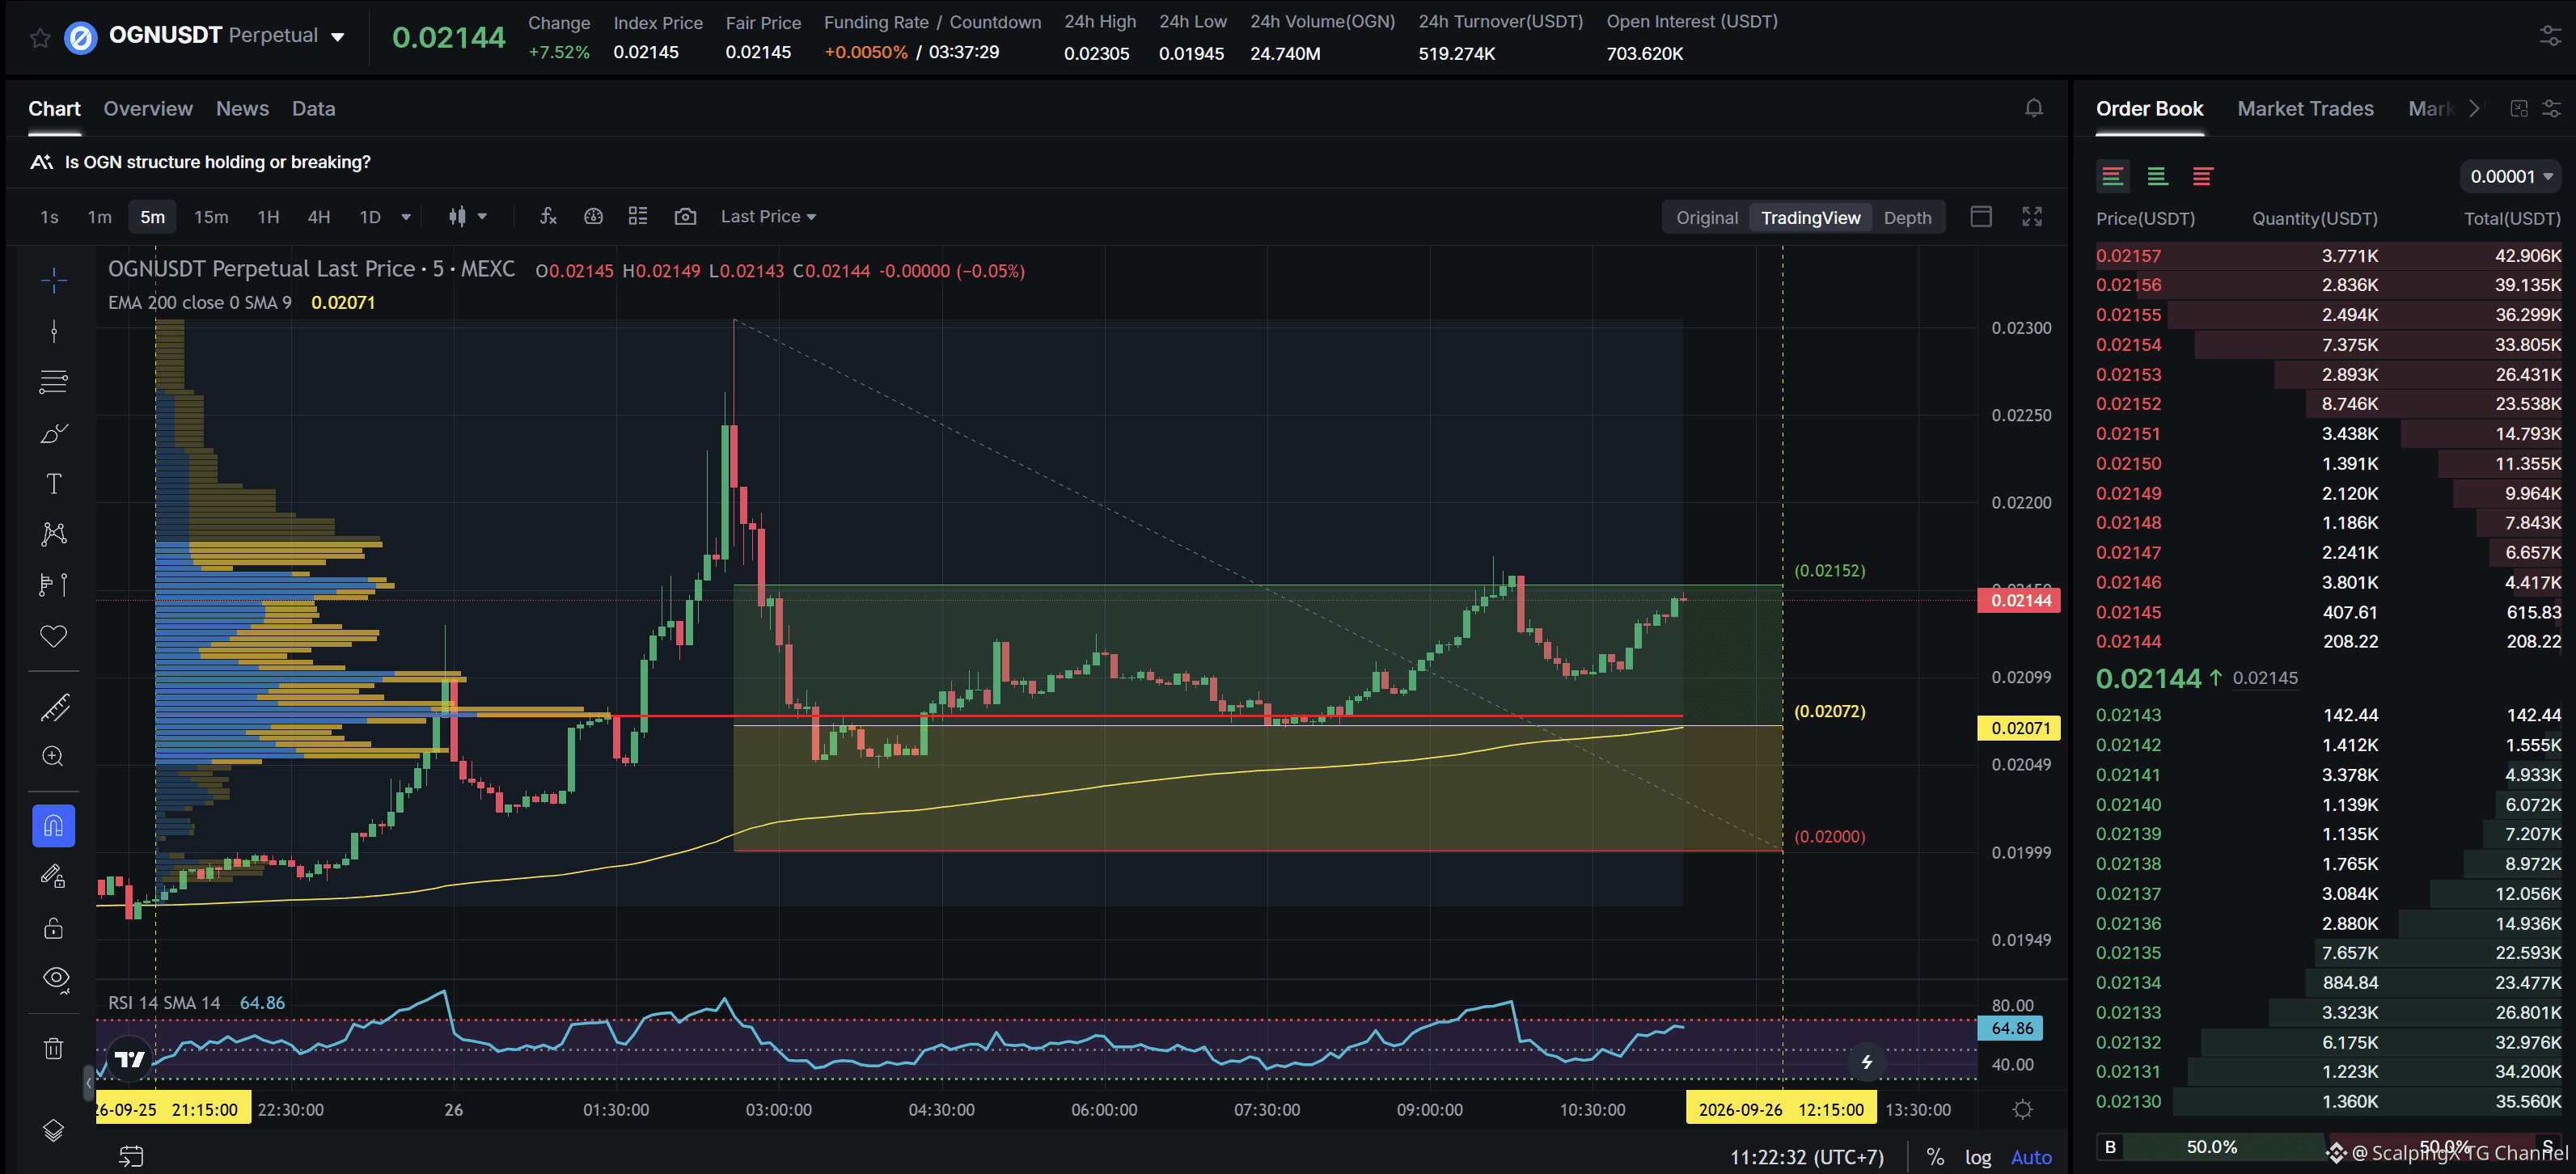
$OGN - Mcap 14.8M$ - 24h Sentimento +5,76 Touro SC02 M5 - pendente Longo order. A entrada fica dentro do LVN e não é afetada por nenhuma zona fraca; a zona de suporte atual tem aproximadamente 3,40% de largura. A tendência de alta durou 14 horas e 5 minutos, com o maior aumento de preço registrado de 17,02%. Se o preço perder essa zona de suporte, a tendência tem alta probabilidade de inverter para baixo.
$OGN - Mcap 14.8M$ - 24h Sentimento +5,76 Touro SC02 M5 - pendente Longo order. A entrada fica dentro do LVN e não é afetada por nenhuma zona fraca; a zona de suporte atual tem aproximadamente 3,40% de largura. A tendência de alta durou 14 horas e 5 minutos, com o maior aumento de preço registrado de 17,02%. Se o preço perder essa zona de suporte, a tendência tem alta probabilidade de inverter para baixo.
6
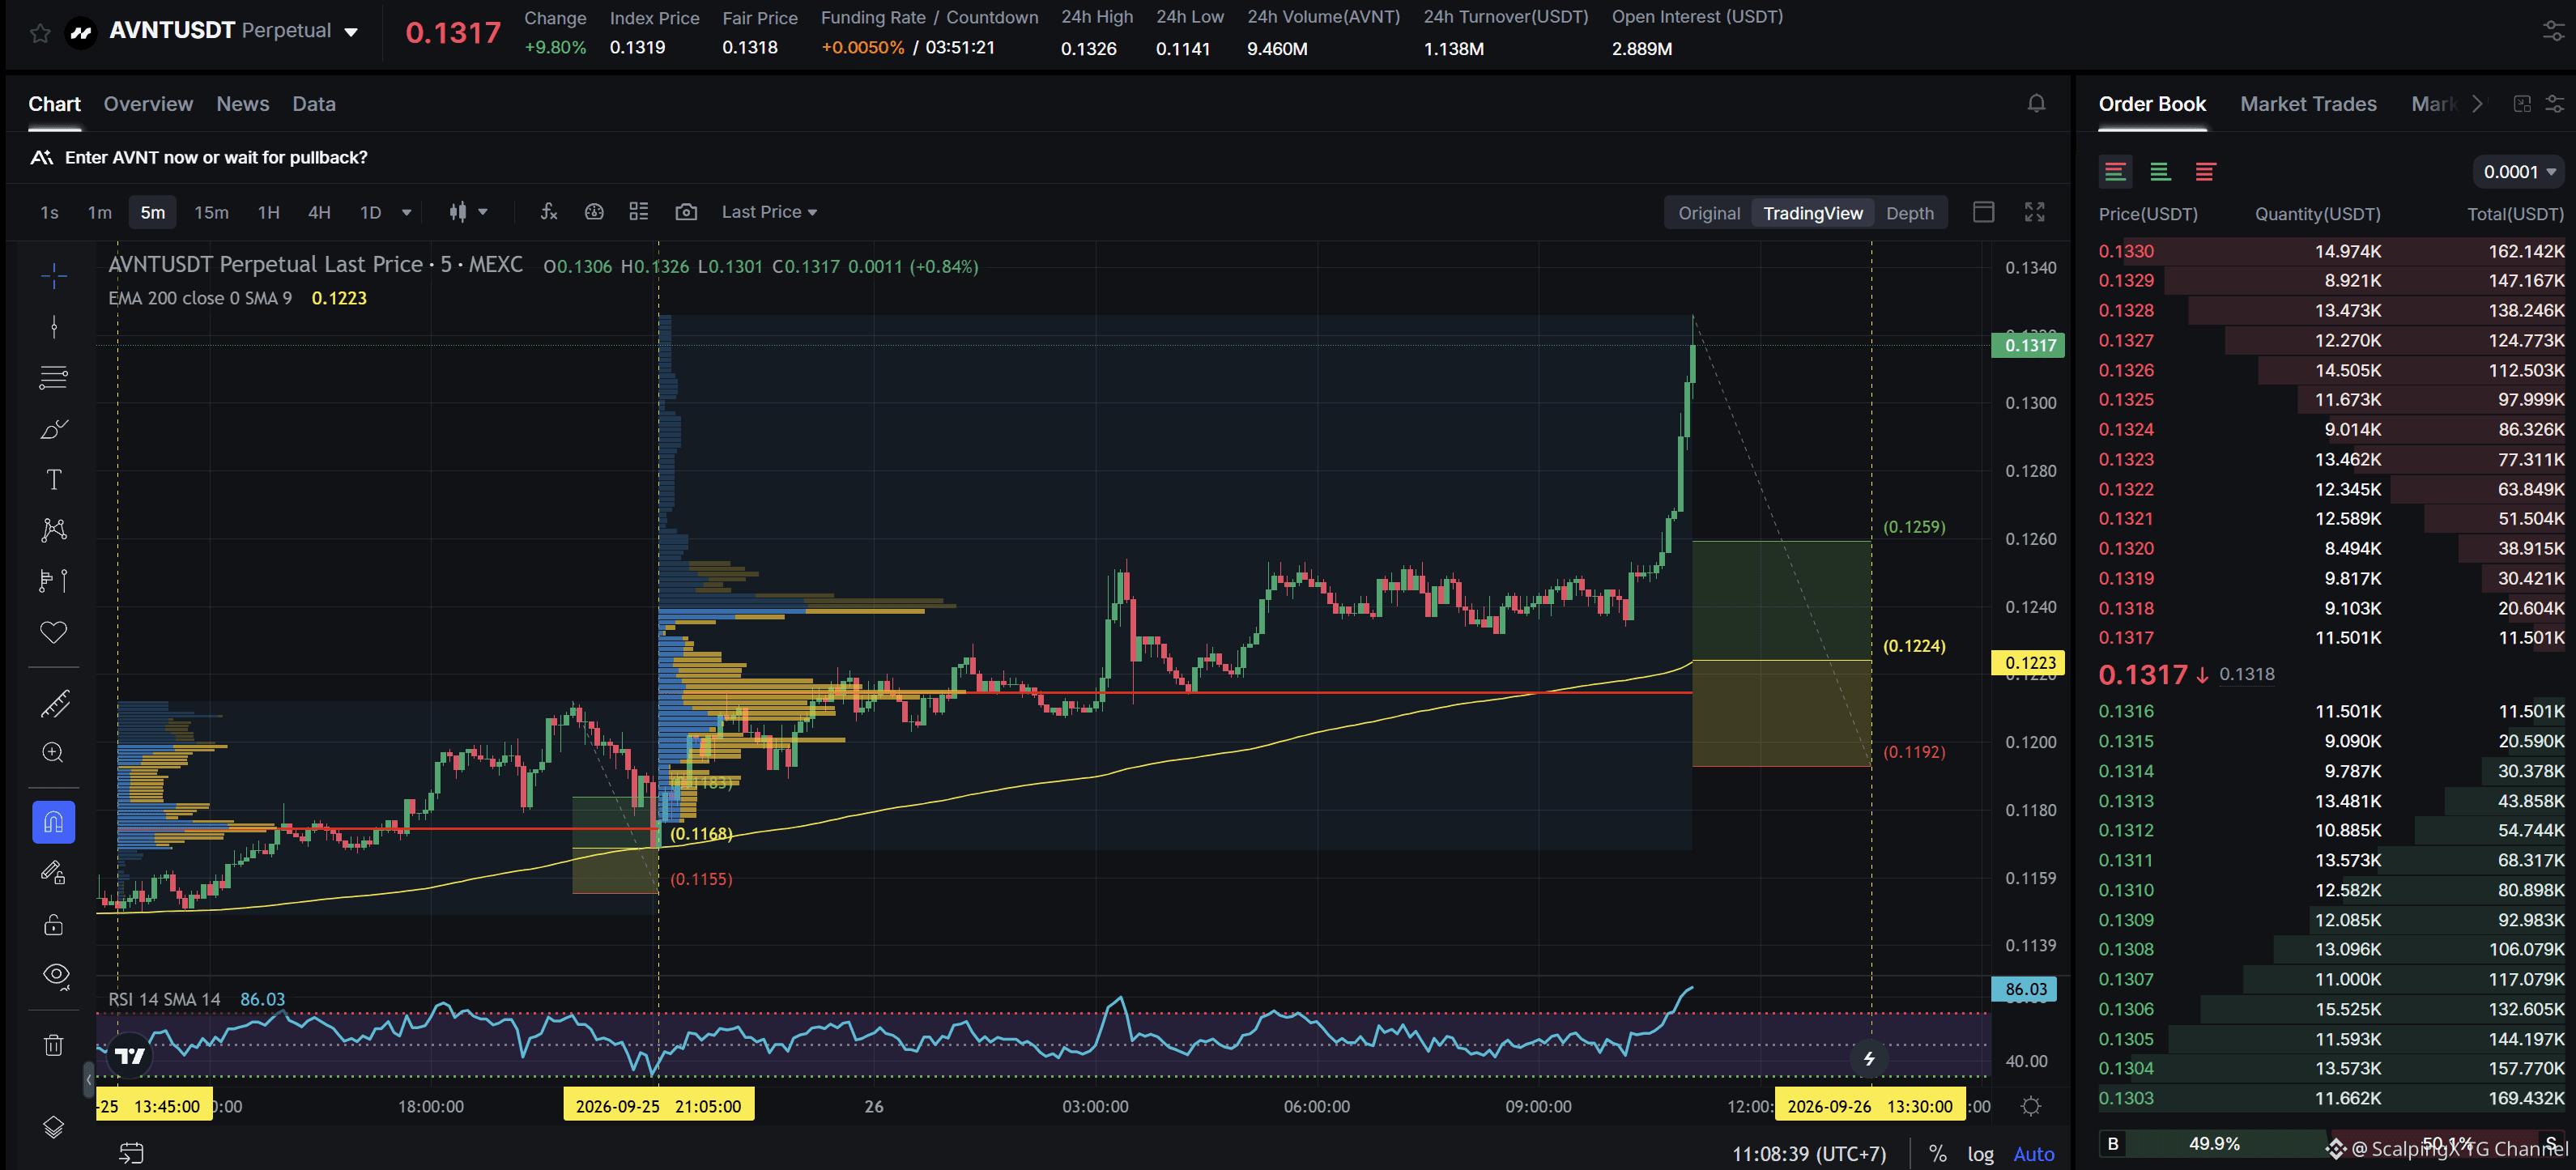
$AVNT - Mcap 47.11M$ - 24h Sentimento +6.00 Touro SC02 M5 - pendente Ordem Longa. A entrada contém POC + atende a uma simplificação positiva com uma ordem Longa anteriormente altamente lucrativa, a zona de suporte atual tem aproximadamente 2,65% de largura. A tendência de alta durou 14 horas, com um aumento máximo de preço registrado de 14,03%. Se o preço perder essa zona de suporte, a tendência tem alta probabilidade de reverter para baixo.
$AVNT - Mcap 47.11M$ - 24h Sentimento +6.00 Touro SC02 M5 - pendente Ordem Longa. A entrada contém POC + atende a uma simplificação positiva com uma ordem Longa anteriormente altamente lucrativa, a zona de suporte atual tem aproximadamente 2,65% de largura. A tendência de alta durou 14 horas, com um aumento máximo de preço registrado de 14,03%. Se o preço perder essa zona de suporte, a tendência tem alta probabilidade de reverter para baixo.
2
USD fecha em alta semanal consecutiva pela segunda vez à medida que os rendimentos dos EUA e as expectativas para o Fed sobem
💵 O USD permaneceu dominante durante a semana de 21 a 25 de setembro, com o DXY subindo de cerca de 100,2–100,4 para quase 101,40, seu maior nível em aproximadamente dois meses, antes de recuar de volta para perto de 101 ao final da semana. O movimento foi impulsionado principalmente por uma nova precificação mais ampla de uma postura mais hawkish do Fed, e não por um único evento.
📈 Os dados do US flash PMI de setembro se destacaram, com o índice Composto subindo para 58,4, Serviços chegando a 58,7 e Manufatura em 57,0. O crescimento mais forte, junto com custos de insumos mais altos, levou os mercados a precificar uma maior probabilidade de mais um aumento de juros pelo Fed em outubro, além de impulsionar os rendimentos dos Treasuries dos EUA para cima.
🌍 Condições econômicas divergentes também deram suporte ao dólar. O PMI da Zona do Euro melhorou, ajudando o EUR a segurar-se relativamente melhor, enquanto a GBP sofreu pressão com dados mais fracos do Reino Unido. O AUD e o CAD também enfraqueceram, já que a força ampla do USD superou o suporte das expectativas do RBA e os movimentos dos preços do petróleo.
🇯🇵 O JPY foi a principal exceção no fim da semana. USD/JPY se aproximou de 159 antes de cair acentuadamente, à medida que sinais do Japão reforçaram as preocupações sobre a fraqueza excessiva do iene e mantiveram o risco de intervenção em foco. O repique do iene ajudou o DXY a arrefecer na sexta-feira, mas não alterou a tendência semanal mais ampla.
🛢️ Preços do petróleo elevados e tensões no Oriente Médio continuaram a aumentar a pressão inflacionária global, reforçando o argumento para rendimentos mais altos nos EUA. No entanto, a retração do petróleo no fim da semana também mostrou que os ganhos do USD podem enfrentar correções temporárias à medida que as expectativas geopolíticas mudam.
📅 Agora, a atenção se volta para a decisão do RBA em 29 de setembro e a inflação do PCE dos EUA em 30 de setembro. Se a inflação dos EUA permanecer firme, os rendimentos e o dólar podem continuar sustentados; uma leitura de PCE mais suave do que o esperado daria mais espaço para uma recuperação técnica em moedas que foram muito vendidas.
#ForexInsights
$BTC
USD fecha em alta semanal consecutiva pela segunda vez à medida que os rendimentos dos EUA e as expectativas para o Fed sobem
💵 O USD permaneceu dominante durante a semana de 21 a 25 de setembro, com o DXY subindo de cerca de 100,2–100,4 para quase 101,40, seu maior nível em aproximadamente dois meses, antes de recuar de volta para perto de 101 ao final da semana. O movimento foi impulsionado principalmente por uma nova precificação mais ampla de uma postura mais hawkish do Fed, e não por um único evento.
📈 Os dados do US flash PMI de setembro se destacaram, com o índice Composto subindo para 58,4, Serviços chegando a 58,7 e Manufatura em 57,0. O crescimento mais forte, junto com custos de insumos mais altos, levou os mercados a precificar uma maior probabilidade de mais um aumento de juros pelo Fed em outubro, além de impulsionar os rendimentos dos Treasuries dos EUA para cima.
🌍 Condições econômicas divergentes também deram suporte ao dólar. O PMI da Zona do Euro melhorou, ajudando o EUR a segurar-se relativamente melhor, enquanto a GBP sofreu pressão com dados mais fracos do Reino Unido. O AUD e o CAD também enfraqueceram, já que a força ampla do USD superou o suporte das expectativas do RBA e os movimentos dos preços do petróleo.
🇯🇵 O JPY foi a principal exceção no fim da semana. USD/JPY se aproximou de 159 antes de cair acentuadamente, à medida que sinais do Japão reforçaram as preocupações sobre a fraqueza excessiva do iene e mantiveram o risco de intervenção em foco. O repique do iene ajudou o DXY a arrefecer na sexta-feira, mas não alterou a tendência semanal mais ampla.
🛢️ Preços do petróleo elevados e tensões no Oriente Médio continuaram a aumentar a pressão inflacionária global, reforçando o argumento para rendimentos mais altos nos EUA. No entanto, a retração do petróleo no fim da semana também mostrou que os ganhos do USD podem enfrentar correções temporárias à medida que as expectativas geopolíticas mudam.
📅 Agora, a atenção se volta para a decisão do RBA em 29 de setembro e a inflação do PCE dos EUA em 30 de setembro. Se a inflação dos EUA permanecer firme, os rendimentos e o dólar podem continuar sustentados; uma leitura de PCE mais suave do que o esperado daria mais espaço para uma recuperação técnica em moedas que foram muito vendidas.
#ForexInsights
$BTC
💵 O USD permaneceu dominante durante a semana de 21 a 25 de setembro, com o DXY subindo de cerca de 100,2–100,4 para quase 101,40, seu maior nível em aproximadamente dois meses, antes de recuar de volta para perto de 101 ao final da semana. O movimento foi impulsionado principalmente por uma nova precificação mais ampla de uma postura mais hawkish do Fed, e não por um único evento.
📈 Os dados do US flash PMI de setembro se destacaram, com o índice Composto subindo para 58,4, Serviços chegando a 58,7 e Manufatura em 57,0. O crescimento mais forte, junto com custos de insumos mais altos, levou os mercados a precificar uma maior probabilidade de mais um aumento de juros pelo Fed em outubro, além de impulsionar os rendimentos dos Treasuries dos EUA para cima.
🌍 Condições econômicas divergentes também deram suporte ao dólar. O PMI da Zona do Euro melhorou, ajudando o EUR a segurar-se relativamente melhor, enquanto a GBP sofreu pressão com dados mais fracos do Reino Unido. O AUD e o CAD também enfraqueceram, já que a força ampla do USD superou o suporte das expectativas do RBA e os movimentos dos preços do petróleo.
🇯🇵 O JPY foi a principal exceção no fim da semana. USD/JPY se aproximou de 159 antes de cair acentuadamente, à medida que sinais do Japão reforçaram as preocupações sobre a fraqueza excessiva do iene e mantiveram o risco de intervenção em foco. O repique do iene ajudou o DXY a arrefecer na sexta-feira, mas não alterou a tendência semanal mais ampla.
🛢️ Preços do petróleo elevados e tensões no Oriente Médio continuaram a aumentar a pressão inflacionária global, reforçando o argumento para rendimentos mais altos nos EUA. No entanto, a retração do petróleo no fim da semana também mostrou que os ganhos do USD podem enfrentar correções temporárias à medida que as expectativas geopolíticas mudam.
📅 Agora, a atenção se volta para a decisão do RBA em 29 de setembro e a inflação do PCE dos EUA em 30 de setembro. Se a inflação dos EUA permanecer firme, os rendimentos e o dólar podem continuar sustentados; uma leitura de PCE mais suave do que o esperado daria mais espaço para uma recuperação técnica em moedas que foram muito vendidas.
#ForexInsights
$BTC

1
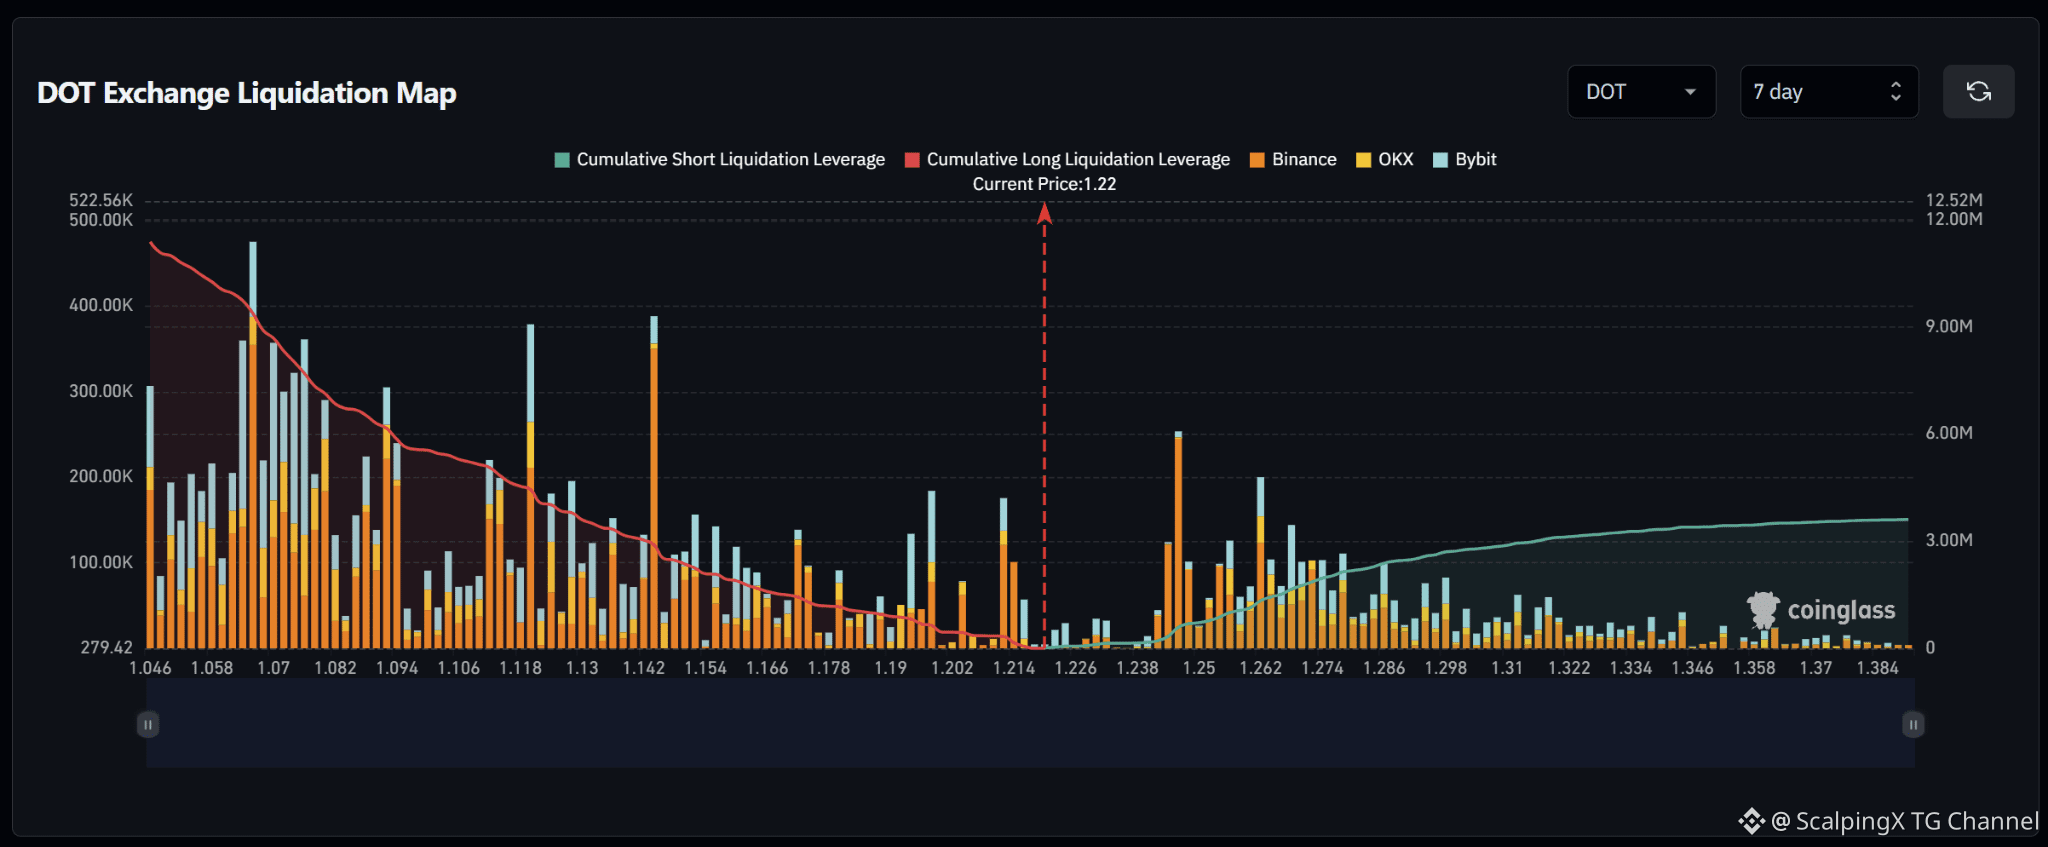
$DOT – Mapa de Liquidações (7 Dias) – Preço Atual 1.22 🔎 O mapa de liquidações de 7 dias mostra aproximadamente 11,5–12 milhões de USD em liquidações longas abaixo do preço atual, muito acima de cerca de 3 milhões de USD em liquidações curtas acima. A estrutura de liquidez, portanto, favorece fortemente a queda, com quase quatro vezes mais liquidez acumulada abaixo do mercado. 📉 Abaixo do mercado, a liquidez de liquidações longas está concentrada de forma pesada entre 1.06–1.15. O cluster mais forte fica em torno de 1.066–1.070, com uma barra perto de 0,48 milhão de USD; as áreas de 1.118–1.120 e 1.142–1.144 também contêm barras por volta de 0,38–0,39 milhão de USD. Perder 1.214 faria a atenção se deslocar para 1.202–1.190 e depois para 1.178–1.166. 📈 Acima do mercado, a liquidez de liquidações curtas é bem mais fina. O cluster mais notável fica em torno de 1.248–1.250, com uma barra perto de 0,25 milhão de USD, enquanto 1.262 e 1.274 mantêm bolsões adicionais em torno de 0,10–0,20 milhão de USD. Acima de 1.30, a densidade de liquidez diminui gradualmente. 🧭 A configuração mais ampla claramente favorece a queda porque a exposição a liquidações longas abaixo domina. Perder 1.214 aumentaria a probabilidade de uma varredura em direção a 1.202–1.190, seguida por 1.178–1.166. Romper acima de 1.238, em vez disso, exporia 1.248–1.262 antes que a atenção se volte para 1.274.
$DOT – Mapa de Liquidações (7 Dias) – Preço Atual 1.22 🔎 O mapa de liquidações de 7 dias mostra aproximadamente 11,5–12 milhões de USD em liquidações longas abaixo do preço atual, muito acima de cerca de 3 milhões de USD em liquidações curtas acima. A estrutura de liquidez, portanto, favorece fortemente a queda, com quase quatro vezes mais liquidez acumulada abaixo do mercado. 📉 Abaixo do mercado, a liquidez de liquidações longas está concentrada de forma pesada entre 1.06–1.15. O cluster mais forte fica em torno de 1.066–1.070, com uma barra perto de 0,48 milhão de USD; as áreas de 1.118–1.120 e 1.142–1.144 também contêm barras por volta de 0,38–0,39 milhão de USD. Perder 1.214 faria a atenção se deslocar para 1.202–1.190 e depois para 1.178–1.166. 📈 Acima do mercado, a liquidez de liquidações curtas é bem mais fina. O cluster mais notável fica em torno de 1.248–1.250, com uma barra perto de 0,25 milhão de USD, enquanto 1.262 e 1.274 mantêm bolsões adicionais em torno de 0,10–0,20 milhão de USD. Acima de 1.30, a densidade de liquidez diminui gradualmente. 🧭 A configuração mais ampla claramente favorece a queda porque a exposição a liquidações longas abaixo domina. Perder 1.214 aumentaria a probabilidade de uma varredura em direção a 1.202–1.190, seguida por 1.178–1.166. Romper acima de 1.238, em vez disso, exporia 1.248–1.262 antes que a atenção se volte para 1.274.
1
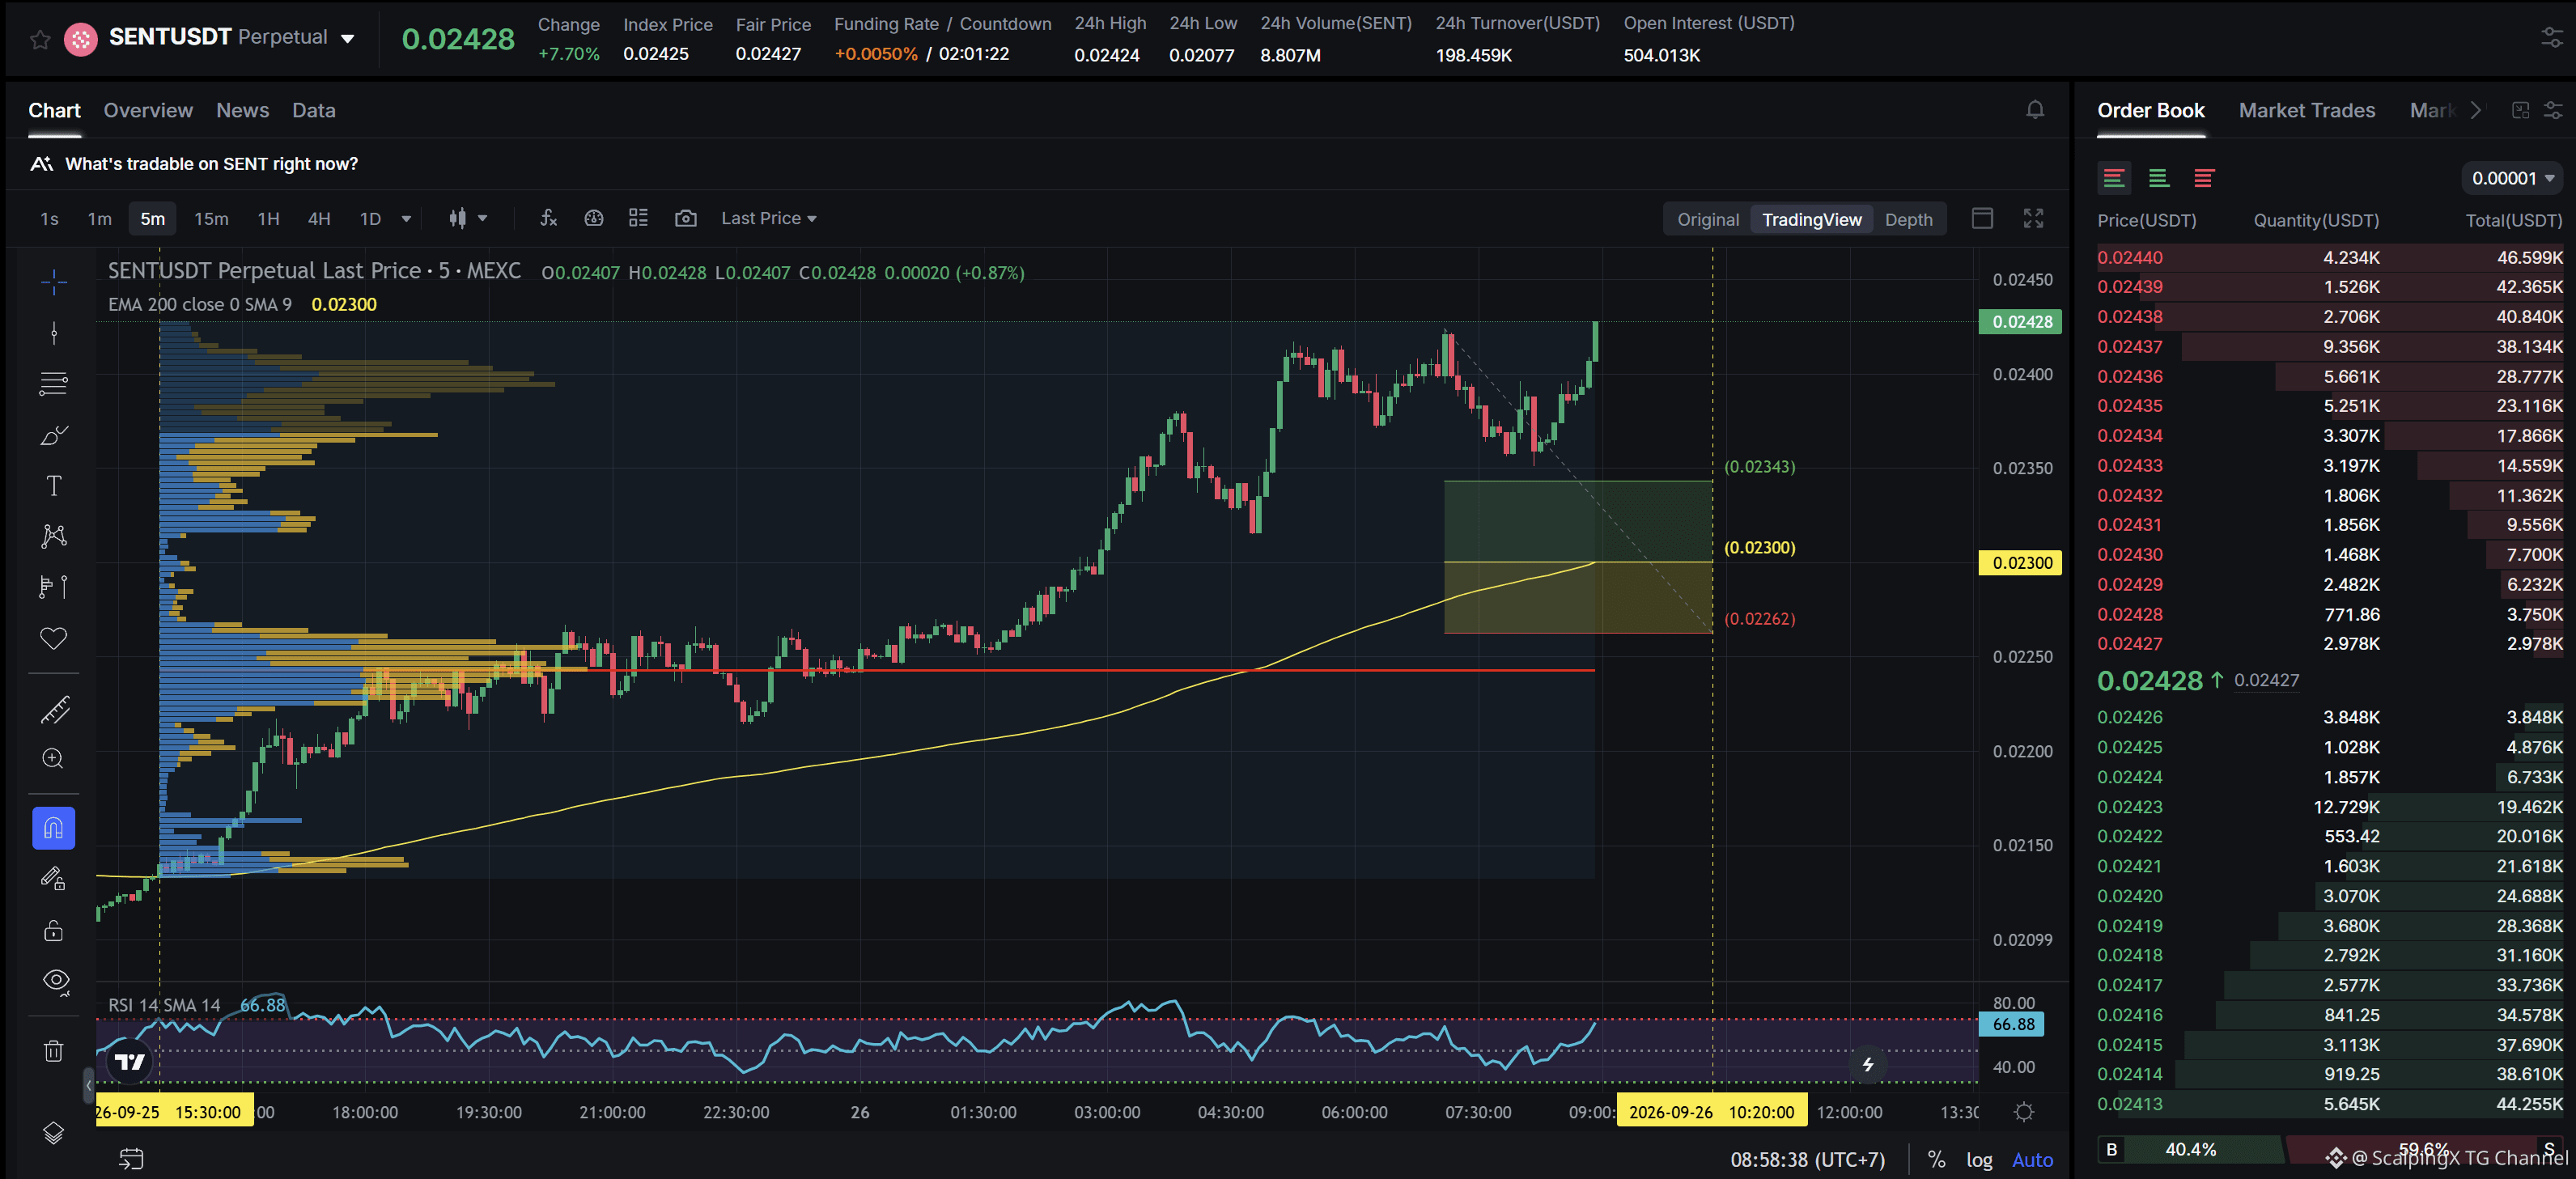
$SENT - Mcap 172.9M$ - Sentimento 24h +6.00 Touro SC02 M5 - pendente Ordem de compra. A entrada fica dentro do HVN e não é afetada por nenhuma zona fraca; a zona de suporte atual tem aproximadamente 1,67% de largura. A tendência de alta durou 17 horas e 30 minutos, com a maior alta registrada de 13,91%. Se o preço perder essa zona de suporte, a tendência tem grande probabilidade de reverter para baixo.
$SENT - Mcap 172.9M$ - Sentimento 24h +6.00 Touro SC02 M5 - pendente Ordem de compra. A entrada fica dentro do HVN e não é afetada por nenhuma zona fraca; a zona de suporte atual tem aproximadamente 1,67% de largura. A tendência de alta durou 17 horas e 30 minutos, com a maior alta registrada de 13,91%. Se o preço perder essa zona de suporte, a tendência tem grande probabilidade de reverter para baixo.
27
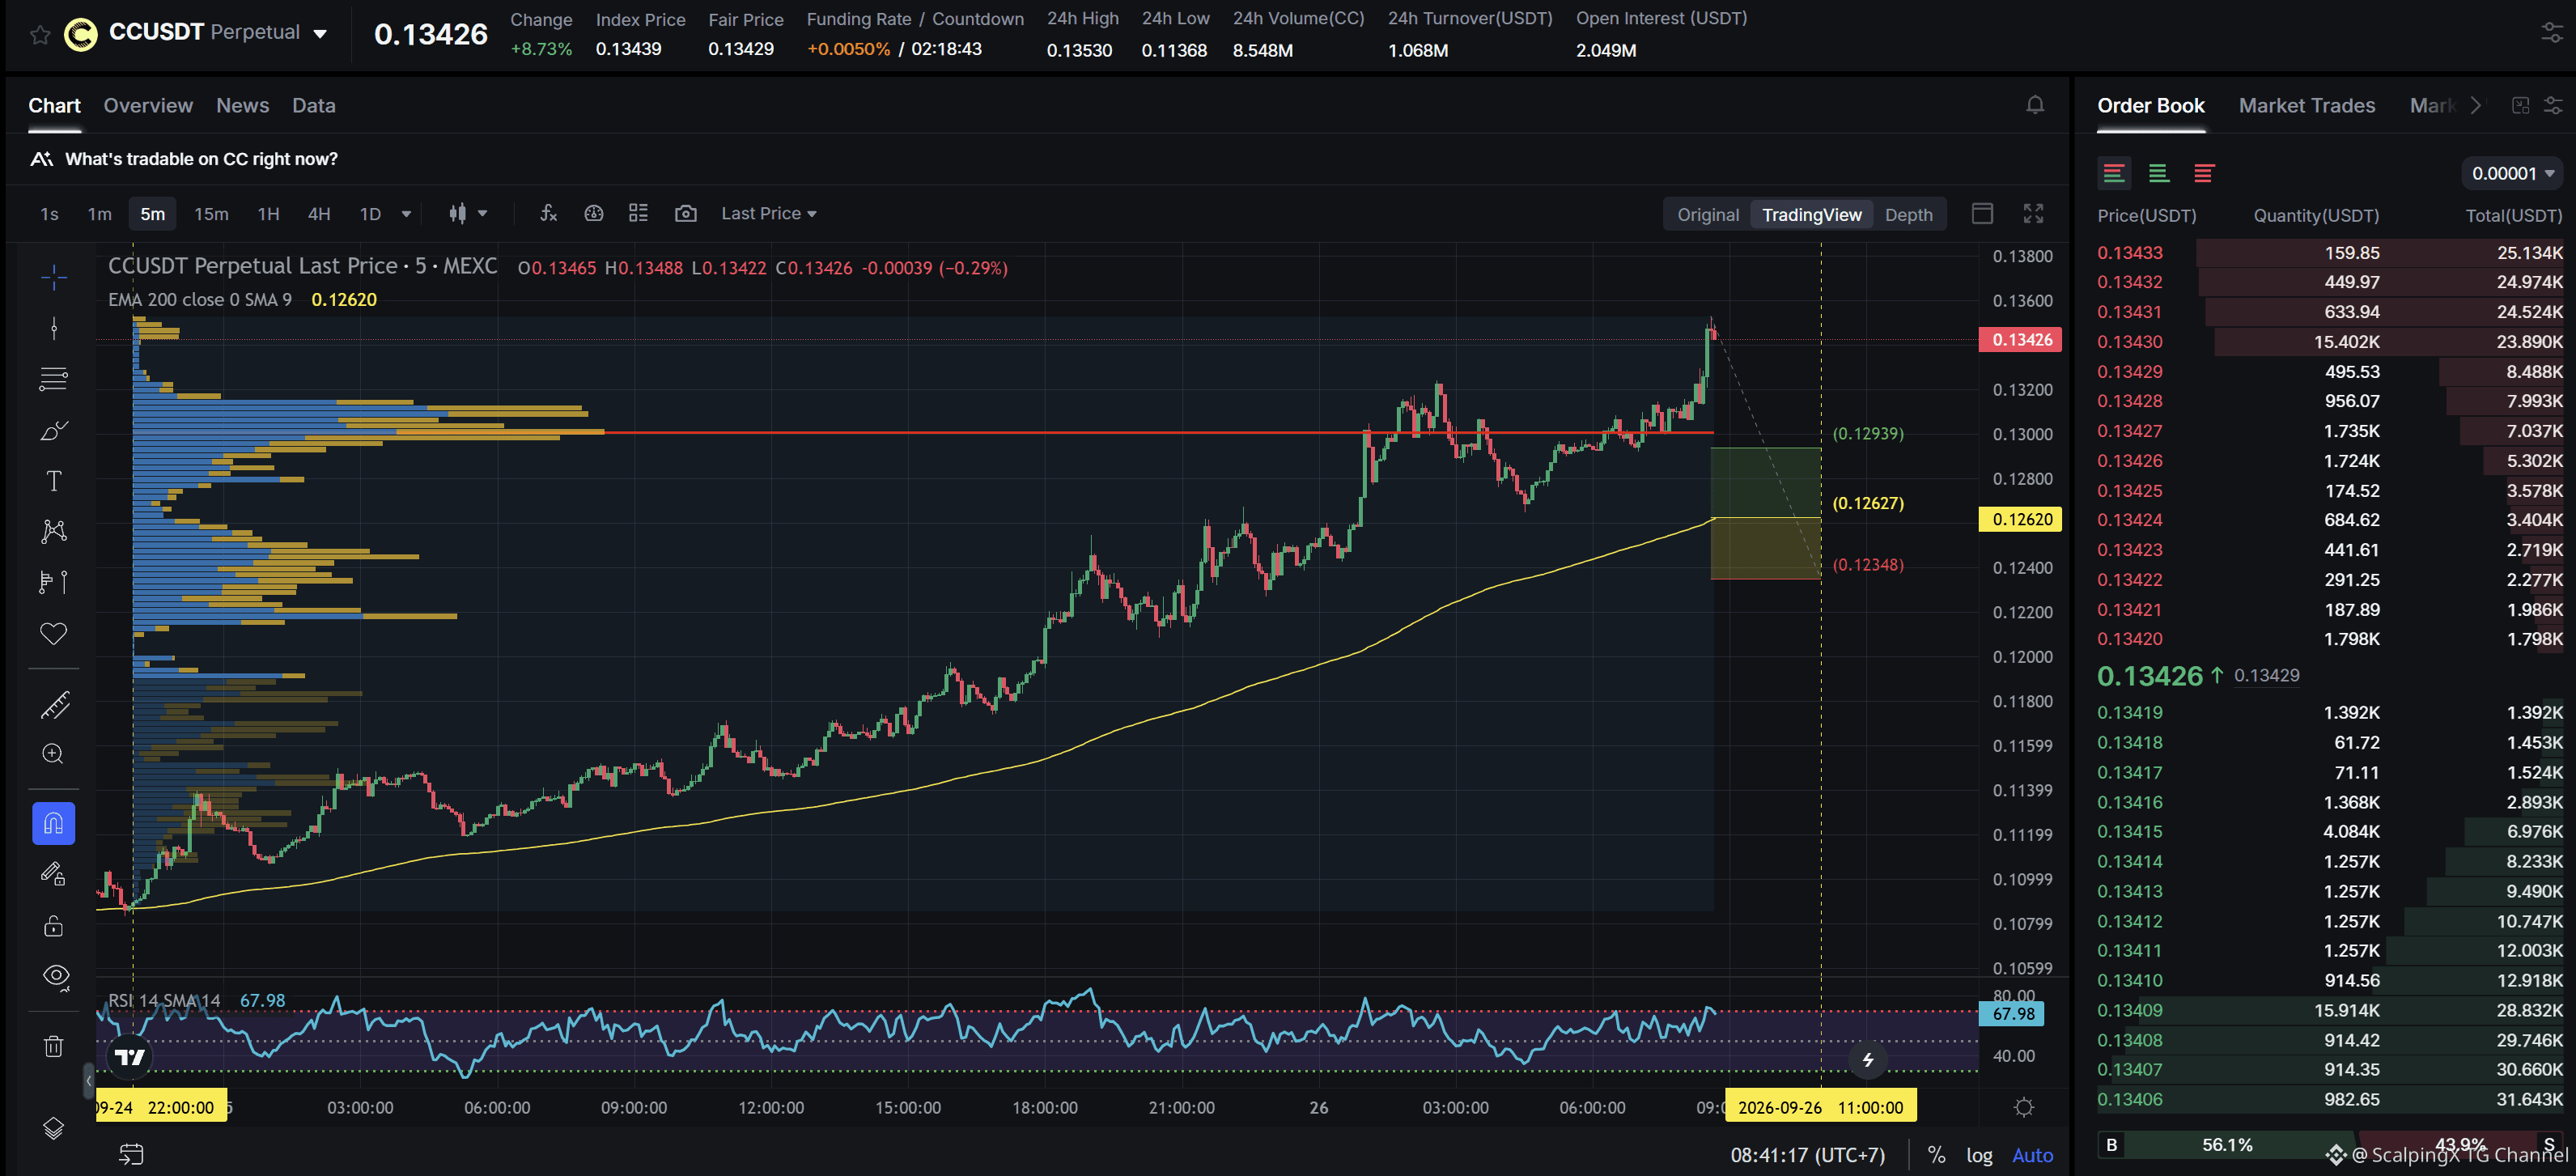
$CC - Cap 5,33B$ - 24h Sentimento +4,67 Touro SC02 M5 - pendente Ordem Longa. A entrada fica dentro da HVN + não é afetada por nenhuma zona fraca; a zona de suporte atual tem aproximadamente 2,17% de largura. A tendência de alta durou 1 dia 10 horas e 40 minutos, com um aumento máximo de preço registrado de 24,41%. Se o preço perder esta zona de suporte, a tendência tem alta probabilidade de reverter para baixo.
$CC - Cap 5,33B$ - 24h Sentimento +4,67 Touro SC02 M5 - pendente Ordem Longa. A entrada fica dentro da HVN + não é afetada por nenhuma zona fraca; a zona de suporte atual tem aproximadamente 2,17% de largura. A tendência de alta durou 1 dia 10 horas e 40 minutos, com um aumento máximo de preço registrado de 24,41%. Se o preço perder esta zona de suporte, a tendência tem alta probabilidade de reverter para baixo.
27
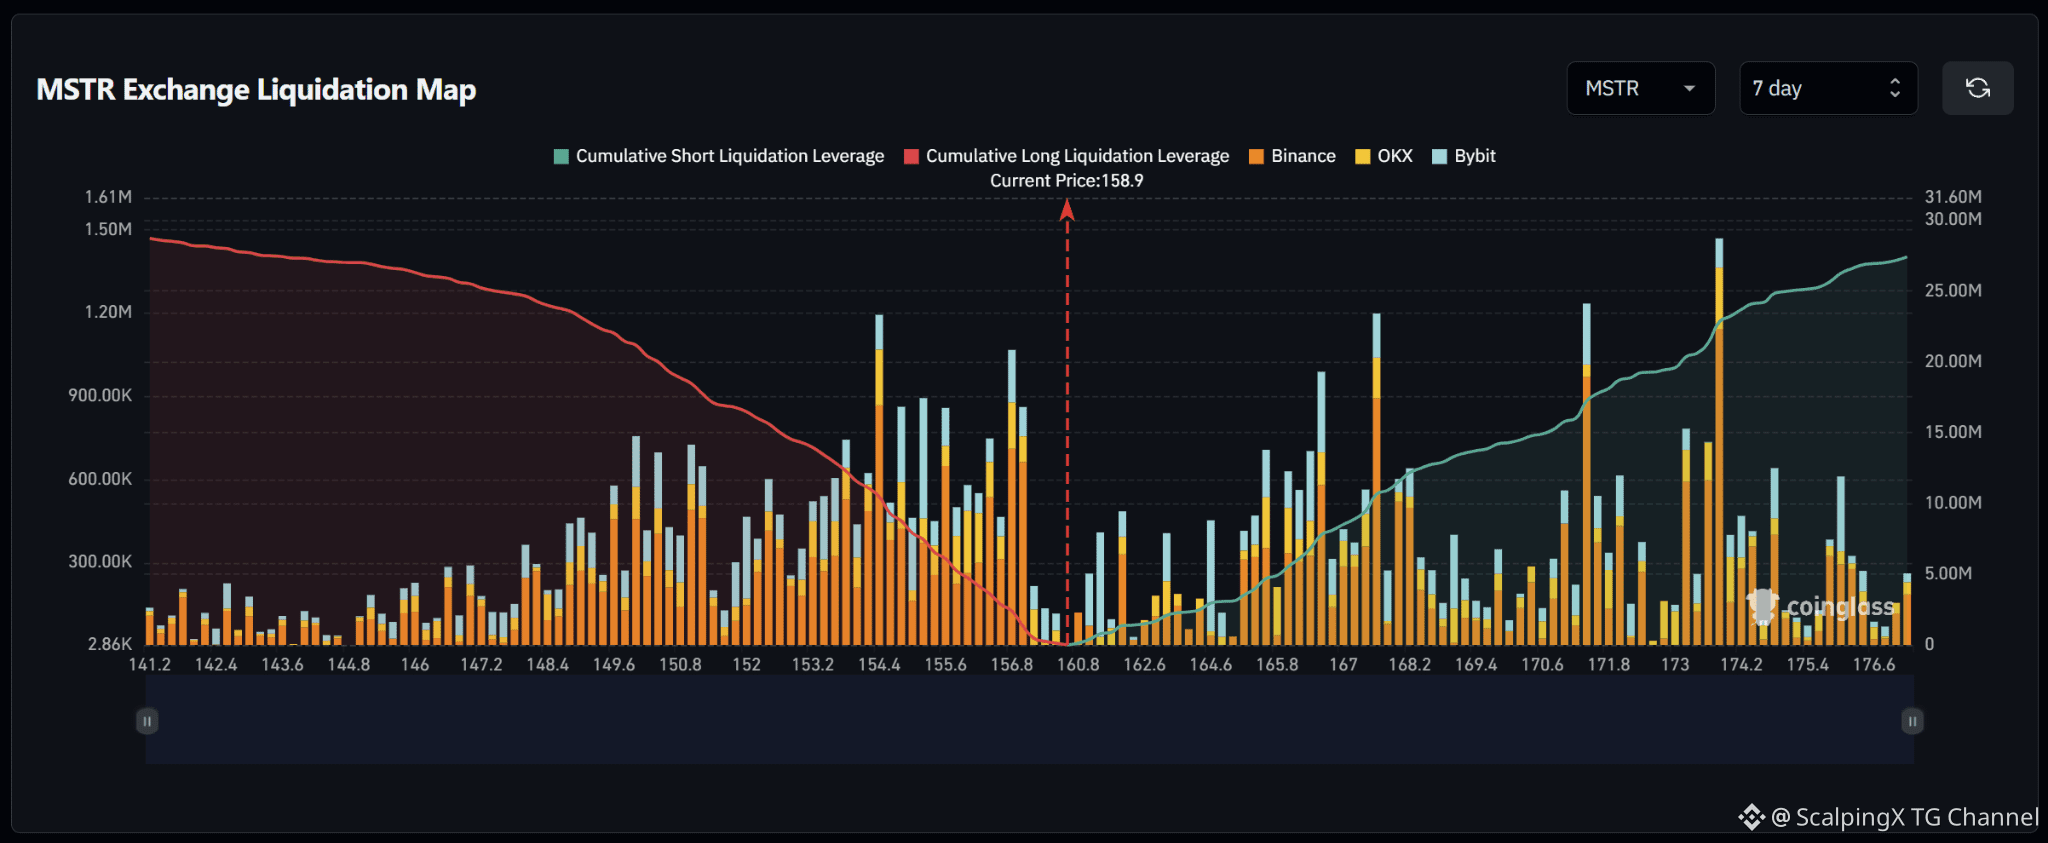
$MSTR – Mapa de Liquidações (7 Dias) – Preço Atual 158,9 🔎 O mapa de liquidações de 7 dias mostra aproximadamente 28–29 milhões de USD em liquidações long abaixo do preço atual, ligeiramente acima de cerca de 26–27 milhões de USD em liquidações curtas acima. A estrutura de liquidez, portanto, está relativamente equilibrada, com uma leve inclinação para baixo. 📉 Abaixo do mercado, a liquidez de liquidações long está concentrada fortemente entre 153–157. Um grande agrupamento fica por volta de 154,4, com uma barra perto de 1,2 milhão de USD; a faixa 155–156 contém várias barras em torno de 0,8–0,9 milhão de USD, enquanto 156,7–157,0 mantém outro agrupamento acima de 1 milhão de USD. Perder 156,5 faria a atenção se voltar para 155–154 e depois 152–150. 📈 Acima do mercado, a liquidez de liquidações curtas está distribuída fortemente entre 165–174. Grandes agrupamentos aparecem por volta de 167–168 com uma barra perto de 1,2 milhão de USD, 171–172 com uma barra acima de 1,2 milhão de USD e, especialmente, 173–174 com uma barra perto de 1,5 milhão de USD. Esta é a zona de liquidez mais proeminente acima do mercado. 🧭 A configuração mais ampla está perto do equilíbrio, mas com uma leve inclinação para baixo. Perder 156,5 aumentaria a probabilidade de um varrimento em direção a 155–154, seguido por 152–150. Romper acima de 162–164, por outro lado, exporia 167–168 e depois 171–174.
$MSTR – Mapa de Liquidações (7 Dias) – Preço Atual 158,9 🔎 O mapa de liquidações de 7 dias mostra aproximadamente 28–29 milhões de USD em liquidações long abaixo do preço atual, ligeiramente acima de cerca de 26–27 milhões de USD em liquidações curtas acima. A estrutura de liquidez, portanto, está relativamente equilibrada, com uma leve inclinação para baixo. 📉 Abaixo do mercado, a liquidez de liquidações long está concentrada fortemente entre 153–157. Um grande agrupamento fica por volta de 154,4, com uma barra perto de 1,2 milhão de USD; a faixa 155–156 contém várias barras em torno de 0,8–0,9 milhão de USD, enquanto 156,7–157,0 mantém outro agrupamento acima de 1 milhão de USD. Perder 156,5 faria a atenção se voltar para 155–154 e depois 152–150. 📈 Acima do mercado, a liquidez de liquidações curtas está distribuída fortemente entre 165–174. Grandes agrupamentos aparecem por volta de 167–168 com uma barra perto de 1,2 milhão de USD, 171–172 com uma barra acima de 1,2 milhão de USD e, especialmente, 173–174 com uma barra perto de 1,5 milhão de USD. Esta é a zona de liquidez mais proeminente acima do mercado. 🧭 A configuração mais ampla está perto do equilíbrio, mas com uma leve inclinação para baixo. Perder 156,5 aumentaria a probabilidade de um varrimento em direção a 155–154, seguido por 152–150. Romper acima de 162–164, por outro lado, exporia 167–168 e depois 171–174.
41
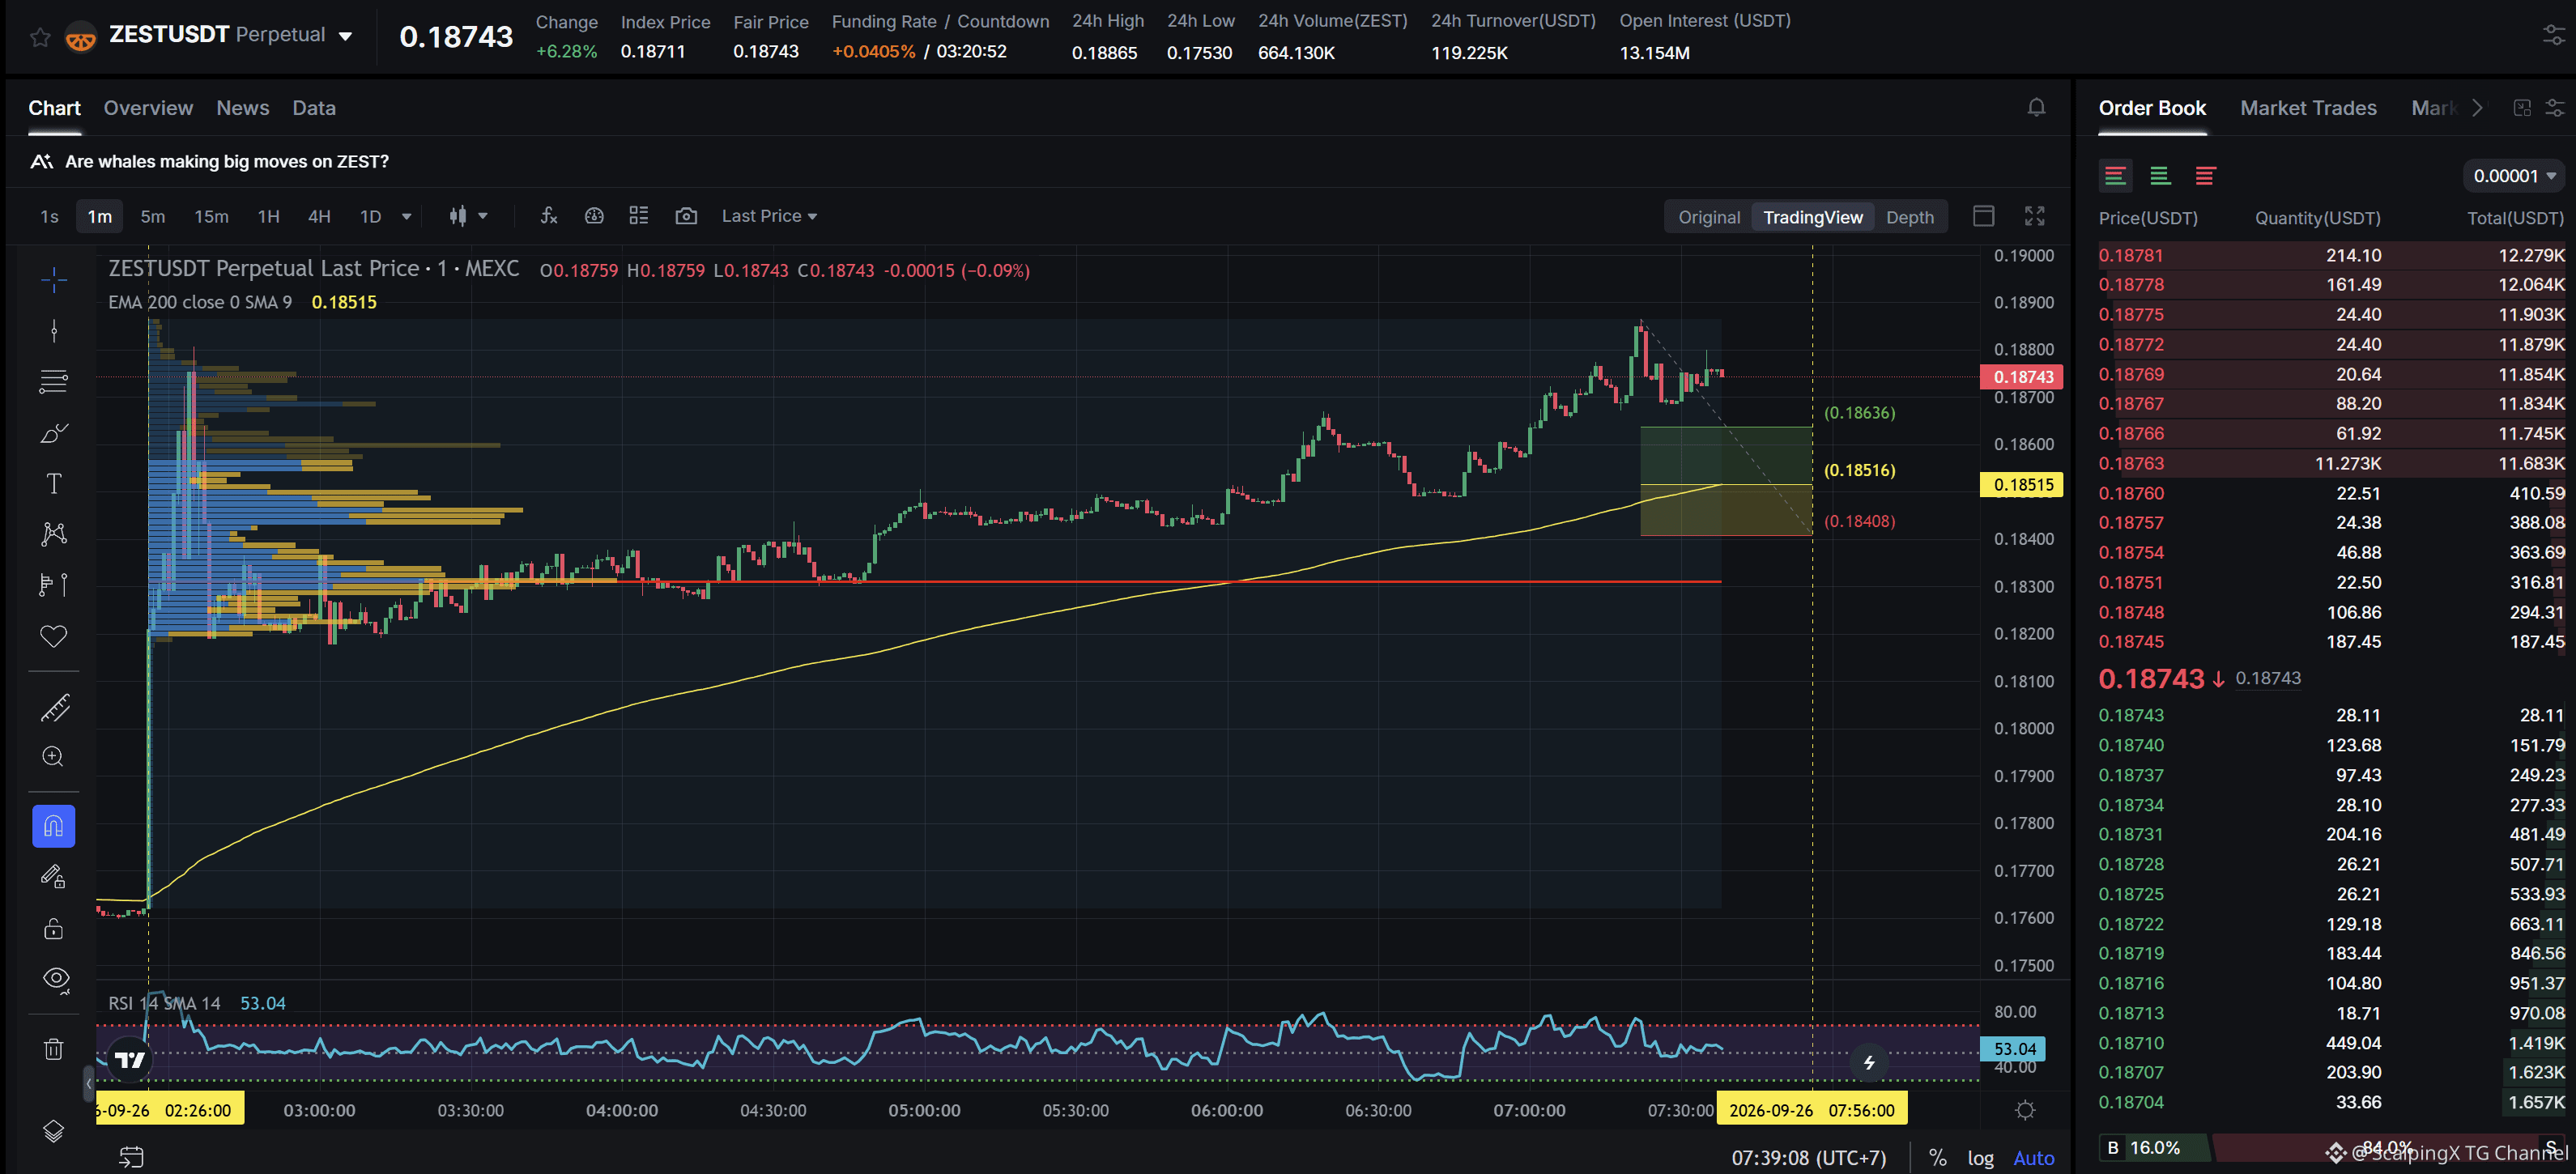
$ZEST - Mcap 27.34M$ - 24h Sentimento +6.00 Tendente a alta SC02 M1 - pendente Ordem Longa. A entrada fica dentro do HVN e não é afetada por nenhuma zona fraca; a zona de suporte atual tem aproximadamente 0.57% de largura. A tendência de alta dura há 5 horas e 14 minutos, com um aumento máximo registrado de 6.90%. Se o preço perder esta zona de suporte, é altamente provável que a tendência reverta para baixo.
$ZEST - Mcap 27.34M$ - 24h Sentimento +6.00 Tendente a alta SC02 M1 - pendente Ordem Longa. A entrada fica dentro do HVN e não é afetada por nenhuma zona fraca; a zona de suporte atual tem aproximadamente 0.57% de largura. A tendência de alta dura há 5 horas e 14 minutos, com um aumento máximo registrado de 6.90%. Se o preço perder esta zona de suporte, é altamente provável que a tendência reverta para baixo.
50
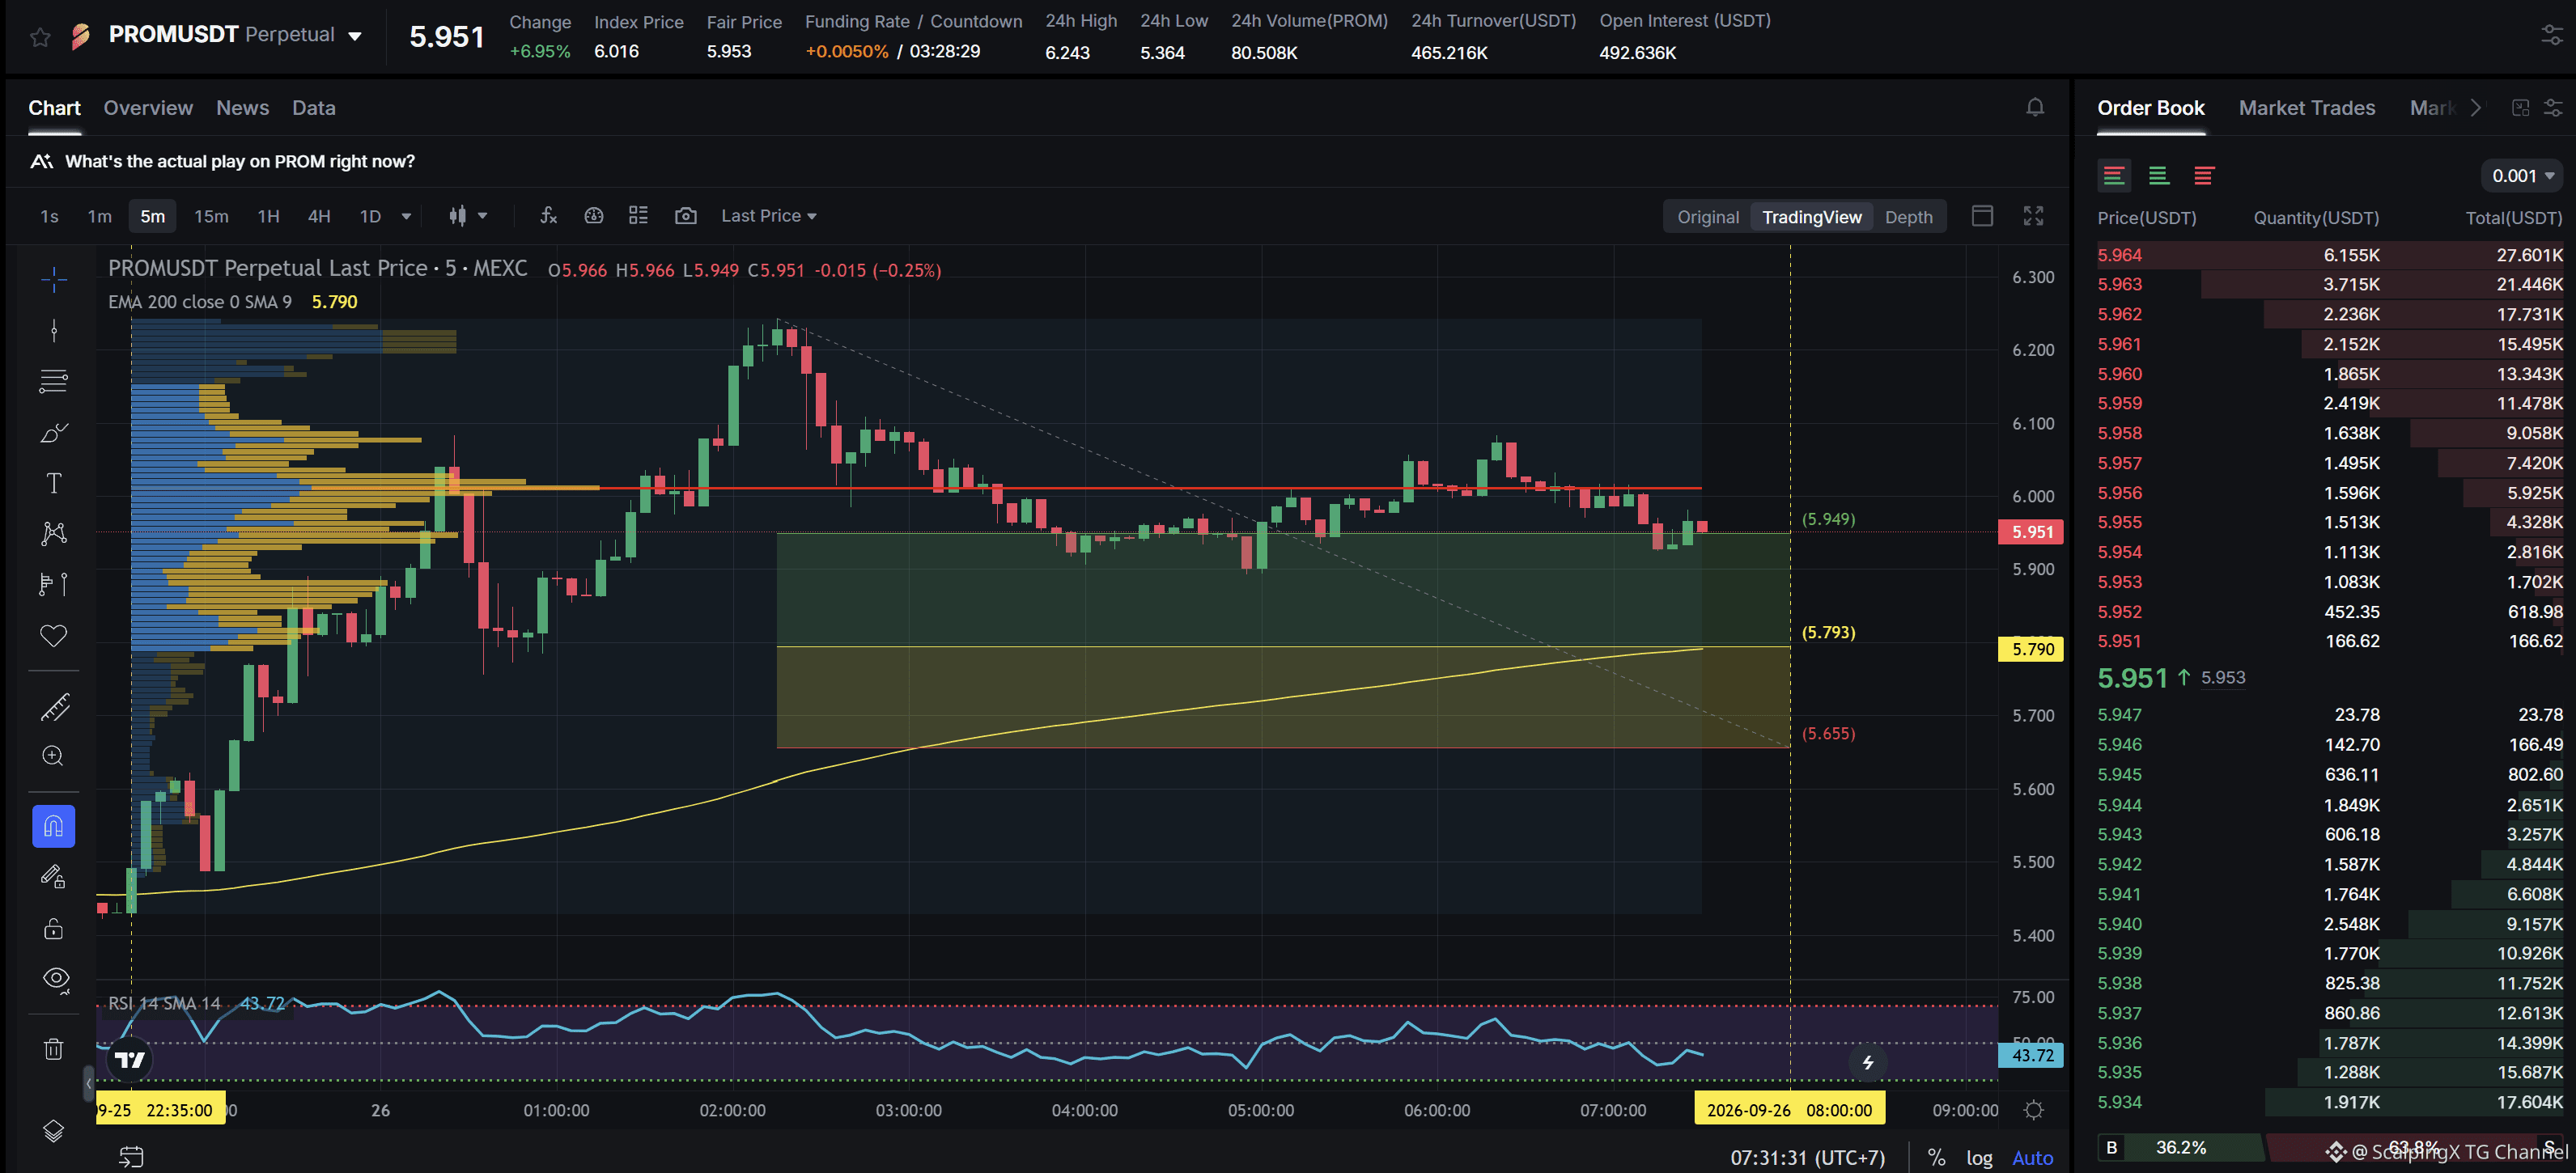
$PROM - Mcap 108,08M$ - Sentimento das últimas 24h +6,18 Tendente a alta SC02 M5 - pendente Long order. A entrada está dentro do LVN e não é afetada por nenhuma zona fraca; a zona de suporte atual tem aproximadamente 2,41% de largura. A tendência de alta durou 8 horas e 55 minutos, com um aumento máximo de preço registrado de 14,39%. Se o preço perder esta zona de suporte, é altamente provável que a tendência se reverta para baixo.
$PROM - Mcap 108,08M$ - Sentimento das últimas 24h +6,18 Tendente a alta SC02 M5 - pendente Long order. A entrada está dentro do LVN e não é afetada por nenhuma zona fraca; a zona de suporte atual tem aproximadamente 2,41% de largura. A tendência de alta durou 8 horas e 55 minutos, com um aumento máximo de preço registrado de 14,39%. Se o preço perder esta zona de suporte, é altamente provável que a tendência se reverta para baixo.
46
Inicia sessão para explorar mais conteúdos
Junta-te a utilizadores de criptomoedas de todo o mundo na Binance Square
⚡️ Obtém informações úteis e recentes sobre criptomoedas.
💬 Com a confiança da maior exchange de criptomoedas do mundo.
👍 Descobre perspetivas reais de criadores verificados.
E-mail/Número de telefone
Tópicos em Tendência
CircleMints500MUSDCOnSolana
120,399 visualizações
2,435 a discutir
#circlemints500musdconsolana 🚨 $500M USDC PUT SOLANA DEFI SOB O MICROSCÓPIO
A Circle adicionou 500 milhões de dólares em USDC à Solana. Esse é um número.. Veja o que os traders realmente precisam observar. 👀
Um salto de 500 milhões de dólares na oferta de USDC não significa automaticamente que existam 500 milhões de dólares de pressão de compra. Não é assim que funciona. A história real é o que acontece em seguida.
🔹 O USDC vai para protocolos de empréstimo?
🔹 A demanda por empréstimos aumenta com mais liquidez entrando?
🔹 As taxas de empréstimo do USDC caem à medida que a oferta cresce?
🔹 Toda essa liquidez de stablecoin eventualmente migra para SOL e outros ativos da Solana?
A Circle diz que o USDC pode ser cunhado com antecedência e mantido antes de entrar na oferta em circulação. Isso significa que o número da manchete é apenas o começo. O fluxo real após a cunhagem importa mais do que o anúncio.
A Jupiter já é uma player na Solana para empréstimos e tomadas de USDC. Então a taxa de utilização e a atividade de empréstimos lá são métricas para acompanhar.
📊 Aqui está meu foco principal:
entradas → utilização no DeFi → aumento da demanda por empréstimos → liquidez em SOL.
Esse valor de 500 milhões de dólares vai ficar parado? Vai entrar no DeFi primeiro?. Então, eventualmente, vai migrar para ativos mais arriscados como SOL, JUP, KMNO?
Os próximos dias podem nos dizer muito sobre como o DeFi da Solana está reagindo a essa injeção.
#solana #crypto #Khan62 #USDC
$KMNO $JUP $ORCA
Khan 62
·6 gostos
·4.8k visualizações
PolymarketBankFailureBetsDrawFDICConcern
110,702 visualizações
2,040 a discutir
BlackRockBuildsTokenizedPortfoliosForOndo
106,409 visualizações
1,457 a discutir