

Disclosure: It is not financial advice
What happened on Friday
On Friday 20 November 2026 the S&P 500 fell 3.7% to 6,910.39 and the Nasdaq Composite lost 5.28% to 22,617.73, according to CNBC. The S&P 500 and the Dow both closed more than 10% below their records, and the Nasdaq-100 briefly traded 20% below its high. Nvidia fell about 14% and AMD more than 13%.
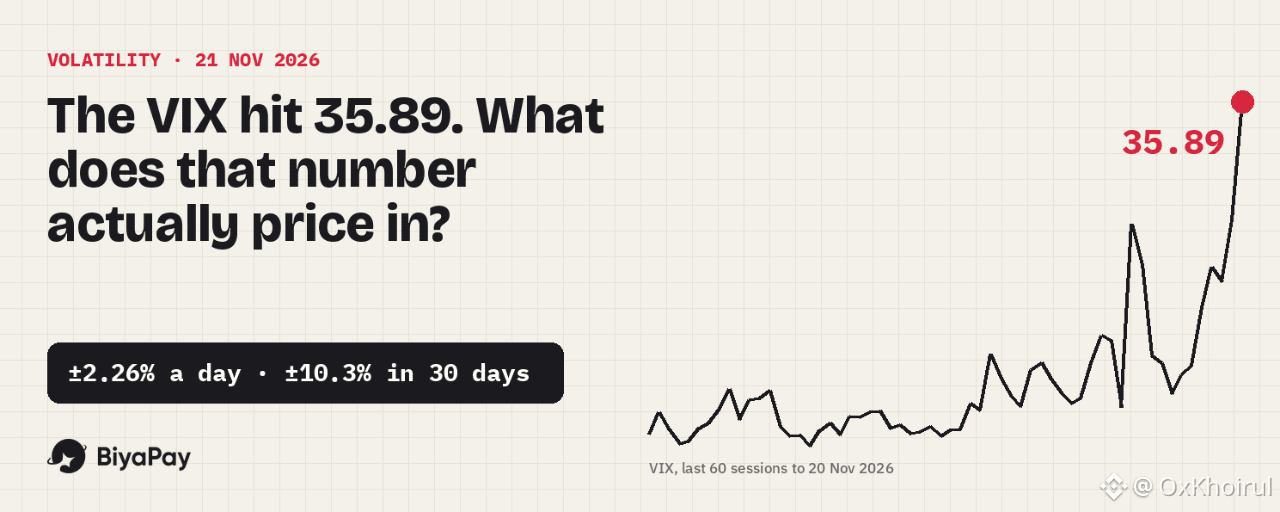
The number that moved the most was the Cboe Volatility Index. The VIX closed at 35.89, up from 28.44 on Thursday and 19.30 a week earlier. During the session it touched 40.03. In Yahoo Finance's daily data, that is the highest close since 11 April 2025.
"Fear index near 36" makes a good headline, but it does not tell you much on its own. I wanted two answers: what the number means in dollars, and what usually happened to the VIX after a reading like this.
What 35.89 means in dollars
The VIX is built from S&P 500 option prices. It expresses the move the options market expects over the next 30 days, as an annualised percentage. Two conversions make it usable:
Daily: divide by √252, which is about 15.87. 35.89 ÷ 15.87 = about 2.26% a day.
30 days: multiply by √(30/365), about 0.287. 35.89 × 0.287 = about 10.3%.
Both are one-standard-deviation figures, so roughly two days out of three should land inside them.
On $10,000 in an S&P 500 fund, that is a ±$226 day and a ±$1,029 month. On the index itself it is about ±156 points a day from 6,910. On 6 October, the day of the record close, the VIX was 15.01, which priced a ±$95 day on the same $10,000. The same position now carries 2.4 times the expected daily swing.
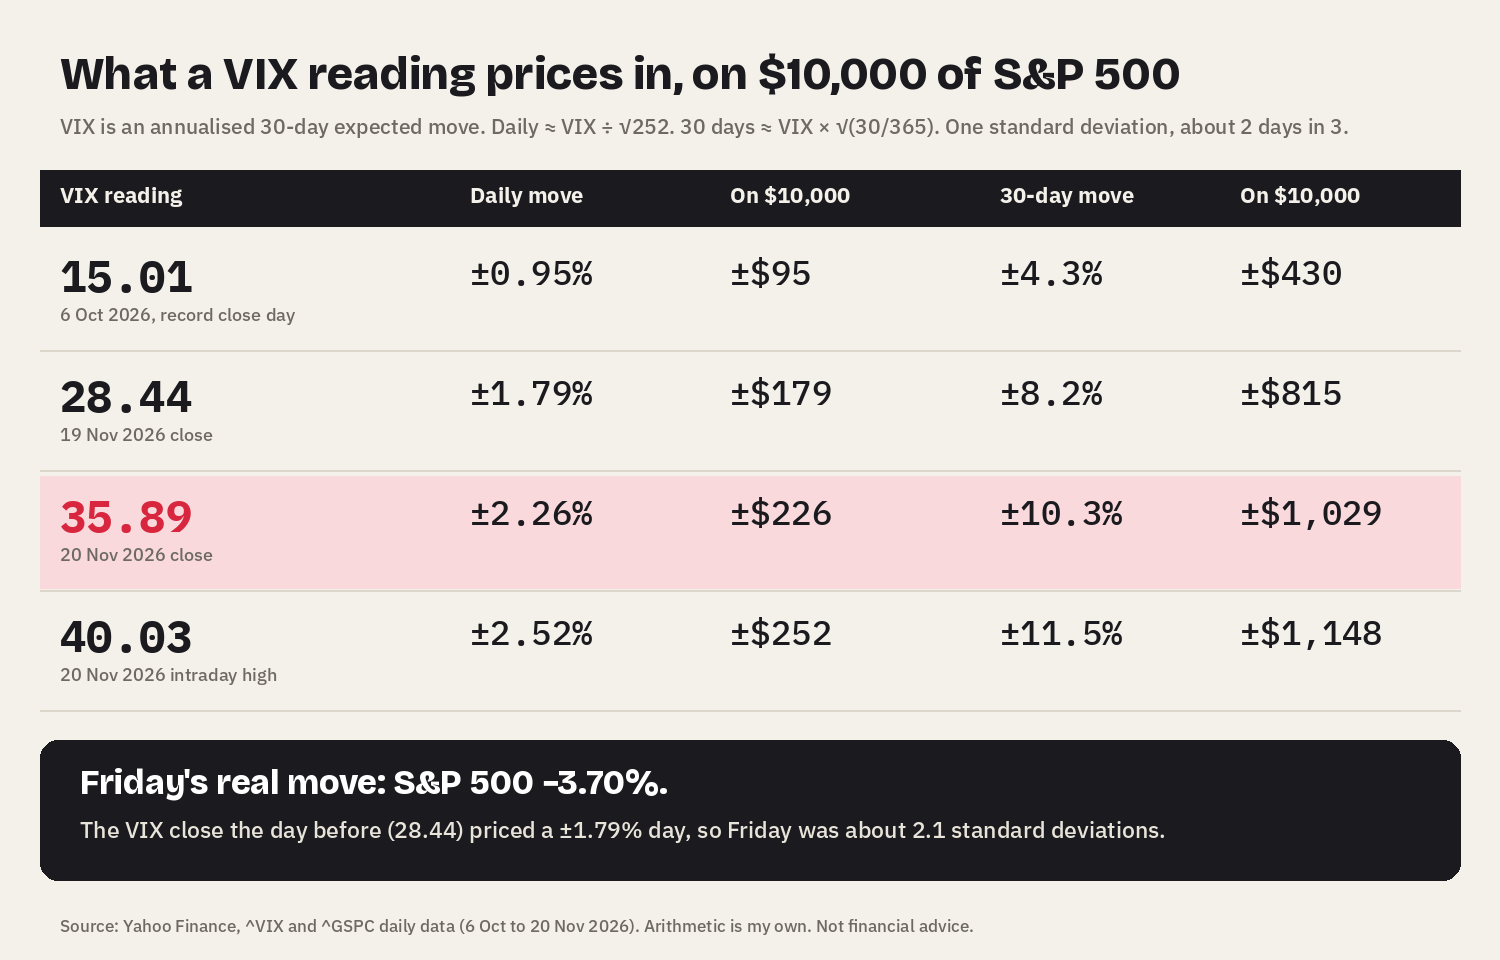
Friday also showed the limit of the estimate. Thursday's close of 28.44 priced a ±1.79% day. The index fell 3.70%, about 2.1 standard deviations. An expected move describes a typical day. It is not a ceiling.
How long did past spikes last?
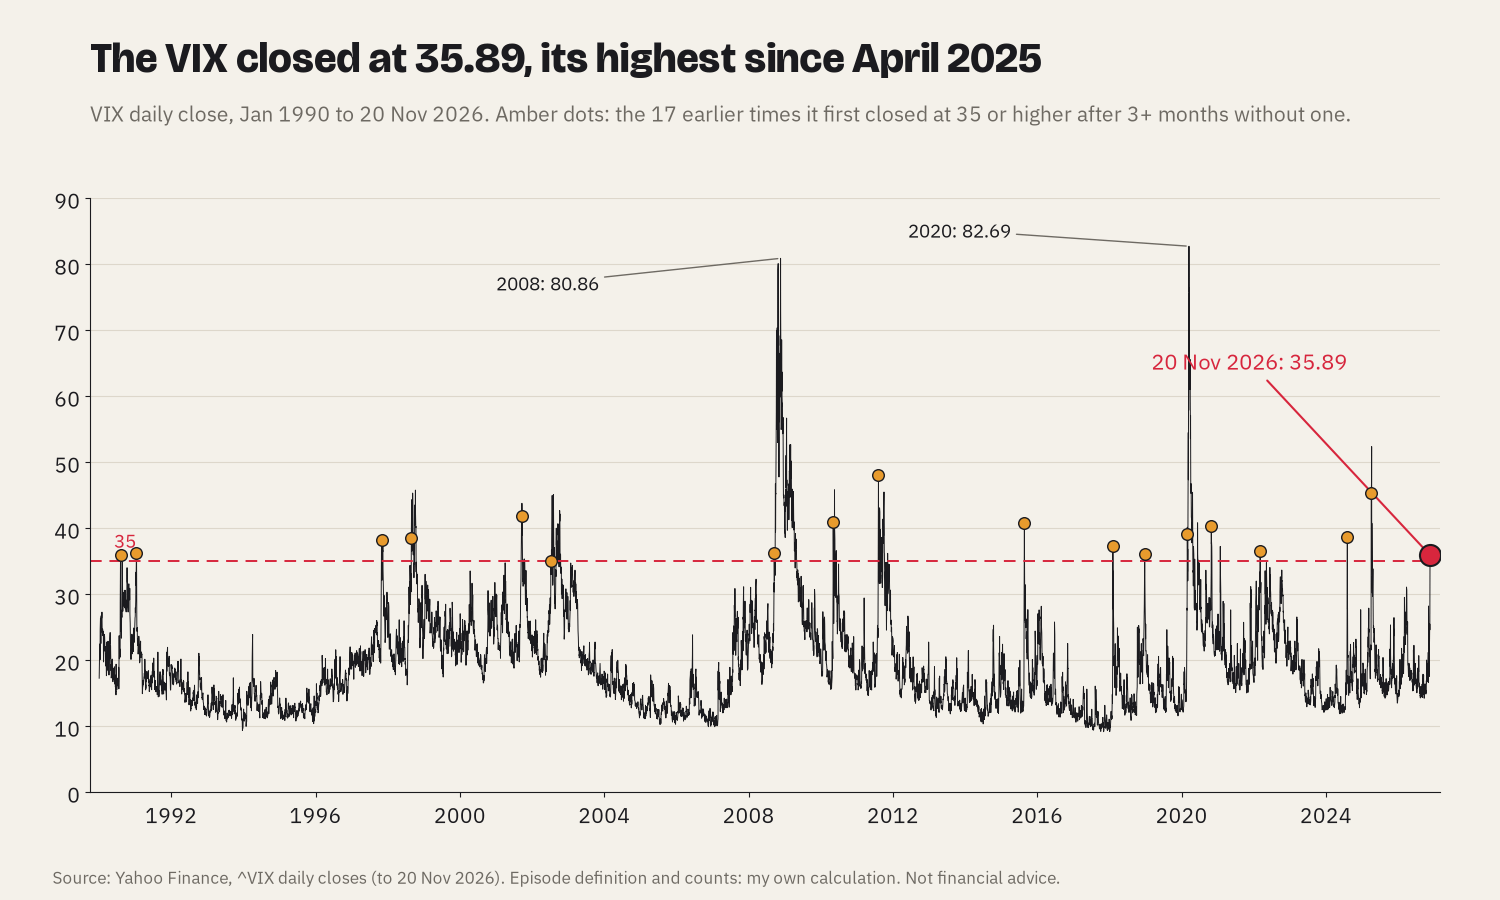
I went back to 1990 and marked every time the VIX first closed at 35 or higher after at least three months (63 trading days) without such a close. That gives 17 earlier episodes. For each one I counted the trading days until the VIX closed back below 25, and I measured how volatile the S&P 500 actually was over the next 21 trading days.
Median time back below 25: 14 trading days. 8 of the 17 got there within 10 days, for example 3 days in August 2024 and 5 days in December 2018.
6 of 17 took 45 trading days or more: 1998, 2001, 2002, 2008, 2011 and 2020. The 2008 episode took 209.
Getting back below 20 took much longer, with a median of 73 trading days.
In 7 of 17 the VIX climbed further after that first close above 35, as high as 80.86 in 2008 and 82.69 in 2020.
Implied versus what actually happened
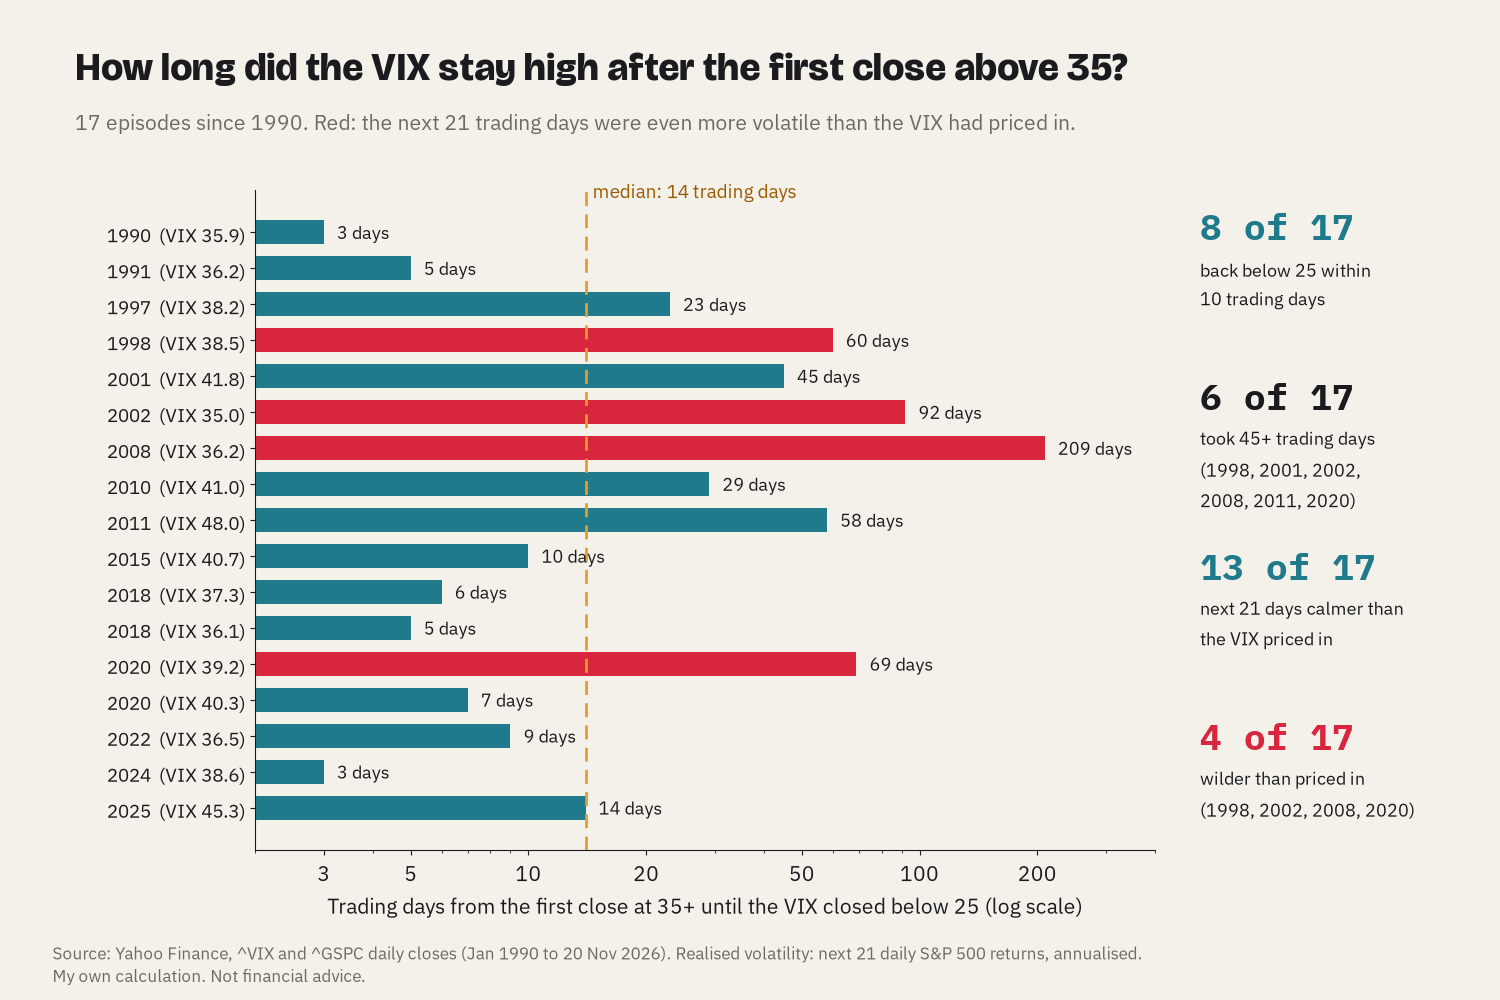
This was the part I found most useful. In 13 of the 17 episodes, the S&P 500's realised volatility over the next 21 trading days came in below the VIX reading on the first day. The median realised figure was 25.5, against a median VIX of 38.55. Options were priced for more turbulence than usually arrived, which matches what Cboe itself describes as implied volatility tending to trade at a premium to realised volatility.
The four exceptions were the episodes that turned into crises: 1998 (realised 42.0 against a VIX of 38.55), 2002 (45.3 against 35.03), 2008 (80.2 against 36.22) and 2020 (95.4 against 39.16). So the VIX usually overstates the next month, and occasionally understates it by a wide margin. Nobody is told in advance which kind of month it will be.
One more reading from this week: the VIX closed above the three-month VIX3M, 35.89 against 30.94, a ratio of 1.16. Since July 2006 the VIX has closed above the VIX3M on 10.9% of trading days. It means the market is paying more for protection over the next month than over the next three.
Why buying the VIX is not what it sounds like
The VIX itself cannot be bought. Exchange-traded products such as VIXY hold short-term VIX futures and roll them forward. When later futures cost more than nearer ones, which is the usual shape of the curve, every roll loses a little.
The last twelve months show how much that adds up to. From 20 November 2025 to 20 November 2026 the VIX rose from 26.42 to 35.89, up 35.8%. VIXY went from $38.20 to $25.95, down 32.1%. Even this week, when the VIX jumped 86% from 19.30, VIXY rose 44.6%, from $17.94 to $25.95.
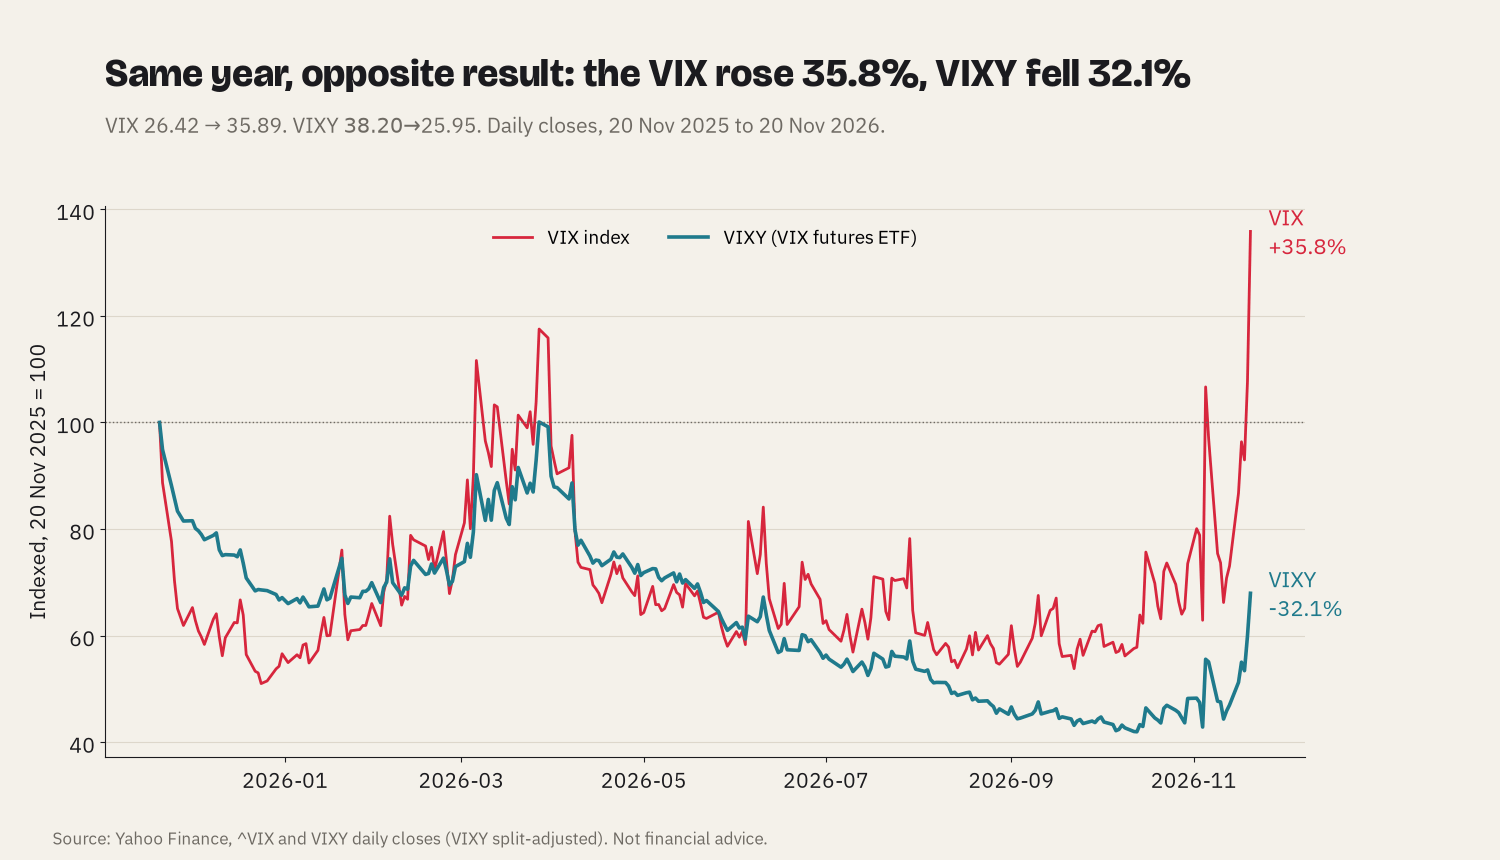
A volatility ETF can pay off over a few days of panic. Held for months, it has to beat its own roll cost first.
Trading a high-VIX week on BiyaPay
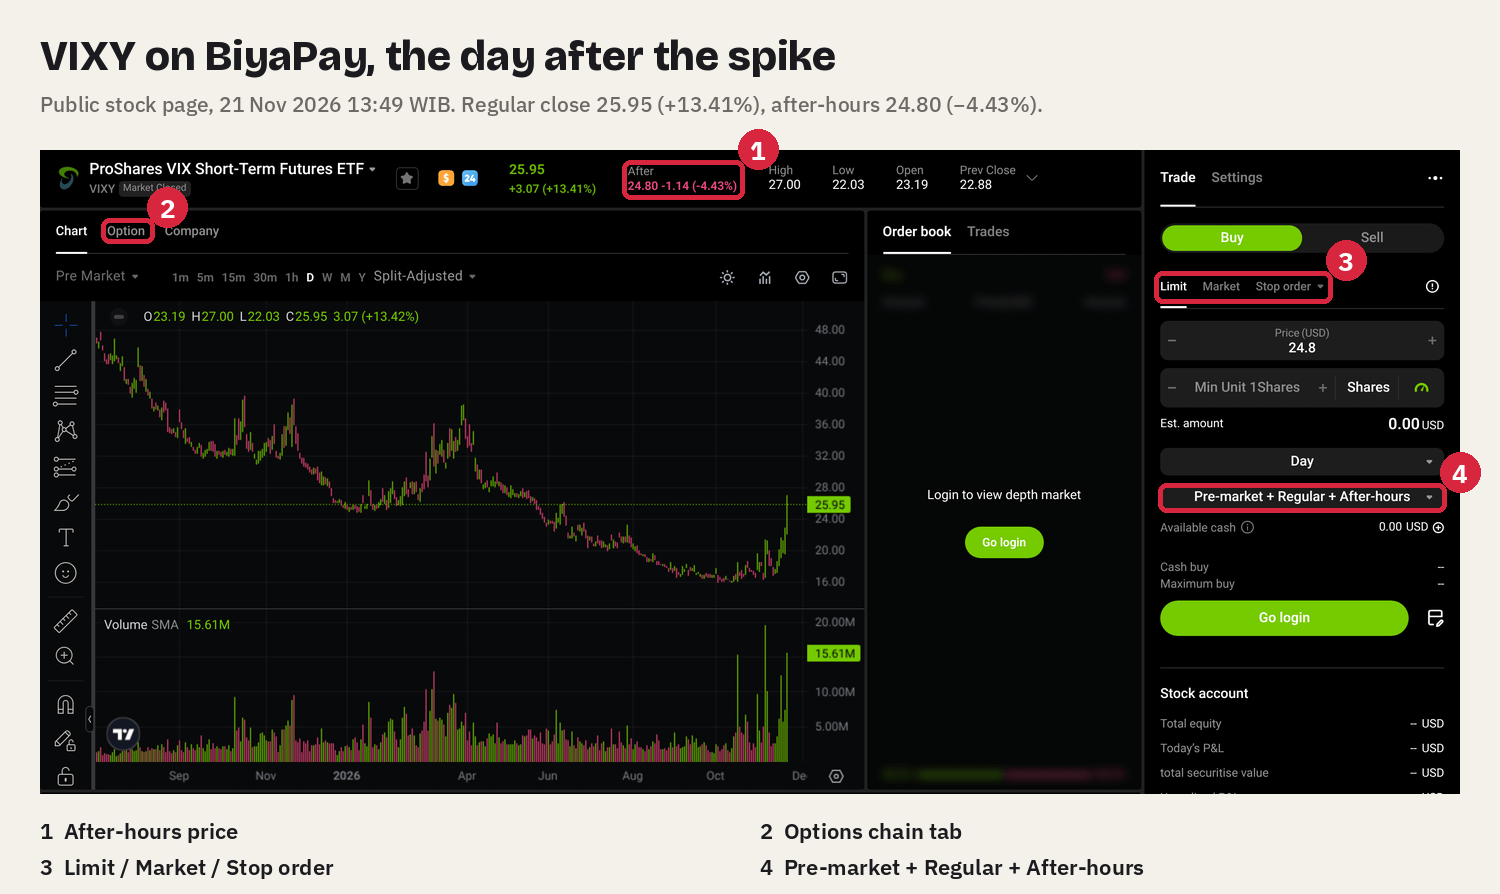
BiyaPay gives access to US-listed stocks and ETFs, including SPY, QQQ and VIXY, for users outside the United States. In a week like this, a few features matter more than usual:
Extended hours: orders can run in the pre-market, regular and after-hours sessions. After Friday's close, VIXY traded at 24.80 after hours (−4.43%) and SPY at 697.49 (+1.11%), so Monday's starting price can already be far from Friday's close.
Order types: Limit, Market and Stop order. When spreads widen, a limit order fixes the price you pay, while a market order only guarantees that you get filled.
Options: US stock and ETF options sit under the Option tab of each stock page and trade in the regular session only, 09:30–16:00 New York time, which is 21:30–04:00 WIB at the moment.
Fees: commission is $0. The platform fee is $0.005 per share with a $0.99 minimum per order, settlement is $0.003 per share, and sells add the SEC fee and the trading activity fee.
Funding: deposit USDT or fiat, then convert to USD inside the app. Currency exchange runs 24 hours a day with no commission, at the live rate.
Here is how I turn the VIX into a position size. I decide the typical daily swing I can live with, say $150, and divide it by the daily move.
At a VIX of 15.01 (about 0.95% a day): about $15,860, or 22 SPY shares at $689.81 ($15,175.82).
At a VIX of 35.89 (about 2.26% a day): about $6,634, or 9 SPY shares ($6,208.29).
Same risk budget, less than half the position. Buying those 9 shares costs the $0.99 minimum platform fee plus $0.027 settlement, about $1.02. Selling them at the same price adds an SEC fee of about $0.13 and the $0.01 minimum trading activity fee, about $1.16. The round trip is about $2.17, or 0.035%. Next to a ±$140 typical day on that position, the fee is a rounding error. The size is what decides the outcome.
My take
I read the VIX as a sizing input, not as a buy or sell signal. History says a first close above 35 usually fades within a few weeks, and that the month after is usually calmer than options priced. But the four times it was not calmer are exactly the ones that hurt, so I size for the exception rather than the median.
What I actually do in a week like this:
Recalculate each position's typical daily swing in dollars with VIX ÷ √252, not in percent.
If that number is bigger than I can accept, cut the size now instead of waiting for a bounce.
Leave margin alone while the VIX is above 30. BiyaPay allows up to 4x buying power on stocks, but 4x on a 2.26% day is a 9% day.
Do not hold a VIX futures ETF as a long-term hedge. The last year showed what the roll does to it.
Use limit orders around the open, because after-hours prices can gap away from the last close.
A VIX of 35.89 does not say whether the low is in. It says how wide the road is, and that is enough to decide how fast to drive.
Source: CNBC, "Stock market news for Nov. 20, 2026" (20 Nov 2026); AP, "S&P 500 sinks 3.7% and the Nasdaq composite goes negative for the year" (20 Nov 2026); Cboe, VIX Index overview and trade data as of 20 Nov 2026; Yahoo Finance daily closes for ^VIX (Jan 1990 to 20 Nov 2026), ^VIX3M (Jul 2006 to 20 Nov 2026), ^GSPC, VIXY and SPY (checked 21 Nov 2026). Episode counts, realised volatility, sizing and fee arithmetic are my own calculations.