

MOONRIDER TOP
2.2k Publicações

MOONRIDER TOP
Denunciar
Bloquear usuário
4 Seguindo
47 Seguidores
229 Curtiu
Publicações
Todas
Citações
Vídeos
PINNED

Artigo
BTC se mantém acima de US$85K — a próxima zona de rompimento está ficando mais pertoO Bitcoin está sendo negociado atualmente por volta de US$85.146, mostrando um movimento modesto de +0,38% nas últimas 24 horas. No gráfico diário, o BTC está se mantendo acima de várias médias móveis importantes, enquanto consolida abaixo da máxima recente do swing.
A grande questão agora é simples: o Bitcoin está se preparando para mais um avanço em direção a US$87K+, ou esta consolidação precisa primeiro de uma retração mais profunda?
Visão geral do mercado do BTC
Preço do BTC: US$85.146,21
Máxima de 24h: US$85.428,01
Mínima de 24h: US$84.558,00
Variação em 24h: +0,38%
Volume de 24h: 7.143,74 BTC
Volume USDT: US$606,69M
BTC se mantém acima de US$85K — a próxima zona de rompimento está ficando mais perto
O Bitcoin está sendo negociado atualmente por volta de US$85.146, mostrando um movimento modesto de +0,38% nas últimas 24 horas. No gráfico diário, o BTC está se mantendo acima de várias médias móveis importantes, enquanto consolida abaixo da máxima recente do swing.
A grande questão agora é simples: o Bitcoin está se preparando para mais um avanço em direção a US$87K+, ou esta consolidação precisa primeiro de uma retração mais profunda?
Visão geral do mercado do BTC
Preço do BTC: US$85.146,21
Máxima de 24h: US$85.428,01
Mínima de 24h: US$84.558,00
Variação em 24h: +0,38%
Volume de 24h: 7.143,74 BTC
Volume USDT: US$606,69M
A grande questão agora é simples: o Bitcoin está se preparando para mais um avanço em direção a US$87K+, ou esta consolidação precisa primeiro de uma retração mais profunda?
Visão geral do mercado do BTC
Preço do BTC: US$85.146,21
Máxima de 24h: US$85.428,01
Mínima de 24h: US$84.558,00
Variação em 24h: +0,38%
Volume de 24h: 7.143,74 BTC
Volume USDT: US$606,69M
2
·
--
Bullish
Ver tradução
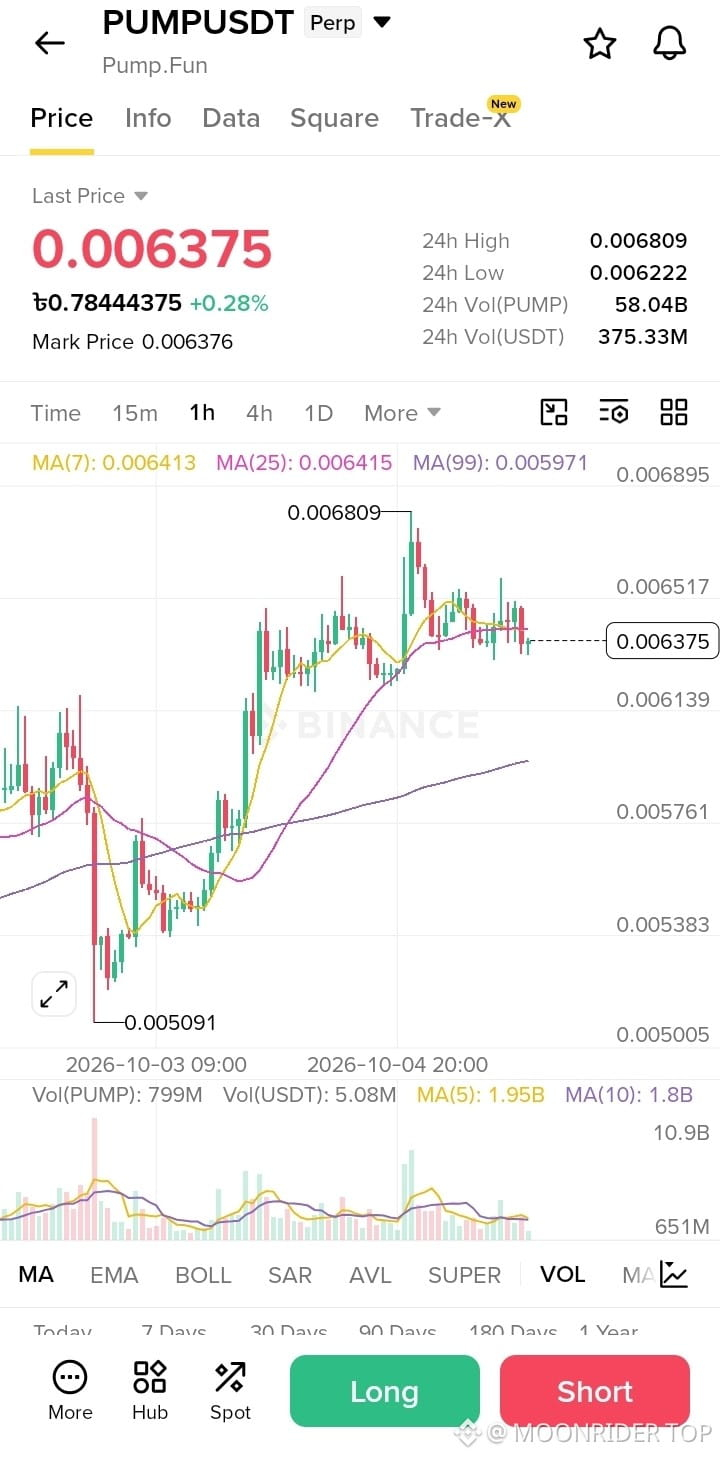
Everyone is waiting for a breakout—I am watching $PUMP / USDT completing a textbook chart setup on the 1h timeframe, signaling a massive shift in short-term momentum.
LONG (1h Reversal Setup)
Trade Plan:
* Entry Zone: 0.00625 – 0.00638
* SL: 0.00580
* TP1: 0.00681
* TP2: 0.00740
* TP3: 0.00820
* TP4: 0.00920
Why this setup?
According to the 1h chart, $PUMP is trading with strong bullish resilience following a successful test of structural support near 0.00509, driving a clean recovery move away from local lows with a +0.28% daily gain. The price action has pushed aggressively above the dynamic moving average lines, including the MA(7) (0.006413) and MA(25) (0.006415), flipping them into solid support alongside the baseline MA(99) (0.005971). With a massive volume and turnover footprint (375.33M USDT volume), this impulse wave is primed to challenge the major swing high of 0.006809 and expand toward higher overhead resistance zones.
Debate:
What do you think? Will PUMP aggressively break through the swing high at 0.006809, or will we see a slight retest of the lower support lines before the secondary expansion? Drop your analysis below!$PUMP
{spot}(PUMPUSDT)
Everyone is waiting for a breakout—I am watching $PUMP / USDT completing a textbook chart setup on the 1h timeframe, signaling a massive shift in short-term momentum.
LONG (1h Reversal Setup)
Trade Plan:
* Entry Zone: 0.00625 – 0.00638
* SL: 0.00580
* TP1: 0.00681
* TP2: 0.00740
* TP3: 0.00820
* TP4: 0.00920
Why this setup?
According to the 1h chart, $PUMP is trading with strong bullish resilience following a successful test of structural support near 0.00509, driving a clean recovery move away from local lows with a +0.28% daily gain. The price action has pushed aggressively above the dynamic moving average lines, including the MA(7) (0.006413) and MA(25) (0.006415), flipping them into solid support alongside the baseline MA(99) (0.005971). With a massive volume and turnover footprint (375.33M USDT volume), this impulse wave is primed to challenge the major swing high of 0.006809 and expand toward higher overhead resistance zones.
Debate:
What do you think? Will PUMP aggressively break through the swing high at 0.006809, or will we see a slight retest of the lower support lines before the secondary expansion? Drop your analysis below!$PUMP
LONG (1h Reversal Setup)
Trade Plan:
* Entry Zone: 0.00625 – 0.00638
* SL: 0.00580
* TP1: 0.00681
* TP2: 0.00740
* TP3: 0.00820
* TP4: 0.00920
Why this setup?
According to the 1h chart, $PUMP is trading with strong bullish resilience following a successful test of structural support near 0.00509, driving a clean recovery move away from local lows with a +0.28% daily gain. The price action has pushed aggressively above the dynamic moving average lines, including the MA(7) (0.006413) and MA(25) (0.006415), flipping them into solid support alongside the baseline MA(99) (0.005971). With a massive volume and turnover footprint (375.33M USDT volume), this impulse wave is primed to challenge the major swing high of 0.006809 and expand toward higher overhead resistance zones.
Debate:
What do you think? Will PUMP aggressively break through the swing high at 0.006809, or will we see a slight retest of the lower support lines before the secondary expansion? Drop your analysis below!$PUMP
1
·
--
Bullish
NEAR/USDT [4H] — Cotação em 5.036 (+4,22%), recuperando terreno acima das médias móveis-chave e pressionando em direção à resistência imediata com uma máxima de 5.076.$NEAR
{spot}(NEARUSDT)
NEAR/USDT [4H] — Cotação em 5.036 (+4,22%), recuperando terreno acima das médias móveis-chave e pressionando em direção à resistência imediata com uma máxima de 5.076.$NEAR
56
·
--
Bullish
Ver tradução
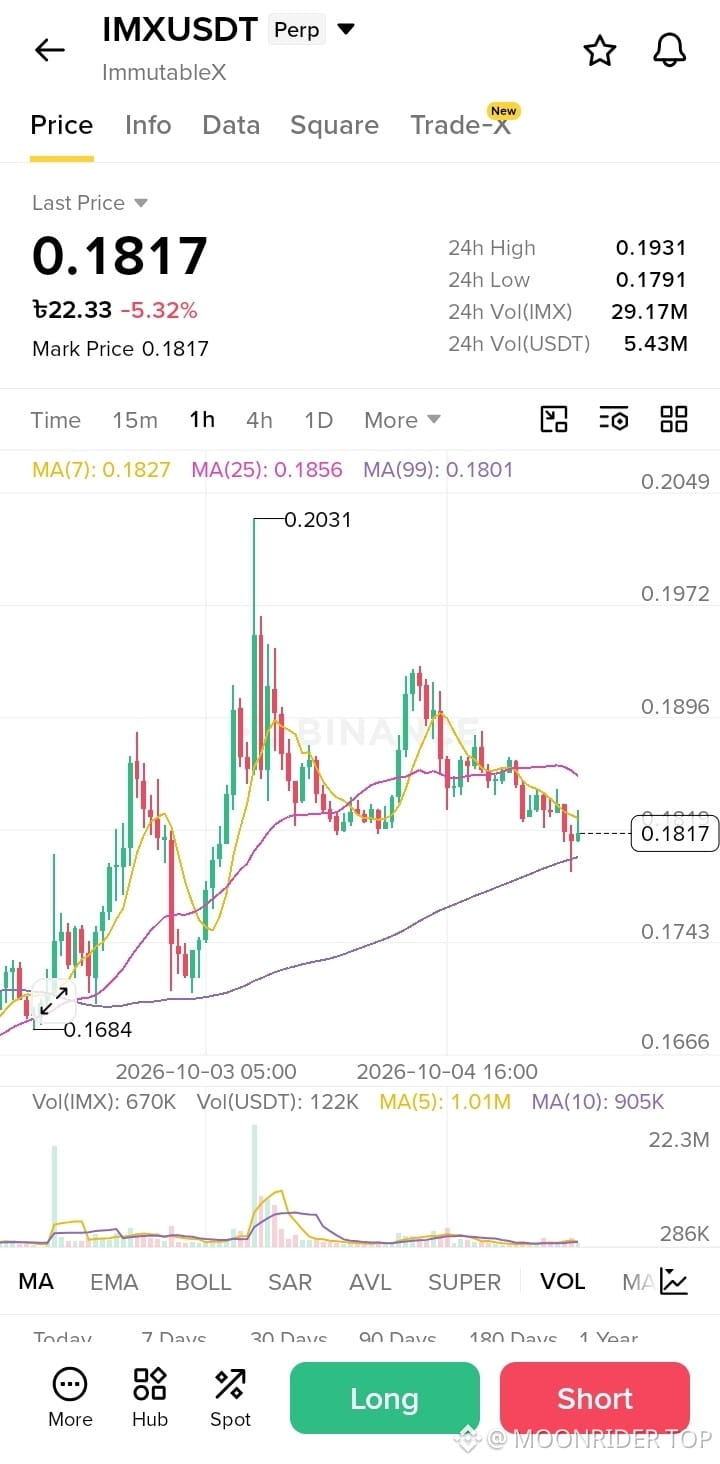
Everyone is waiting for a breakout—I am watching $IMX / USDT completing a textbook chart setup on the 1h timeframe, signaling a massive shift in short-term momentum.
LONG (1h Reversal Setup)
Trade Plan:
* Entry Zone: 0.1750 – 0.1817
* SL: 0.1650
* TP1: 0.2031
* TP2: 0.2200
* TP3: 0.2450
* TP4: 0.2750
Why this setup?
According to the 1h chart, $IMX is trading with solid consolidation following a successful defense of the structural support near 0.1684, stabilizing nicely after a -5.32% daily pullback. The price action is compressing right around the dynamic moving average cluster, with the MA(7) at 0.1827 and MA(25) at 0.1856 acting as immediate overhead levels, while the baseline MA(99) at 0.1801 provides steady backing. With a strong volume presence (5.43M USDT volume), this base-building setup is primed to challenge the major swing high of 0.2031 and expand toward higher overhead resistance zones.
Debate:
What do you think? Will IMX aggressively break through the swing high at 0.2031, or will we see a slight retest of the lower support lines before the secondary expansion? Drop your analysis below!$IMX
{spot}(IMXUSDT)
Everyone is waiting for a breakout—I am watching $IMX / USDT completing a textbook chart setup on the 1h timeframe, signaling a massive shift in short-term momentum.
LONG (1h Reversal Setup)
Trade Plan:
* Entry Zone: 0.1750 – 0.1817
* SL: 0.1650
* TP1: 0.2031
* TP2: 0.2200
* TP3: 0.2450
* TP4: 0.2750
Why this setup?
According to the 1h chart, $IMX is trading with solid consolidation following a successful defense of the structural support near 0.1684, stabilizing nicely after a -5.32% daily pullback. The price action is compressing right around the dynamic moving average cluster, with the MA(7) at 0.1827 and MA(25) at 0.1856 acting as immediate overhead levels, while the baseline MA(99) at 0.1801 provides steady backing. With a strong volume presence (5.43M USDT volume), this base-building setup is primed to challenge the major swing high of 0.2031 and expand toward higher overhead resistance zones.
Debate:
What do you think? Will IMX aggressively break through the swing high at 0.2031, or will we see a slight retest of the lower support lines before the secondary expansion? Drop your analysis below!$IMX
LONG (1h Reversal Setup)
Trade Plan:
* Entry Zone: 0.1750 – 0.1817
* SL: 0.1650
* TP1: 0.2031
* TP2: 0.2200
* TP3: 0.2450
* TP4: 0.2750
Why this setup?
According to the 1h chart, $IMX is trading with solid consolidation following a successful defense of the structural support near 0.1684, stabilizing nicely after a -5.32% daily pullback. The price action is compressing right around the dynamic moving average cluster, with the MA(7) at 0.1827 and MA(25) at 0.1856 acting as immediate overhead levels, while the baseline MA(99) at 0.1801 provides steady backing. With a strong volume presence (5.43M USDT volume), this base-building setup is primed to challenge the major swing high of 0.2031 and expand toward higher overhead resistance zones.
Debate:
What do you think? Will IMX aggressively break through the swing high at 0.2031, or will we see a slight retest of the lower support lines before the secondary expansion? Drop your analysis below!$IMX
25
·
--
Bullish
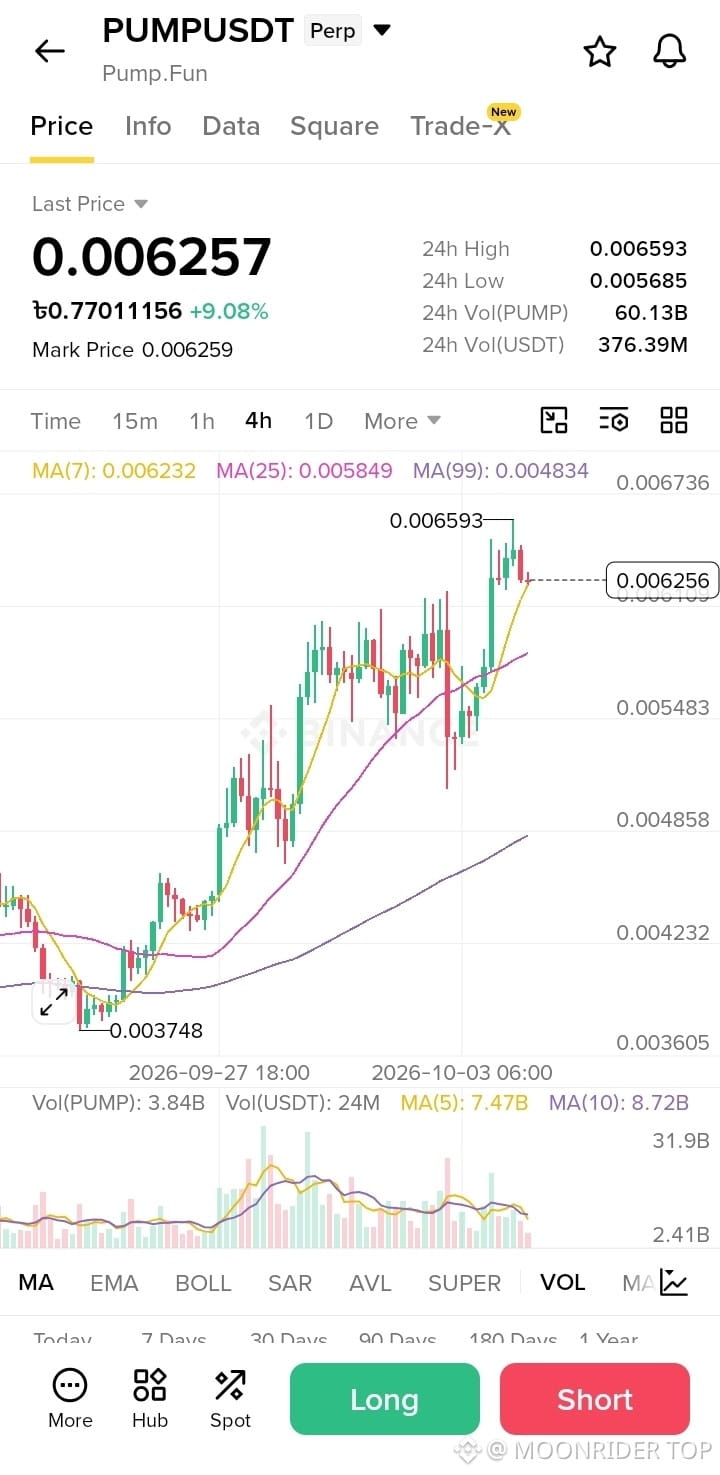
PUMP/USDT [4H]: Negociando a 0.006257 (+9.08%) com máxima nas últimas 24h de 0.006593, mantendo-se firme acima dos suportes das médias móveis após uma forte extensão de alta.$PUMP
{spot}(PUMPUSDT)
PUMP/USDT [4H]: Negociando a 0.006257 (+9.08%) com máxima nas últimas 24h de 0.006593, mantendo-se firme acima dos suportes das médias móveis após uma forte extensão de alta.$PUMP
87
·
--
Bullish
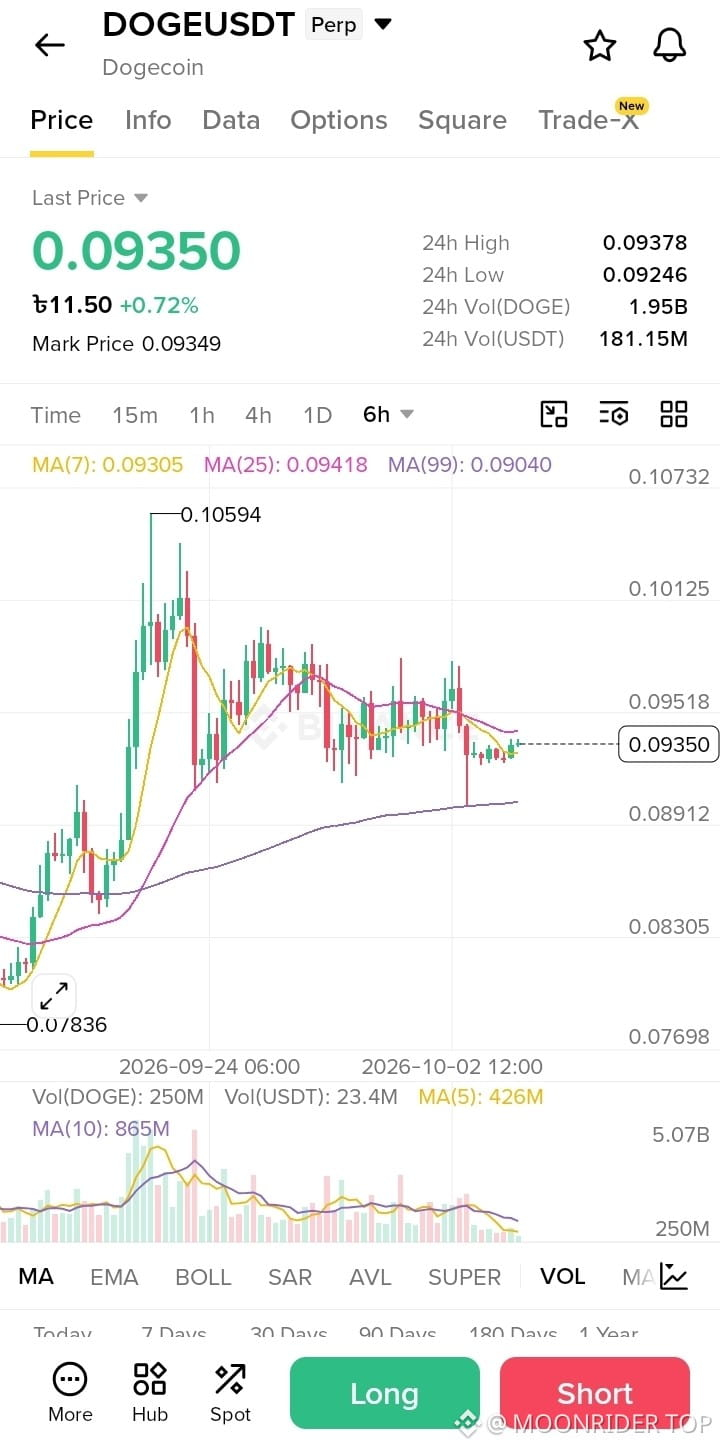
Todos estão esperando um rompimento — eu estou observando $DOGE / USDT concluindo uma configuração de gráfico “padrão de livro” no timeframe de 6h, sinalizando uma grande mudança no momentum de curto prazo.
LONG (Configuração de Reversão em 6h)
Plano de Trade:
* Zona de Entrada: 0.0910 – 0.0935
* SL: 0.0880
* TP1: 0.1059
* TP2: 0.1140
* TP3: 0.1250
* TP4: 0.1380
Por que esta configuração?
De acordo com o gráfico de 6h, $DOGE está negociando com um momentum de alta constante após um teste bem-sucedido de suporte estrutural perto de 0.0836, impulsionando uma recuperação limpa saindo das mínimas locais com um ganho diário de +0,72%. A ação do preço está consolidando de forma construtiva bem ao redor das linhas da média móvel dinâmica, com a MA(7) em 0.09305 e a MA(25) em 0.09418 atuando como um cluster de inflexão apertado, bem acima da linha base da MA(99) em 0.09040. Com um volume e pegada de liquidez elevados (181,15M USDT de volume, 1,95B DOGE de volume), esta fase de compressão está pronta para desafiar a máxima relevante principal de 0.10594 e se expandir em direção a zonas de resistência mais acima.
Debate:
O que você acha? Acha que o DOGE vai romper de forma agressiva a máxima do swing em 0.10594, ou veremos um leve reteste das linhas de suporte inferiores antes da expansão secundária? Deixe sua análise abaixo!$DOGE
{spot}(DOGEUSDT)
Todos estão esperando um rompimento — eu estou observando $DOGE / USDT concluindo uma configuração de gráfico “padrão de livro” no timeframe de 6h, sinalizando uma grande mudança no momentum de curto prazo.
LONG (Configuração de Reversão em 6h)
Plano de Trade:
* Zona de Entrada: 0.0910 – 0.0935
* SL: 0.0880
* TP1: 0.1059
* TP2: 0.1140
* TP3: 0.1250
* TP4: 0.1380
Por que esta configuração?
De acordo com o gráfico de 6h, $DOGE está negociando com um momentum de alta constante após um teste bem-sucedido de suporte estrutural perto de 0.0836, impulsionando uma recuperação limpa saindo das mínimas locais com um ganho diário de +0,72%. A ação do preço está consolidando de forma construtiva bem ao redor das linhas da média móvel dinâmica, com a MA(7) em 0.09305 e a MA(25) em 0.09418 atuando como um cluster de inflexão apertado, bem acima da linha base da MA(99) em 0.09040. Com um volume e pegada de liquidez elevados (181,15M USDT de volume, 1,95B DOGE de volume), esta fase de compressão está pronta para desafiar a máxima relevante principal de 0.10594 e se expandir em direção a zonas de resistência mais acima.
Debate:
O que você acha? Acha que o DOGE vai romper de forma agressiva a máxima do swing em 0.10594, ou veremos um leve reteste das linhas de suporte inferiores antes da expansão secundária? Deixe sua análise abaixo!$DOGE
LONG (Configuração de Reversão em 6h)
Plano de Trade:
* Zona de Entrada: 0.0910 – 0.0935
* SL: 0.0880
* TP1: 0.1059
* TP2: 0.1140
* TP3: 0.1250
* TP4: 0.1380
Por que esta configuração?
De acordo com o gráfico de 6h, $DOGE está negociando com um momentum de alta constante após um teste bem-sucedido de suporte estrutural perto de 0.0836, impulsionando uma recuperação limpa saindo das mínimas locais com um ganho diário de +0,72%. A ação do preço está consolidando de forma construtiva bem ao redor das linhas da média móvel dinâmica, com a MA(7) em 0.09305 e a MA(25) em 0.09418 atuando como um cluster de inflexão apertado, bem acima da linha base da MA(99) em 0.09040. Com um volume e pegada de liquidez elevados (181,15M USDT de volume, 1,95B DOGE de volume), esta fase de compressão está pronta para desafiar a máxima relevante principal de 0.10594 e se expandir em direção a zonas de resistência mais acima.
Debate:
O que você acha? Acha que o DOGE vai romper de forma agressiva a máxima do swing em 0.10594, ou veremos um leve reteste das linhas de suporte inferiores antes da expansão secundária? Deixe sua análise abaixo!$DOGE
2
·
--
Bullish
• O contrato perpétuo XAUT/USDT está atualmente a negociar a US$ 4.139,38, registando uma variação nominal de +0,01% ao longo da sessão.
• Os parâmetros de preço intradiário estabeleceram um piso em US$ 4.135,33, juntamente com um pico no teto superior que atingiu US$ 4.141,24.
• O volume total negociado na janela de 24 horas registou aproximadamente 1.614,837 XAUT, gerando uma rotação de cerca de US$ 6,68M.
• As médias móveis de curto prazo indicam que a MA(7) está em US$ 4.139,50, a MA(25) em US$ 4.154,93 e a MA estrutural de base (99) encontra-se mais alta em US$ 4.254,81, sinalizando resistência pela parte de cima.
• A ação do preço evidencia uma fase de consolidação apertada após uma queda impulsiva a partir de máximas locais próximas de US$ 4.394,69, descendo até ao fundo do swing em US$ 4.114,99.
• Os participantes do mercado estão de perto a observar se os compradores conseguem defender a faixa de suporte imediata para iniciar uma recuperação em direção ao cluster de médias móveis acima.$XAUT
{spot}(XAUTUSDT)
$BTC
{spot}(BTCUSDT)
$ETH
{spot}(ETHUSDT)
• O contrato perpétuo XAUT/USDT está atualmente a negociar a US$ 4.139,38, registando uma variação nominal de +0,01% ao longo da sessão.
• Os parâmetros de preço intradiário estabeleceram um piso em US$ 4.135,33, juntamente com um pico no teto superior que atingiu US$ 4.141,24.
• O volume total negociado na janela de 24 horas registou aproximadamente 1.614,837 XAUT, gerando uma rotação de cerca de US$ 6,68M.
• As médias móveis de curto prazo indicam que a MA(7) está em US$ 4.139,50, a MA(25) em US$ 4.154,93 e a MA estrutural de base (99) encontra-se mais alta em US$ 4.254,81, sinalizando resistência pela parte de cima.
• A ação do preço evidencia uma fase de consolidação apertada após uma queda impulsiva a partir de máximas locais próximas de US$ 4.394,69, descendo até ao fundo do swing em US$ 4.114,99.
• Os participantes do mercado estão de perto a observar se os compradores conseguem defender a faixa de suporte imediata para iniciar uma recuperação em direção ao cluster de médias móveis acima.$XAUT
$BTC
$ETH
• Os parâmetros de preço intradiário estabeleceram um piso em US$ 4.135,33, juntamente com um pico no teto superior que atingiu US$ 4.141,24.
• O volume total negociado na janela de 24 horas registou aproximadamente 1.614,837 XAUT, gerando uma rotação de cerca de US$ 6,68M.
• As médias móveis de curto prazo indicam que a MA(7) está em US$ 4.139,50, a MA(25) em US$ 4.154,93 e a MA estrutural de base (99) encontra-se mais alta em US$ 4.254,81, sinalizando resistência pela parte de cima.
• A ação do preço evidencia uma fase de consolidação apertada após uma queda impulsiva a partir de máximas locais próximas de US$ 4.394,69, descendo até ao fundo do swing em US$ 4.114,99.
• Os participantes do mercado estão de perto a observar se os compradores conseguem defender a faixa de suporte imediata para iniciar uma recuperação em direção ao cluster de médias móveis acima.$XAUT
$BTC
$ETH

82
·
--
Bullish
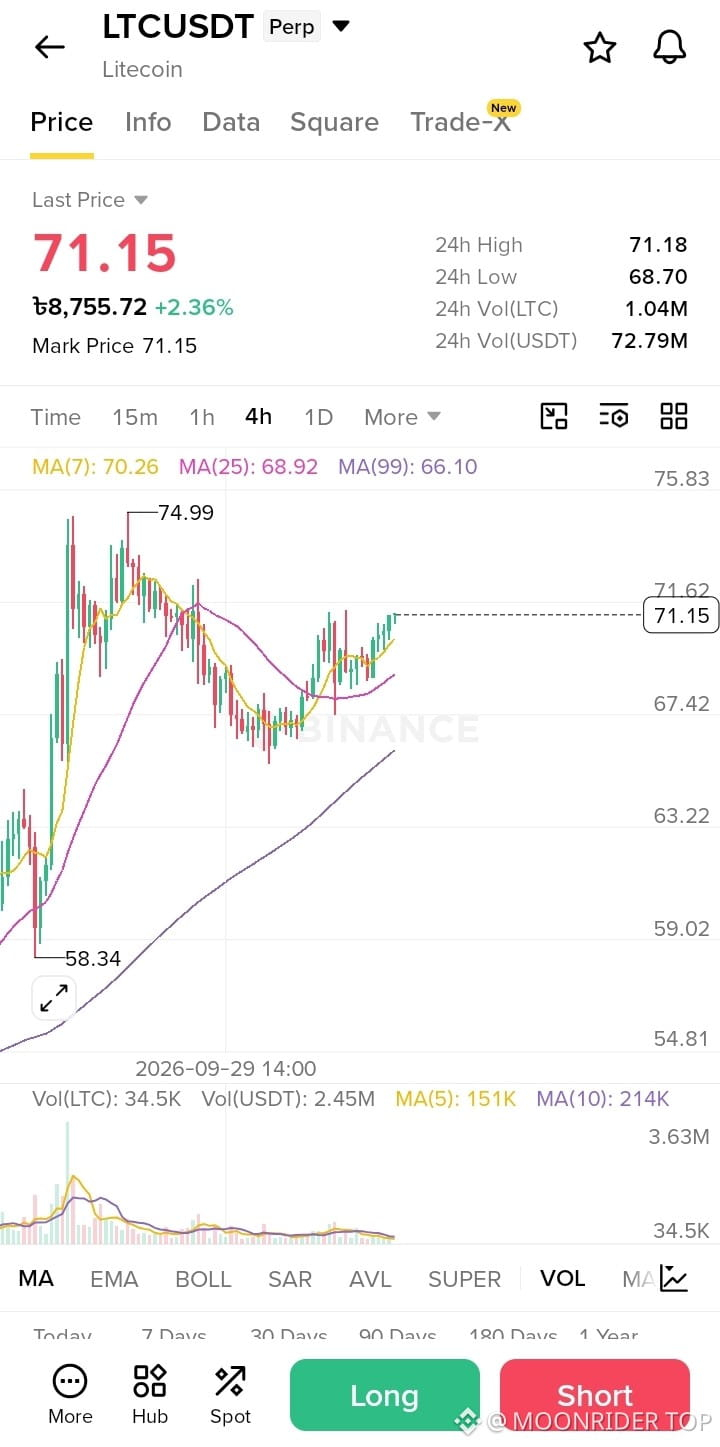
Todo mundo está esperando um rompimento — eu estou observando $LTC / USDT completando uma configuração de gráfico “de livro” no timeframe de 4h, sinalizando uma grande mudança no momentum de curto prazo.
LONG (Configuração de Reversão em 4h)
Plano de Trade:
* Zona de Entrada: 69.50 – 71.15
* SL: 66.50
* TP1: 74.99
* TP2: 79.50
* TP3: 85.00
* TP4: 92.00
Por que essa configuração?
De acordo com o gráfico de 4h, $LTC está sendo negociado com forte momentum de alta após um teste bem-sucedido do suporte estrutural perto de 58.34, impulsionando uma recuperação limpa a partir das mínimas locais, com um ganho diário de +2,36%. A ação do preço rompeu de forma agressiva acima das linhas da média móvel dinâmica, incluindo a MA7 (70.26) e a MA25 (68.92), revertendo-as para um suporte sólido junto com a linha-base da MA99 (66.10). Com uma presença de volume significativa (volume de 72,79M USDT), esta onda de impulso está pronta para desafiar a máxima relevante principal de 74.99 e se expandir em direção a zonas de resistência mais elevadas.
Debate:
O que você acha? O LTC vai romper agressivamente a máxima do swing em 74.99, ou vamos ver um leve reteste das linhas de suporte inferiores antes da expansão secundária? Deixe sua análise abaixo!$LTC
{spot}(LTCUSDT)
Todo mundo está esperando um rompimento — eu estou observando $LTC / USDT completando uma configuração de gráfico “de livro” no timeframe de 4h, sinalizando uma grande mudança no momentum de curto prazo.
LONG (Configuração de Reversão em 4h)
Plano de Trade:
* Zona de Entrada: 69.50 – 71.15
* SL: 66.50
* TP1: 74.99
* TP2: 79.50
* TP3: 85.00
* TP4: 92.00
Por que essa configuração?
De acordo com o gráfico de 4h, $LTC está sendo negociado com forte momentum de alta após um teste bem-sucedido do suporte estrutural perto de 58.34, impulsionando uma recuperação limpa a partir das mínimas locais, com um ganho diário de +2,36%. A ação do preço rompeu de forma agressiva acima das linhas da média móvel dinâmica, incluindo a MA7 (70.26) e a MA25 (68.92), revertendo-as para um suporte sólido junto com a linha-base da MA99 (66.10). Com uma presença de volume significativa (volume de 72,79M USDT), esta onda de impulso está pronta para desafiar a máxima relevante principal de 74.99 e se expandir em direção a zonas de resistência mais elevadas.
Debate:
O que você acha? O LTC vai romper agressivamente a máxima do swing em 74.99, ou vamos ver um leve reteste das linhas de suporte inferiores antes da expansão secundária? Deixe sua análise abaixo!$LTC
LONG (Configuração de Reversão em 4h)
Plano de Trade:
* Zona de Entrada: 69.50 – 71.15
* SL: 66.50
* TP1: 74.99
* TP2: 79.50
* TP3: 85.00
* TP4: 92.00
Por que essa configuração?
De acordo com o gráfico de 4h, $LTC está sendo negociado com forte momentum de alta após um teste bem-sucedido do suporte estrutural perto de 58.34, impulsionando uma recuperação limpa a partir das mínimas locais, com um ganho diário de +2,36%. A ação do preço rompeu de forma agressiva acima das linhas da média móvel dinâmica, incluindo a MA7 (70.26) e a MA25 (68.92), revertendo-as para um suporte sólido junto com a linha-base da MA99 (66.10). Com uma presença de volume significativa (volume de 72,79M USDT), esta onda de impulso está pronta para desafiar a máxima relevante principal de 74.99 e se expandir em direção a zonas de resistência mais elevadas.
Debate:
O que você acha? O LTC vai romper agressivamente a máxima do swing em 74.99, ou vamos ver um leve reteste das linhas de suporte inferiores antes da expansão secundária? Deixe sua análise abaixo!$LTC
2
·
--
Bullish
Todo mundo está esperando por um rompimento — eu estou observando $HYPE /USDT concluindo uma configuração de gráfico “didática” no timeframe de 1D, sinalizando uma grande mudança no momentum de curto prazo.
LONG (Setup de Reversão em 1D)
Plano de Trade:
* Zona de Entrada: 87.50 – 90.35
* SL: 83.50
* TP1: 98.05
* TP2: 105.00
* TP3: 115.00
* TP4: 128.00
Por que este setup?
De acordo com o gráfico de 1D, $HYPE está negociando com forte momentum de alta após um teste bem-sucedido do suporte estrutural perto de 53.711, impulsionando uma recuperação macro limpa saindo das mínimas locais com um ganho diário de +2.70%. A ação do preço avançou de forma agressiva acima das linhas de média móvel dinâmicas, incluindo a MA(7) (88.688), MA(25) (87.552) e a média base MA(99) (71.981), convertendo-as em um conjunto sólido de suportes. Com presença notável de volume e giro (volume de 243.50M USDT), esta onda de impulso está preparada para desafiar a máxima relevante principal de 98.057 e se expandir em direção a zonas mais altas de resistência à frente.
Debate:
O que você acha? O HYPE vai romper agressivamente a máxima da oscilação em 98.057, ou veremos um leve reteste das linhas de suporte inferiores antes da expansão secundária? Deixe sua análise abaixo!$HYPE
{spot}(HYPEUSDT)
Todo mundo está esperando por um rompimento — eu estou observando $HYPE /USDT concluindo uma configuração de gráfico “didática” no timeframe de 1D, sinalizando uma grande mudança no momentum de curto prazo.
LONG (Setup de Reversão em 1D)
Plano de Trade:
* Zona de Entrada: 87.50 – 90.35
* SL: 83.50
* TP1: 98.05
* TP2: 105.00
* TP3: 115.00
* TP4: 128.00
Por que este setup?
De acordo com o gráfico de 1D, $HYPE está negociando com forte momentum de alta após um teste bem-sucedido do suporte estrutural perto de 53.711, impulsionando uma recuperação macro limpa saindo das mínimas locais com um ganho diário de +2.70%. A ação do preço avançou de forma agressiva acima das linhas de média móvel dinâmicas, incluindo a MA(7) (88.688), MA(25) (87.552) e a média base MA(99) (71.981), convertendo-as em um conjunto sólido de suportes. Com presença notável de volume e giro (volume de 243.50M USDT), esta onda de impulso está preparada para desafiar a máxima relevante principal de 98.057 e se expandir em direção a zonas mais altas de resistência à frente.
Debate:
O que você acha? O HYPE vai romper agressivamente a máxima da oscilação em 98.057, ou veremos um leve reteste das linhas de suporte inferiores antes da expansão secundária? Deixe sua análise abaixo!$HYPE
LONG (Setup de Reversão em 1D)
Plano de Trade:
* Zona de Entrada: 87.50 – 90.35
* SL: 83.50
* TP1: 98.05
* TP2: 105.00
* TP3: 115.00
* TP4: 128.00
Por que este setup?
De acordo com o gráfico de 1D, $HYPE está negociando com forte momentum de alta após um teste bem-sucedido do suporte estrutural perto de 53.711, impulsionando uma recuperação macro limpa saindo das mínimas locais com um ganho diário de +2.70%. A ação do preço avançou de forma agressiva acima das linhas de média móvel dinâmicas, incluindo a MA(7) (88.688), MA(25) (87.552) e a média base MA(99) (71.981), convertendo-as em um conjunto sólido de suportes. Com presença notável de volume e giro (volume de 243.50M USDT), esta onda de impulso está preparada para desafiar a máxima relevante principal de 98.057 e se expandir em direção a zonas mais altas de resistência à frente.
Debate:
O que você acha? O HYPE vai romper agressivamente a máxima da oscilação em 98.057, ou veremos um leve reteste das linhas de suporte inferiores antes da expansão secundária? Deixe sua análise abaixo!$HYPE

1
·
--
Bullish
🚨 GRÁFICO NEAR/USDT E ANÁLISE TÉCNICA
Ativo: NEAR Protocol (Gráfico NEAR/USDT de 4 horas)
Evento: Consolidação de Faixa Média e Interação com Médias Móveis
📊 MÉTRICAS DE MERCADO E AÇÃO DE PREÇO
• Preço Atual: US$ 4,778, refletindo um ganho de +1,81%.
• Faixa de 24 Horas: máxima de US$ 4,908 e mínima de US$ 4,604.
• Volume de 24 Horas: 15,26M NEAR e 72,48M USDT negociados.
• Desempenho Histórico: ganhos substanciais de múltiplos meses, mostrando +139,38% em 30 dias, +141,92% em 90 dias e +274,16% em 180 dias.
📐 ESTRUTURA TÉCNICA E MÉDIAS MÓVEIS
* Níveis do Indicador: médias móveis de curto prazo indicam leve consolidação perto do nível de US$ 4,77, situadas entre máximas de balanço recentes em torno de US$ 5,578 e mínimas de balanço perto de US$ 4,548.
* Força da Tendência: a trajetória macro de longo prazo permanece elevada após fortes expansões estruturais nos trimestres anteriores.
⚡ PLANO DE EXECUÇÃO ESTRATÉGICO
• Orientação de Entrada: acompanhe uma ruptura limpa acima da região de resistência de US$ 4,90 ou procure retestes próximos à zona de suporte estrutural de US$ 4,55.
• Gestão de Risco: implemente medidas rigorosas de stop-loss abaixo do suporte das médias móveis locais para mitigar riscos de volatilidade de baixa.
⚠️ Nota de Risco: zonas de consolidação em faixa média podem apresentar falsas rupturas; aguarde sempre expansões de volume confirmadas antes de entrar em operações direcionais.$NEAR
{spot}(NEARUSDT)
🚨 GRÁFICO NEAR/USDT E ANÁLISE TÉCNICA
Ativo: NEAR Protocol (Gráfico NEAR/USDT de 4 horas)
Evento: Consolidação de Faixa Média e Interação com Médias Móveis
📊 MÉTRICAS DE MERCADO E AÇÃO DE PREÇO
• Preço Atual: US$ 4,778, refletindo um ganho de +1,81%.
• Faixa de 24 Horas: máxima de US$ 4,908 e mínima de US$ 4,604.
• Volume de 24 Horas: 15,26M NEAR e 72,48M USDT negociados.
• Desempenho Histórico: ganhos substanciais de múltiplos meses, mostrando +139,38% em 30 dias, +141,92% em 90 dias e +274,16% em 180 dias.
📐 ESTRUTURA TÉCNICA E MÉDIAS MÓVEIS
* Níveis do Indicador: médias móveis de curto prazo indicam leve consolidação perto do nível de US$ 4,77, situadas entre máximas de balanço recentes em torno de US$ 5,578 e mínimas de balanço perto de US$ 4,548.
* Força da Tendência: a trajetória macro de longo prazo permanece elevada após fortes expansões estruturais nos trimestres anteriores.
⚡ PLANO DE EXECUÇÃO ESTRATÉGICO
• Orientação de Entrada: acompanhe uma ruptura limpa acima da região de resistência de US$ 4,90 ou procure retestes próximos à zona de suporte estrutural de US$ 4,55.
• Gestão de Risco: implemente medidas rigorosas de stop-loss abaixo do suporte das médias móveis locais para mitigar riscos de volatilidade de baixa.
⚠️ Nota de Risco: zonas de consolidação em faixa média podem apresentar falsas rupturas; aguarde sempre expansões de volume confirmadas antes de entrar em operações direcionais.$NEAR
Ativo: NEAR Protocol (Gráfico NEAR/USDT de 4 horas)
Evento: Consolidação de Faixa Média e Interação com Médias Móveis
📊 MÉTRICAS DE MERCADO E AÇÃO DE PREÇO
• Preço Atual: US$ 4,778, refletindo um ganho de +1,81%.
• Faixa de 24 Horas: máxima de US$ 4,908 e mínima de US$ 4,604.
• Volume de 24 Horas: 15,26M NEAR e 72,48M USDT negociados.
• Desempenho Histórico: ganhos substanciais de múltiplos meses, mostrando +139,38% em 30 dias, +141,92% em 90 dias e +274,16% em 180 dias.
📐 ESTRUTURA TÉCNICA E MÉDIAS MÓVEIS
* Níveis do Indicador: médias móveis de curto prazo indicam leve consolidação perto do nível de US$ 4,77, situadas entre máximas de balanço recentes em torno de US$ 5,578 e mínimas de balanço perto de US$ 4,548.
* Força da Tendência: a trajetória macro de longo prazo permanece elevada após fortes expansões estruturais nos trimestres anteriores.
⚡ PLANO DE EXECUÇÃO ESTRATÉGICO
• Orientação de Entrada: acompanhe uma ruptura limpa acima da região de resistência de US$ 4,90 ou procure retestes próximos à zona de suporte estrutural de US$ 4,55.
• Gestão de Risco: implemente medidas rigorosas de stop-loss abaixo do suporte das médias móveis locais para mitigar riscos de volatilidade de baixa.
⚠️ Nota de Risco: zonas de consolidação em faixa média podem apresentar falsas rupturas; aguarde sempre expansões de volume confirmadas antes de entrar em operações direcionais.$NEAR
69
·
--
Bullish
NVDA/USDT [4H] — Consolidando Próximo das Máximas
O gráfico de 4 horas para NVDA/USDT mostra a ação do preço pairando bem próximo de 234.75, mantendo uma consolidação lateral estável após o recente impulso em direção à máxima local de 238.04.
* Preço Atual: 234.75 USDT (+0.16%)
* Faixa de 24H: Máxima de 235.30 / Mínima de 234.37
* Preço de Marcação: 234.74 USDT
* Médias Móveis Principais: O preço permanece bem sustentado acima das médias móveis de curto e médio prazo (MA 7, 25 e 99), indicando força da tendência subjacente.
Detalhamento Tático:
O volume se estabilizou em torno de 52.27K NVDA (12.27M USDT) enquanto o mercado respira. Embora o lado positivo imediato tenha enfrentado resistência perto de 238.04, a falta de uma venda mais agressiva sugere que os compradores estão defendendo os níveis atuais. Observe uma ruptura apoiada por volume acima da máxima recente ou uma pequena retestada dos suportes das médias móveis antes de se comprometer com o próximo movimento direcional.$NVDAB
{spot}(NVDABUSDT)
NVDA/USDT [4H] — Consolidando Próximo das Máximas
O gráfico de 4 horas para NVDA/USDT mostra a ação do preço pairando bem próximo de 234.75, mantendo uma consolidação lateral estável após o recente impulso em direção à máxima local de 238.04.
* Preço Atual: 234.75 USDT (+0.16%)
* Faixa de 24H: Máxima de 235.30 / Mínima de 234.37
* Preço de Marcação: 234.74 USDT
* Médias Móveis Principais: O preço permanece bem sustentado acima das médias móveis de curto e médio prazo (MA 7, 25 e 99), indicando força da tendência subjacente.
Detalhamento Tático:
O volume se estabilizou em torno de 52.27K NVDA (12.27M USDT) enquanto o mercado respira. Embora o lado positivo imediato tenha enfrentado resistência perto de 238.04, a falta de uma venda mais agressiva sugere que os compradores estão defendendo os níveis atuais. Observe uma ruptura apoiada por volume acima da máxima recente ou uma pequena retestada dos suportes das médias móveis antes de se comprometer com o próximo movimento direcional.$NVDAB
O gráfico de 4 horas para NVDA/USDT mostra a ação do preço pairando bem próximo de 234.75, mantendo uma consolidação lateral estável após o recente impulso em direção à máxima local de 238.04.
* Preço Atual: 234.75 USDT (+0.16%)
* Faixa de 24H: Máxima de 235.30 / Mínima de 234.37
* Preço de Marcação: 234.74 USDT
* Médias Móveis Principais: O preço permanece bem sustentado acima das médias móveis de curto e médio prazo (MA 7, 25 e 99), indicando força da tendência subjacente.
Detalhamento Tático:
O volume se estabilizou em torno de 52.27K NVDA (12.27M USDT) enquanto o mercado respira. Embora o lado positivo imediato tenha enfrentado resistência perto de 238.04, a falta de uma venda mais agressiva sugere que os compradores estão defendendo os níveis atuais. Observe uma ruptura apoiada por volume acima da máxima recente ou uma pequena retestada dos suportes das médias móveis antes de se comprometer com o próximo movimento direcional.$NVDAB

6
·
--
Bullish
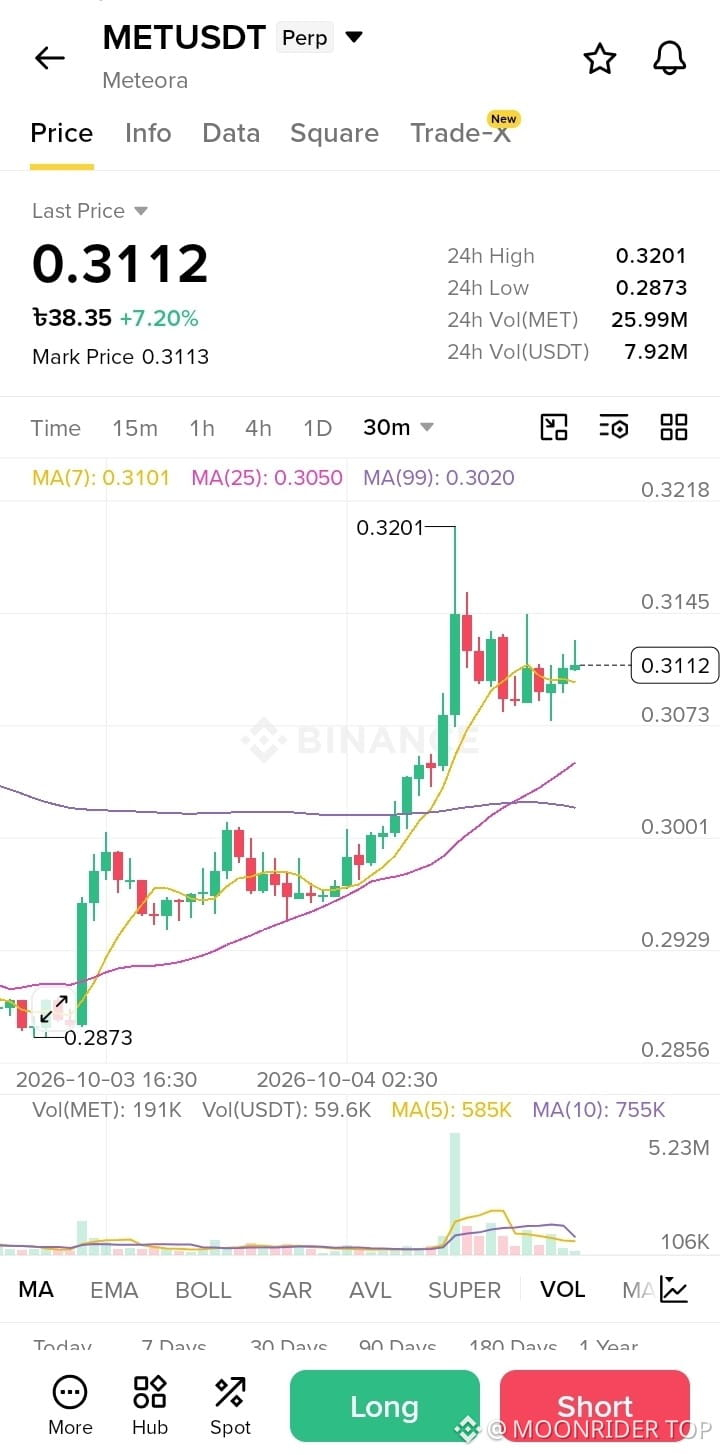
Todo mundo está esperando uma virada — eu estou observando $MET
{spot}(METUSDT)
Todo mundo está esperando uma virada — eu estou observando $MET
171
Faça login para explorar mais conteúdos
Junte-se a usuários de criptomoedas de todo o mundo no Binance Square.
⚡️ Obter informações mais recentes e úteis sobre criptomoeda.
💬 Com a confiança da maior corretora de criptomoedas do mundo.
👍 Descubra insights reais de criadores verificados.
E-mail / número de telefone
Tópicos em Alta
Nikkei225Jumps2.5%ToThreeMonthHigh
5,870 visualizações
202 discutindo
#Nikkei225Jumps2.5%ToThreeMonthHigh
🚀 Nikkei 225 sobe 2,45% e atinge máxima de 3 meses!
O índice de referência japonês Nikkei 225 disparou na segunda-feira, fechando em 69.946,86 após ultrapassar brevemente a marca de 70.000 pontos pela primeira vez em três meses.
💡 O que está impulsionando essa alta?
Boom da IA e dos semicondutores: grandes empresas de tecnologia, como Advantest e Tokyo Electron, lideraram os ganhos expressivos.
Impulso de Wall Street: o reflexo positivo dos mercados dos EUA elevou a confiança geral dos investidores.
Mudanças macroeconômicas: dados de emprego dos EUA mais moderados do que o esperado aliviaram os temores e reduziram as expectativas de uma alta agressiva dos juros pelo Fed em outubro.
📊 Conclusão do mercado:
Essa forte alta sinaliza uma retomada expressiva do apetite dos investidores por tecnologia e ativos impulsionados pela IA. No entanto, os traders devem ficar atentos aos rendimentos elevados dos títulos, que continuam sendo um fator de risco.
Você acha que o Nikkei conseguirá se manter acima dos 70.000 pontos e avançar para novas máximas históricas? Conte para nós o que pensa!
#JapanStocks #StockMarket" #AIStocks #Semiconductors #Investing #Nikkei225
$EWJ
Nurul Hasnat Samir
·0 curtidas
·45 visualizações
DriftHackVictimsBeginClaims
80,706 visualizações
896 discutindo
SolanaTokenizedStockVolumeTops$4.4BInSeptember
8,125 visualizações
93 discutindo