

SM TraderZone
4 Publicações

SM TraderZone
Denunciar
Bloquear usuário
I am a professional Trader.
0 Seguindo
1 Seguidores
2 Curtiu
Publicações
Ver tradução
📈 Bullish Market Structure: Where Do Buyers Step In?
A bullish market structure is generally identified by price creating Higher Highs (HH) and Higher Lows (HL).
But here’s the interesting part 👇
When price pulls back during an uptrend, traders often look for areas where buying interest may return.
🔹 Bullish Demand Zone
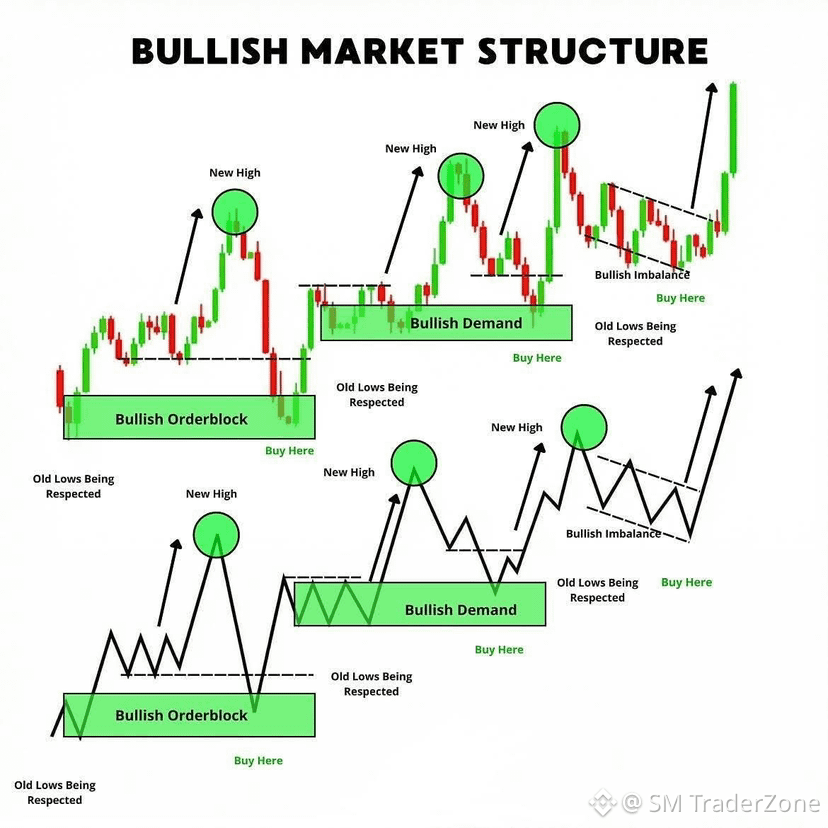
A demand zone is an area where strong buying previously entered the market and pushed price higher. If price returns to that area, traders may watch how price reacts.
🔹 Bullish Order Block
A bullish order block is commonly identified around the last bearish candle or small bearish consolidation before a strong bullish move that breaks structure.
📊 How They Fit Into Bullish Structure
Higher High → Pullback → Demand / Order Block Area → Bullish Reaction → Higher High
The important thing is not simply marking every zone on the chart.
Traders should also look at:
• Market structure
• Strength of the move
• Break of structure
• Price reaction at the zone
• Liquidity around the area
💡 Educational Note
A demand zone or bullish order block is not a guarantee that price will move higher. Context and confirmation matter.
The chart above shows how these concepts can appear within a bullish market structure.
👀 What do you focus on more?
Bullish Order Blocks 📦
or
Demand Zones 📈
Share your thoughts below.
#CryptoEducation #PriceAction #MarketStructure #orderblock #DemandZones #tradingeducation #cryptotrading #BinanceSquare
📈 Bullish Market Structure: Where Do Buyers Step In?
A bullish market structure is generally identified by price creating Higher Highs (HH) and Higher Lows (HL).
But here’s the interesting part 👇
When price pulls back during an uptrend, traders often look for areas where buying interest may return.
🔹 Bullish Demand Zone
A demand zone is an area where strong buying previously entered the market and pushed price higher. If price returns to that area, traders may watch how price reacts.
🔹 Bullish Order Block
A bullish order block is commonly identified around the last bearish candle or small bearish consolidation before a strong bullish move that breaks structure.
📊 How They Fit Into Bullish Structure
Higher High → Pullback → Demand / Order Block Area → Bullish Reaction → Higher High
The important thing is not simply marking every zone on the chart.
Traders should also look at:
• Market structure
• Strength of the move
• Break of structure
• Price reaction at the zone
• Liquidity around the area
💡 Educational Note
A demand zone or bullish order block is not a guarantee that price will move higher. Context and confirmation matter.
The chart above shows how these concepts can appear within a bullish market structure.
👀 What do you focus on more?
Bullish Order Blocks 📦
or
Demand Zones 📈
Share your thoughts below.
#CryptoEducation #PriceAction #MarketStructure #orderblock #DemandZones #tradingeducation #cryptotrading #BinanceSquare
A bullish market structure is generally identified by price creating Higher Highs (HH) and Higher Lows (HL).
But here’s the interesting part 👇
When price pulls back during an uptrend, traders often look for areas where buying interest may return.
🔹 Bullish Demand Zone
A demand zone is an area where strong buying previously entered the market and pushed price higher. If price returns to that area, traders may watch how price reacts.
🔹 Bullish Order Block
A bullish order block is commonly identified around the last bearish candle or small bearish consolidation before a strong bullish move that breaks structure.
📊 How They Fit Into Bullish Structure
Higher High → Pullback → Demand / Order Block Area → Bullish Reaction → Higher High
The important thing is not simply marking every zone on the chart.
Traders should also look at:
• Market structure
• Strength of the move
• Break of structure
• Price reaction at the zone
• Liquidity around the area
💡 Educational Note
A demand zone or bullish order block is not a guarantee that price will move higher. Context and confirmation matter.
The chart above shows how these concepts can appear within a bullish market structure.
👀 What do you focus on more?
Bullish Order Blocks 📦
or
Demand Zones 📈
Share your thoughts below.
#CryptoEducation #PriceAction #MarketStructure #orderblock #DemandZones #tradingeducation #cryptotrading #BinanceSquare
1
1
280
🚨 Bitcoin está recuando — o que acontece a seguir?
O Bitcoin está sendo negociado por volta de US$ 82,9 mil hoje, caindo aproximadamente 2% nas últimas 24 horas. Recentemente, o BTC teve dificuldades para romper acima da região de US$ 85 mil, e a rejeição trouxe novamente pressão vendedora de curto prazo para o mercado. (Binance)
📊 Principais níveis que estou observando
🔹 Resistência: US$ 85.000
🔹 Suporte de curto prazo: US$ 83.000
🔹 Próxima área relevante de queda: por volta de US$ 82.600
Se o BTC conseguir recuperar e manter a região de US$ 85 mil, o momentum pode melhorar. Mas se a zona de suporte de US$ 83 mil for rompida com forte volume de vendas, o mercado pode ver uma fraqueza maior no curto prazo. Estes são cenários, não previsões. (CoinMarketCap)
📚 Insight educacional
Quando o Bitcoin falha em romper um nível importante de resistência, traders costumam observar se o preço consegue sustentar o suporte anterior. Uma rejeição na resistência seguida de uma quebra do suporte pode indicar que os vendedores estão ganhando controle no curto prazo.
💭 Meu ponto de vista
Por enquanto, eu prefiro observar a reação em torno de US$ 83 mil em vez de correr atrás de um movimento em qualquer direção. O próximo grande catalisador macro é o dado de inflação do PCE dos EUA esperado para 30 de setembro, o que pode adicionar volatilidade ao cripto e a outros ativos de risco. (CoinMarketCap)
👀 O que você está observando?
BTC acima de US$ 85 mil 🚀
ou
BTC abaixo de US$ 83 mil 📉
Compartilhe sua análise nos comentários.
#Bitcoin #BTC #Crypto #Ethereum #BinanceSquare #CryptoMarket #BitcoinAnalysis #Trading
🚨 Bitcoin está recuando — o que acontece a seguir?
O Bitcoin está sendo negociado por volta de US$ 82,9 mil hoje, caindo aproximadamente 2% nas últimas 24 horas. Recentemente, o BTC teve dificuldades para romper acima da região de US$ 85 mil, e a rejeição trouxe novamente pressão vendedora de curto prazo para o mercado. (Binance)
📊 Principais níveis que estou observando
🔹 Resistência: US$ 85.000
🔹 Suporte de curto prazo: US$ 83.000
🔹 Próxima área relevante de queda: por volta de US$ 82.600
Se o BTC conseguir recuperar e manter a região de US$ 85 mil, o momentum pode melhorar. Mas se a zona de suporte de US$ 83 mil for rompida com forte volume de vendas, o mercado pode ver uma fraqueza maior no curto prazo. Estes são cenários, não previsões. (CoinMarketCap)
📚 Insight educacional
Quando o Bitcoin falha em romper um nível importante de resistência, traders costumam observar se o preço consegue sustentar o suporte anterior. Uma rejeição na resistência seguida de uma quebra do suporte pode indicar que os vendedores estão ganhando controle no curto prazo.
💭 Meu ponto de vista
Por enquanto, eu prefiro observar a reação em torno de US$ 83 mil em vez de correr atrás de um movimento em qualquer direção. O próximo grande catalisador macro é o dado de inflação do PCE dos EUA esperado para 30 de setembro, o que pode adicionar volatilidade ao cripto e a outros ativos de risco. (CoinMarketCap)
👀 O que você está observando?
BTC acima de US$ 85 mil 🚀
ou
BTC abaixo de US$ 83 mil 📉
Compartilhe sua análise nos comentários.
#Bitcoin #BTC #Crypto #Ethereum #BinanceSquare #CryptoMarket #BitcoinAnalysis #Trading
O Bitcoin está sendo negociado por volta de US$ 82,9 mil hoje, caindo aproximadamente 2% nas últimas 24 horas. Recentemente, o BTC teve dificuldades para romper acima da região de US$ 85 mil, e a rejeição trouxe novamente pressão vendedora de curto prazo para o mercado. (Binance)
📊 Principais níveis que estou observando
🔹 Resistência: US$ 85.000
🔹 Suporte de curto prazo: US$ 83.000
🔹 Próxima área relevante de queda: por volta de US$ 82.600
Se o BTC conseguir recuperar e manter a região de US$ 85 mil, o momentum pode melhorar. Mas se a zona de suporte de US$ 83 mil for rompida com forte volume de vendas, o mercado pode ver uma fraqueza maior no curto prazo. Estes são cenários, não previsões. (CoinMarketCap)
📚 Insight educacional
Quando o Bitcoin falha em romper um nível importante de resistência, traders costumam observar se o preço consegue sustentar o suporte anterior. Uma rejeição na resistência seguida de uma quebra do suporte pode indicar que os vendedores estão ganhando controle no curto prazo.
💭 Meu ponto de vista
Por enquanto, eu prefiro observar a reação em torno de US$ 83 mil em vez de correr atrás de um movimento em qualquer direção. O próximo grande catalisador macro é o dado de inflação do PCE dos EUA esperado para 30 de setembro, o que pode adicionar volatilidade ao cripto e a outros ativos de risco. (CoinMarketCap)
👀 O que você está observando?
BTC acima de US$ 85 mil 🚀
ou
BTC abaixo de US$ 83 mil 📉
Compartilhe sua análise nos comentários.
#Bitcoin #BTC #Crypto #Ethereum #BinanceSquare #CryptoMarket #BitcoinAnalysis #Trading
4
1
313
Faça login para explorar mais conteúdos
Junte-se a usuários de criptomoedas de todo o mundo no Binance Square.
⚡️ Obter informações mais recentes e úteis sobre criptomoeda.
💬 Com a confiança da maior corretora de criptomoedas do mundo.
👍 Descubra insights reais de criadores verificados.
E-mail / número de telefone
Tópicos em Alta
BitcoinClears$85200
6,344 visualizações
167 discutindo
Recebemos o movimento, e $BTC está exatamente onde estava antes dos dados. É assim que a paciência real para uma operação funciona.
Os dados chegaram misturados, mas com alguns números importantes. A variação do emprego não-agrícola (ADP) veio em 90K contra 73K previstos, enquanto o núcleo do PCE veio em 0,2% contra 0,3% esperados. O PIB final também veio mais forte, em 2,2% contra 1,5% previsto, enquanto os gastos pessoais vieram em 0,9% contra 0,8% esperados. Ao mesmo tempo, a renda pessoal ficou abaixo do esperado, em 0,2% contra 0,5% previsto.
O BTC inicialmente disparou para US$ 85.600 e agora voltou para onde precisava estar. Ainda estou de olho nas faixas mais baixas, em US$ 82.759 e na liquidez de US$ 80.000, porque a liquidez acima já foi concluída, sem volta.
Tivemos uma sessão ao vivo durante os dados e, durante essa sessão, vimos o mercado em US$ 83.800, depois US$ 85.600, e então voltando para cerca de US$ 83.000 — e ainda assim não entramos em uma operação.
É isso que é paciência.
Não dá para forçar uma entrada quando o mercado não tem uma direção clara. A mesma faixa ainda está em foco, e vamos esperar o mercado nos dar o setup.
Me digam, pessoal, como foi a sessão? E devemos ter mais sessões regulares com nossos membros respeitados para conseguirmos ter discussões adequadas sobre o mercado?
#BitcoinClears$85200 #AltcoinSeasonIndexHoldsAbove60For5Days #USADPAdds90000JobsInSeptember #BitcoinSlipsBelow$84000 #SECToClarifyOnChainFundraisingRules
Crypto_LUX
·24 curtidas
·12.5k visualizações
AltcoinSeasonIndexHoldsAbove60For5Days
35,569 visualizações
950 discutindo
USADPAdds90000JobsInSeptember
15,885 visualizações
538 discutindo