

Digital-Cryptor
867 Publicações

Digital-Cryptor
Denunciar
Bloquear usuário
Professional Trader. Having Proper Technical and Fundamental Analysis📈📉 📰... Mission to grow with my family #Digital-Cryptor💰
Trade aberto
Trader de alta frequência
1.8 anos
2 Seguindo
416 Seguidores
815 Curtiu
Publicações
Portfólio
Todas
Citações
Vídeos
·
--
Bullish
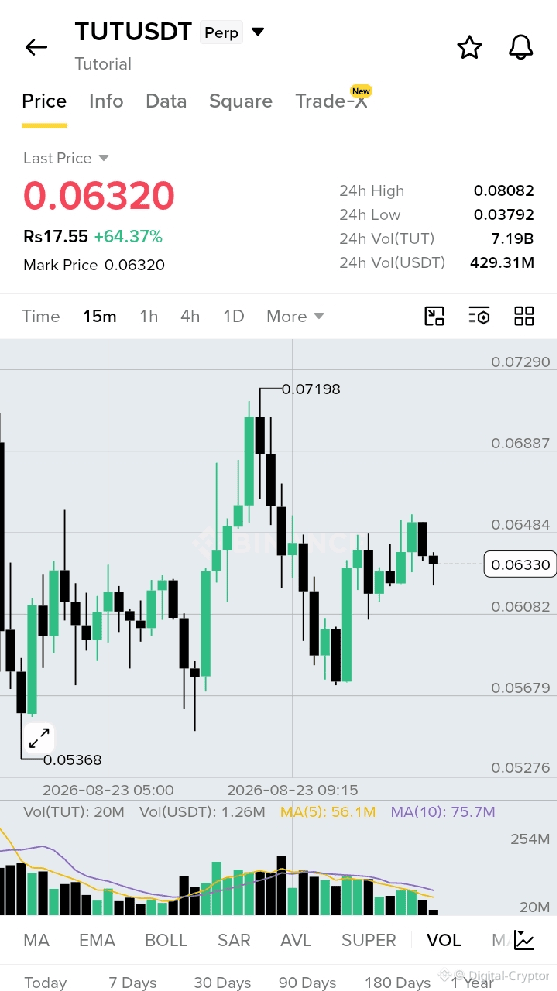
🚨 $TUT ESTÁ SE MOVENDO! 🚨
O Tutorial ($TUT) está sendo negociado por volta de US$ 0.0638, com alta de 65%+ nas últimas 24H 📈🔥
📊 Volume em 24H: US$ 429M
💰 Valor de Mercado: US$ 53,9M
📈 RSI: 61
⚡ Forte volume + momento otimista
Nível-chave para observar: US$ 0.064
A ruptura pode abrir caminho em direção a US$ 0.0788 👀
🚨 $TUT ESTÁ SE MOVENDO! 🚨
O Tutorial ($TUT) está sendo negociado por volta de US$ 0.0638, com alta de 65%+ nas últimas 24H 📈🔥
📊 Volume em 24H: US$ 429M
💰 Valor de Mercado: US$ 53,9M
📈 RSI: 61
⚡ Forte volume + momento otimista
Nível-chave para observar: US$ 0.064
A ruptura pode abrir caminho em direção a US$ 0.0788 👀
O Tutorial ($TUT) está sendo negociado por volta de US$ 0.0638, com alta de 65%+ nas últimas 24H 📈🔥
📊 Volume em 24H: US$ 429M
💰 Valor de Mercado: US$ 53,9M
📈 RSI: 61
⚡ Forte volume + momento otimista
Nível-chave para observar: US$ 0.064
A ruptura pode abrir caminho em direção a US$ 0.0788 👀
142
·
--
Bullish
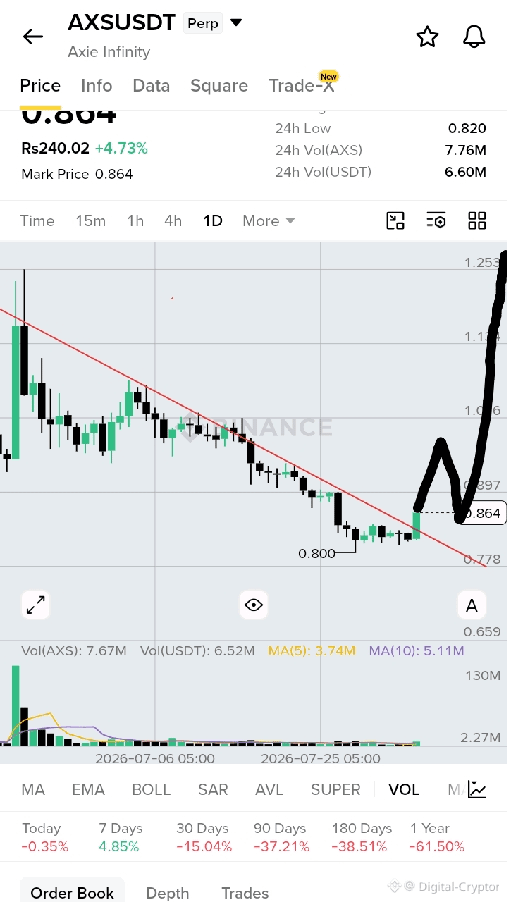
$AXS s está rompendo a linha de resistência da tendência, mudando seu caráter para altista.
Longo $AXS
Entrada 0.866
TP1🎯 0.920
TP2🎯0.980
TP3🎯 1.01
SL🪀 0.790
$AXS s está rompendo a linha de resistência da tendência, mudando seu caráter para altista.
Longo $AXS
Entrada 0.866
TP1🎯 0.920
TP2🎯0.980
TP3🎯 1.01
SL🪀 0.790
Longo $AXS
Entrada 0.866
TP1🎯 0.920
TP2🎯0.980
TP3🎯 1.01
SL🪀 0.790
225
Artigo
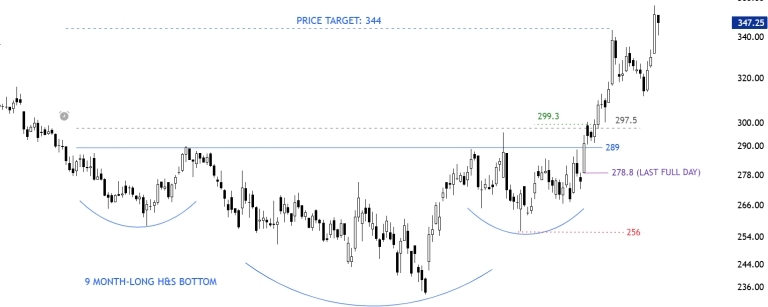
Usando a Menor do Último Dia Completo para Avaliar a Qualidade da RupturaEmbora a Menor do Último Dia Completo seja uma referência excelente para stop-loss, ela também pode revelar informações valiosas sobre a força da própria ruptura.
Nem todas as rupturas bem-sucedidas se comportam da mesma maneira.
Alguns disparam para cima sem hesitação.
Outros recuam para testar a resistência anterior antes de continuar.
Alguns passam por fortes sacudidas antes de, finalmente, atingir seus objetivos.
Outros falham completamente.
Essas diferenças podem ser organizadas em quatro tipos objetivos de ruptura.
Tipo 1 – Ruptura por Momento
Uma ruptura do tipo 1 ocorre quando o preço rompe um padrão de gráfico e avança diretamente em direção ao seu objetivo de preço medido, sem qualquer recuo significativo.
Usando a Menor do Último Dia Completo para Avaliar a Qualidade da Ruptura
Embora a Menor do Último Dia Completo seja uma referência excelente para stop-loss, ela também pode revelar informações valiosas sobre a força da própria ruptura.
Nem todas as rupturas bem-sucedidas se comportam da mesma maneira.
Alguns disparam para cima sem hesitação.
Outros recuam para testar a resistência anterior antes de continuar.
Alguns passam por fortes sacudidas antes de, finalmente, atingir seus objetivos.
Outros falham completamente.
Essas diferenças podem ser organizadas em quatro tipos objetivos de ruptura.
Tipo 1 – Ruptura por Momento
Uma ruptura do tipo 1 ocorre quando o preço rompe um padrão de gráfico e avança diretamente em direção ao seu objetivo de preço medido, sem qualquer recuo significativo.
Nem todas as rupturas bem-sucedidas se comportam da mesma maneira.
Alguns disparam para cima sem hesitação.
Outros recuam para testar a resistência anterior antes de continuar.
Alguns passam por fortes sacudidas antes de, finalmente, atingir seus objetivos.
Outros falham completamente.
Essas diferenças podem ser organizadas em quatro tipos objetivos de ruptura.
Tipo 1 – Ruptura por Momento
Uma ruptura do tipo 1 ocorre quando o preço rompe um padrão de gráfico e avança diretamente em direção ao seu objetivo de preço medido, sem qualquer recuo significativo.
142
·
--
Bullish
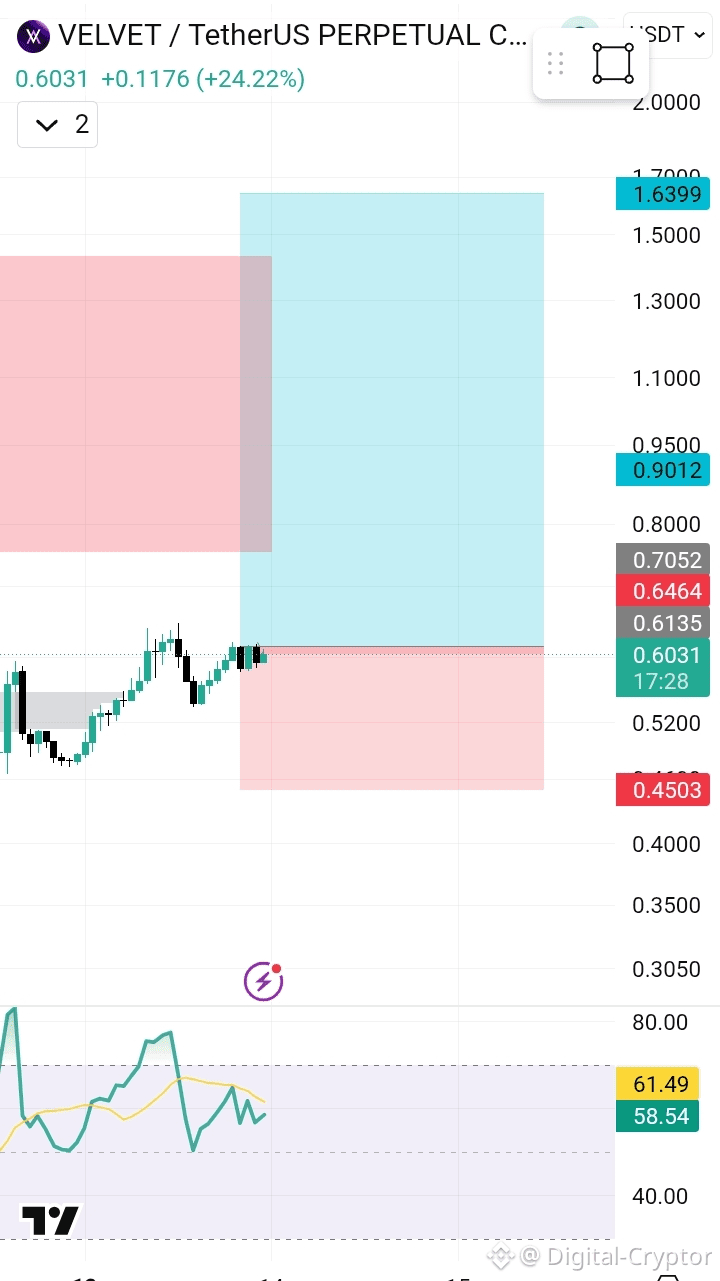
$VELVET está subindo pela terceira vez; os compradores de terceira vez estão ganhando força. Aguarde a ruptura da resistência no período de 1H antes de executar.
Long $VELVET
{future}(VELVETUSDT)
Entrada: 0.6025- 0.6545
TP1 0.7523
TP2 0.8656
TP3 0.9823
SL 0.4503
$VELVET está subindo pela terceira vez; os compradores de terceira vez estão ganhando força. Aguarde a ruptura da resistência no período de 1H antes de executar.
Long $VELVET
Entrada: 0.6025- 0.6545
TP1 0.7523
TP2 0.8656
TP3 0.9823
SL 0.4503
Long $VELVET
Entrada: 0.6025- 0.6545
TP1 0.7523
TP2 0.8656
TP3 0.9823
SL 0.4503
154
O Bitcoin fica perto de US$ 63.800 à medida que uma onda de vendas impulsionada pela guerra atinge tudo, exceto as criptomoedas
O ouro, o petróleo, as ações e os títulos públicos se moveram de forma acentuada na quarta rodada de ataques dos EUA ao Irã, mas o bitcoin mudou pouco.
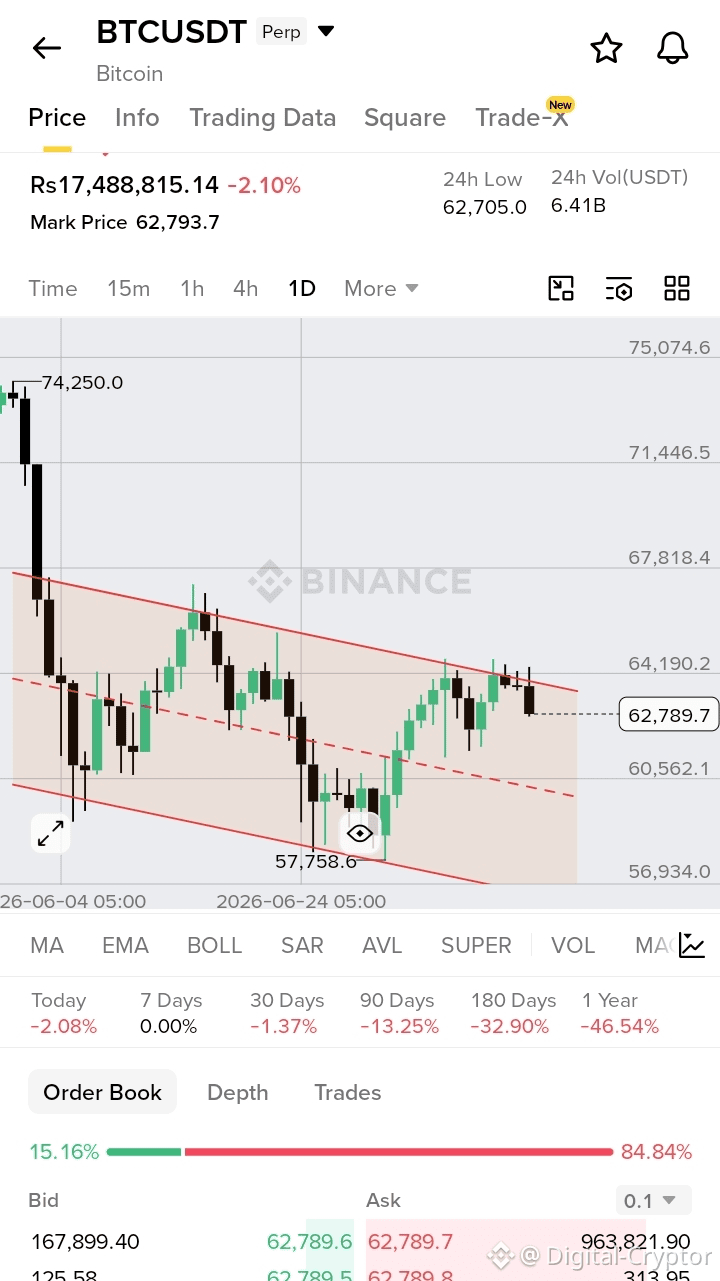
O bitcoin ficou perto de US$ 63.800 na segunda-feira, enquanto ouro, petróleo, ações e títulos do governo caíram com a quarta rodada de ataques dos EUA ao Irã na semana. A maior criptomoeda caiu 0,3% nas últimas 24 horas e subiu 2% no acumulado da semana.
A reação dos mercados tradicionais, que ficou no aguardo durante o fim de semana, chegou de uma vez. O ouro à vista recuou até 1,6% para perto de US$ 4.050 a onça. O Brent disparou 4% para acima de US$ 79 por barril, à medida que reivindicações conflitantes sobre o Estreito de Ormuz alimentaram preocupações com a .
disponibilidade de oferta
Os Treasuries caíram ao longo da curva, com o rendimento do título de dois anos subindo para o maior nível desde fevereiro de 2025, e o indicador de ações da Ásia-Pacífico da MSCI caiu 1,6%.
O Comando Central afirmou que as forças dos EUA atingiram o Irã em resposta a um ataque a um navio porta-contêineres. O status do estreito ficou incerto, com os EUA negando a declaração do Irã de que o canal seria fechado "até aviso posterior". Cerca de um quinto do petróleo marítimo do mundo normalmente passa por Ormuz.
Os movimentos precificaram um único temor: que uma guerra mais ampla mantenha o petróleo em patamares elevados e obrigue o Federal Reserve a sustentar as taxas mais altas por mais tempo. As atas da reunião de junho do Fed mostram que alguns formuladores viram um caso para elevar as taxas antes de optar por uma pausa. O ouro caiu porque uma trajetória de "mais alto por mais tempo" eleva os juros reais e reduz o apelo do metal que não paga nada, e os títulos caíram pelo mesmo motivo.
Mas o bitcoin ficou fora de tudo isso. O ether mudou pouco, em cerca de US$ 1.800, subindo 2% na semana, e o restante das principais criptos praticamente não se moveu no dia, com a Solana sendo a mais fraca, a US$ 76, caindo 5% ao longo de sete dias. O XRP ficou em US$ 1,09 e o dogecoin permaneceu perto de US$ 0,07.
Um fio condutor com relevância para criptos passa pelas ações sul-coreanas. As ações da SK Hynix despencaram 12% em Seul após as ações do chipmaker listadas nos EUA terem saltado 13% em sua estreia na sexta-feira, uma reversão que ajudou a derrubar o Kospi 7%. Esse negócio com chips impulsionou a alta que elevou o bitcoin na sexta-feira, e sua reversão brusca na segunda-feira ainda deixou a cripto praticamente estável, em qualquer direção.
O Bitcoin fica perto de US$ 63.800 à medida que uma onda de vendas impulsionada pela guerra atinge tudo, exceto as criptomoedas
O ouro, o petróleo, as ações e os títulos públicos se moveram de forma acentuada na quarta rodada de ataques dos EUA ao Irã, mas o bitcoin mudou pouco.
O bitcoin ficou perto de US$ 63.800 na segunda-feira, enquanto ouro, petróleo, ações e títulos do governo caíram com a quarta rodada de ataques dos EUA ao Irã na semana. A maior criptomoeda caiu 0,3% nas últimas 24 horas e subiu 2% no acumulado da semana.
A reação dos mercados tradicionais, que ficou no aguardo durante o fim de semana, chegou de uma vez. O ouro à vista recuou até 1,6% para perto de US$ 4.050 a onça. O Brent disparou 4% para acima de US$ 79 por barril, à medida que reivindicações conflitantes sobre o Estreito de Ormuz alimentaram preocupações com a .
disponibilidade de oferta
Os Treasuries caíram ao longo da curva, com o rendimento do título de dois anos subindo para o maior nível desde fevereiro de 2025, e o indicador de ações da Ásia-Pacífico da MSCI caiu 1,6%.
O Comando Central afirmou que as forças dos EUA atingiram o Irã em resposta a um ataque a um navio porta-contêineres. O status do estreito ficou incerto, com os EUA negando a declaração do Irã de que o canal seria fechado "até aviso posterior". Cerca de um quinto do petróleo marítimo do mundo normalmente passa por Ormuz.
Os movimentos precificaram um único temor: que uma guerra mais ampla mantenha o petróleo em patamares elevados e obrigue o Federal Reserve a sustentar as taxas mais altas por mais tempo. As atas da reunião de junho do Fed mostram que alguns formuladores viram um caso para elevar as taxas antes de optar por uma pausa. O ouro caiu porque uma trajetória de "mais alto por mais tempo" eleva os juros reais e reduz o apelo do metal que não paga nada, e os títulos caíram pelo mesmo motivo.
Mas o bitcoin ficou fora de tudo isso. O ether mudou pouco, em cerca de US$ 1.800, subindo 2% na semana, e o restante das principais criptos praticamente não se moveu no dia, com a Solana sendo a mais fraca, a US$ 76, caindo 5% ao longo de sete dias. O XRP ficou em US$ 1,09 e o dogecoin permaneceu perto de US$ 0,07.
Um fio condutor com relevância para criptos passa pelas ações sul-coreanas. As ações da SK Hynix despencaram 12% em Seul após as ações do chipmaker listadas nos EUA terem saltado 13% em sua estreia na sexta-feira, uma reversão que ajudou a derrubar o Kospi 7%. Esse negócio com chips impulsionou a alta que elevou o bitcoin na sexta-feira, e sua reversão brusca na segunda-feira ainda deixou a cripto praticamente estável, em qualquer direção.
O ouro, o petróleo, as ações e os títulos públicos se moveram de forma acentuada na quarta rodada de ataques dos EUA ao Irã, mas o bitcoin mudou pouco.
O bitcoin ficou perto de US$ 63.800 na segunda-feira, enquanto ouro, petróleo, ações e títulos do governo caíram com a quarta rodada de ataques dos EUA ao Irã na semana. A maior criptomoeda caiu 0,3% nas últimas 24 horas e subiu 2% no acumulado da semana.
A reação dos mercados tradicionais, que ficou no aguardo durante o fim de semana, chegou de uma vez. O ouro à vista recuou até 1,6% para perto de US$ 4.050 a onça. O Brent disparou 4% para acima de US$ 79 por barril, à medida que reivindicações conflitantes sobre o Estreito de Ormuz alimentaram preocupações com a .
disponibilidade de oferta
Os Treasuries caíram ao longo da curva, com o rendimento do título de dois anos subindo para o maior nível desde fevereiro de 2025, e o indicador de ações da Ásia-Pacífico da MSCI caiu 1,6%.
O Comando Central afirmou que as forças dos EUA atingiram o Irã em resposta a um ataque a um navio porta-contêineres. O status do estreito ficou incerto, com os EUA negando a declaração do Irã de que o canal seria fechado "até aviso posterior". Cerca de um quinto do petróleo marítimo do mundo normalmente passa por Ormuz.
Os movimentos precificaram um único temor: que uma guerra mais ampla mantenha o petróleo em patamares elevados e obrigue o Federal Reserve a sustentar as taxas mais altas por mais tempo. As atas da reunião de junho do Fed mostram que alguns formuladores viram um caso para elevar as taxas antes de optar por uma pausa. O ouro caiu porque uma trajetória de "mais alto por mais tempo" eleva os juros reais e reduz o apelo do metal que não paga nada, e os títulos caíram pelo mesmo motivo.
Mas o bitcoin ficou fora de tudo isso. O ether mudou pouco, em cerca de US$ 1.800, subindo 2% na semana, e o restante das principais criptos praticamente não se moveu no dia, com a Solana sendo a mais fraca, a US$ 76, caindo 5% ao longo de sete dias. O XRP ficou em US$ 1,09 e o dogecoin permaneceu perto de US$ 0,07.
Um fio condutor com relevância para criptos passa pelas ações sul-coreanas. As ações da SK Hynix despencaram 12% em Seul após as ações do chipmaker listadas nos EUA terem saltado 13% em sua estreia na sexta-feira, uma reversão que ajudou a derrubar o Kospi 7%. Esse negócio com chips impulsionou a alta que elevou o bitcoin na sexta-feira, e sua reversão brusca na segunda-feira ainda deixou a cripto praticamente estável, em qualquer direção.

72
·
--
Bearish
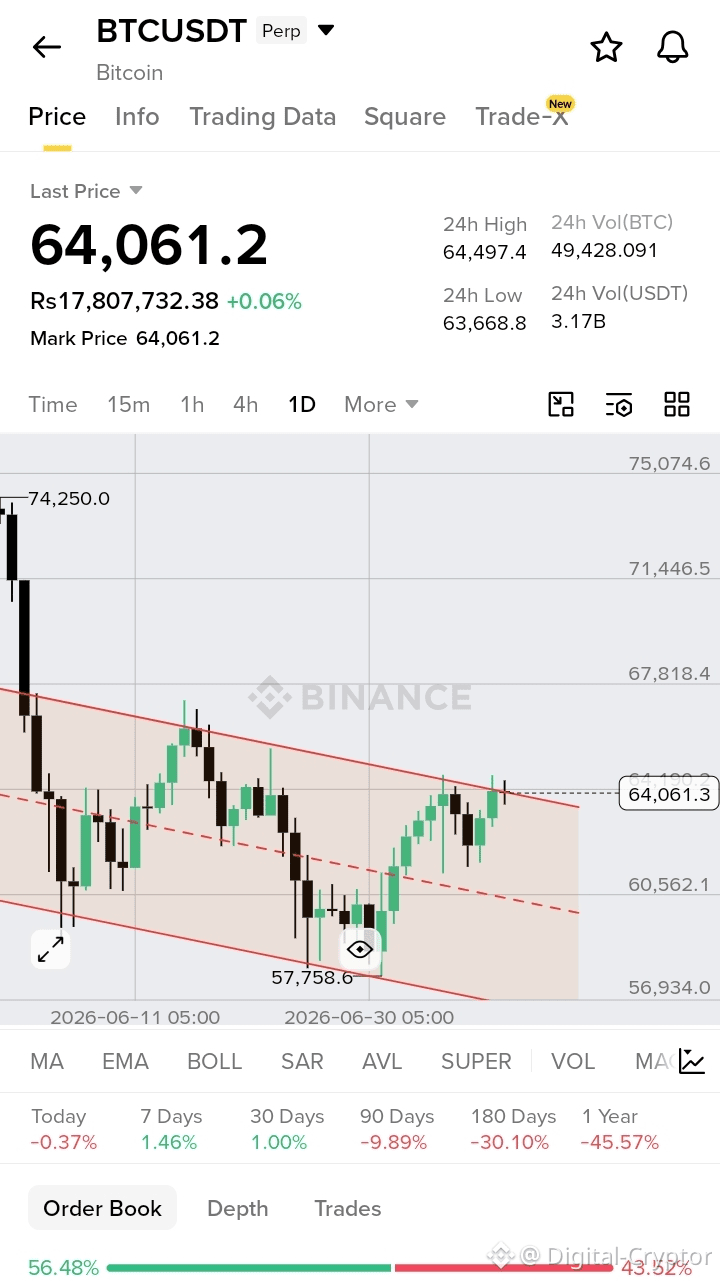
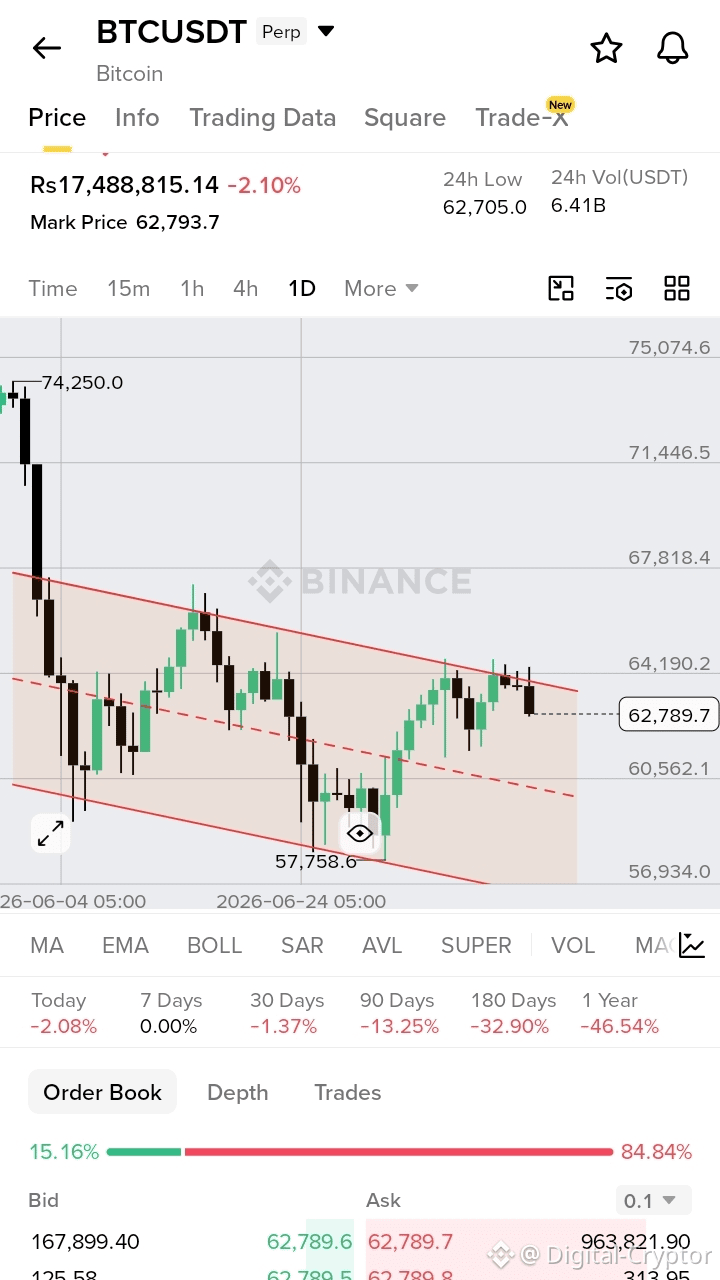
Como foi dito anteriormente, $BTC foi rejeitado da linha de resistência da tendência. Parece que os vendedores estão tão confiantes em empurrar o preço de volta para a zona de 56k-55k.
Como foi dito anteriormente, $BTC foi rejeitado da linha de resistência da tendência. Parece que os vendedores estão tão confiantes em empurrar o preço de volta para a zona de 56k-55k.
Digital-Cryptor
·
--
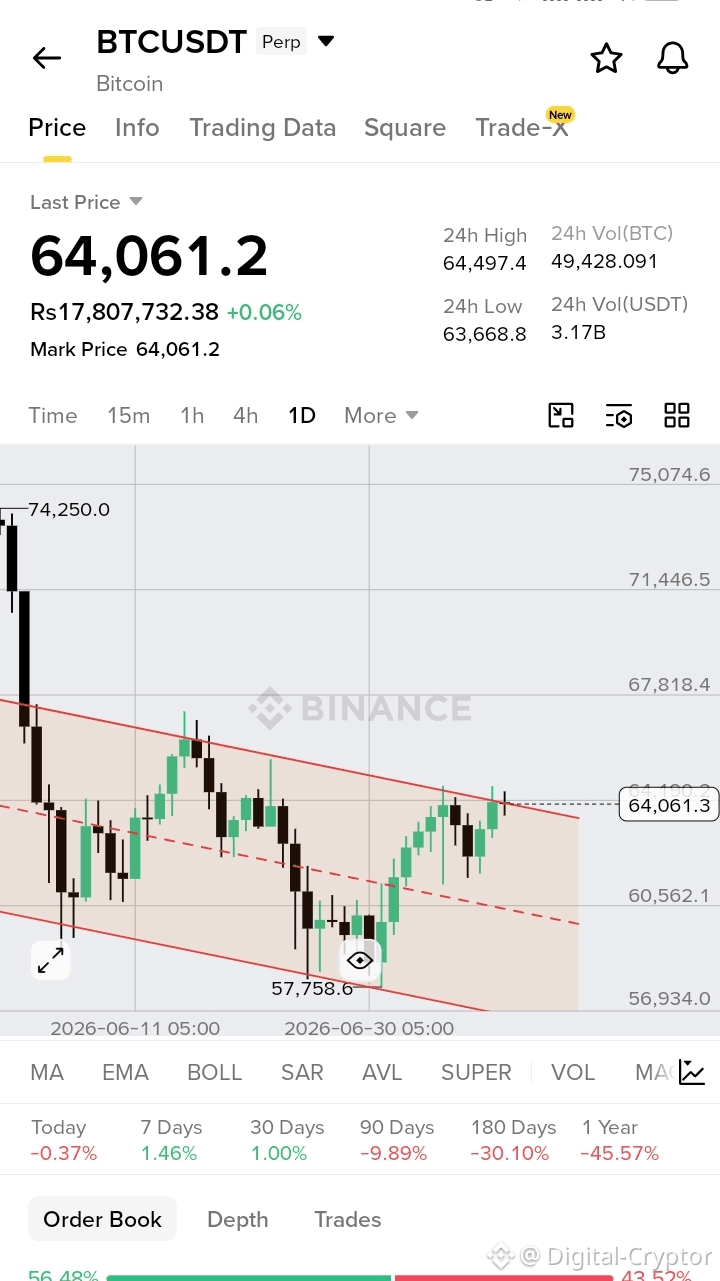
Bullish$BTC está chegando à zona de rejeição. se houver rompimento com uma vela forte de volume, então pode facilmente revelar a faixa de 66k-67k.
94
·
--
Bullish
$BTC está chegando à zona de rejeição. se houver rompimento com uma vela forte de volume, então pode facilmente revelar a faixa de 66k-67k.
$BTC está chegando à zona de rejeição. se houver rompimento com uma vela forte de volume, então pode facilmente revelar a faixa de 66k-67k.
1
1
122
Faça login para explorar mais conteúdos
Junte-se a usuários de criptomoedas de todo o mundo no Binance Square.
⚡️ Obter informações mais recentes e úteis sobre criptomoeda.
💬 Com a confiança da maior corretora de criptomoedas do mundo.
👍 Descubra insights reais de criadores verificados.
E-mail / número de telefone
Tópicos em Alta
BNBSurpasses$790
15,410 visualizações
126 discutindo
$BNB plano estratégico de longo prazo -> FOQUE AGORA
O BNB criou 2 fortes mínimas após romper a liquidez interna
Estou esperando um movimento em direção à máxima da swing em US$ 815–US$ 830 e procuro uma compra (long) em uma retest da caixa verde
#BNBSurpasses$790 #bnb
Ghost Writer
·6 curtidas
·7.3k visualizações
ZamaRises15.99%ToIntradayHigh$0.09
12,468 visualizações
97 discutindo
BitcoinSpotETFsDraw$6.34BInflowsInQ3
5,230 visualizações
83 discutindo