
CryptoT 1
47 Publicações

CryptoT 1
Denunciar
Bloquear usuário
Technical Analysis Specialists
0 Seguindo
0 Seguidores
0 Curtiu
Publicações
·
--
Ver tradução
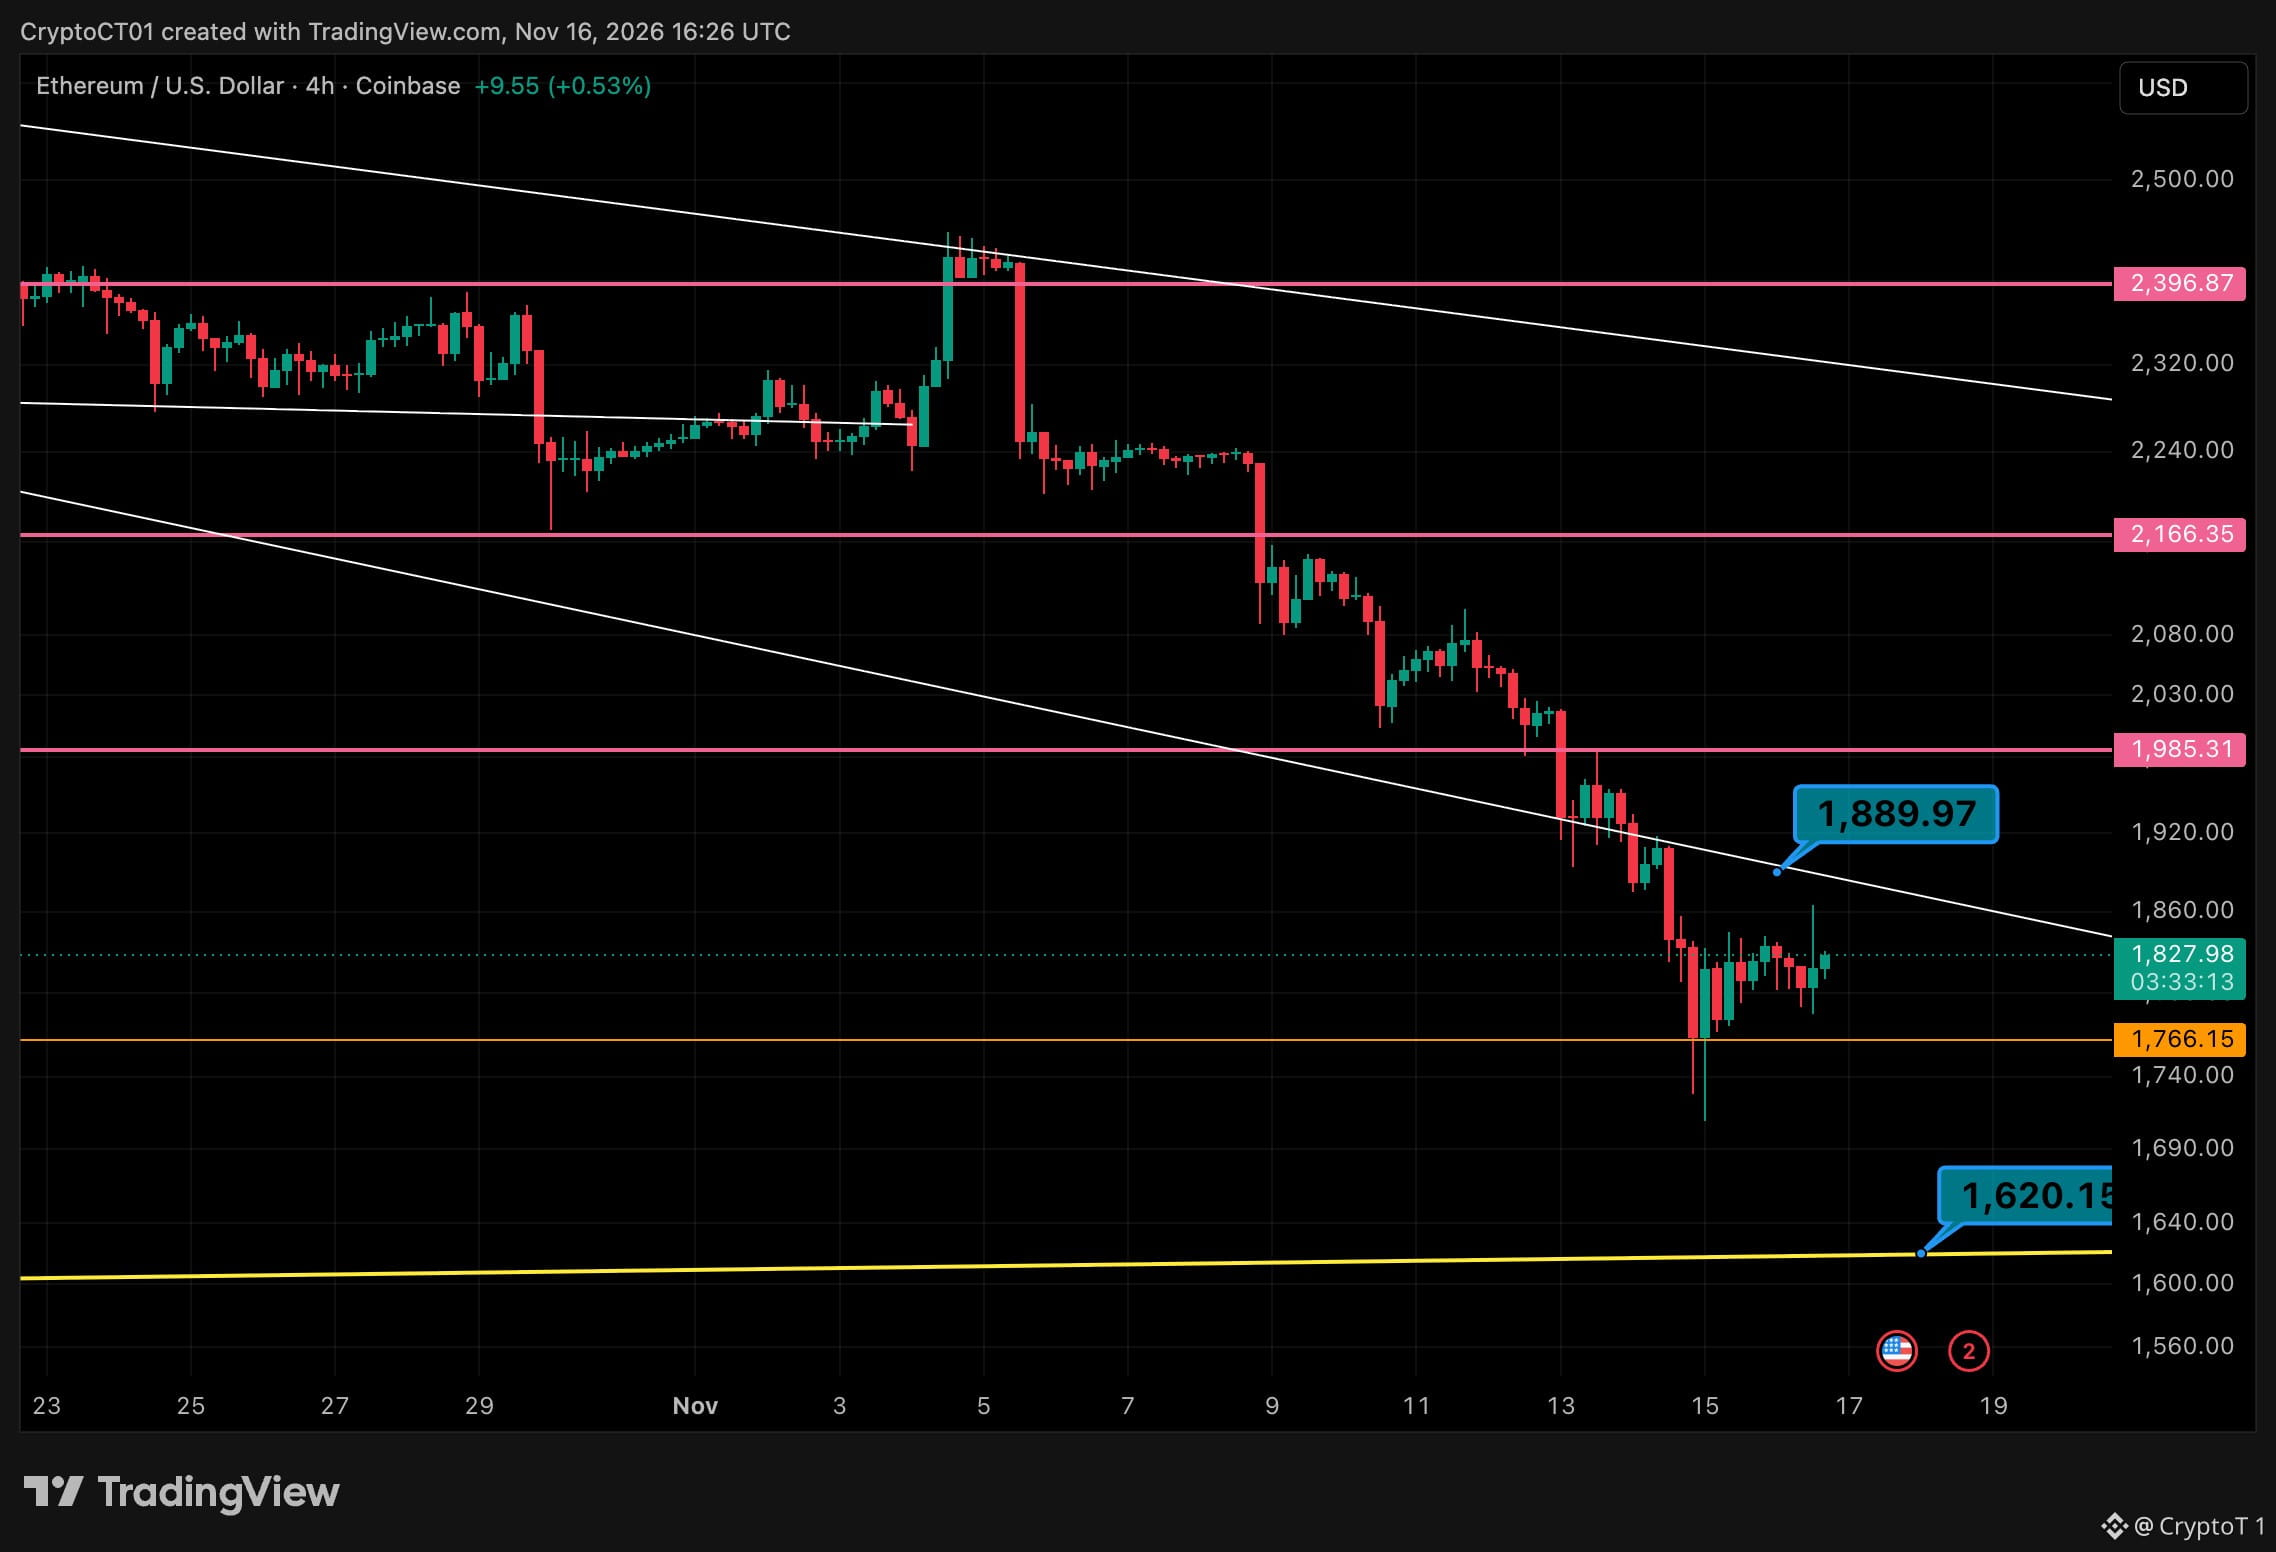
$ETH 4H: Squeezed Into The Trendline And Rejected 🧭 🔴 1,889.97 (falling trendline) 🔴 1,985.31 🟢 1,766.15 🟢 1,620.15 (long-term rising line) Context: ETH has been making lower highs since early Nov. Today's US open squeeze tapped near the trendline and faded straight back to 1,828. My read: until it closes a 4H candle above the trendline, every bounce is a lower high. 1,766 is the floor bulls have to defend. The risk: lose 1,766 and there's not much support until the 1,620 line. Trendline break or 1,620 retest first? 👇 #ETH #Crypto
$ETH 4H: Squeezed Into The Trendline And Rejected 🧭 🔴 1,889.97 (falling trendline) 🔴 1,985.31 🟢 1,766.15 🟢 1,620.15 (long-term rising line) Context: ETH has been making lower highs since early Nov. Today's US open squeeze tapped near the trendline and faded straight back to 1,828. My read: until it closes a 4H candle above the trendline, every bounce is a lower high. 1,766 is the floor bulls have to defend. The risk: lose 1,766 and there's not much support until the 1,620 line. Trendline break or 1,620 retest first? 👇 #ETH #Crypto
7
·
--
Ver tradução
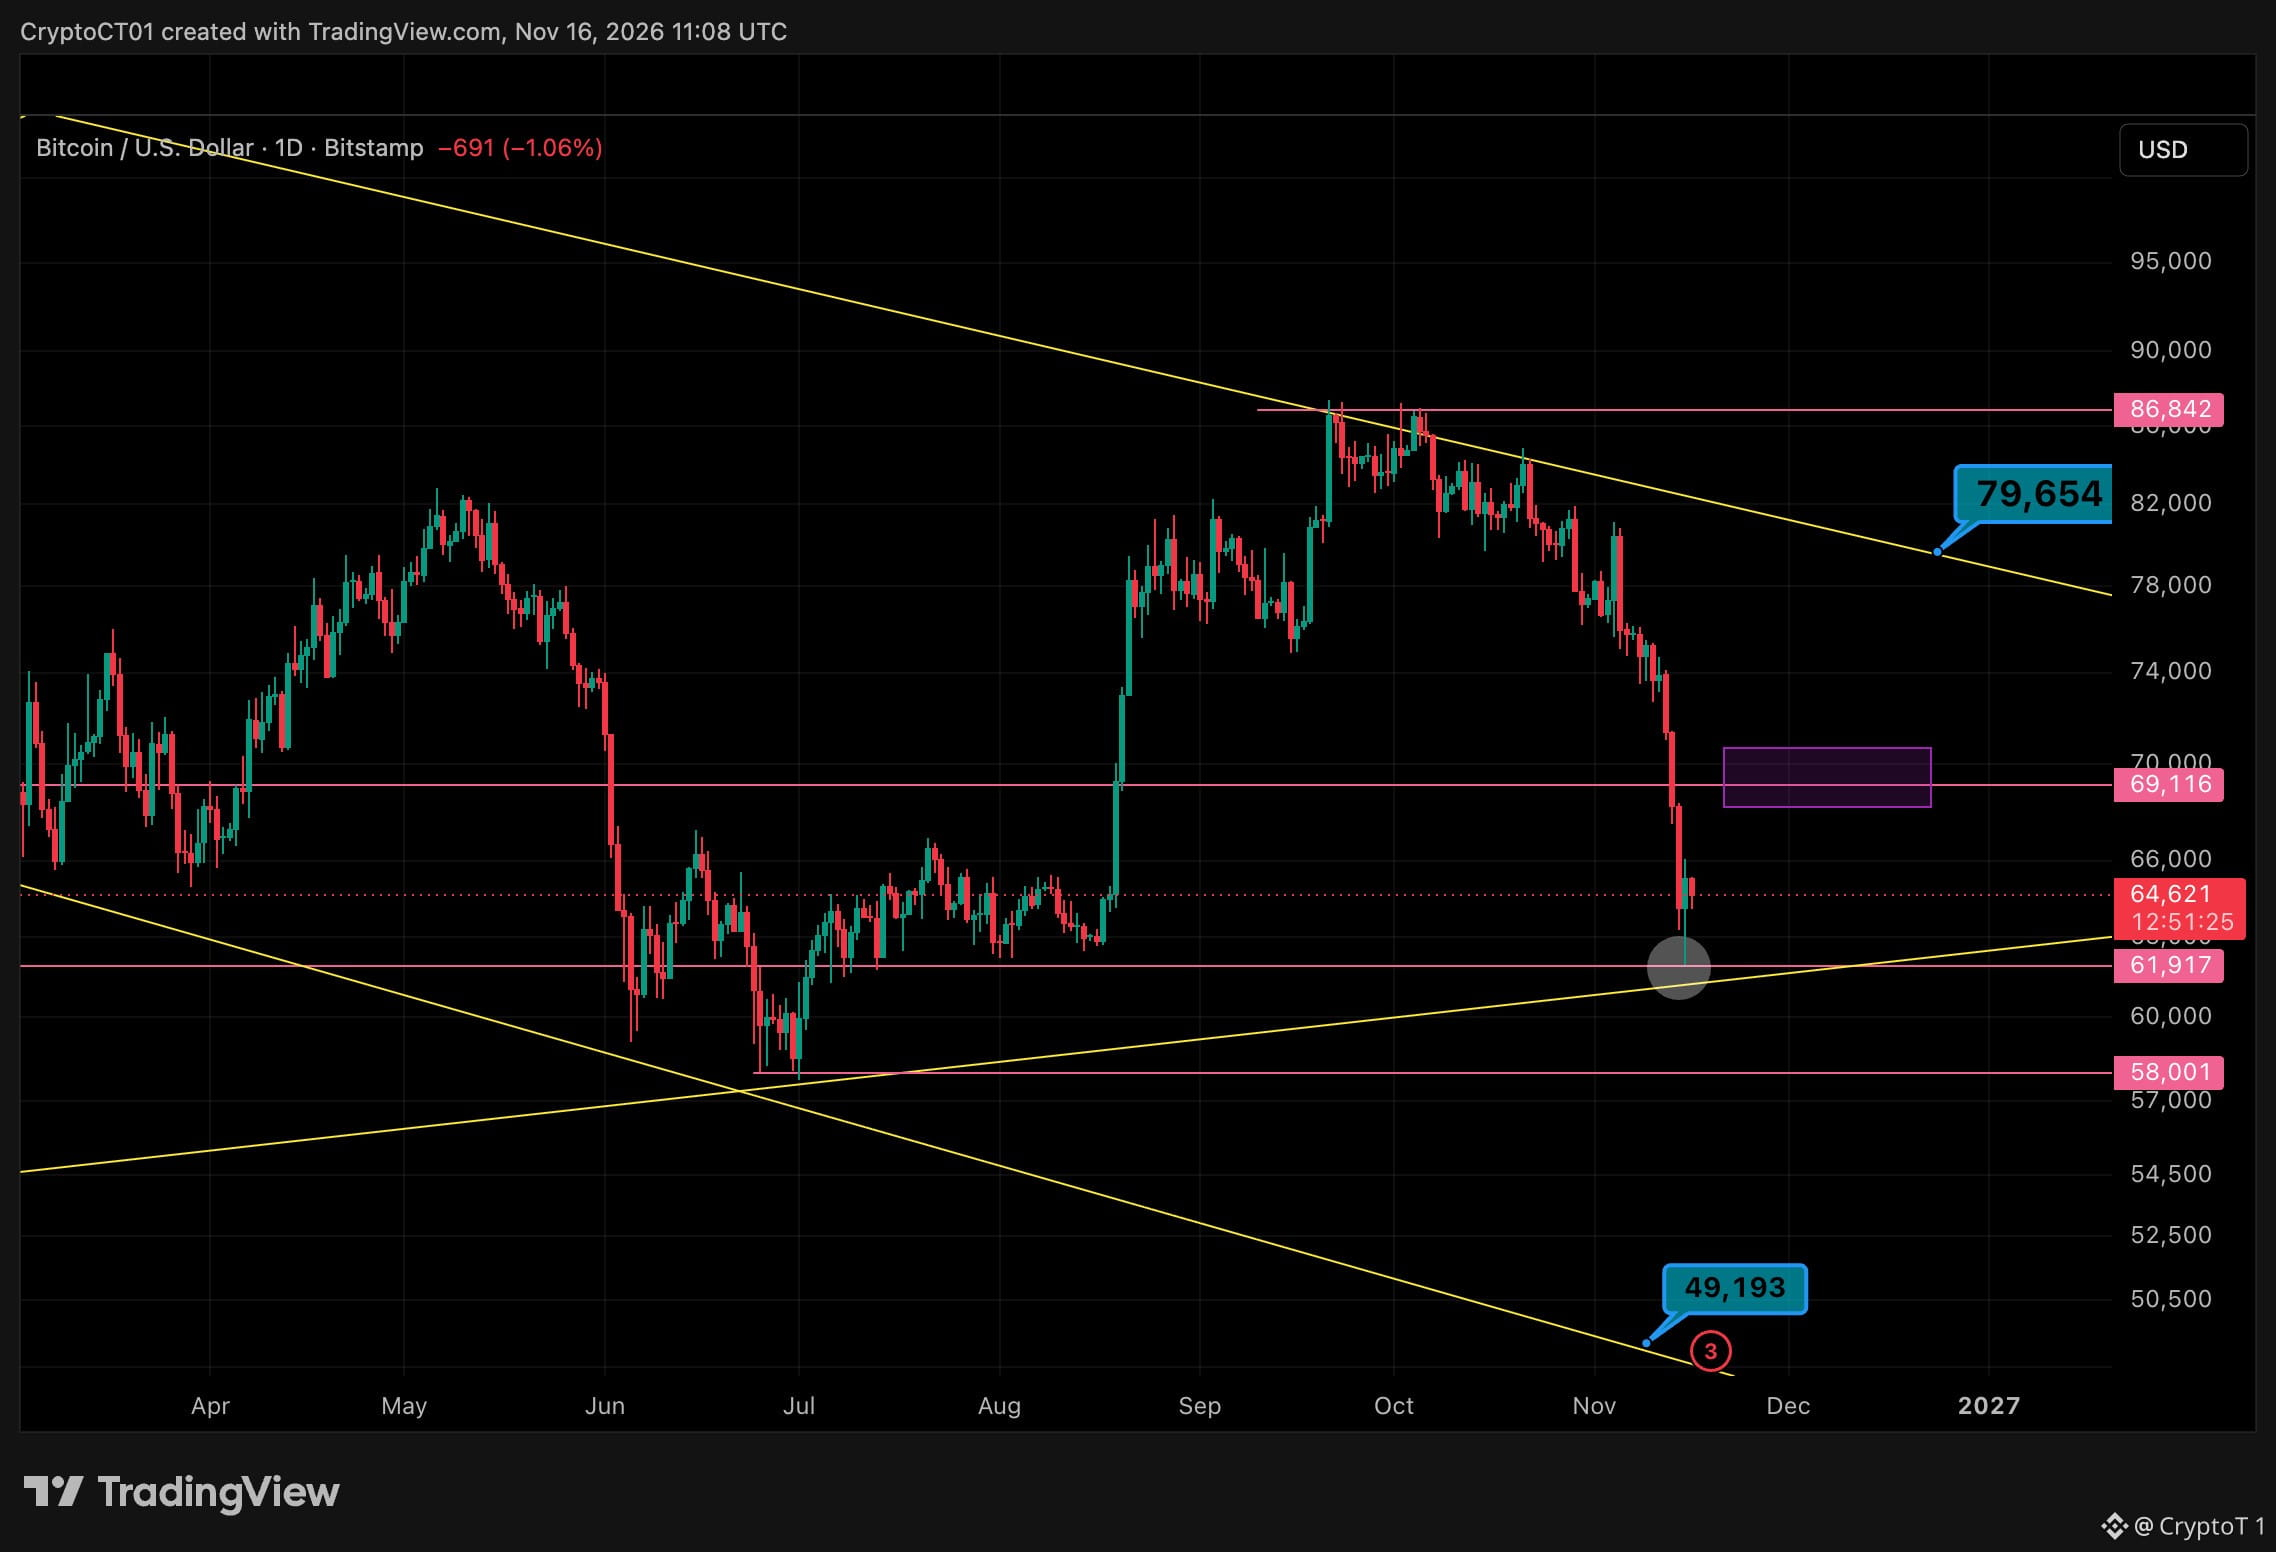
$BTC Higher Timeframe: Sitting On The Last Line Before 58K 🧭 Daily chart, weekly as confirmation. Six red weeks and price just tagged the rising trendline at 62K. 🔴 69,116 (old support, now resistance) 🔴 79,654 (falling trendline from the highs) 🟢 61,917 (rising trendline, the line that has to hold) 🟢 58,001 (summer lows) Context: BTC dropped from 86.8K straight through 69K and wicked into 62K. The weekly is still printing lower highs under the falling trendline. My read: 62K is the line that matters this week. If it holds, a relief bounce into 69K is on the table. That's where I'd expect sellers to step back in. The risk: lose 62K on a daily close and 58K is next. Below that, the channel floor points at 49K. Bounce to 69K or 58K first? 👇 #Bitcoin #BTC
$BTC Higher Timeframe: Sitting On The Last Line Before 58K 🧭 Daily chart, weekly as confirmation. Six red weeks and price just tagged the rising trendline at 62K. 🔴 69,116 (old support, now resistance) 🔴 79,654 (falling trendline from the highs) 🟢 61,917 (rising trendline, the line that has to hold) 🟢 58,001 (summer lows) Context: BTC dropped from 86.8K straight through 69K and wicked into 62K. The weekly is still printing lower highs under the falling trendline. My read: 62K is the line that matters this week. If it holds, a relief bounce into 69K is on the table. That's where I'd expect sellers to step back in. The risk: lose 62K on a daily close and 58K is next. Below that, the channel floor points at 49K. Bounce to 69K or 58K first? 👇 #Bitcoin #BTC
53
·
--
Ver tradução
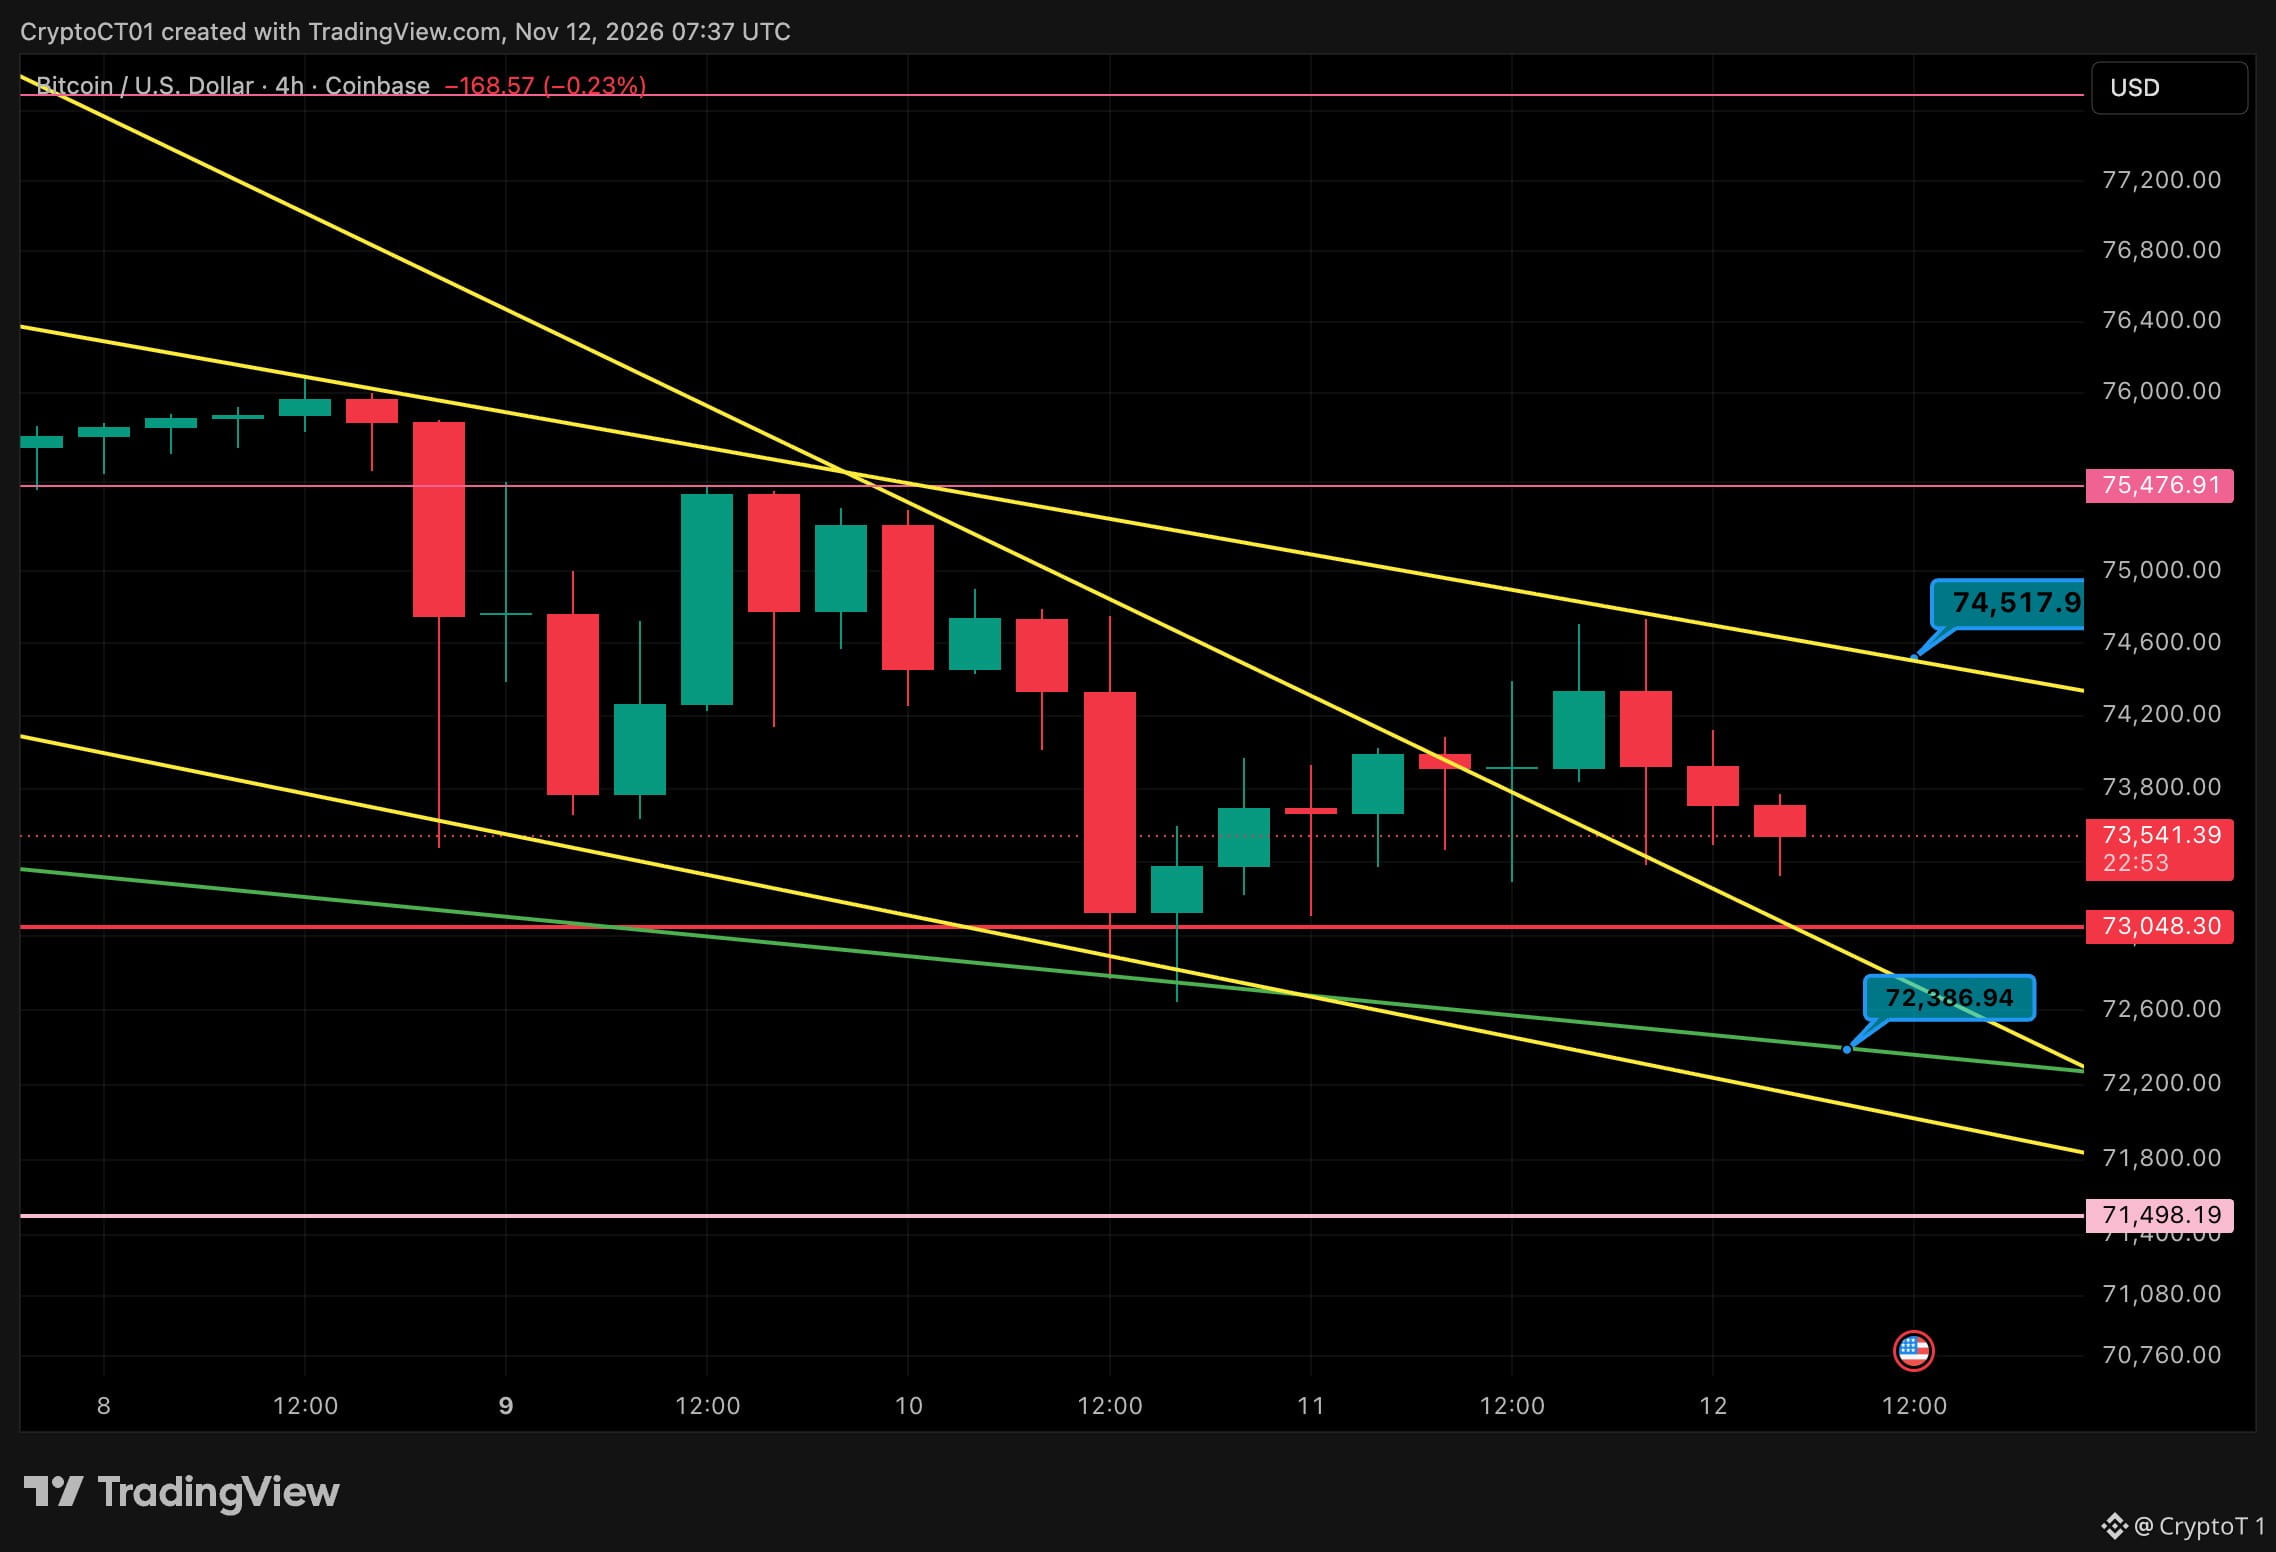
$BTC Stuck Between The Lines 📐 4h chart. Price is at 73.5K, squeezed between the top of the wedge and the steep trendline it broke above yesterday. 🔴 Resistance: 74,517 (wedge top), then 75,477 🟢 Support: 73,048, then 72,387, then 71,498 Context: Five straight days of ETF outflows, MSCI dropping $MSTR , and $BTC has barely moved. It's still holding just above the 200-day average around 73.2K. My read: No chase from here. 74.5K has rejected it twice, so I want a 4h close above it before I lean bullish. That opens 75.5K. Lose 73K and the green trendline at 72.4K is the next real test. Below that I'm watching 71.5K. The risk: This is a squeeze. When it breaks, it moves fast. Let price pick a side first. Break above 74.5K or a flush to 72.4K first? 👇 #BTC #Bitcoin
$BTC Stuck Between The Lines 📐 4h chart. Price is at 73.5K, squeezed between the top of the wedge and the steep trendline it broke above yesterday. 🔴 Resistance: 74,517 (wedge top), then 75,477 🟢 Support: 73,048, then 72,387, then 71,498 Context: Five straight days of ETF outflows, MSCI dropping $MSTR , and $BTC has barely moved. It's still holding just above the 200-day average around 73.2K. My read: No chase from here. 74.5K has rejected it twice, so I want a 4h close above it before I lean bullish. That opens 75.5K. Lose 73K and the green trendline at 72.4K is the next real test. Below that I'm watching 71.5K. The risk: This is a squeeze. When it breaks, it moves fast. Let price pick a side first. Break above 74.5K or a flush to 72.4K first? 👇 #BTC #Bitcoin
63
·
--
Ver tradução
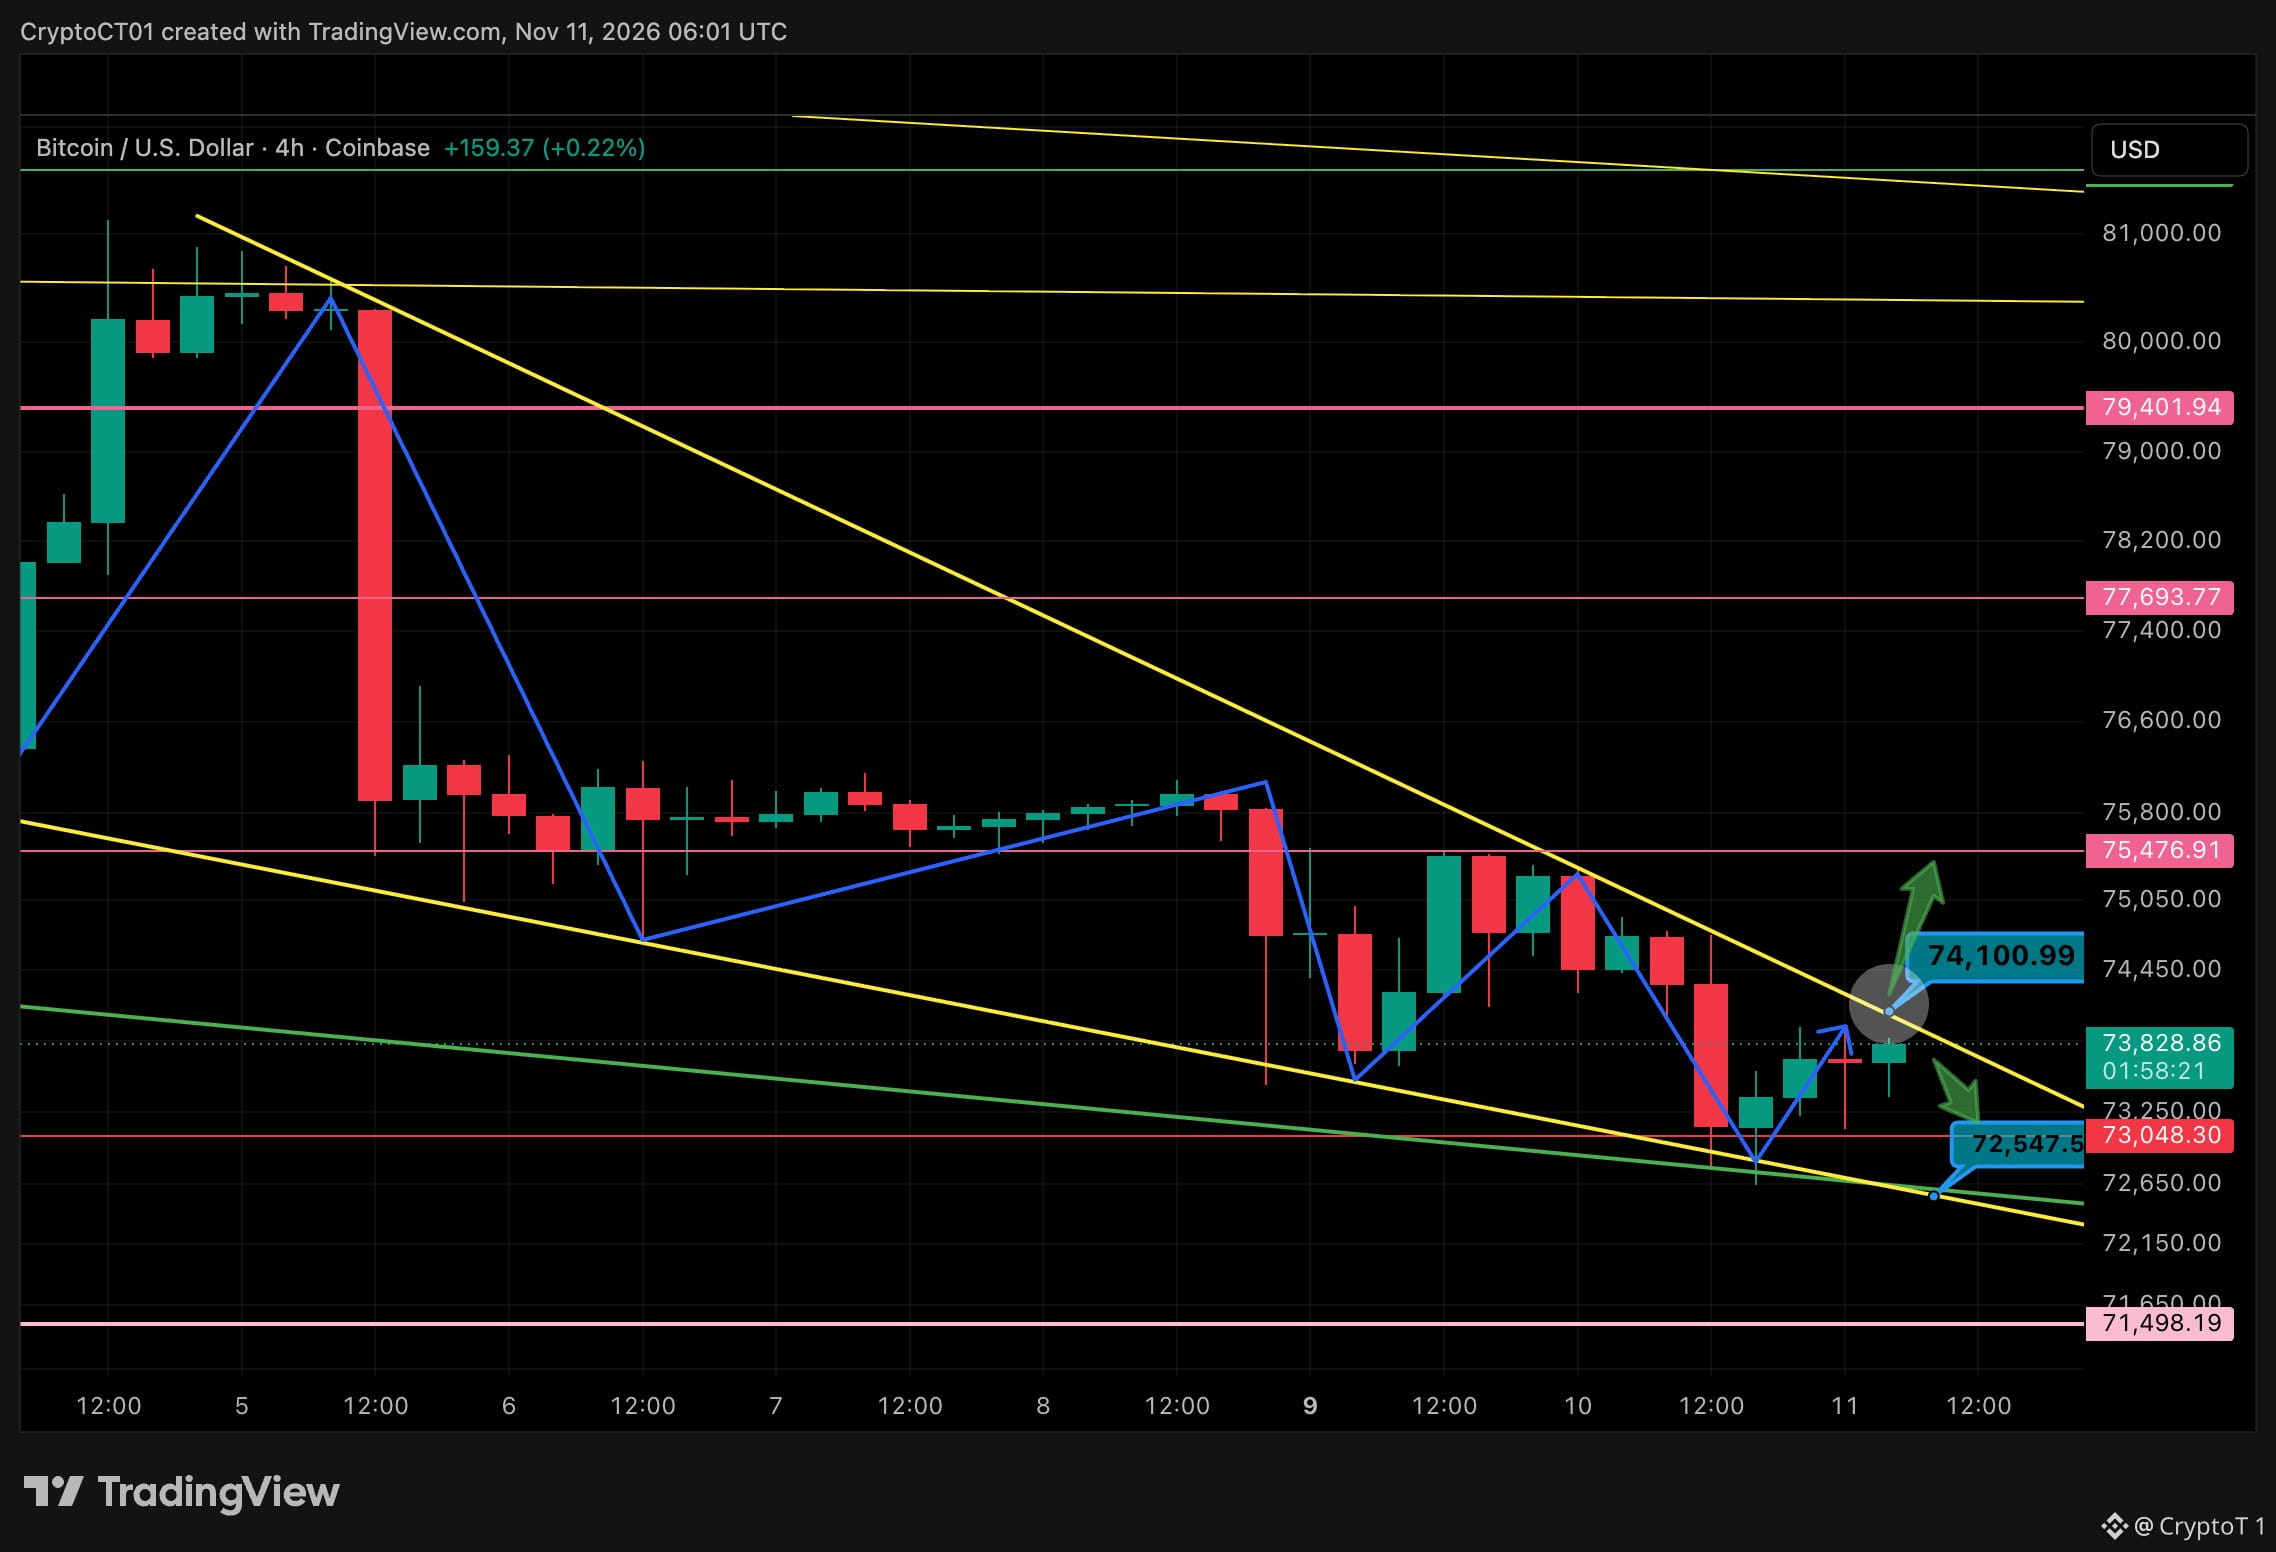
$BTC Pressing The Top Of The Wedge 📐 4h chart. Price has been squeezing inside a falling wedge since the 80K rejection, and it's now sitting right under the upper trendline around 74.1K. 🟢 Break and hold above 74.1K opens 75.5K, then 77.7K 🔴 Support at 73K, then the wedge floor near 72.5K 🔴 Lose that and 71.5K is next My read: CPI wicked us to 72.7K and buyers stepped in at the wedge base. A clean 4h close above the trendline is the trigger I'm watching. No chasing before it. The risk: another rejection here sends it straight back to the bottom of the range. Breakout or one more flush first? 👇 NFA #Bitcoin #BTC #Crypto
$BTC Pressing The Top Of The Wedge 📐 4h chart. Price has been squeezing inside a falling wedge since the 80K rejection, and it's now sitting right under the upper trendline around 74.1K. 🟢 Break and hold above 74.1K opens 75.5K, then 77.7K 🔴 Support at 73K, then the wedge floor near 72.5K 🔴 Lose that and 71.5K is next My read: CPI wicked us to 72.7K and buyers stepped in at the wedge base. A clean 4h close above the trendline is the trigger I'm watching. No chasing before it. The risk: another rejection here sends it straight back to the bottom of the range. Breakout or one more flush first? 👇 NFA #Bitcoin #BTC #Crypto
57
·
--
Ver tradução
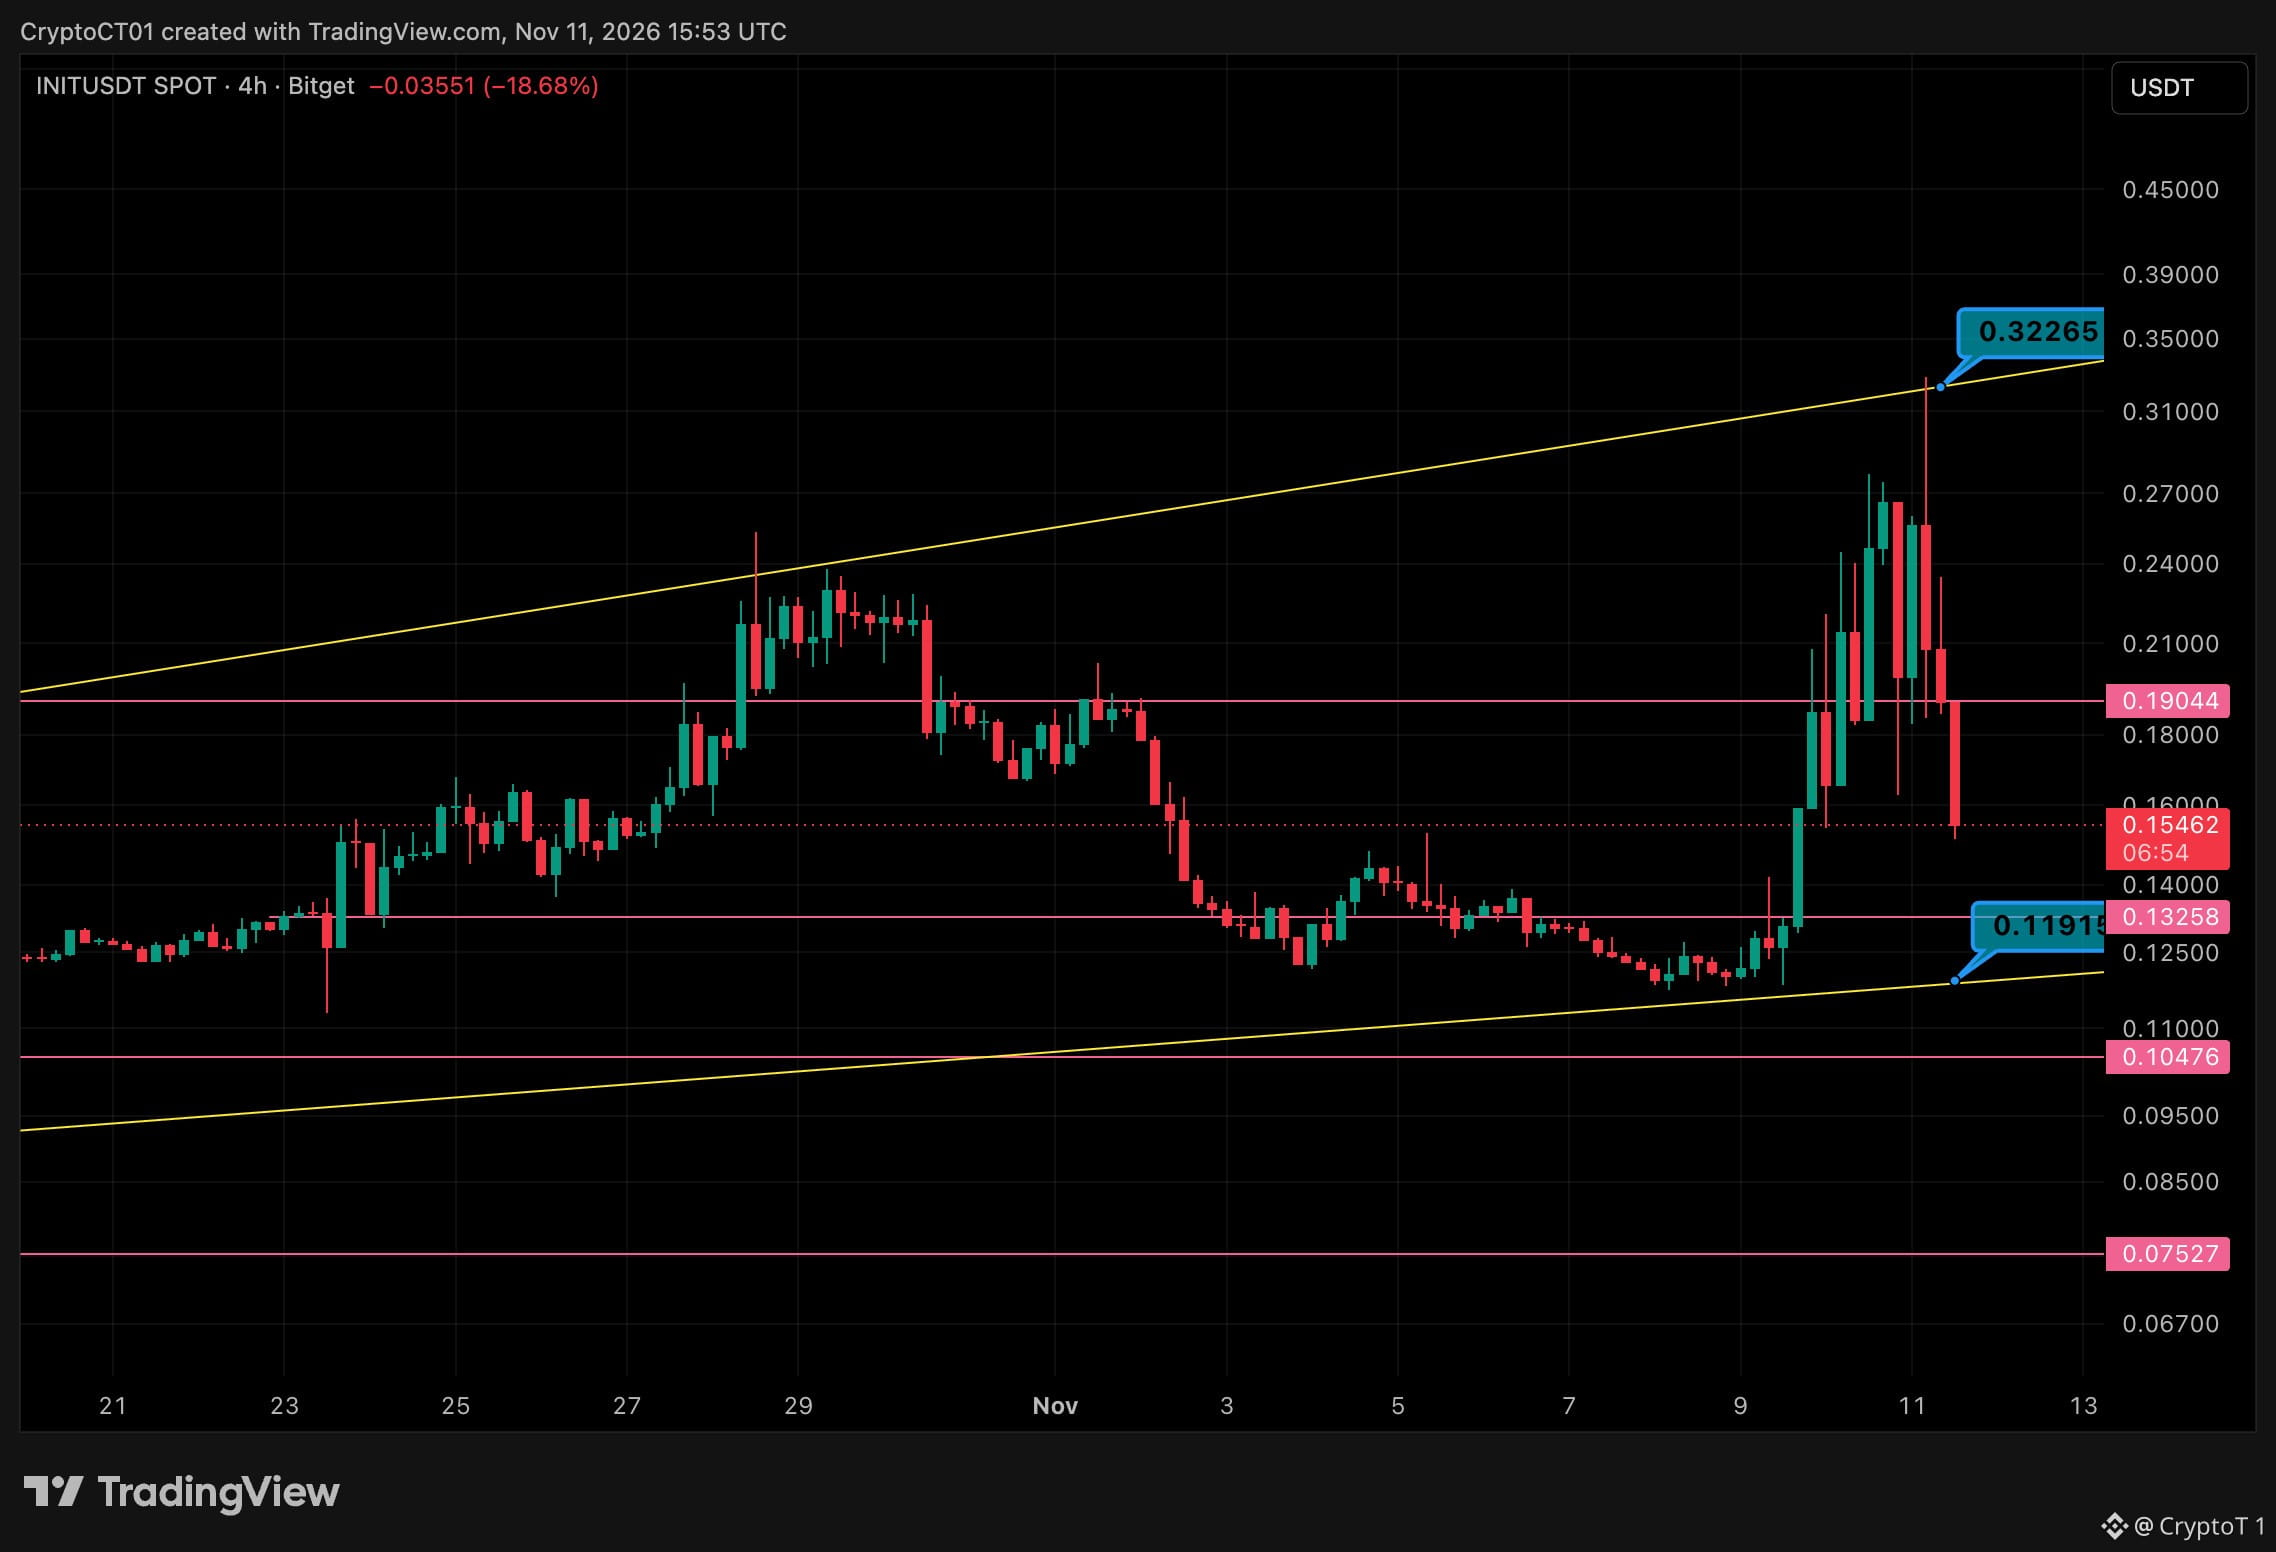
$INIT Rejected At The Top Of The Channel 📉 4h chart. The squeeze wicked straight into the channel top at 0.322 and got slapped back down. Now 0.154, down about 52% from the high. 🔴 Resistance: 0.190, then 0.24 🟢 Support: 0.1326, then 0.119 (channel bottom) Context: Initia halted its L1 on 10 Nov after unauthorized transfers from rollup escrow accounts, about $3.27M in total, and said no INIT was withdrawn. $INIT still squeezed hard into the news, and that whole move is now unwinding. My read: Losing 0.190 flipped it back to resistance. Price is falling back into the old range, and 0.1326 is the first real floor, the base it broke out from. If that cracks, the channel bottom around 0.119 is the bigger level. Below that I've got 0.105, then 0.075. The risk: News-driven unwinds wick both ways. A 4h reclaim of 0.190 flips this back bullish. Is 0.13 the bounce, or does it test the channel bottom first? 👇 #INIT
$INIT Rejected At The Top Of The Channel 📉 4h chart. The squeeze wicked straight into the channel top at 0.322 and got slapped back down. Now 0.154, down about 52% from the high. 🔴 Resistance: 0.190, then 0.24 🟢 Support: 0.1326, then 0.119 (channel bottom) Context: Initia halted its L1 on 10 Nov after unauthorized transfers from rollup escrow accounts, about $3.27M in total, and said no INIT was withdrawn. $INIT still squeezed hard into the news, and that whole move is now unwinding. My read: Losing 0.190 flipped it back to resistance. Price is falling back into the old range, and 0.1326 is the first real floor, the base it broke out from. If that cracks, the channel bottom around 0.119 is the bigger level. Below that I've got 0.105, then 0.075. The risk: News-driven unwinds wick both ways. A 4h reclaim of 0.190 flips this back bullish. Is 0.13 the bounce, or does it test the channel bottom first? 👇 #INIT
70
·
--
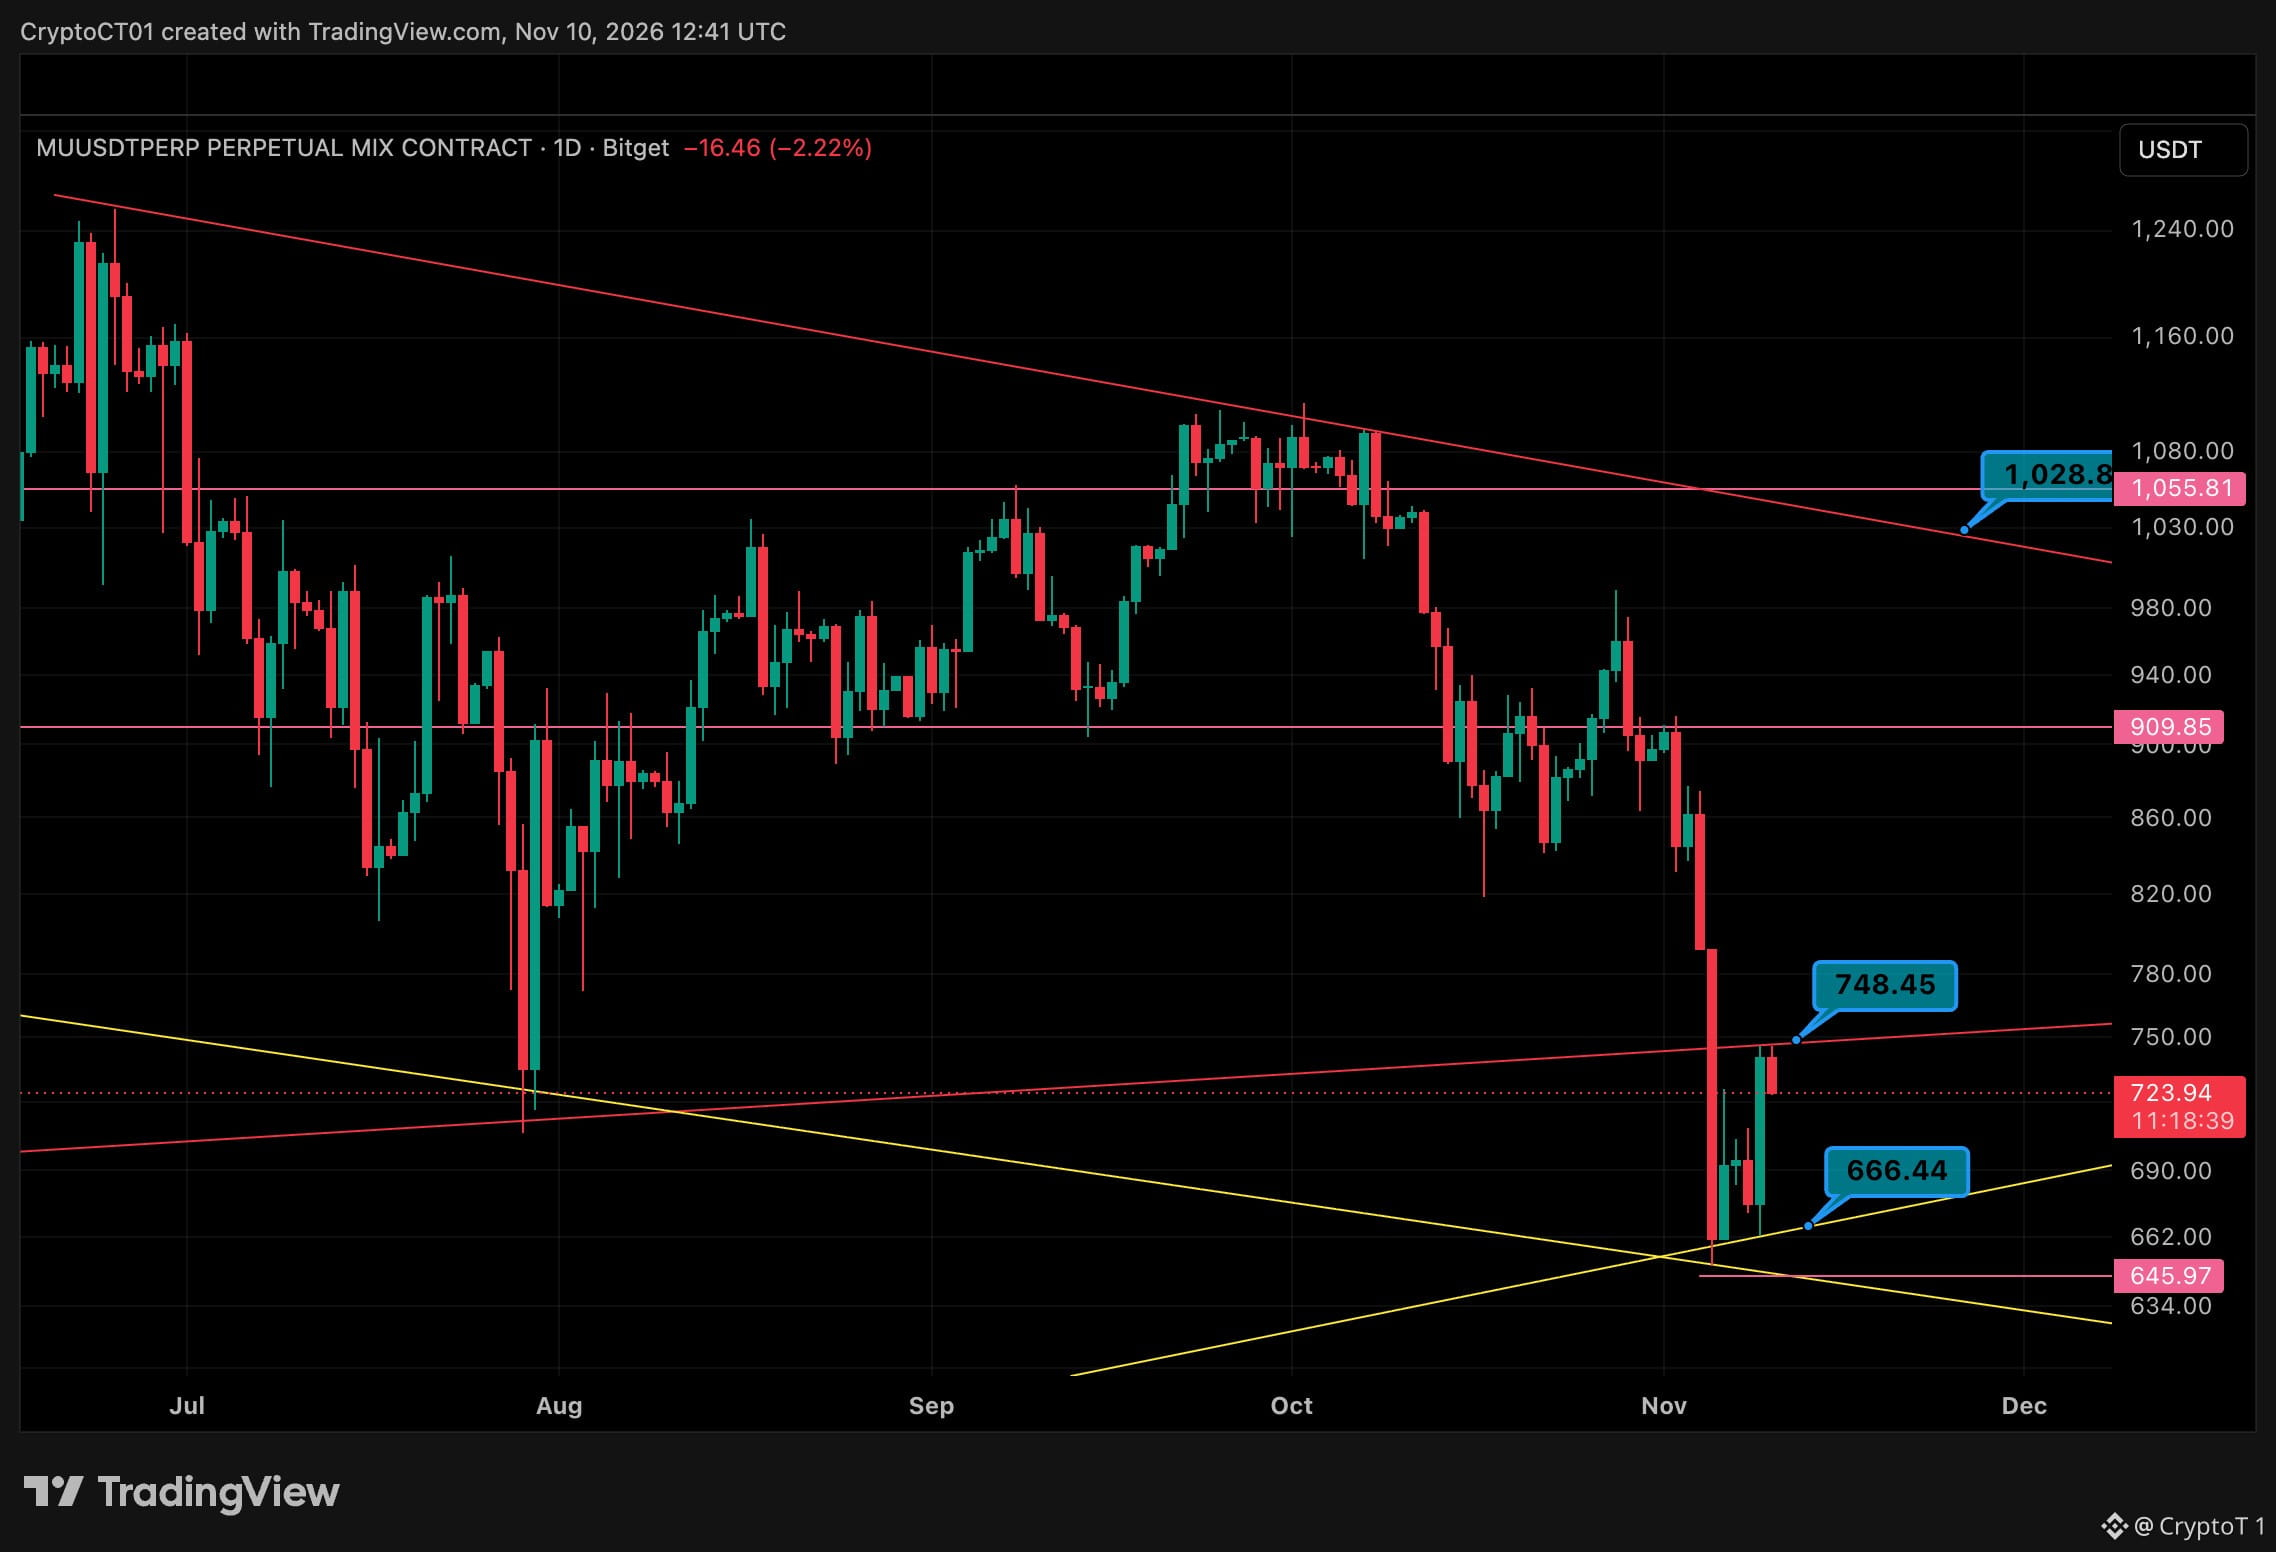
$MU Testando o reteste da quebra 👀 A Micron reagiu com força a partir das mínimas de 646. Agora está avançando direto para a linha de tendência rompida que perdeu no início de novembro. 🔴 1,056 🔴 1,029 (linha de tendência descendente) 🔴 910 🔴 748 (reteste da linha de tendência rompida) 🟢 724 (agora) 🟢 666 (suporte ascendente) 🟢 646 (mínima de novembro) Minha leitura: um fechamento diário acima de 748 transforma isso numa recuperação do nível, e 910 é o próximo nível importante. O risco: uma rejeição em 748 torna este um reteste clássico, e 666 e depois 646 voltam a entrar em jogo. Não é recomendação financeira. #Micron #Ações
$MU Testando o reteste da quebra 👀 A Micron reagiu com força a partir das mínimas de 646. Agora está avançando direto para a linha de tendência rompida que perdeu no início de novembro. 🔴 1,056 🔴 1,029 (linha de tendência descendente) 🔴 910 🔴 748 (reteste da linha de tendência rompida) 🟢 724 (agora) 🟢 666 (suporte ascendente) 🟢 646 (mínima de novembro) Minha leitura: um fechamento diário acima de 748 transforma isso numa recuperação do nível, e 910 é o próximo nível importante. O risco: uma rejeição em 748 torna este um reteste clássico, e 666 e depois 646 voltam a entrar em jogo. Não é recomendação financeira. #Micron #Ações
57
·
--
Ver tradução
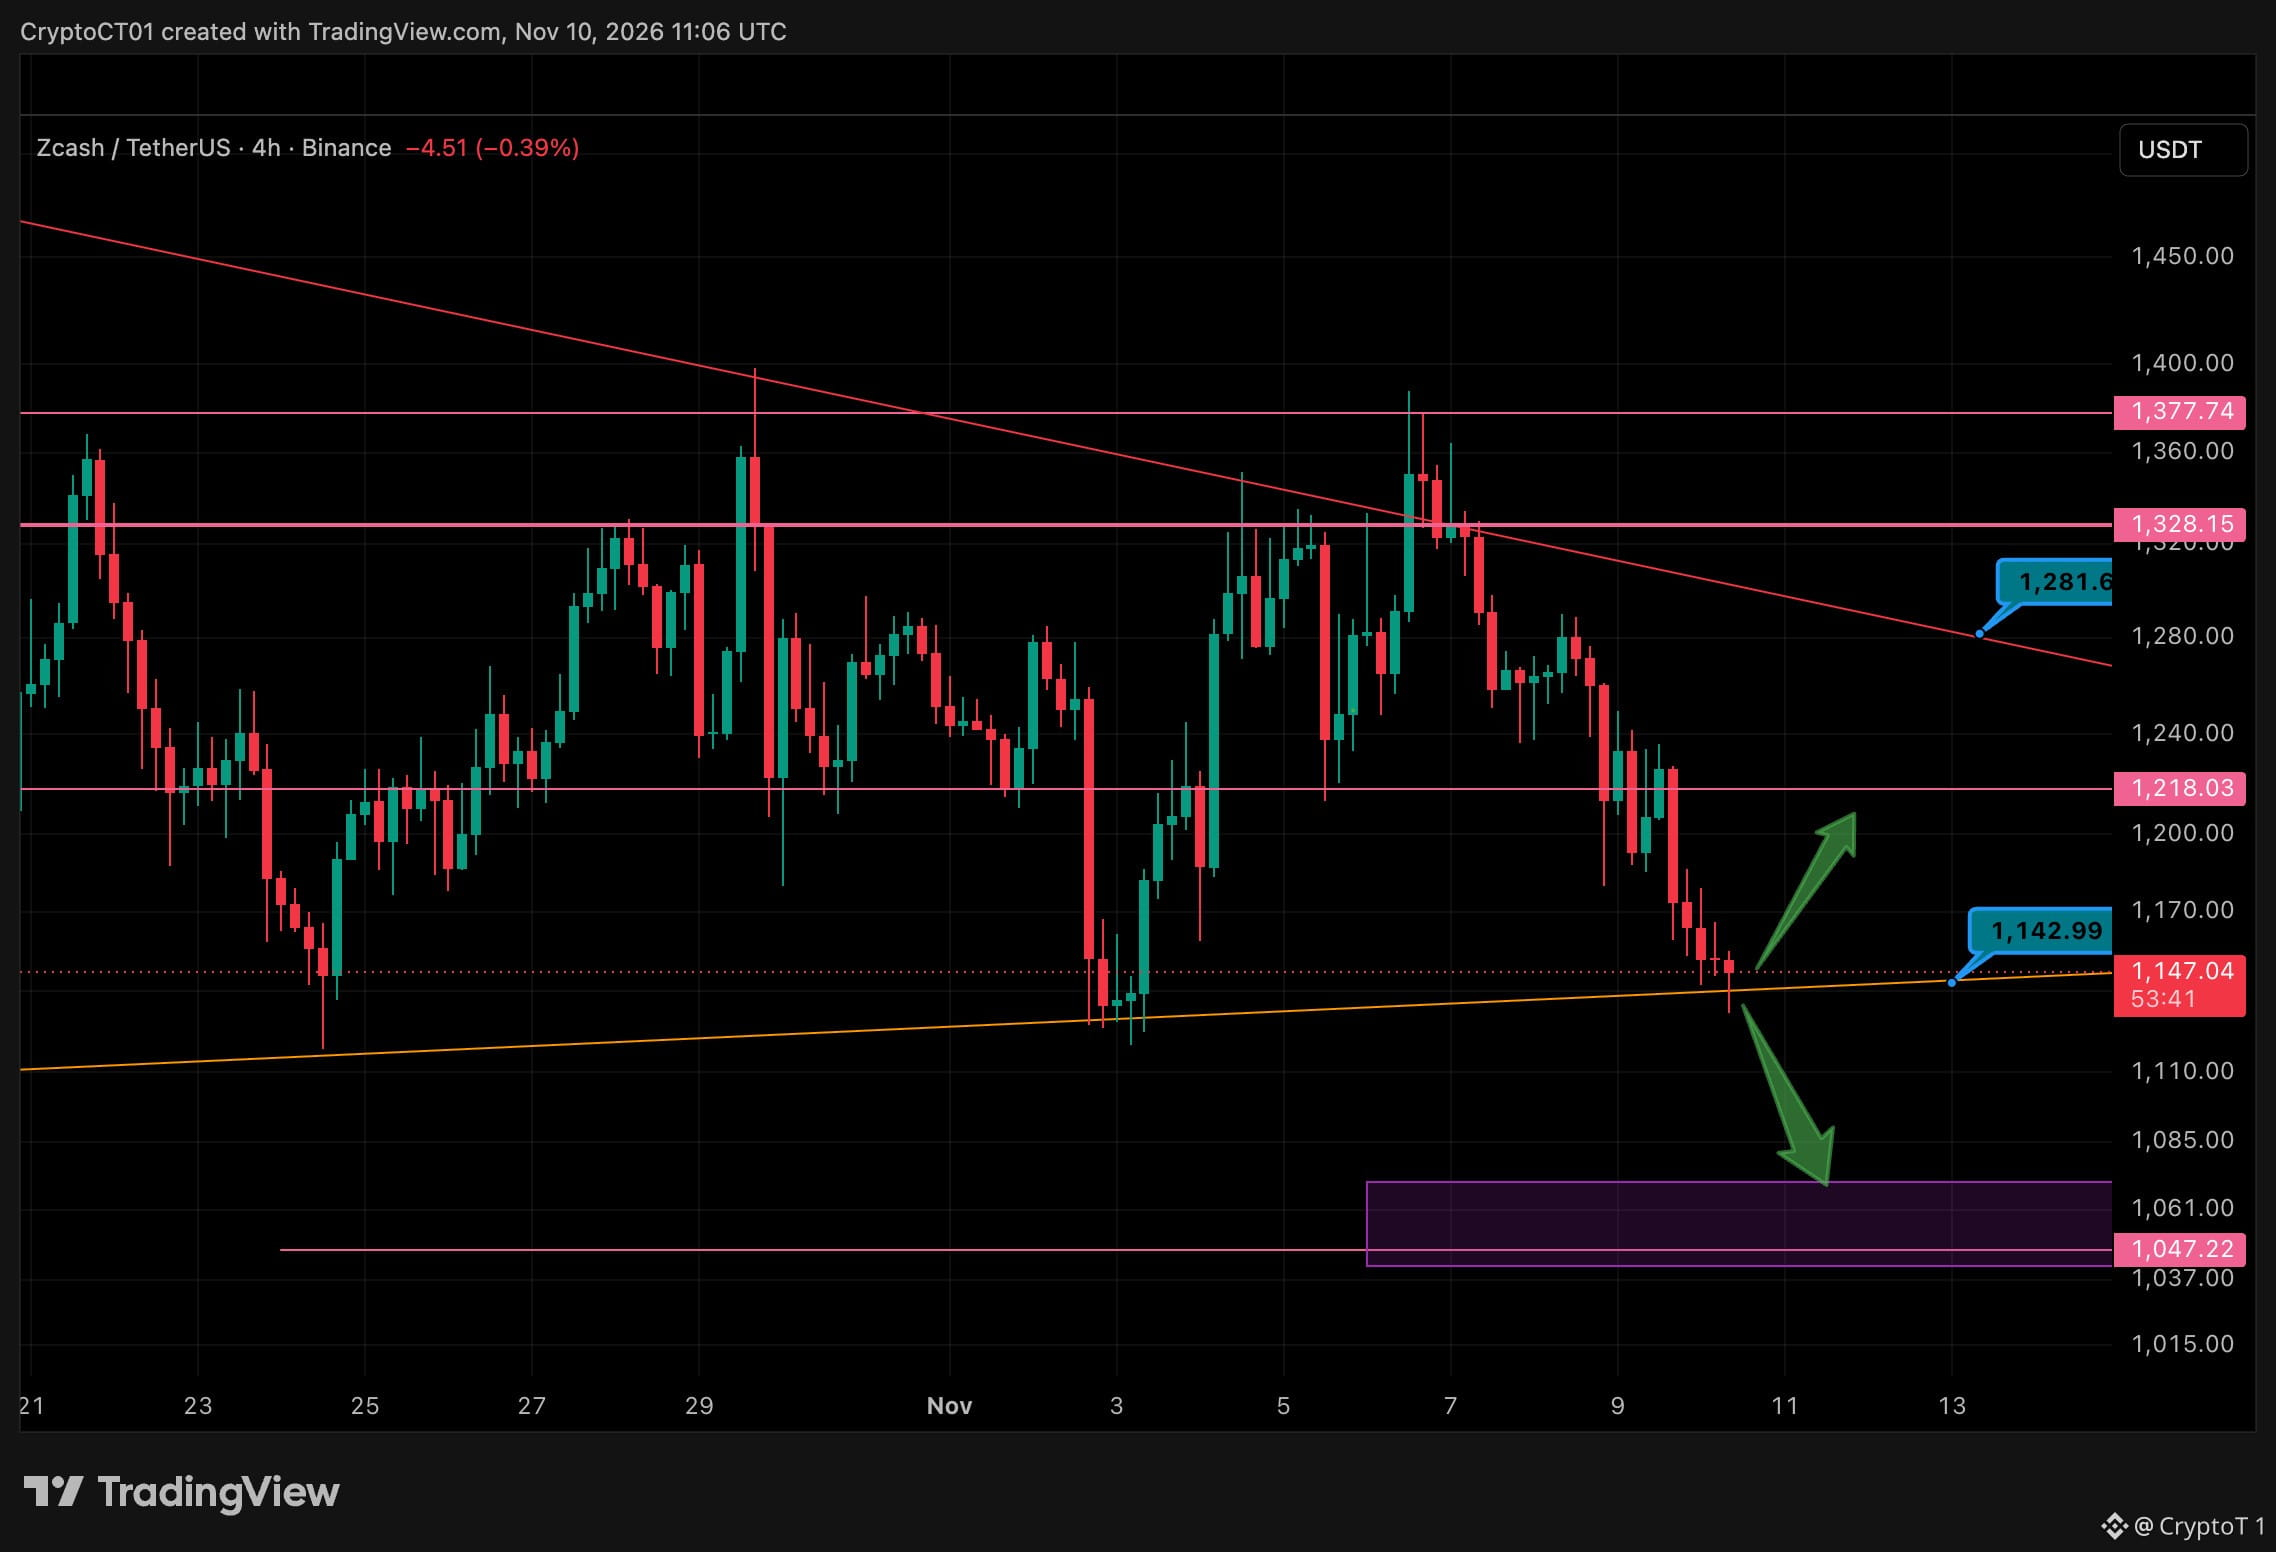
$ZEC Sitting On Trendline Support 👀 Zcash has bled from the 1,377 highs and is now testing the rising trendline that's held since late October. 🔴 1,377 🔴 1,328 🔴 1,281 (descending trendline) 🔴 1,218 🟢 1,147 (now) 🟢 1,143 (rising trendline) 🟢 1,061 - 1,047 demand zone My read: hold the trendline and a bounce into 1,218 is on the cards. That's the first level to reclaim. The risk: a 4h close under 1,143 opens the door to the 1,061 - 1,047 zone. Bounce or breakdown? 👇 NFA #ZEC #Crypto
$ZEC Sitting On Trendline Support 👀 Zcash has bled from the 1,377 highs and is now testing the rising trendline that's held since late October. 🔴 1,377 🔴 1,328 🔴 1,281 (descending trendline) 🔴 1,218 🟢 1,147 (now) 🟢 1,143 (rising trendline) 🟢 1,061 - 1,047 demand zone My read: hold the trendline and a bounce into 1,218 is on the cards. That's the first level to reclaim. The risk: a 4h close under 1,143 opens the door to the 1,061 - 1,047 zone. Bounce or breakdown? 👇 NFA #ZEC #Crypto
76
·
--
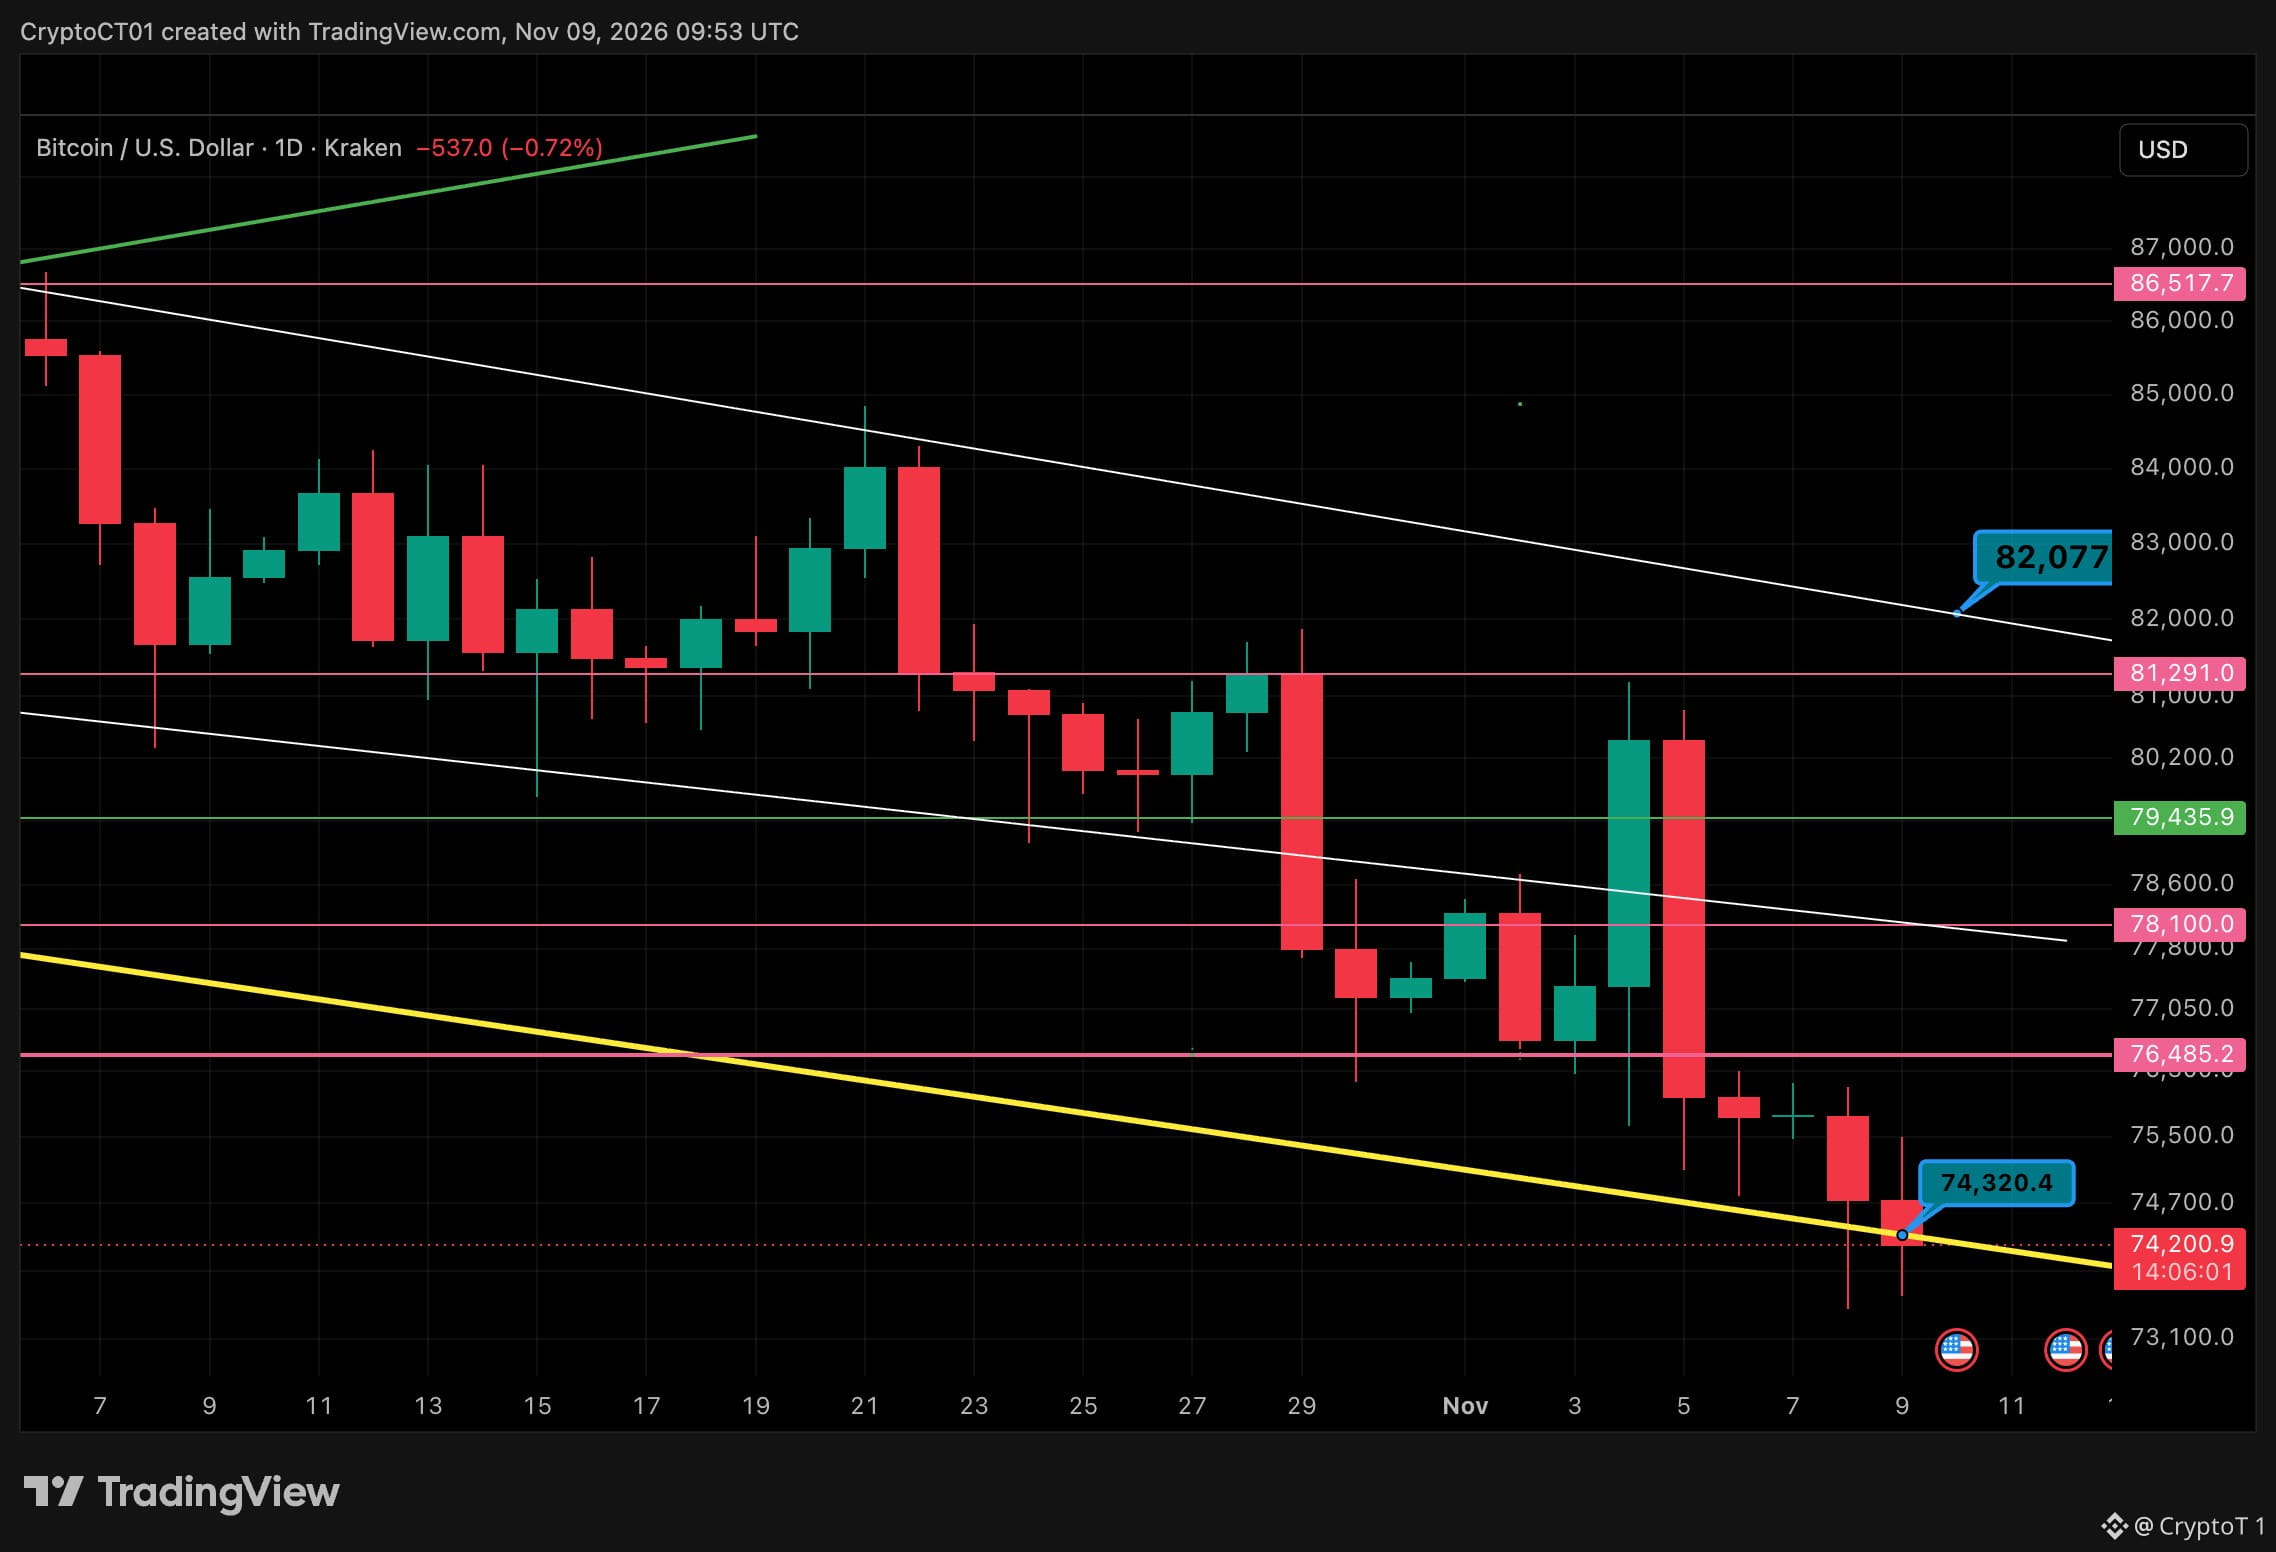
$BTC testando a linha de tendência antes do CPI 📉 Gráfico diário. O preço está se apoiando no suporte descendente amarelo, em torno de $74.3K, depois que a liquidação de posições compradas de $1B no domingo deixou uma sombra até $73.4K. 🔴 $86.5K 🔴 topo do canal em $82K 🔴 $81.3K 🔴 $79.4K 🔴 $78.1K 🔴 $76.5K primeira recuperação 🟢 $74.3K linha de tendência 🟢 $73.4K mínima do fim de semana Contexto: máximas mais baixas desde outubro, ainda dentro do canal de tendência de baixa. O CPI será divulgado amanhã às 13:30, horário do Reino Unido. Minha leitura: manter a linha de tendência antes do CPI mantém possível uma recuperação a partir do fundo da faixa. Um fechamento diário acima de $76.5K seria o primeiro sinal de que os compradores retomaram o controle. O risco: um fechamento diário abaixo de $73.4K perderia tanto a linha de tendência quanto a mínima do fim de semana, abrindo caminho para novas quedas. Recuperação ou rompimento após o CPI? 👇 NFA #Bitcoin #BTC
$BTC testando a linha de tendência antes do CPI 📉 Gráfico diário. O preço está se apoiando no suporte descendente amarelo, em torno de $74.3K, depois que a liquidação de posições compradas de $1B no domingo deixou uma sombra até $73.4K. 🔴 $86.5K 🔴 topo do canal em $82K 🔴 $81.3K 🔴 $79.4K 🔴 $78.1K 🔴 $76.5K primeira recuperação 🟢 $74.3K linha de tendência 🟢 $73.4K mínima do fim de semana Contexto: máximas mais baixas desde outubro, ainda dentro do canal de tendência de baixa. O CPI será divulgado amanhã às 13:30, horário do Reino Unido. Minha leitura: manter a linha de tendência antes do CPI mantém possível uma recuperação a partir do fundo da faixa. Um fechamento diário acima de $76.5K seria o primeiro sinal de que os compradores retomaram o controle. O risco: um fechamento diário abaixo de $73.4K perderia tanto a linha de tendência quanto a mínima do fim de semana, abrindo caminho para novas quedas. Recuperação ou rompimento após o CPI? 👇 NFA #Bitcoin #BTC
88
·
--
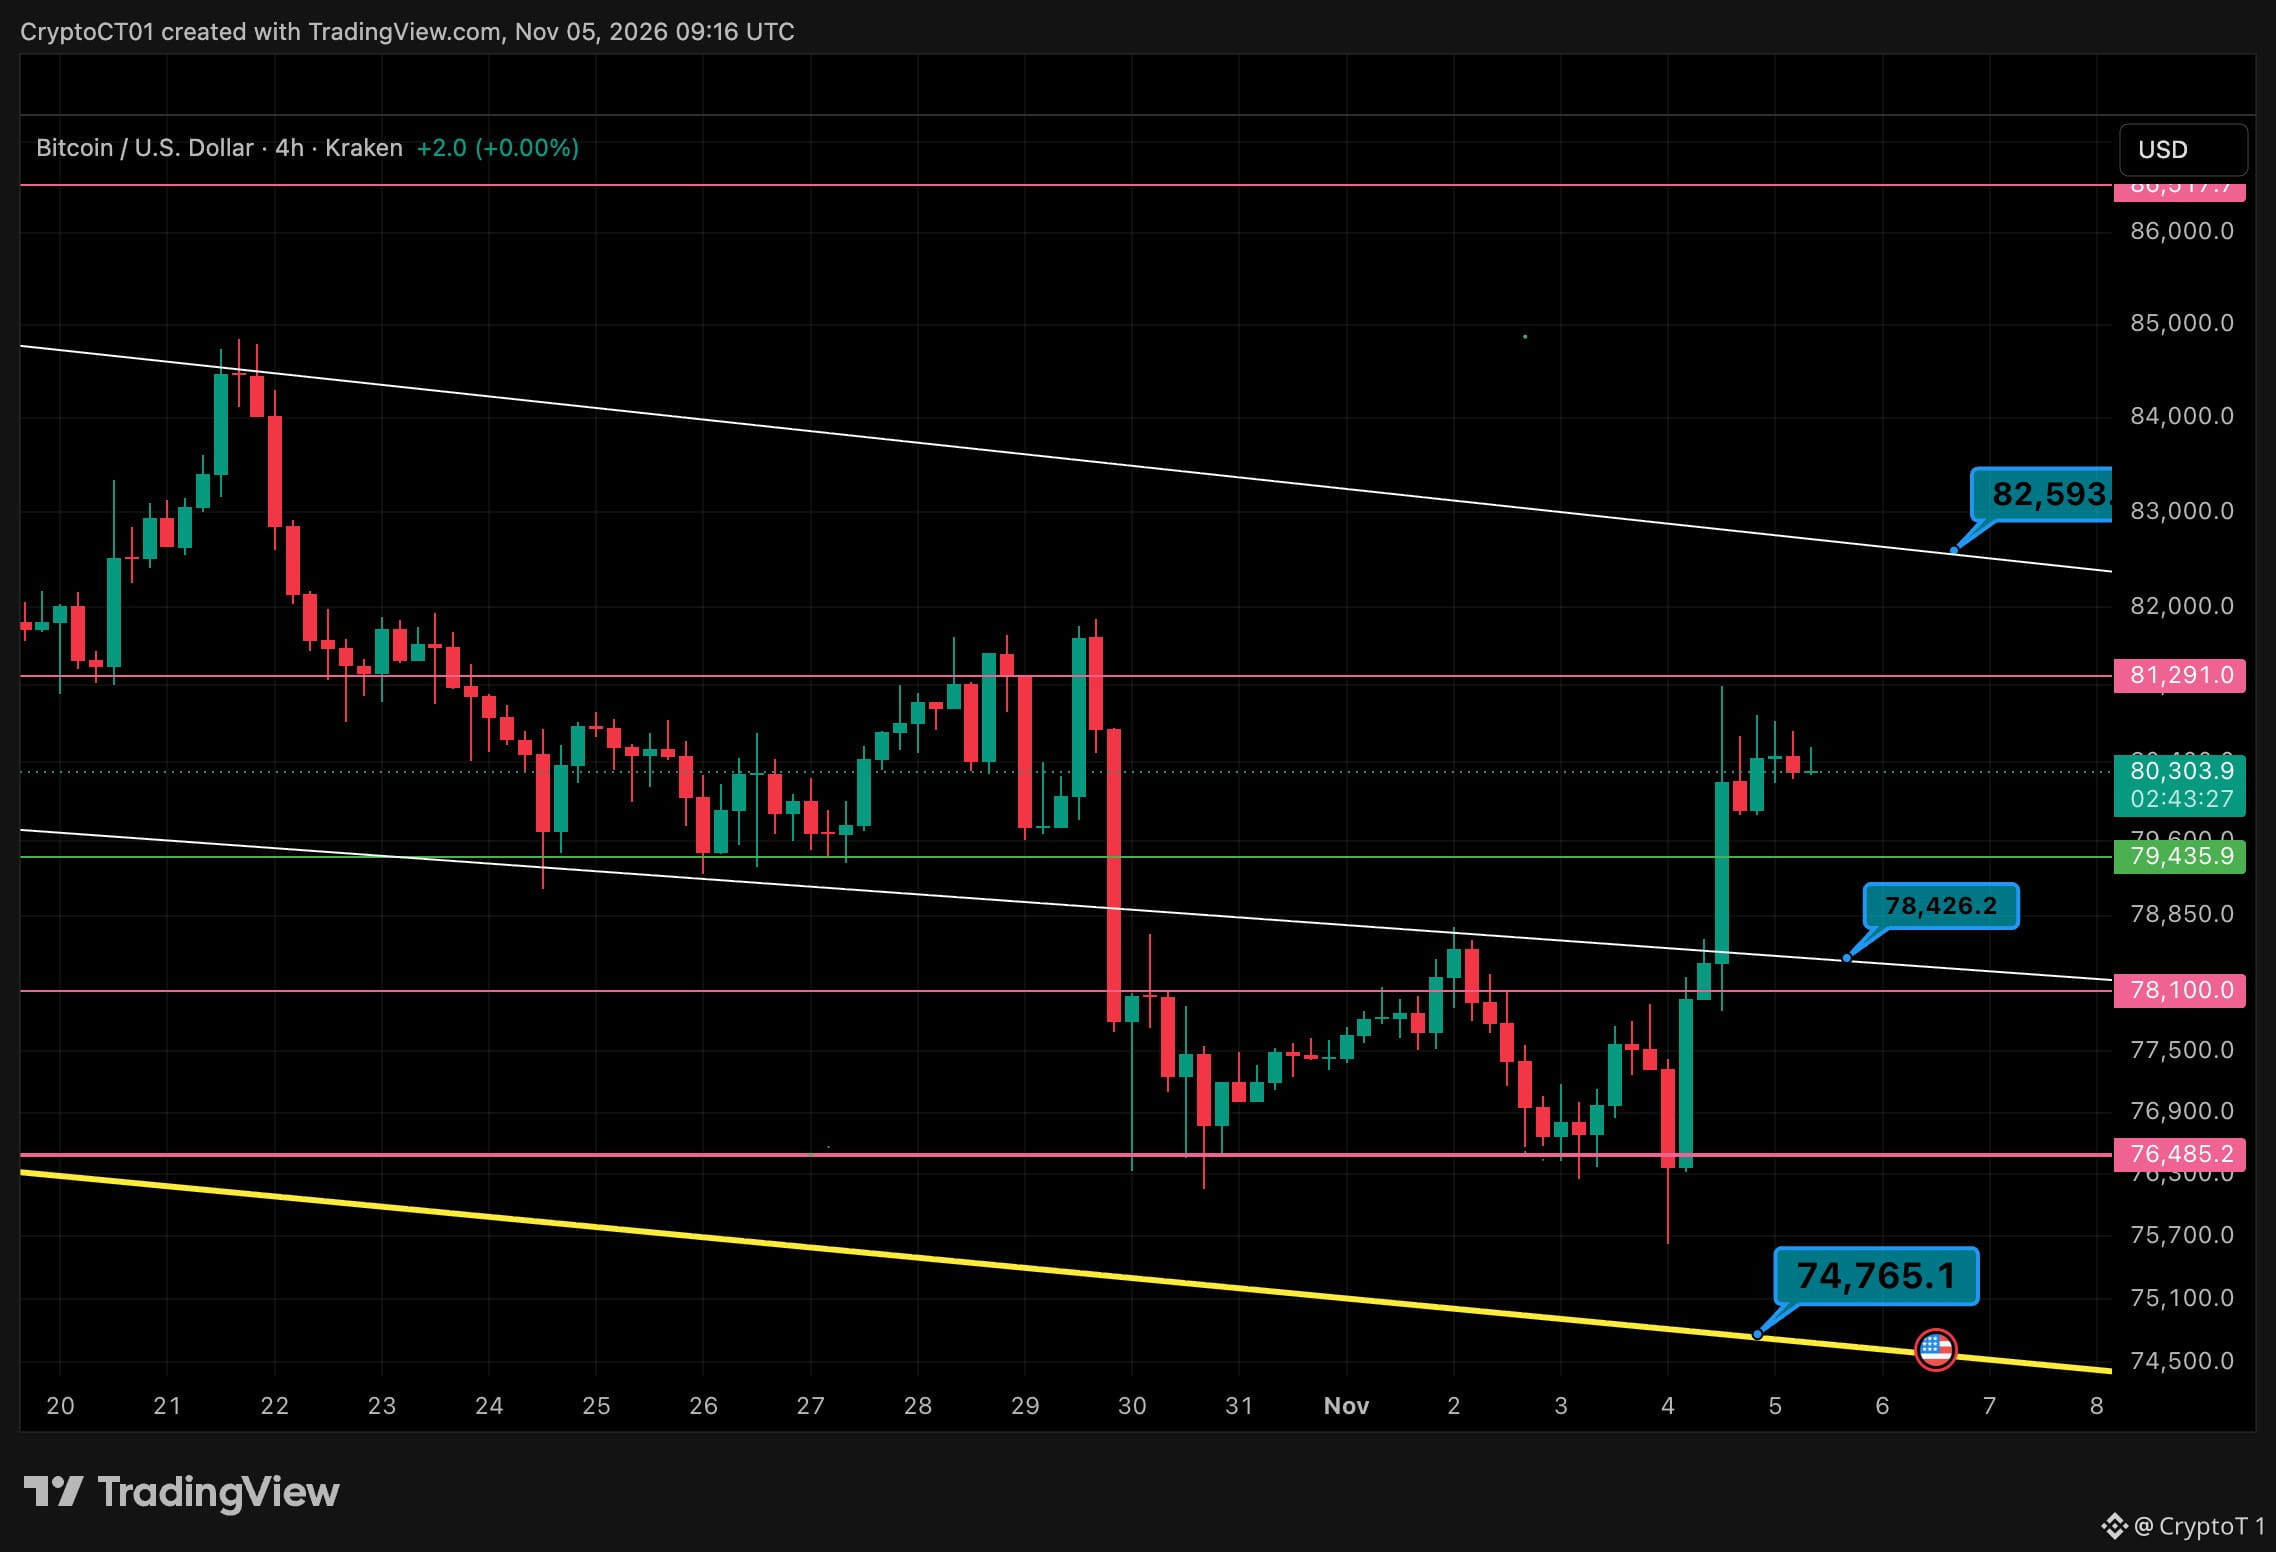
BTC recuperou os 80K, agora 81,3K é a porta 🚪 $BTC chegou a cair até cerca de 75,7K no gráfico de 4h, depois voltou direto pelo canal. Agora está perto de 80,3K. 🔹 Resistência em 81.291. Já foi rejeitado nesse nível 🔹 Acima disso, o topo do canal fica perto de 82.593 🔹 Suporte em 79.436, depois a antiga linha do canal perto de 78.426 🔹 Abaixo disso, 78.100 e, depois, 76.485 🟢 Um fechamento de 4h acima de 81.291 abre caminho para 82,6K e, depois, 86,5K 🔴 Se perder 79,4K, provavelmente voltará a 78,4K para testar novamente o rompimento 🎯 Não persiga os candles verdes. Deixe o preço voltar aos níveis O relatório de emprego de amanhã pode decidir para que lado será o rompimento. Rompimento ou falso rompimento? 👇 Isto não é aconselhamento financeiro. #Bitcoin #BTC #Cripto #AnáliseTécnica
BTC recuperou os 80K, agora 81,3K é a porta 🚪 $BTC chegou a cair até cerca de 75,7K no gráfico de 4h, depois voltou direto pelo canal. Agora está perto de 80,3K. 🔹 Resistência em 81.291. Já foi rejeitado nesse nível 🔹 Acima disso, o topo do canal fica perto de 82.593 🔹 Suporte em 79.436, depois a antiga linha do canal perto de 78.426 🔹 Abaixo disso, 78.100 e, depois, 76.485 🟢 Um fechamento de 4h acima de 81.291 abre caminho para 82,6K e, depois, 86,5K 🔴 Se perder 79,4K, provavelmente voltará a 78,4K para testar novamente o rompimento 🎯 Não persiga os candles verdes. Deixe o preço voltar aos níveis O relatório de emprego de amanhã pode decidir para que lado será o rompimento. Rompimento ou falso rompimento? 👇 Isto não é aconselhamento financeiro. #Bitcoin #BTC #Cripto #AnáliseTécnica
52
·
--
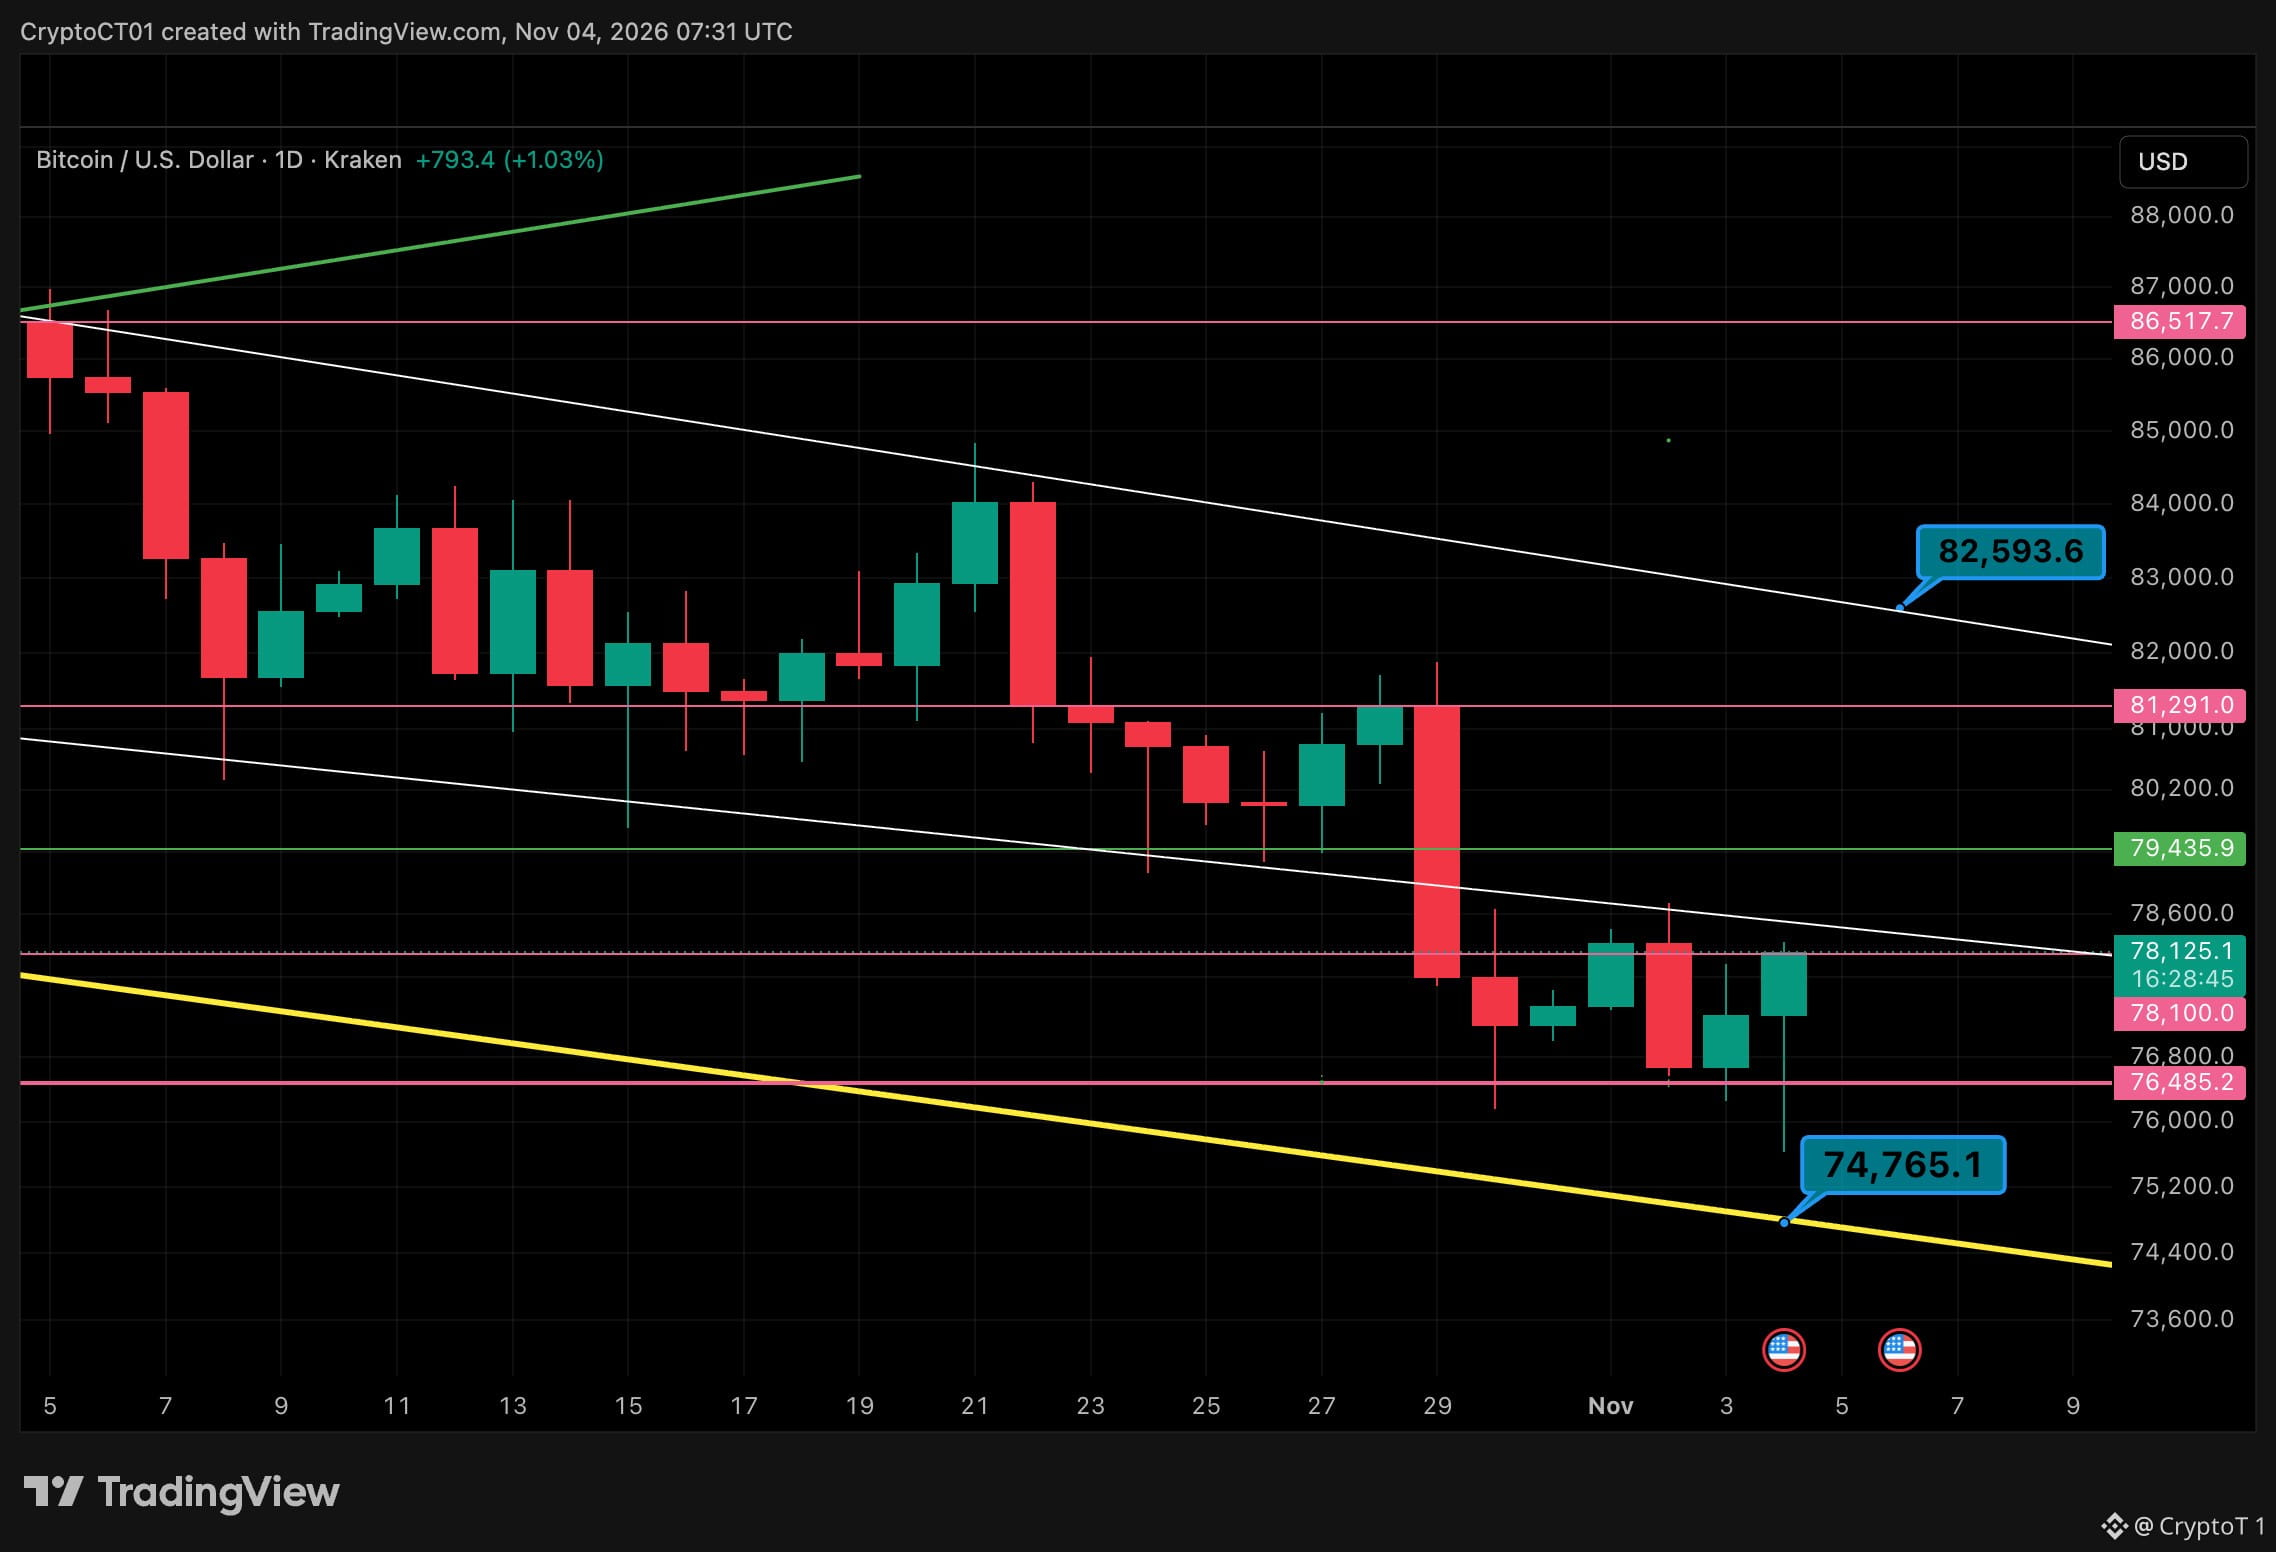
$BTC Diário: Testando o teto 🟢 Ontem, o preço deixou uma longa sombra para baixo, até cerca de 75,7 mil, e fechou novamente acima de 76,5 mil. Hoje, estamos pressionando diretamente os 78,1 mil. 🔹 Suporte: 76.485, depois a linha de tendência inferior, perto de 74,8 mil 🟢 O teste: 78.100, nível em que o preço vem falhando desde a queda de 29 de outubro 🟢 Acima disso: 79.436, depois 81.291 🎯 Visão geral: o topo do canal, perto de 82,6 mil Ainda estamos dentro do canal de tendência de baixa iniciado no começo de outubro, então quero ver um fechamento diário acima de 78,1 mil antes de dizer que houve uma reversão. Tenha paciência e deixe o preço chegar aos níveis. Rompimento hoje ou rejeição de volta aos 76,5 mil? 👇 Isto não é aconselhamento financeiro. #Bitcoin #BTC #Crypto
$BTC Diário: Testando o teto 🟢 Ontem, o preço deixou uma longa sombra para baixo, até cerca de 75,7 mil, e fechou novamente acima de 76,5 mil. Hoje, estamos pressionando diretamente os 78,1 mil. 🔹 Suporte: 76.485, depois a linha de tendência inferior, perto de 74,8 mil 🟢 O teste: 78.100, nível em que o preço vem falhando desde a queda de 29 de outubro 🟢 Acima disso: 79.436, depois 81.291 🎯 Visão geral: o topo do canal, perto de 82,6 mil Ainda estamos dentro do canal de tendência de baixa iniciado no começo de outubro, então quero ver um fechamento diário acima de 78,1 mil antes de dizer que houve uma reversão. Tenha paciência e deixe o preço chegar aos níveis. Rompimento hoje ou rejeição de volta aos 76,5 mil? 👇 Isto não é aconselhamento financeiro. #Bitcoin #BTC #Crypto
62
·
--
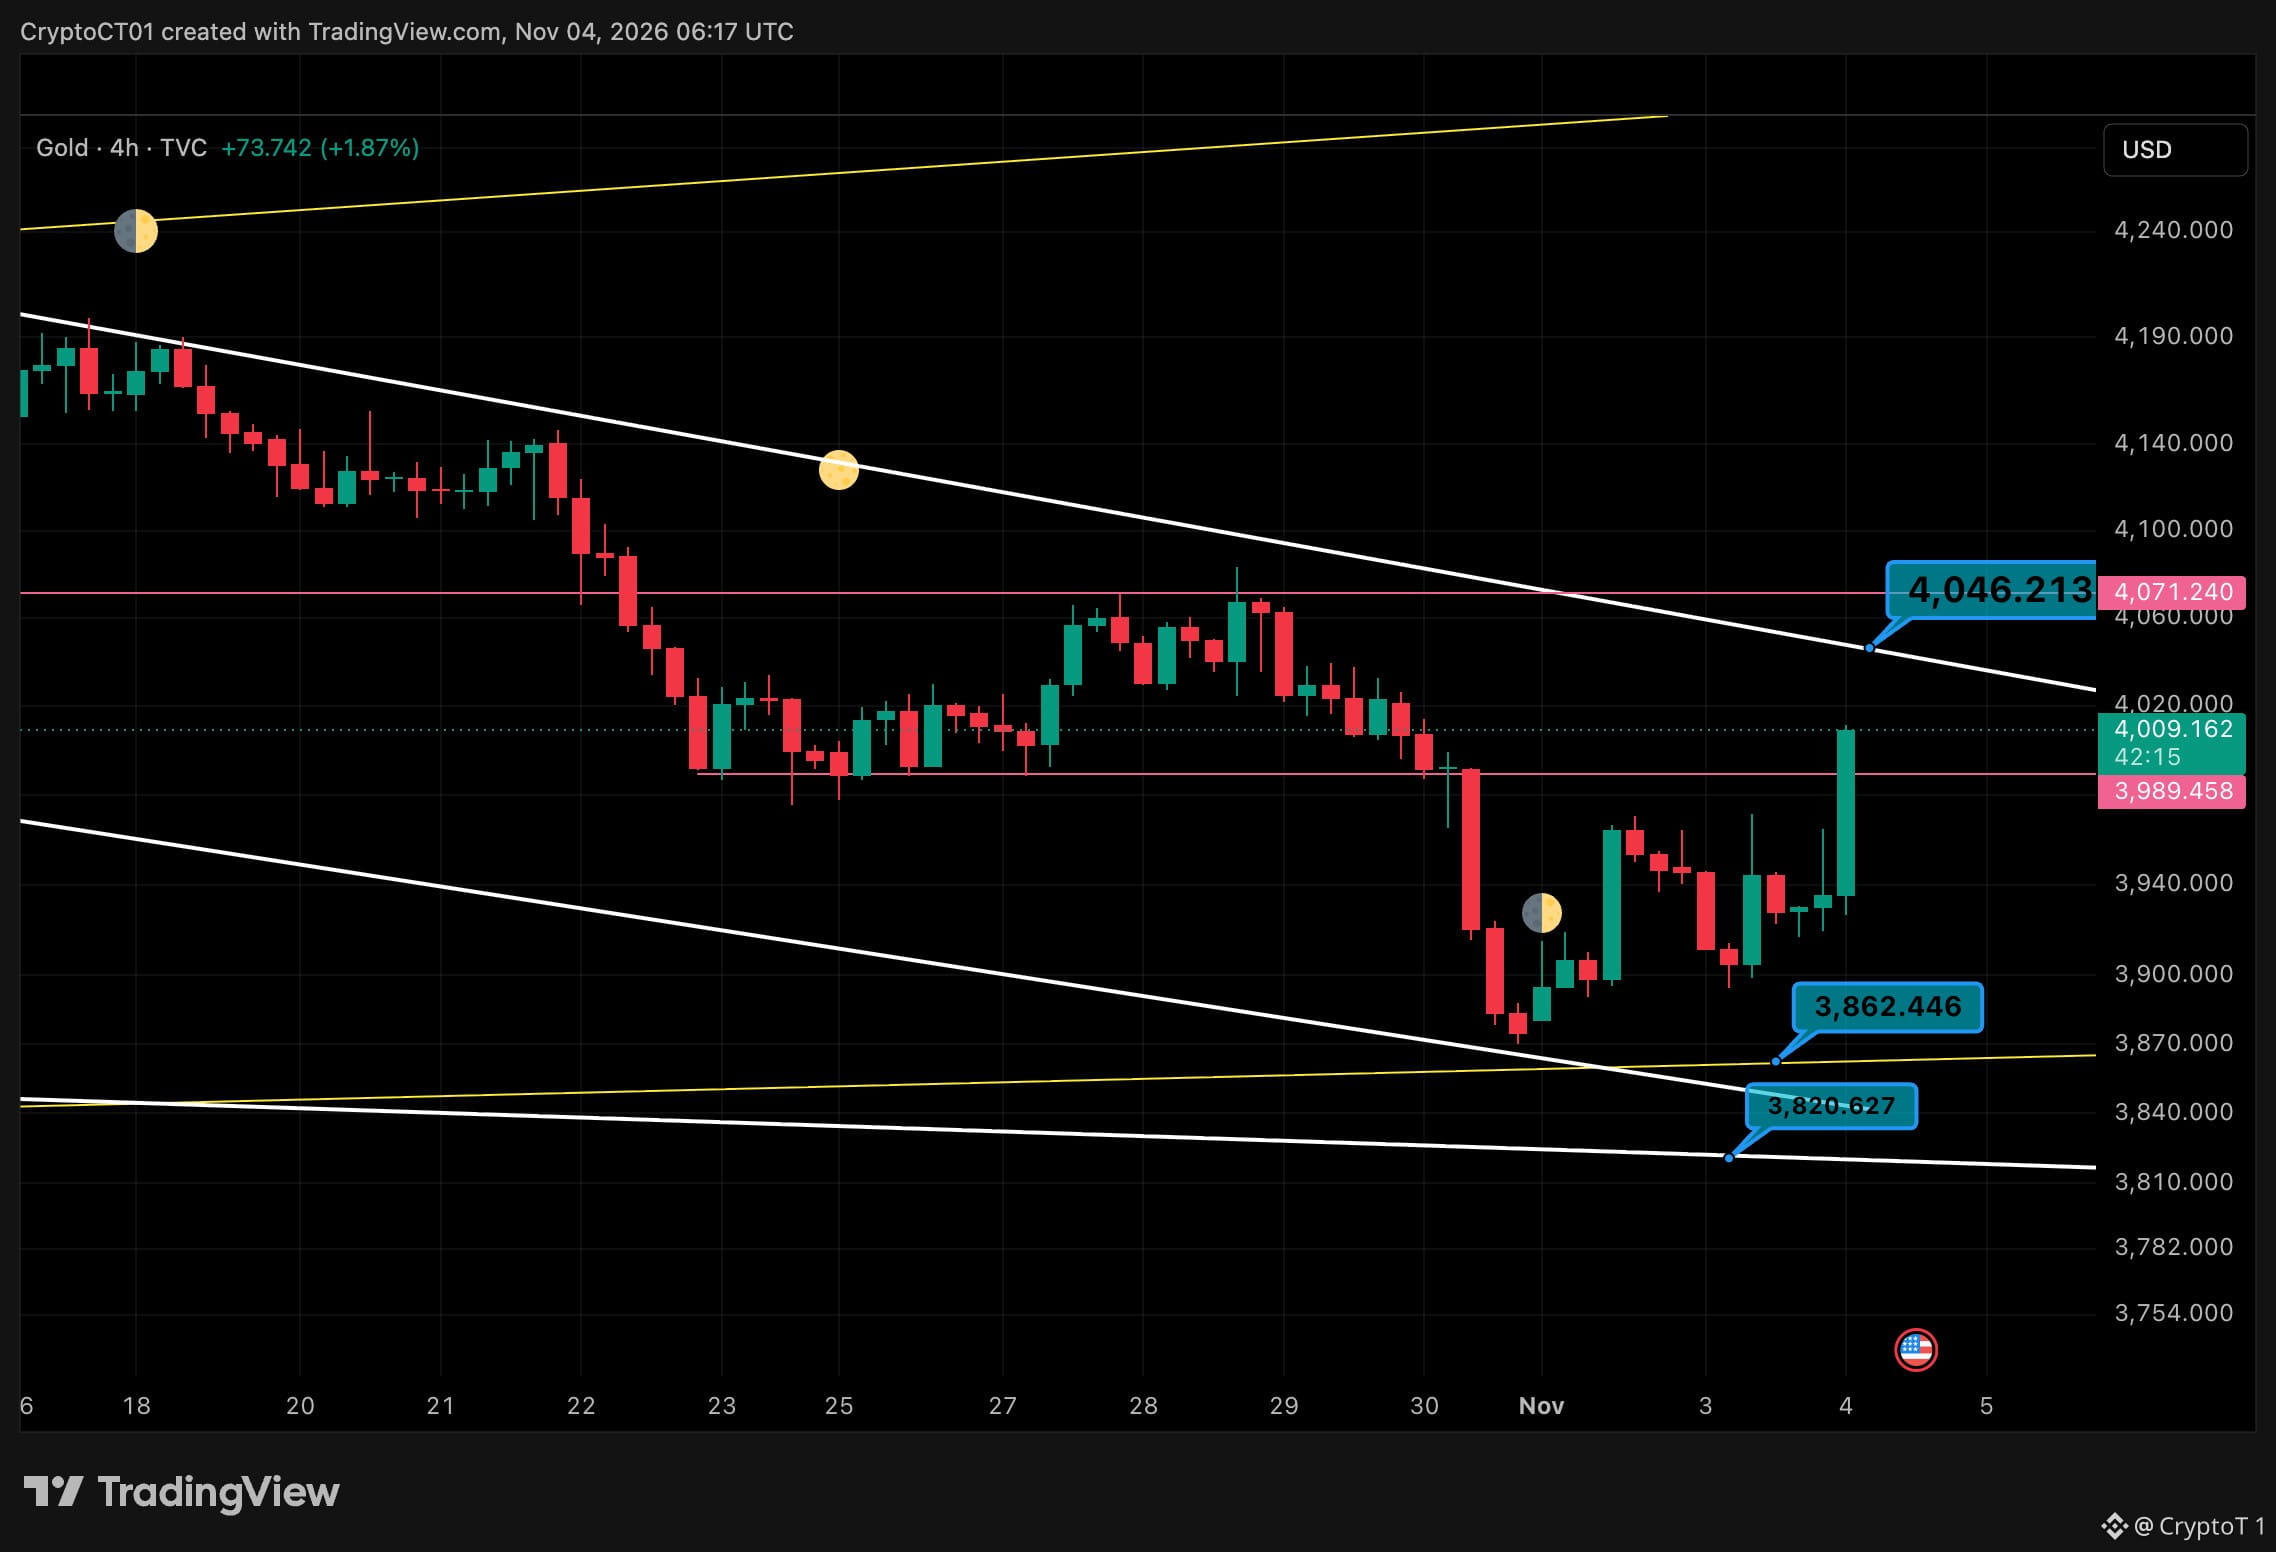
O ouro acabou de recuperar os US$ 4.000 🟡 Forte impulso de 4H no ouro, agora de volta à região dos 4.015 depois de superar o nível de 3.989 que eu estava acompanhando. 🔹 3.989 era resistência; agora precisa se manter como suporte 🟢 4.046 é o próximo nível, onde passa a linha de tendência de baixa desde meados de outubro 🟢 4.071 acima disso, o nível da quebra no fim de outubro 🔴 Se perder 3.989, as mínimas de 3.862 / 3.820 voltam ao radar Não vou correr atrás deste candle. Prefiro ver um reteste de 3.989 se manter, ou um fechamento limpo de 4H acima da linha de tendência. Rompimento ou armadilha de alta? 👇 Isto não é aconselhamento financeiro. #Ouro #XAUUSD #Trading $XAUt
O ouro acabou de recuperar os US$ 4.000 🟡 Forte impulso de 4H no ouro, agora de volta à região dos 4.015 depois de superar o nível de 3.989 que eu estava acompanhando. 🔹 3.989 era resistência; agora precisa se manter como suporte 🟢 4.046 é o próximo nível, onde passa a linha de tendência de baixa desde meados de outubro 🟢 4.071 acima disso, o nível da quebra no fim de outubro 🔴 Se perder 3.989, as mínimas de 3.862 / 3.820 voltam ao radar Não vou correr atrás deste candle. Prefiro ver um reteste de 3.989 se manter, ou um fechamento limpo de 4H acima da linha de tendência. Rompimento ou armadilha de alta? 👇 Isto não é aconselhamento financeiro. #Ouro #XAUUSD #Trading $XAUt
76
·
--
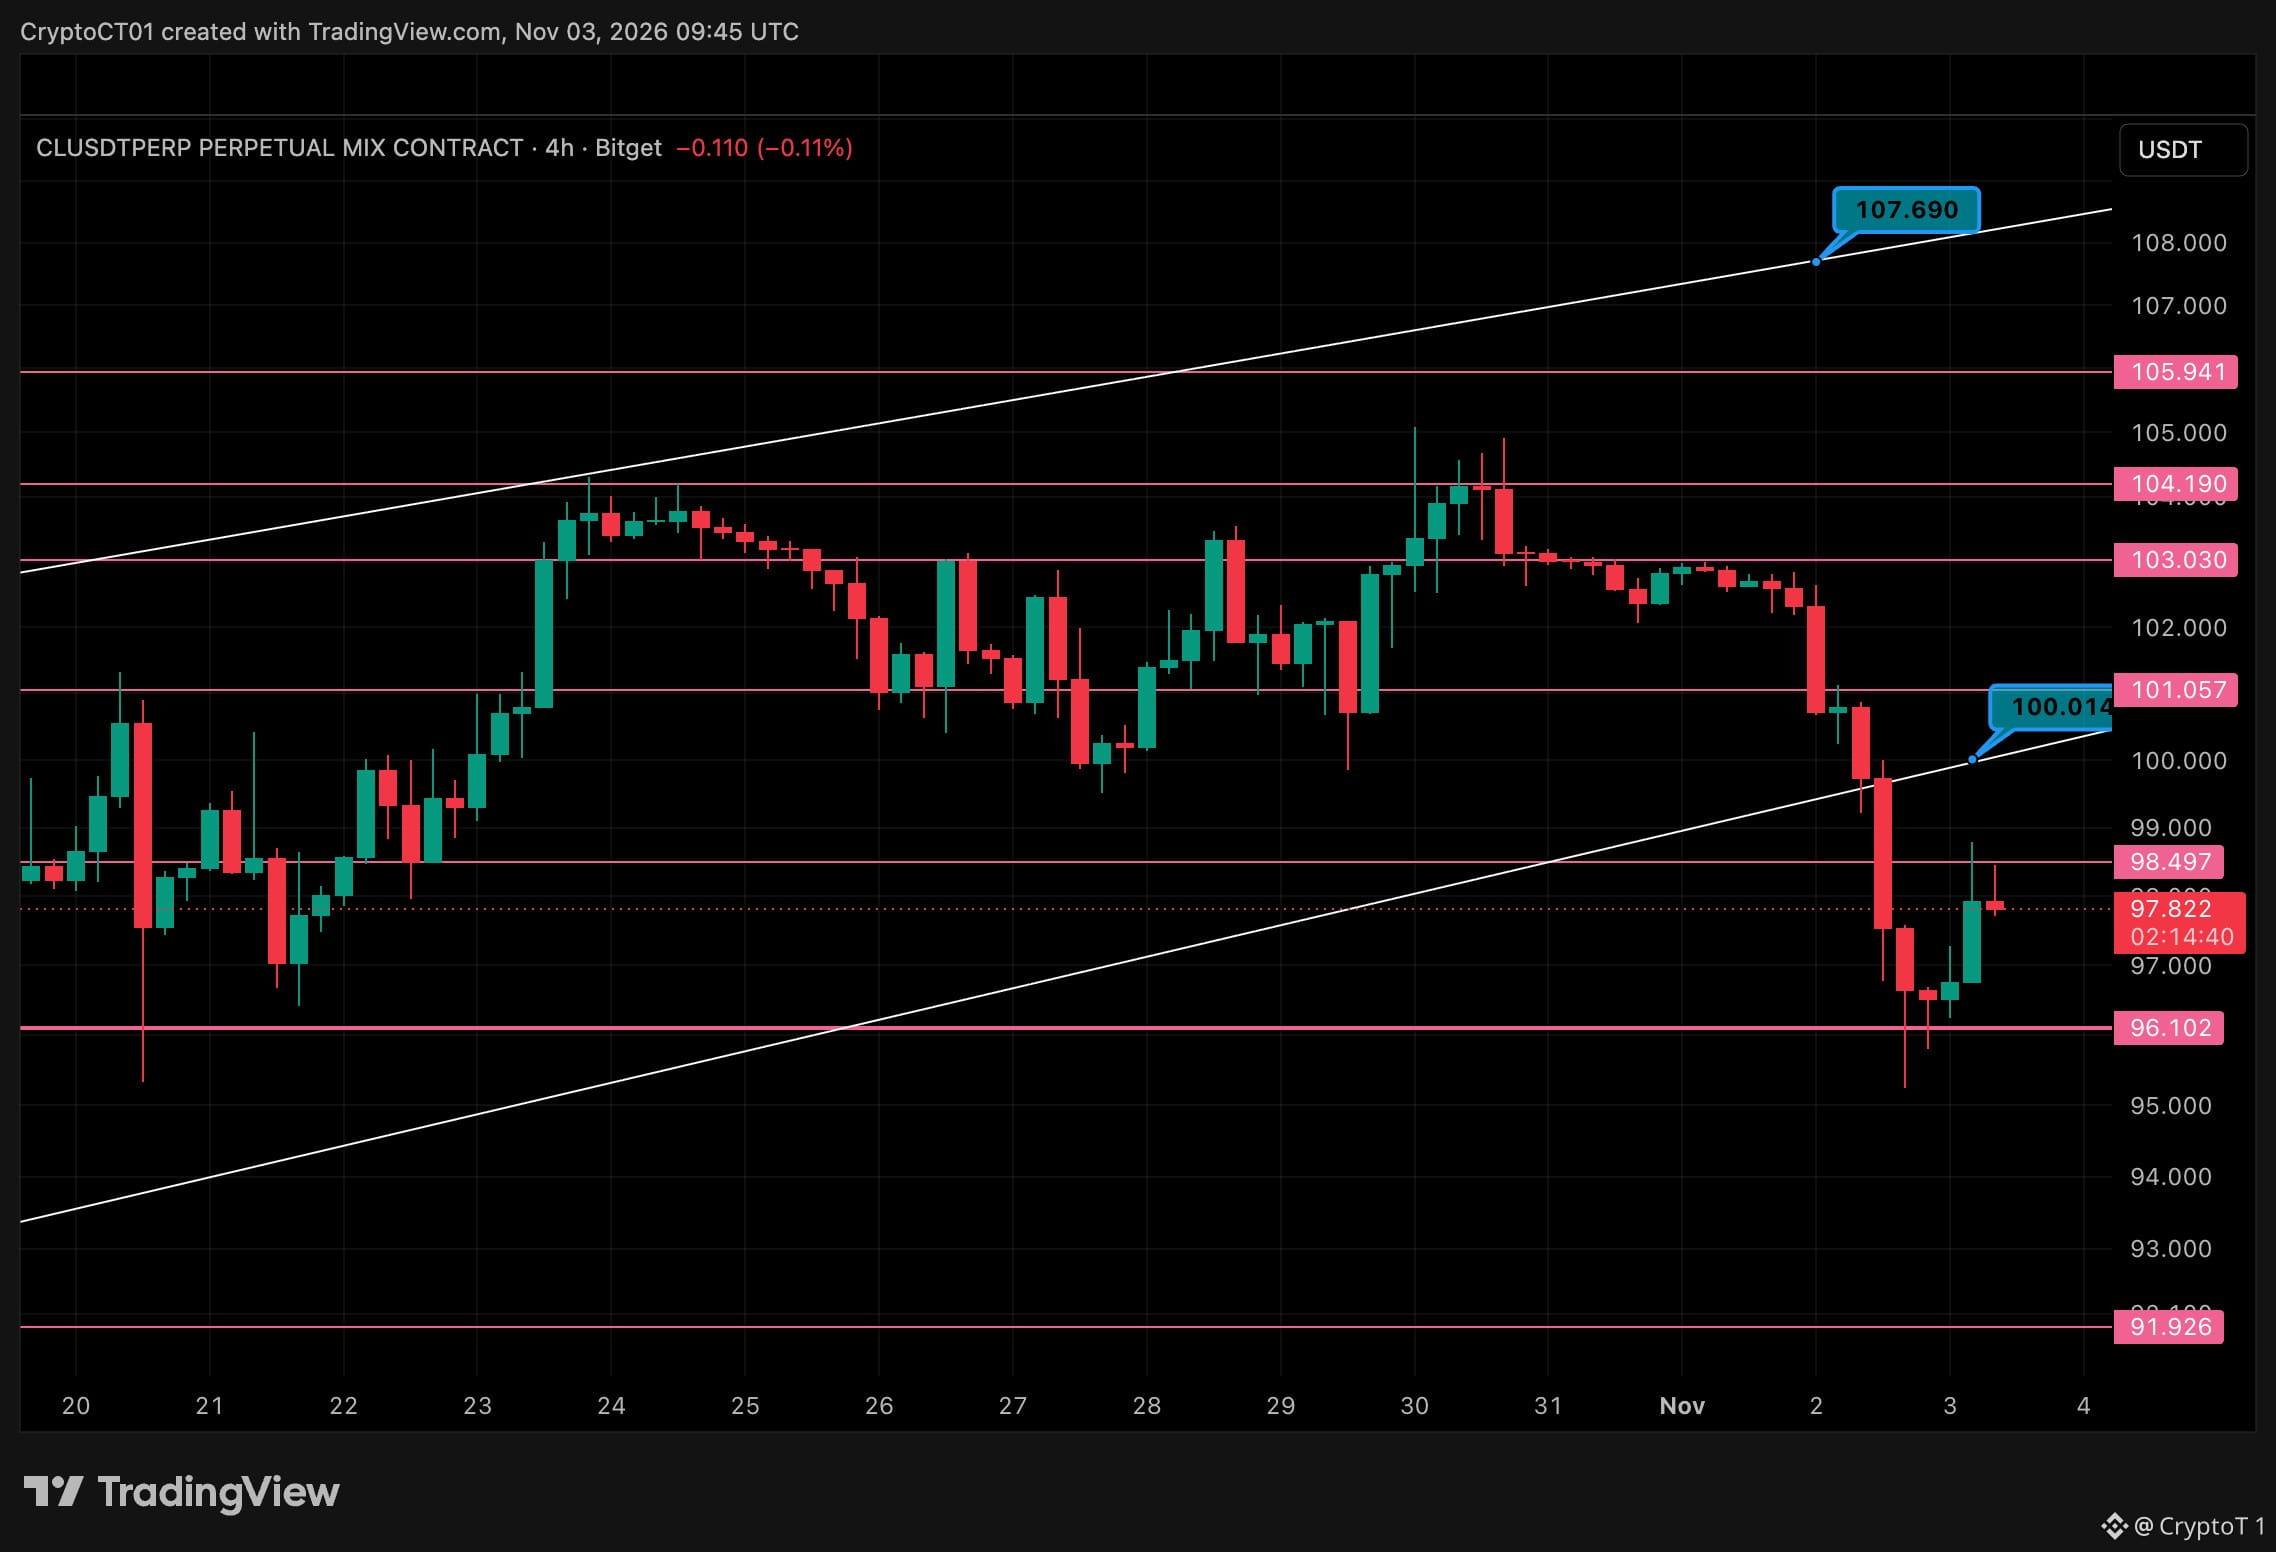
🛢️ Atualização do $OIL: Linha de tendência rompida. E agora? Continuação da análise de ontem 👇 O $CL perdeu a linha de tendência ascendente e caiu direto até o suporte. Agora está reagindo. 🔹 Preço: 97.8 🔴 Resistência: 98.5, depois 100 (reteste da linha de tendência rompida) e 101 🟢 Suporte: 96.1 segurou pelo pavio; abaixo disso, 91.9 Se 98.5 passar a atuar como suporte, um reteste de 100 está no radar. Se o preço for rejeitado abaixo da antiga linha de tendência, 96.1 volta a entrar em jogo. Não estou perseguindo o preço; estou esperando ele vir até mim. Repique ou reteste seguido de queda? 👇 Isto não é aconselhamento financeiro. #Oil #WTI #Trading
🛢️ Atualização do $OIL: Linha de tendência rompida. E agora? Continuação da análise de ontem 👇 O $CL perdeu a linha de tendência ascendente e caiu direto até o suporte. Agora está reagindo. 🔹 Preço: 97.8 🔴 Resistência: 98.5, depois 100 (reteste da linha de tendência rompida) e 101 🟢 Suporte: 96.1 segurou pelo pavio; abaixo disso, 91.9 Se 98.5 passar a atuar como suporte, um reteste de 100 está no radar. Se o preço for rejeitado abaixo da antiga linha de tendência, 96.1 volta a entrar em jogo. Não estou perseguindo o preço; estou esperando ele vir até mim. Repique ou reteste seguido de queda? 👇 Isto não é aconselhamento financeiro. #Oil #WTI #Trading
69
·
--
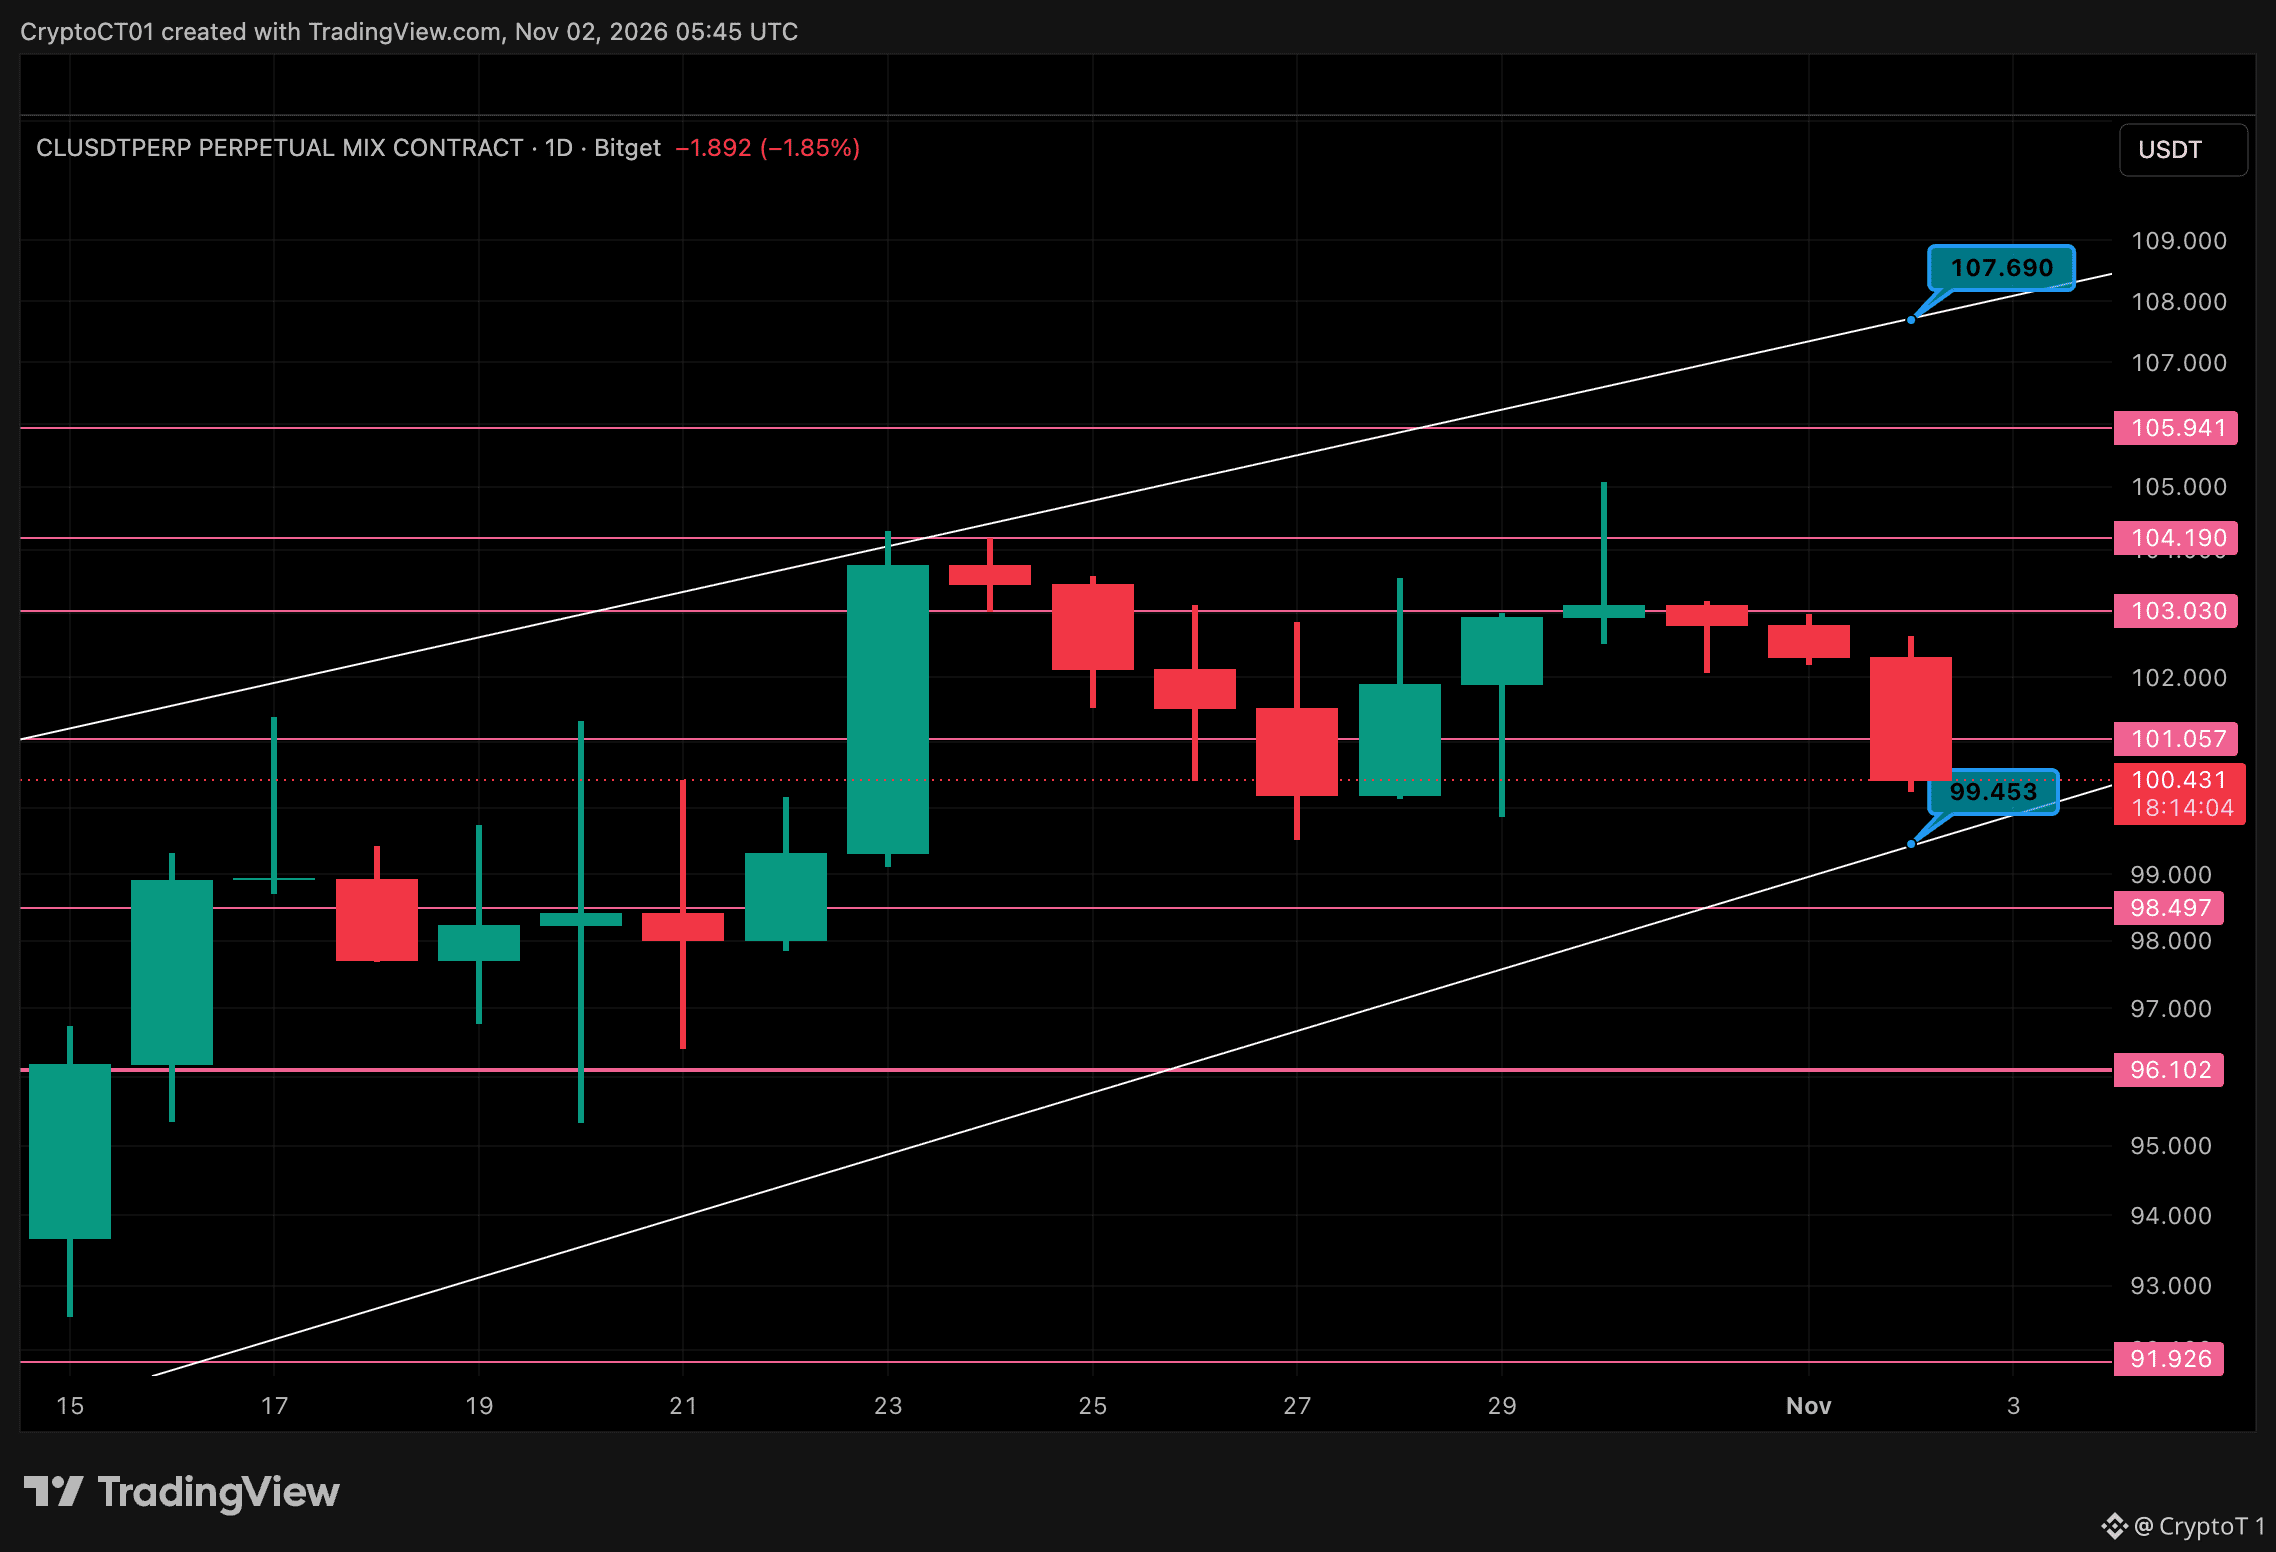
O petróleo está negociando com base nas conversas de paz, não nas manchetes sobre a guerra 🛢️ O petróleo bruto voltou a ser negociado na noite de domingo, após a Axios noticiar que Netanyahu quer atacar o Irã logo depois das eleições de meio de mandato de terça-feira. O mercado preferiu olhar para Doha. O Irã e os mediadores do Catar estão no terceiro dia de conversas. O ministro das Relações Exteriores do Irã diz que elas estão "em andamento e progredindo", com um plano de dois dias para reabrir o estreito de Ormuz em pauta. Ainda não há acordo. $CL nos contratos perpétuos cai cerca de 2%, a 100,4, bem na base do canal ascendente: 🟢 Segura em ~99,45 (base do canal): repique em direção a 101,06 e depois 103,03 🔴 Se perder esse nível: 98,50 e depois 96,10 🟢 Acima de 104,19, o prêmio de guerra volta A votação de terça-feira é o próximo teste. O prêmio de guerra está finalmente saindo do petróleo ou esta é a calmaria antes de terça-feira? 👇 Isto não é aconselhamento financeiro. #Petróleo #Irã #CL
O petróleo está negociando com base nas conversas de paz, não nas manchetes sobre a guerra 🛢️ O petróleo bruto voltou a ser negociado na noite de domingo, após a Axios noticiar que Netanyahu quer atacar o Irã logo depois das eleições de meio de mandato de terça-feira. O mercado preferiu olhar para Doha. O Irã e os mediadores do Catar estão no terceiro dia de conversas. O ministro das Relações Exteriores do Irã diz que elas estão "em andamento e progredindo", com um plano de dois dias para reabrir o estreito de Ormuz em pauta. Ainda não há acordo. $CL nos contratos perpétuos cai cerca de 2%, a 100,4, bem na base do canal ascendente: 🟢 Segura em ~99,45 (base do canal): repique em direção a 101,06 e depois 103,03 🔴 Se perder esse nível: 98,50 e depois 96,10 🟢 Acima de 104,19, o prêmio de guerra volta A votação de terça-feira é o próximo teste. O prêmio de guerra está finalmente saindo do petróleo ou esta é a calmaria antes de terça-feira? 👇 Isto não é aconselhamento financeiro. #Petróleo #Irã #CL
132
·
--
Ver tradução
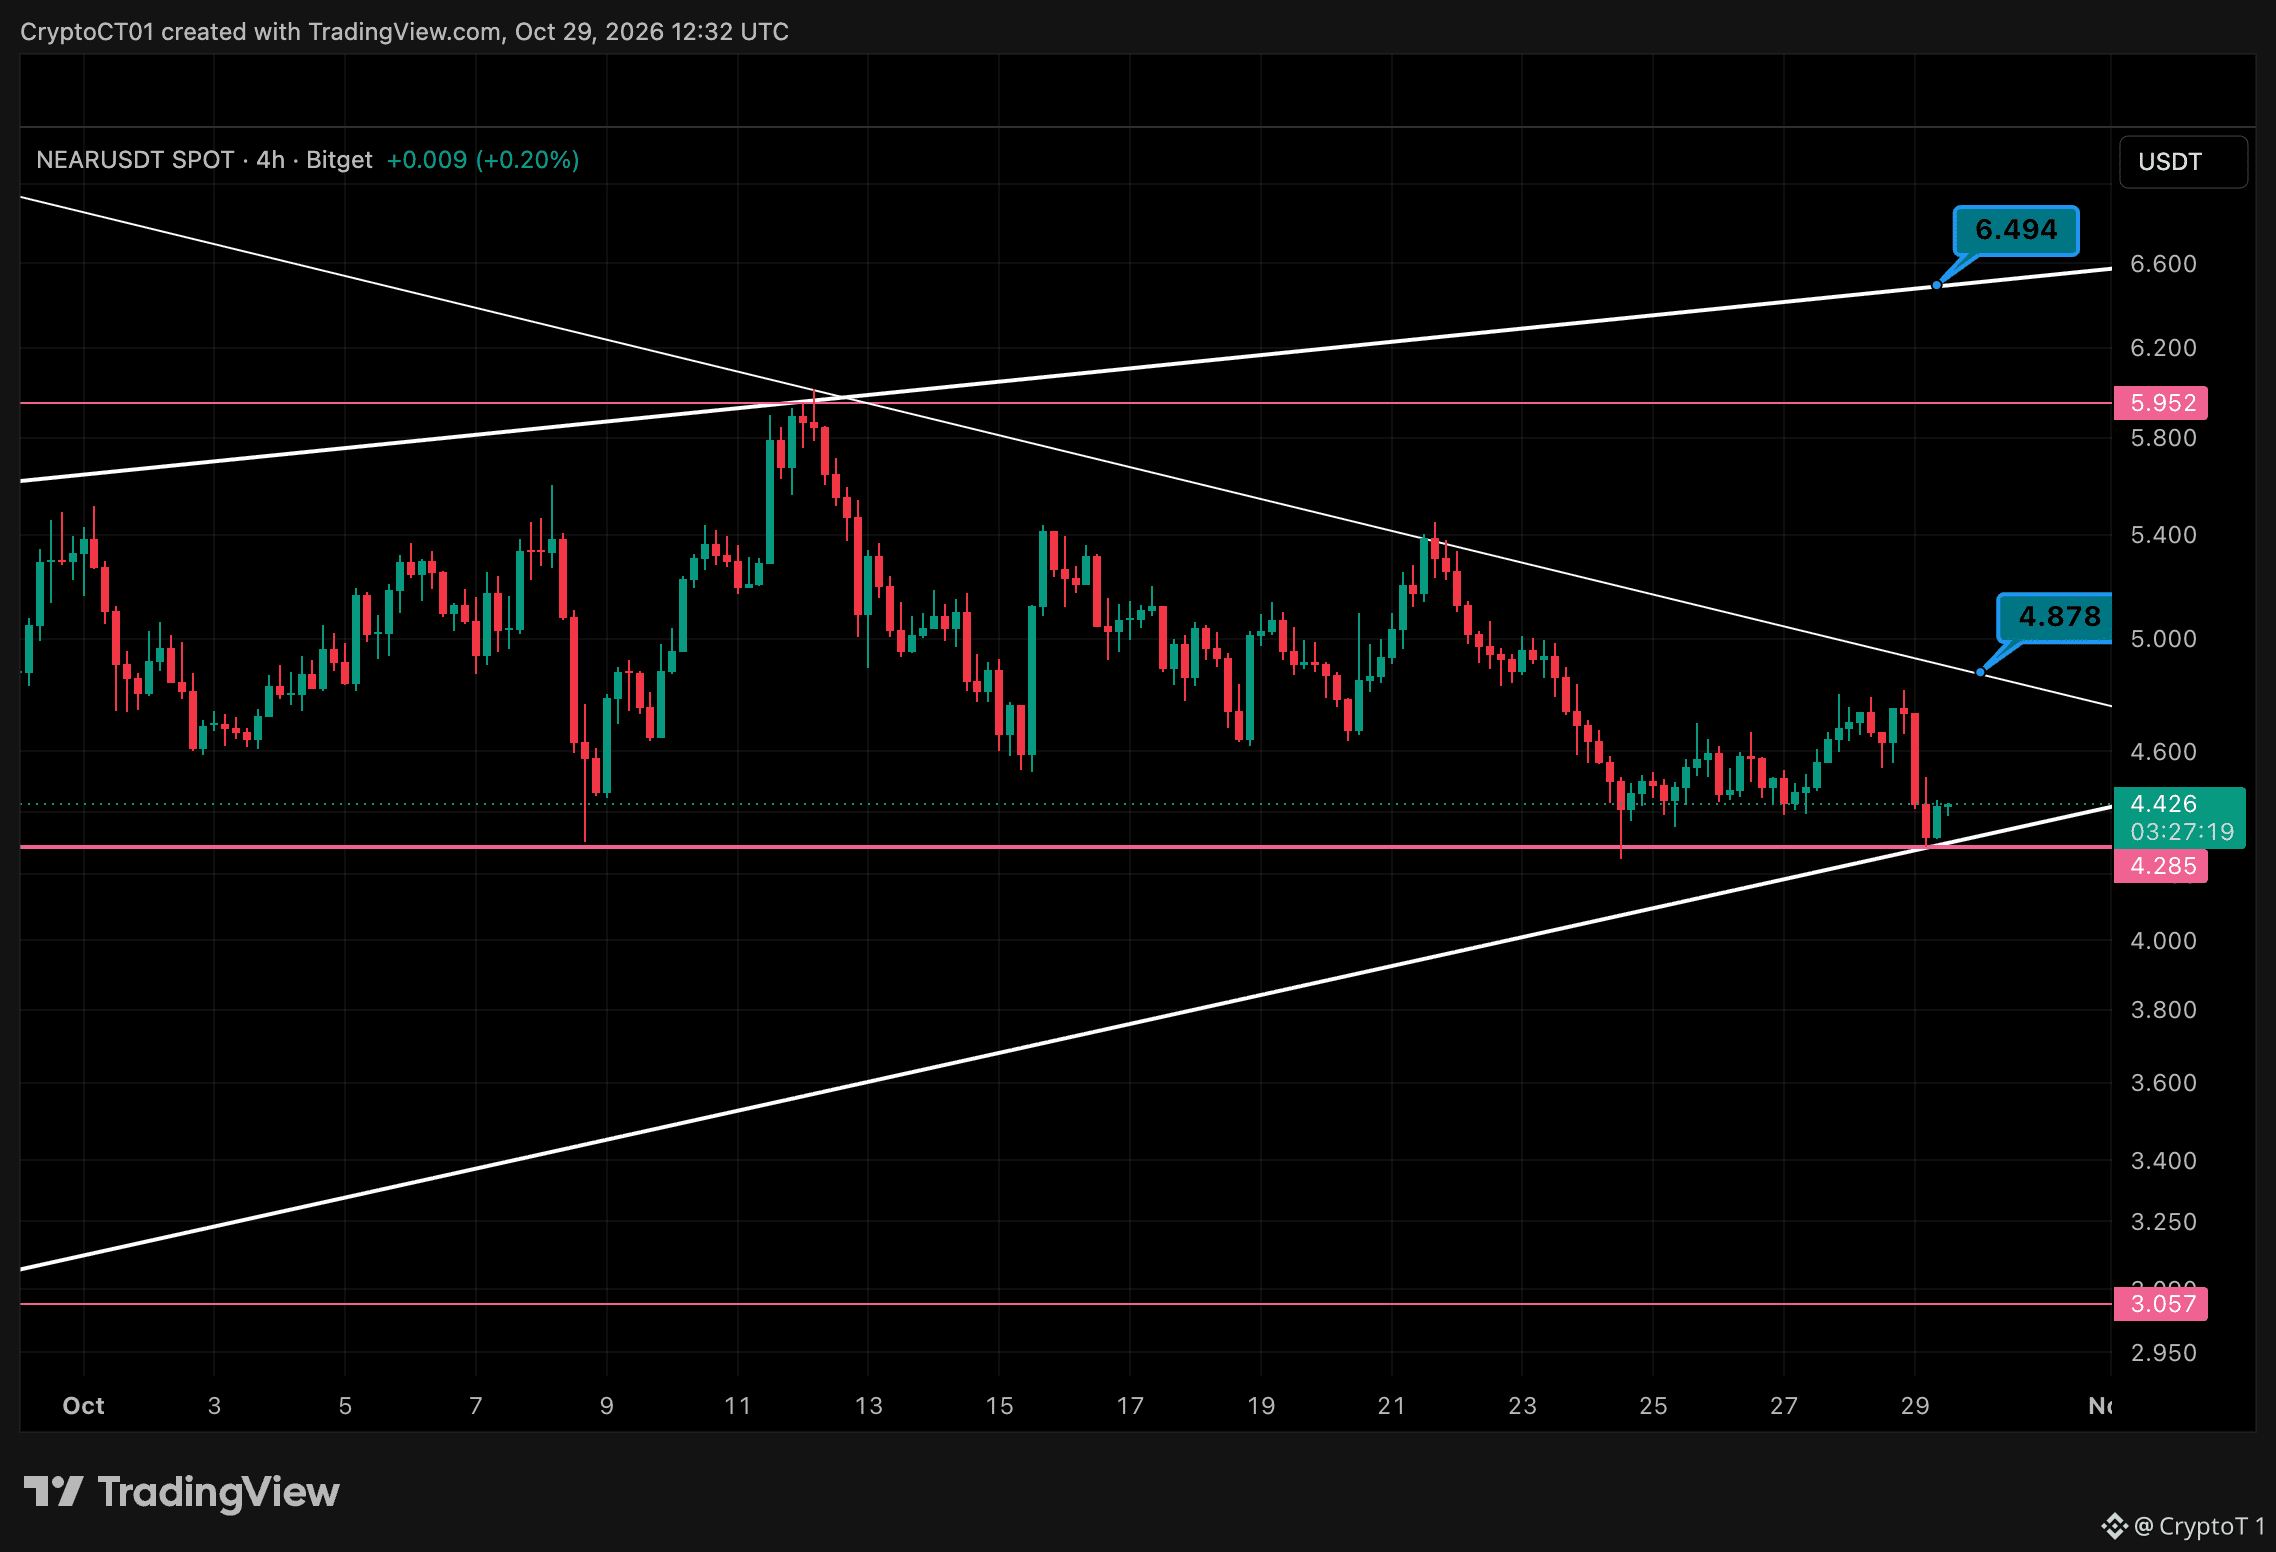
$NEAR Sitting On Make-Or-Break Support 🎯 Context: 4H chart. Price is back on the rising trendline and the 4.285 floor at the same time, while the falling trendline keeps pressing down from above. Something has to give. 🔴 5.952 (October high) 🔴 4.878 (falling trendline) 🟢 4.285 (horizontal and trendline support) 🟢 3.057 (next real floor) My read: Bulls have defended 4.285 on every touch. Hold it and a push to 4.878 is on. A clean break above the trendline opens 5.952, with 6.494 as the bigger target. The risk: A 4H close below 4.285 breaks both supports at once. Not much below that until 3.057. Bounce or breakdown from here? 👇 #NEAR #Crypto
$NEAR Sitting On Make-Or-Break Support 🎯 Context: 4H chart. Price is back on the rising trendline and the 4.285 floor at the same time, while the falling trendline keeps pressing down from above. Something has to give. 🔴 5.952 (October high) 🔴 4.878 (falling trendline) 🟢 4.285 (horizontal and trendline support) 🟢 3.057 (next real floor) My read: Bulls have defended 4.285 on every touch. Hold it and a push to 4.878 is on. A clean break above the trendline opens 5.952, with 6.494 as the bigger target. The risk: A 4H close below 4.285 breaks both supports at once. Not much below that until 3.057. Bounce or breakdown from here? 👇 #NEAR #Crypto
80
·
--
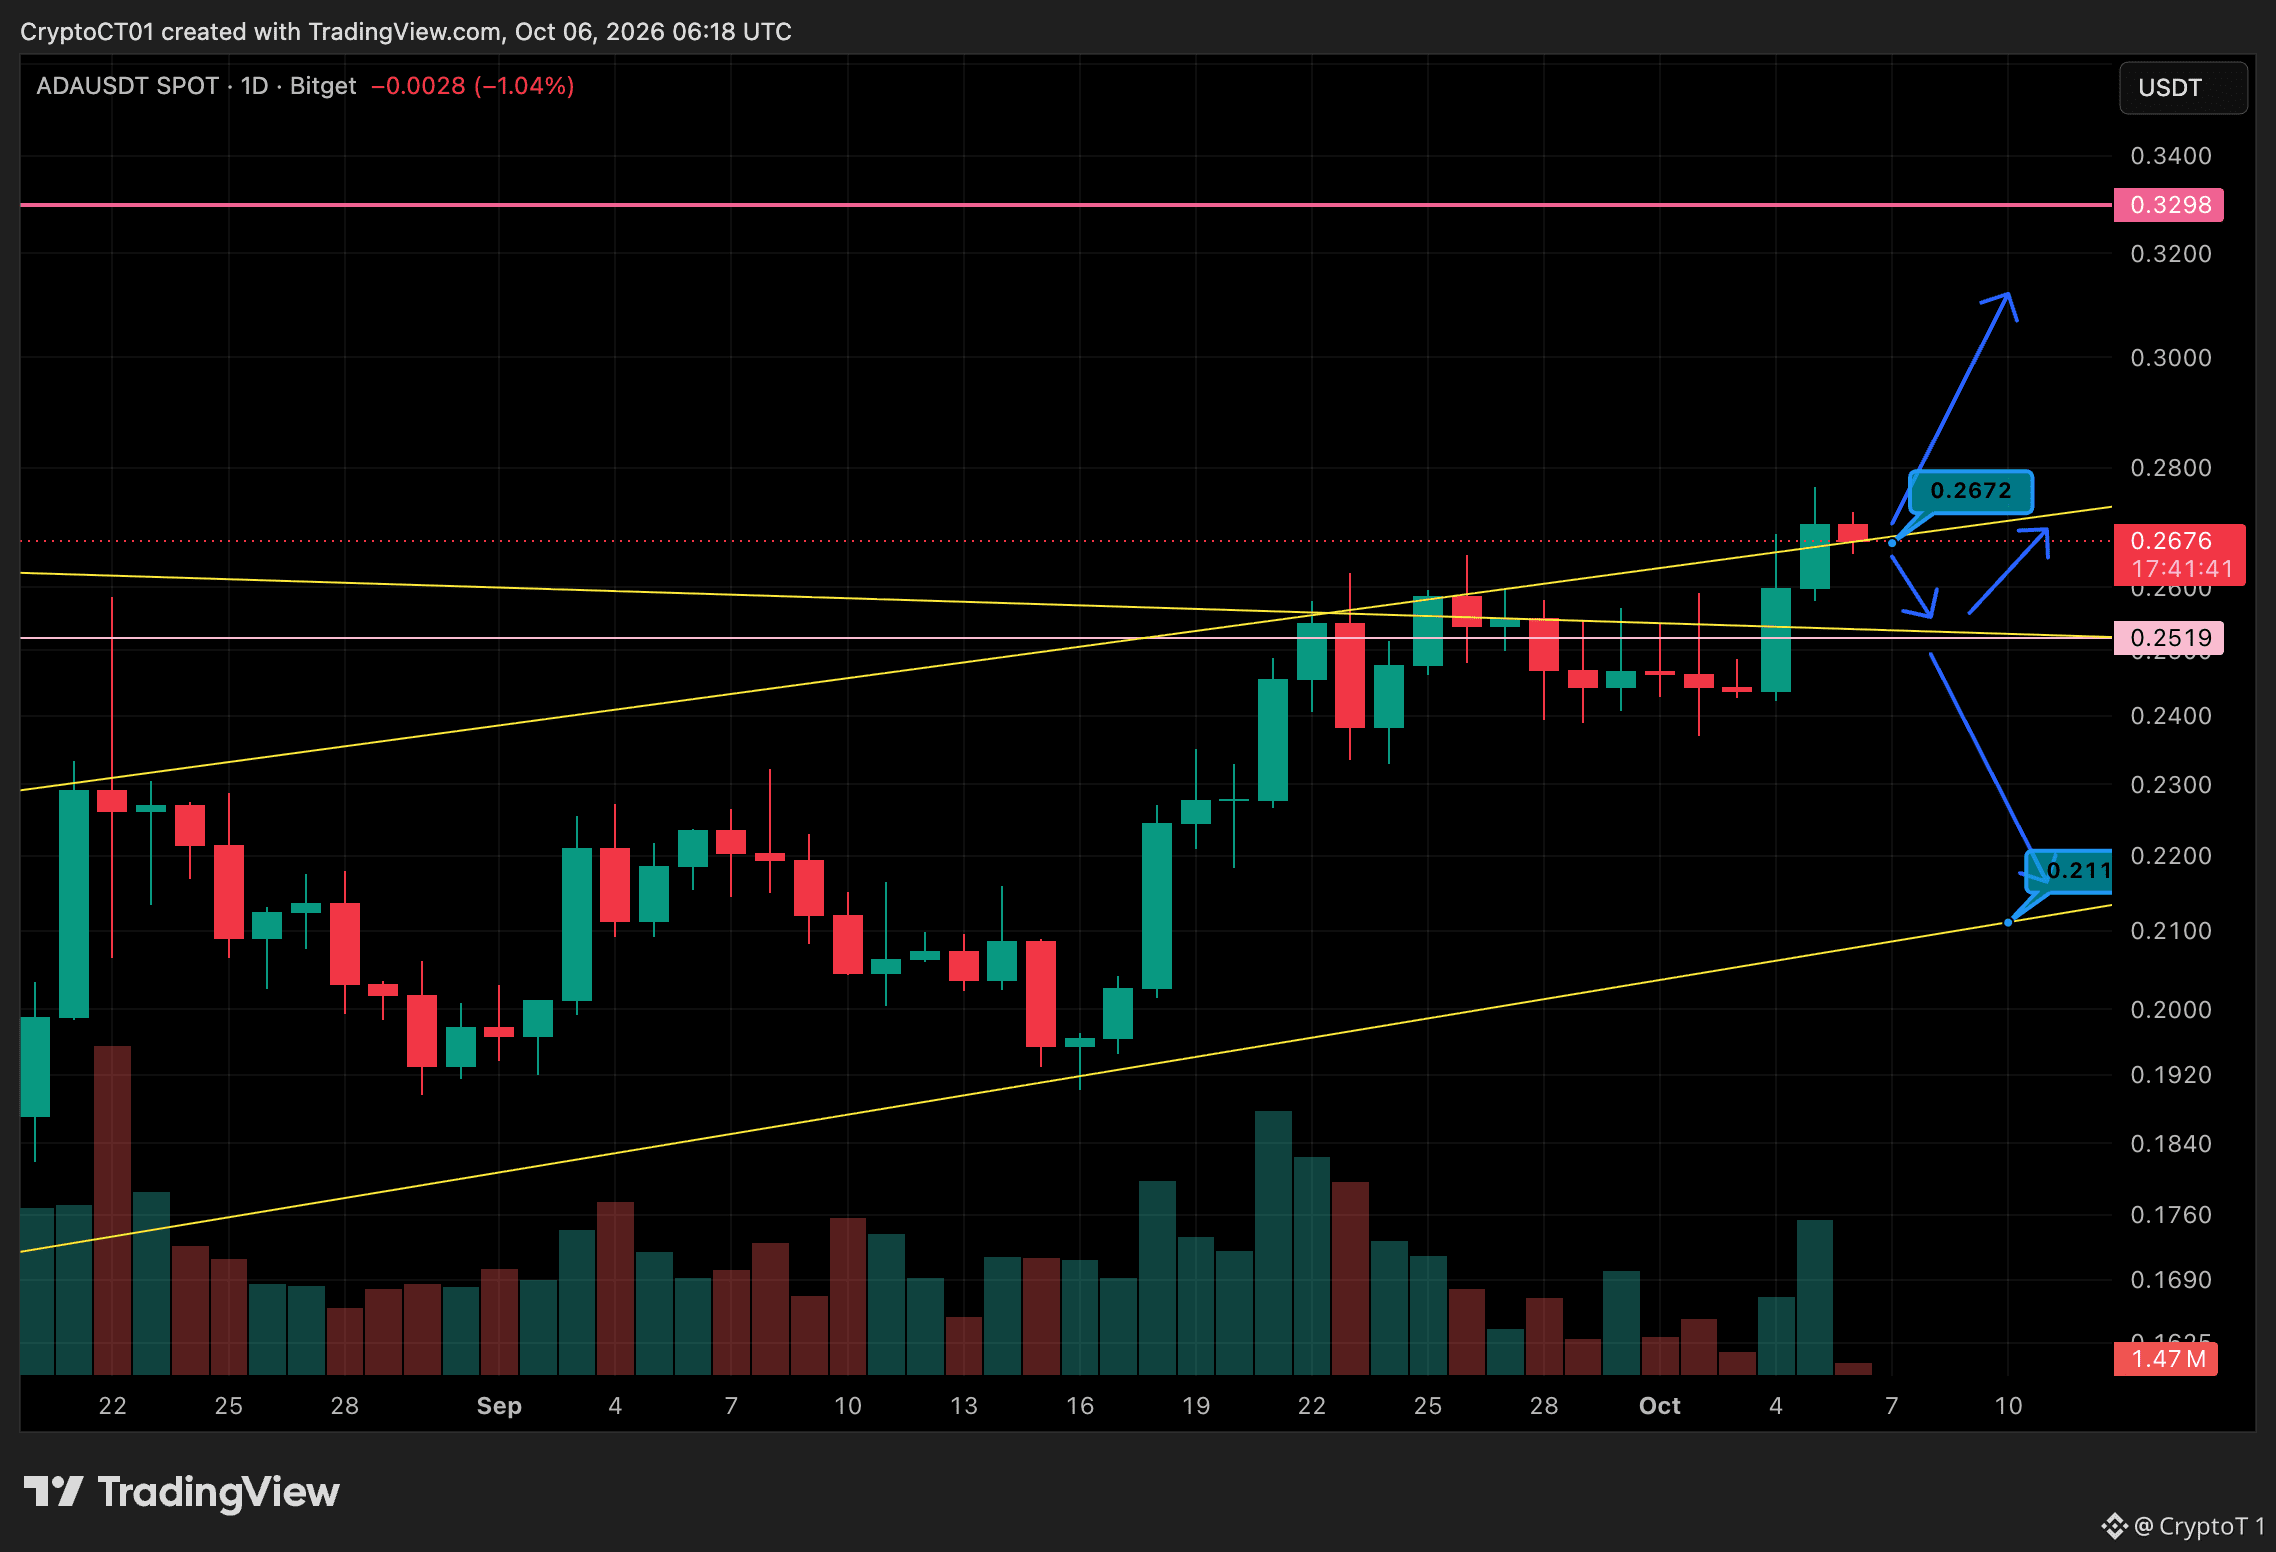
📈 ADAUSDT · 1D rompeu a linha de tendência de resistência por volta de $0.267. Se mantivermos esse nível → próxima parada é a resistência acima de ~$0.330. Se enfraquecermos aqui → voltamos primeiro para a faixa de $0.252 e depois decidimos se vamos subir ou descer. Não é um rompimento até que o nível se mantenha. #ADA #Bitget #UEX $ADA
📈 ADAUSDT · 1D rompeu a linha de tendência de resistência por volta de $0.267. Se mantivermos esse nível → próxima parada é a resistência acima de ~$0.330. Se enfraquecermos aqui → voltamos primeiro para a faixa de $0.252 e depois decidimos se vamos subir ou descer. Não é um rompimento até que o nível se mantenha. #ADA #Bitget #UEX $ADA
58
·
--
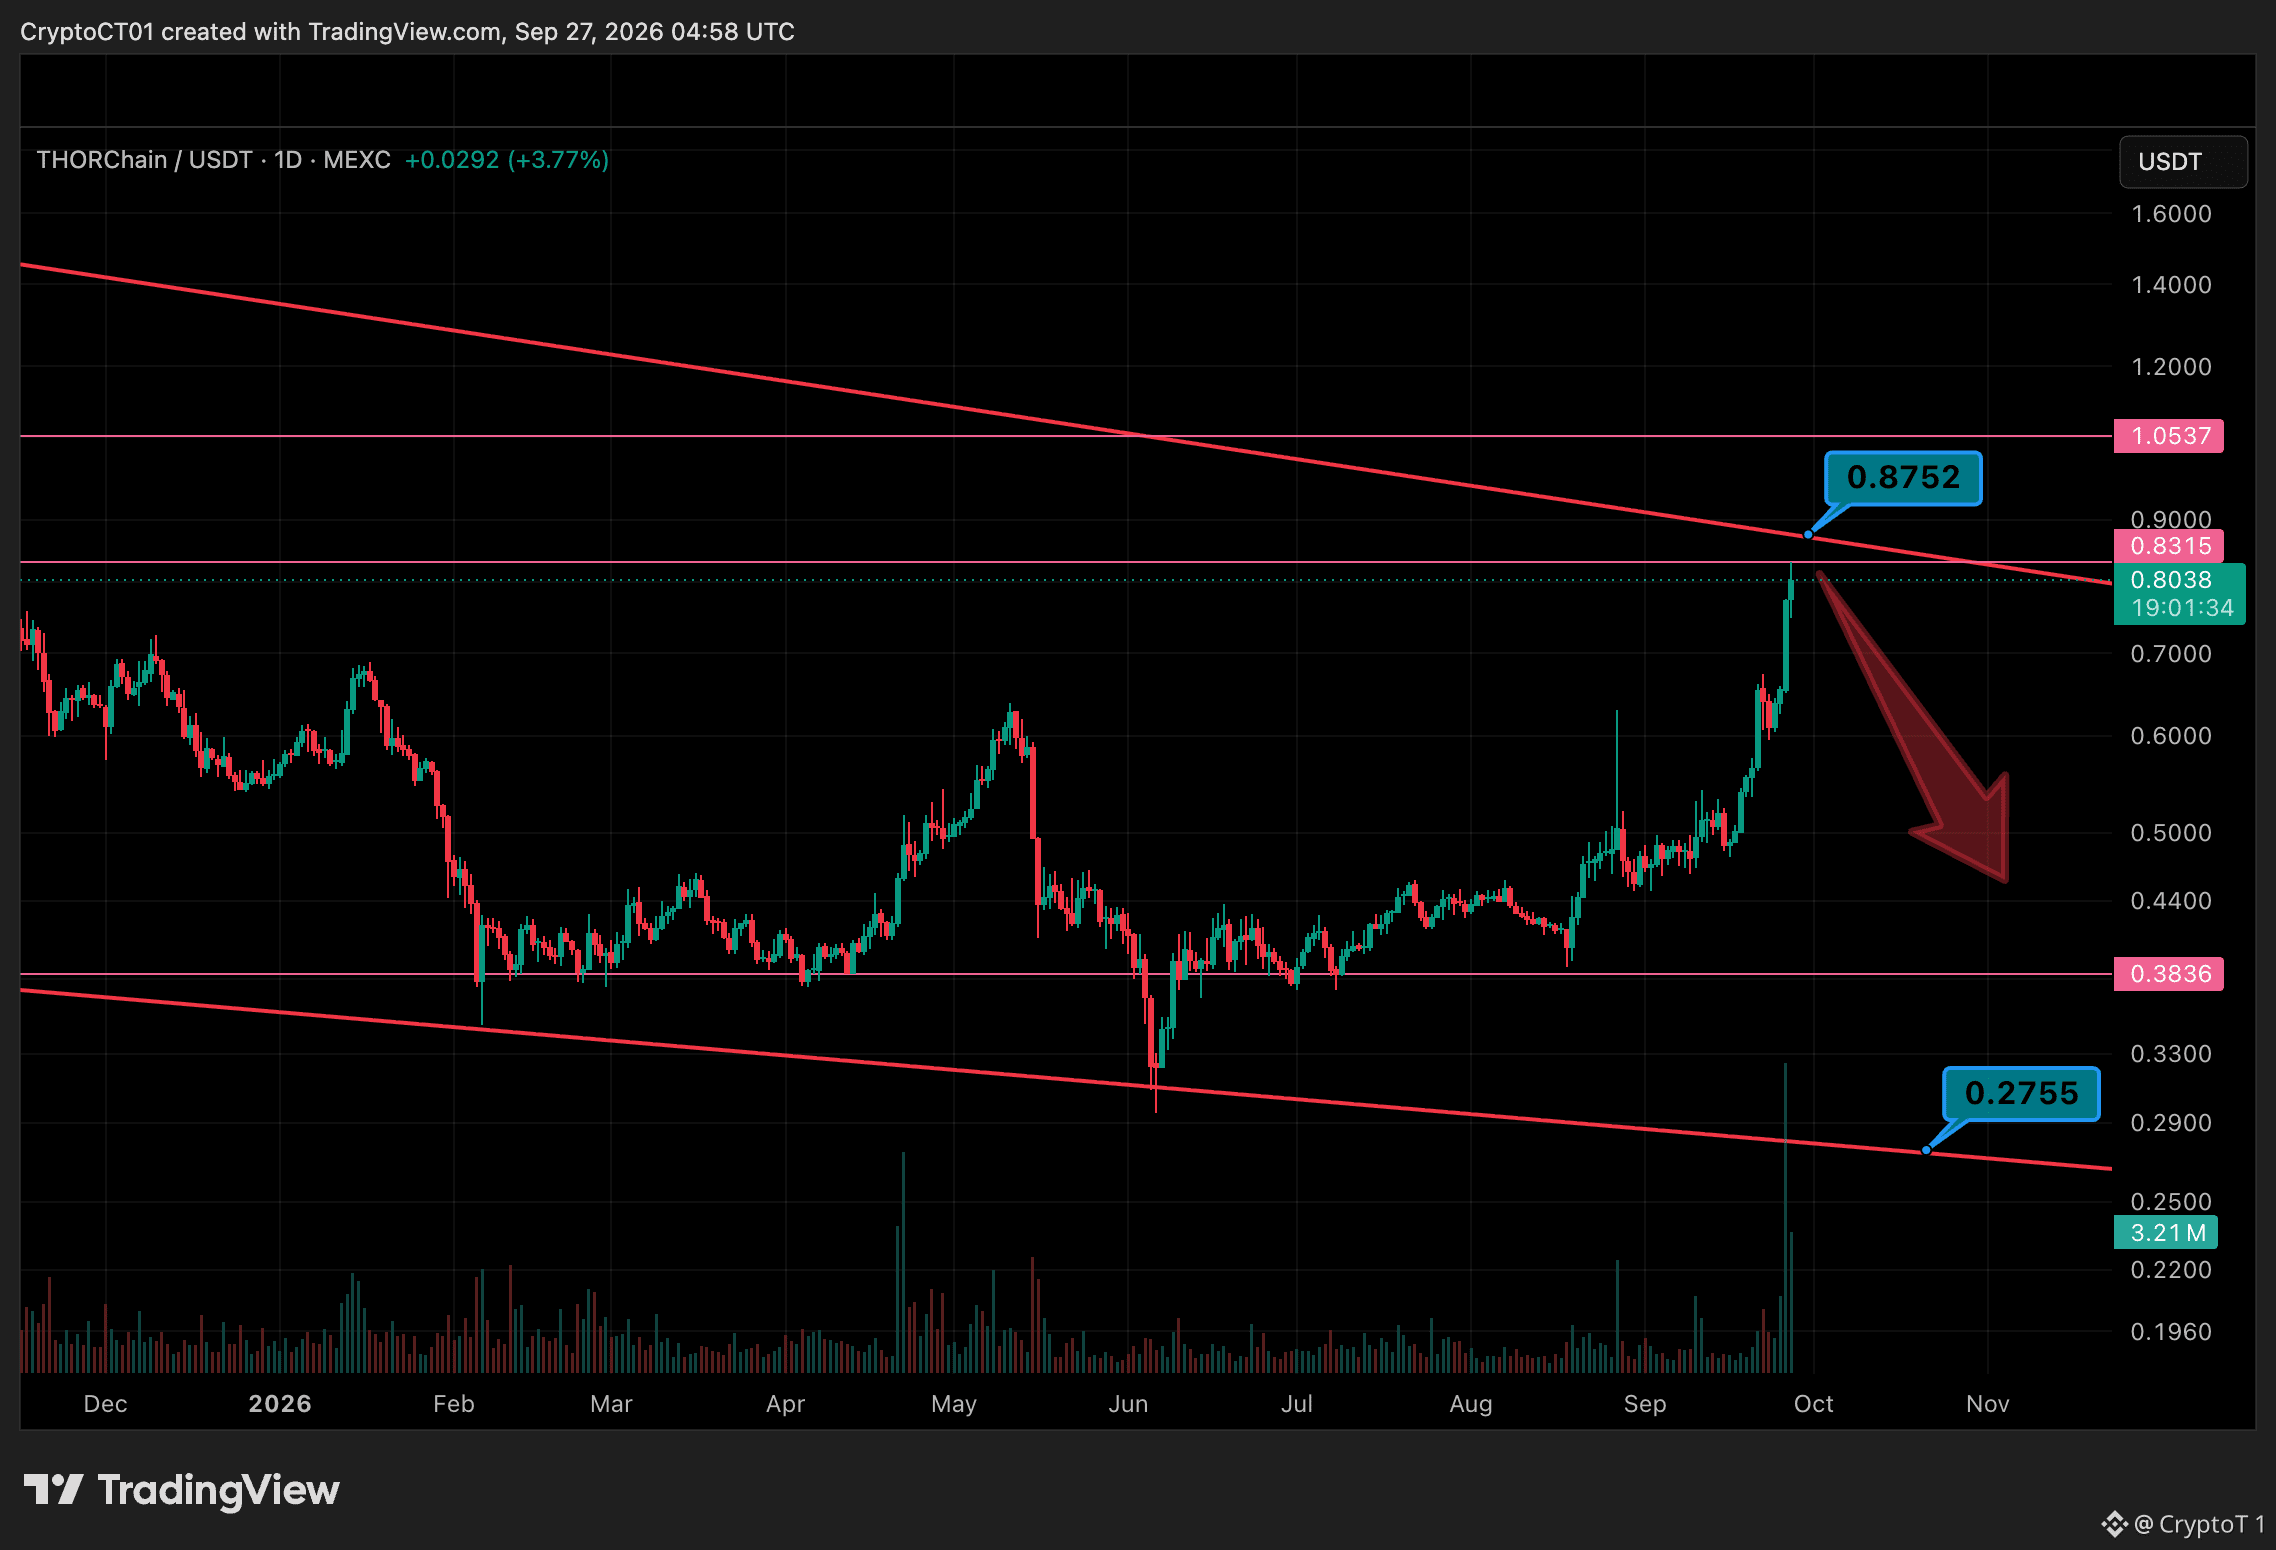
$RUNE parece promissor até você abrir o gráfico 📉 $0.8096, indo direto para uma linha de tendência de baixa que rejeita todas as altas por um ano. Primeira barreira em $0.8315. Depois $0.8752. Isso é uma resistência forte, e tem se mantido forte por doze meses. Romper isso não é o cenário-base. Cuidado com suas compras aqui. Se ele rejeitar, há um longo caminho para baixo. $0.3836 é o próximo suporte real, e $0.2755 fica abaixo disso. Você está arriscando metade da sua posição por uma linha que aguentou o ano inteiro. Espere a ruptura. Não compre a barreira. Não é aconselhamento financeiro. #RUNE #Crypto
$RUNE parece promissor até você abrir o gráfico 📉 $0.8096, indo direto para uma linha de tendência de baixa que rejeita todas as altas por um ano. Primeira barreira em $0.8315. Depois $0.8752. Isso é uma resistência forte, e tem se mantido forte por doze meses. Romper isso não é o cenário-base. Cuidado com suas compras aqui. Se ele rejeitar, há um longo caminho para baixo. $0.3836 é o próximo suporte real, e $0.2755 fica abaixo disso. Você está arriscando metade da sua posição por uma linha que aguentou o ano inteiro. Espere a ruptura. Não compre a barreira. Não é aconselhamento financeiro. #RUNE #Crypto
67
Faça login para explorar mais conteúdos
Junte-se a usuários de criptomoedas de todo o mundo no Binance Square.
⚡️ Obter informações mais recentes e úteis sobre criptomoeda.
💬 Com a confiança da maior corretora de criptomoedas do mundo.
👍 Descubra insights reais de criadores verificados.
E-mail / número de telefone
Tópicos em Alta
NvidiaBeatsEstimatesAICloudStocksRiseAfterHours
5,616 visualizações
73 discutindo
Nvidia supera expectativas com receita de US$ 115,8 bilhões, prevê US$ 130 bilhões e acrescenta US$ 150 bilhões à recompra de ações
Binance News
·8 curtidas
·10.6k visualizações
A Packed Week of Earnings and Data Tests Markets
153,499 visualizações
668 discutindo
AnthropicIPOTestsInvestorAppetiteForAI
338,996 visualizações
2,934 discutindo