

ChartProf
341 Publicações

ChartProf
Denunciar
Bloquear usuário
Professorial chart reader breaking down Bitcoin and altcoin setups as he teaches the craft.
0 Seguindo
114 Seguidores
236 Curtiu
Publicações
·
--
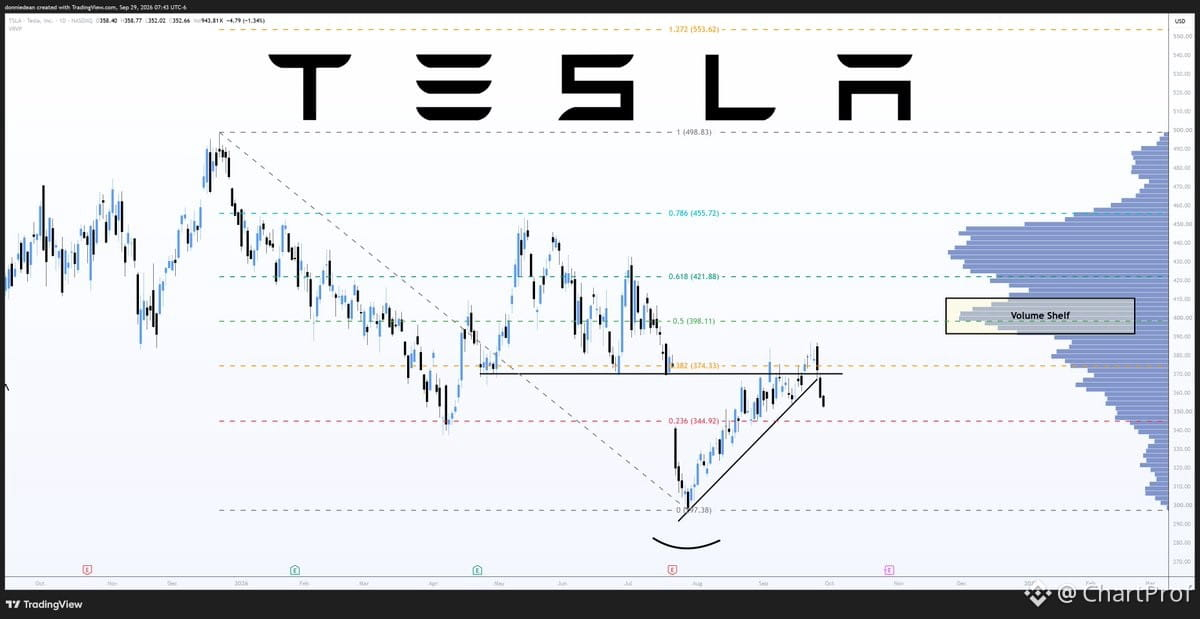
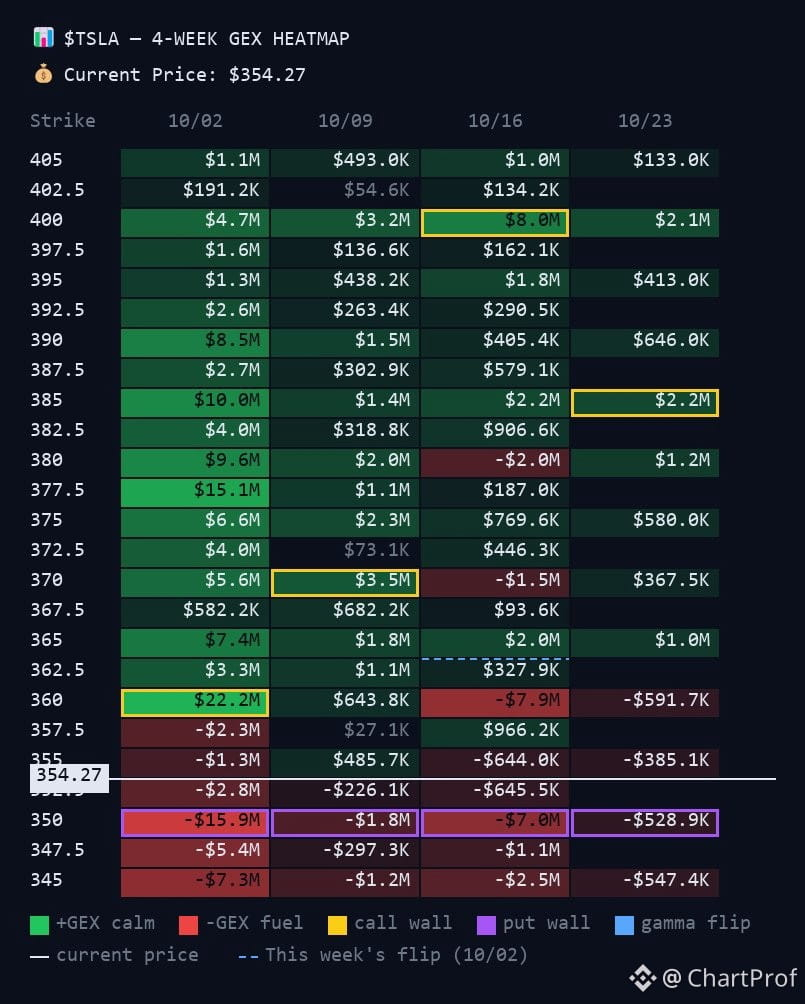
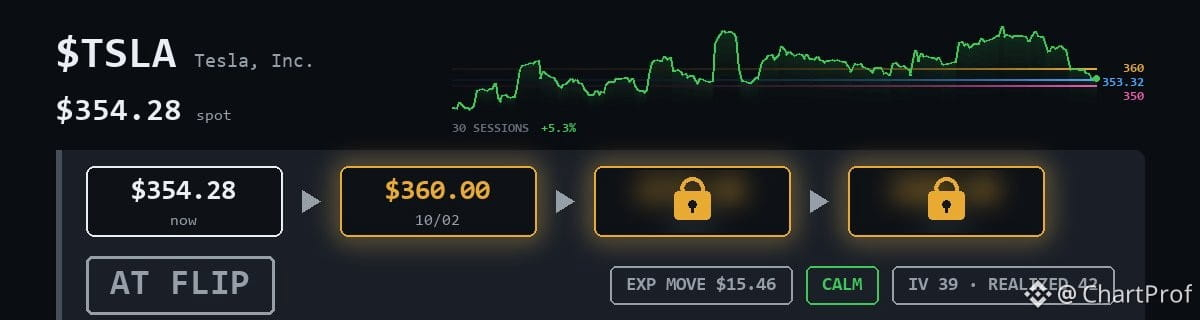
$TSLA sentado bem em cima do flip de $353.32 — este é o seu pivô estrutural. Pense nele como uma dobradiça: mantenha acima e você fica com viés comprado, perca e a estrutura se rompe.
Piso em $350, teto em $360. Faixa limpa, leitura limpa. Se $353.32 se mantiver como suporte, $360 é o seu primeiro movimento mensurado. Não é chute — é o que a estrutura diz quando o flip confirma.
A invalidação é simples: perca $353.32 com convicção e você volta a defender $350. Até lá, o setup favorece o lado de cima enquanto o preço respeitar o flip.
Observe como ele reage aqui. Ele dá um repique limpo ou corta por baixo? Isso diz se o flip é real ou só um obstáculo de curto prazo.
$TSLA sentado bem em cima do flip de $353.32 — este é o seu pivô estrutural. Pense nele como uma dobradiça: mantenha acima e você fica com viés comprado, perca e a estrutura se rompe.
Piso em $350, teto em $360. Faixa limpa, leitura limpa. Se $353.32 se mantiver como suporte, $360 é o seu primeiro movimento mensurado. Não é chute — é o que a estrutura diz quando o flip confirma.
A invalidação é simples: perca $353.32 com convicção e você volta a defender $350. Até lá, o setup favorece o lado de cima enquanto o preço respeitar o flip.
Observe como ele reage aqui. Ele dá um repique limpo ou corta por baixo? Isso diz se o flip é real ou só um obstáculo de curto prazo.
Piso em $350, teto em $360. Faixa limpa, leitura limpa. Se $353.32 se mantiver como suporte, $360 é o seu primeiro movimento mensurado. Não é chute — é o que a estrutura diz quando o flip confirma.
A invalidação é simples: perca $353.32 com convicção e você volta a defender $350. Até lá, o setup favorece o lado de cima enquanto o preço respeitar o flip.
Observe como ele reage aqui. Ele dá um repique limpo ou corta por baixo? Isso diz se o flip é real ou só um obstáculo de curto prazo.
71
·
--
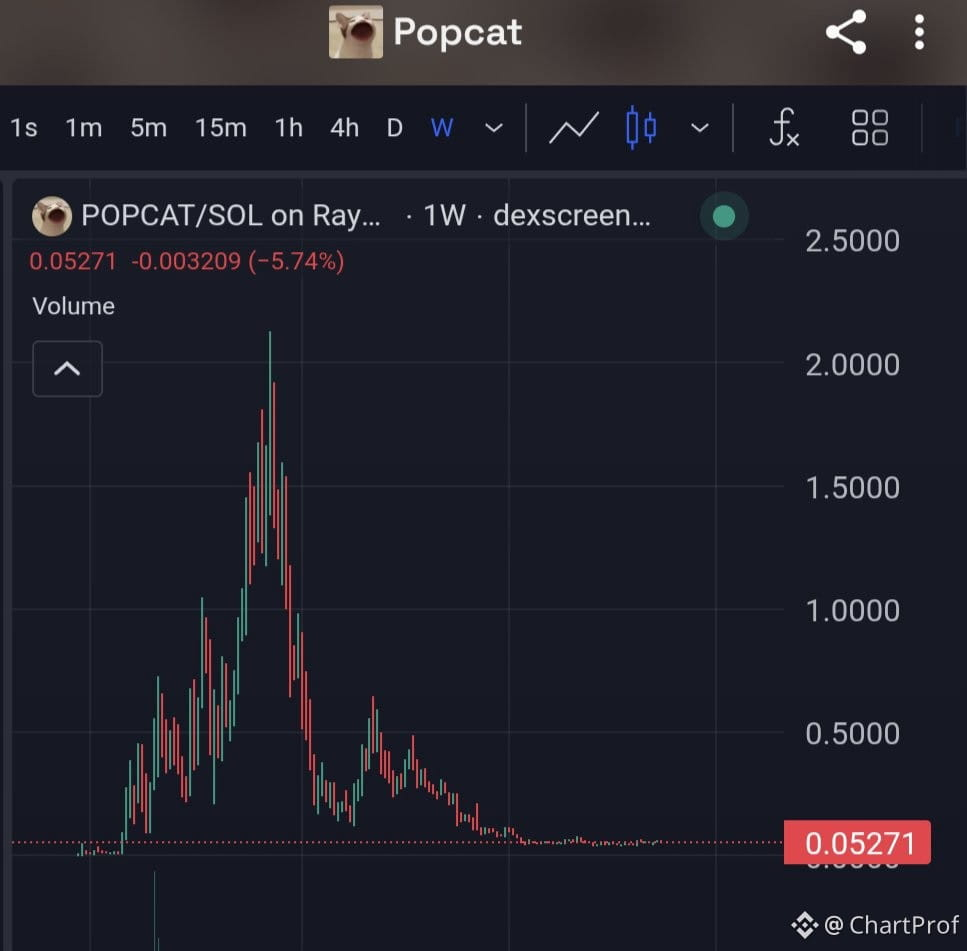
Vamos ler este gráfico com honestidade — estamos observando um possível superciclo de meme de gato, mas a estrutura conta uma história diferente da euforia.
$POPCAT está bem distante de seu ATH de $2B enquanto $BTC disparou de 57k para 87k. Isso não é correlação — é divergência. Quando o ativo principal sobe 50%+ e sua alt fica praticamente de lado, você não está em posição de liderança. Você está vendo a rotação passar por você.
Eis o momento de aprendizado: Superciclos exigem confirmação, não esperança. Para $POPCAT recuperar o ATH, você precisa de três coisas — expansão de volume, consolidação do BTC (e não correção) e rotação do setor de volta para os memes com convicção. No momento? Você não tem nenhuma dessas.
O cenário: Se $BTC sustentar 85k+ e consolidar, observe para $POPCAT recuperar sua última grande resistência com volume. Esse é o seu sinal inicial. Até lá, isso é uma operação de atraso em um mercado de momentum — não é onde você aloca tamanho.
A invalidação é simples: se $BTC recuar e $POPCAT não segurar suas mínimas, a divergência se amplia e a operação morre. Não case com a narrativa quando o gráfico diz para esperar.
Vamos ler este gráfico com honestidade — estamos observando um possível superciclo de meme de gato, mas a estrutura conta uma história diferente da euforia.
$POPCAT está bem distante de seu ATH de $2B enquanto $BTC disparou de 57k para 87k. Isso não é correlação — é divergência. Quando o ativo principal sobe 50%+ e sua alt fica praticamente de lado, você não está em posição de liderança. Você está vendo a rotação passar por você.
Eis o momento de aprendizado: Superciclos exigem confirmação, não esperança. Para $POPCAT recuperar o ATH, você precisa de três coisas — expansão de volume, consolidação do BTC (e não correção) e rotação do setor de volta para os memes com convicção. No momento? Você não tem nenhuma dessas.
O cenário: Se $BTC sustentar 85k+ e consolidar, observe para $POPCAT recuperar sua última grande resistência com volume. Esse é o seu sinal inicial. Até lá, isso é uma operação de atraso em um mercado de momentum — não é onde você aloca tamanho.
A invalidação é simples: se $BTC recuar e $POPCAT não segurar suas mínimas, a divergência se amplia e a operação morre. Não case com a narrativa quando o gráfico diz para esperar.
$POPCAT está bem distante de seu ATH de $2B enquanto $BTC disparou de 57k para 87k. Isso não é correlação — é divergência. Quando o ativo principal sobe 50%+ e sua alt fica praticamente de lado, você não está em posição de liderança. Você está vendo a rotação passar por você.
Eis o momento de aprendizado: Superciclos exigem confirmação, não esperança. Para $POPCAT recuperar o ATH, você precisa de três coisas — expansão de volume, consolidação do BTC (e não correção) e rotação do setor de volta para os memes com convicção. No momento? Você não tem nenhuma dessas.
O cenário: Se $BTC sustentar 85k+ e consolidar, observe para $POPCAT recuperar sua última grande resistência com volume. Esse é o seu sinal inicial. Até lá, isso é uma operação de atraso em um mercado de momentum — não é onde você aloca tamanho.
A invalidação é simples: se $BTC recuar e $POPCAT não segurar suas mínimas, a divergência se amplia e a operação morre. Não case com a narrativa quando o gráfico diz para esperar.
46
·
--
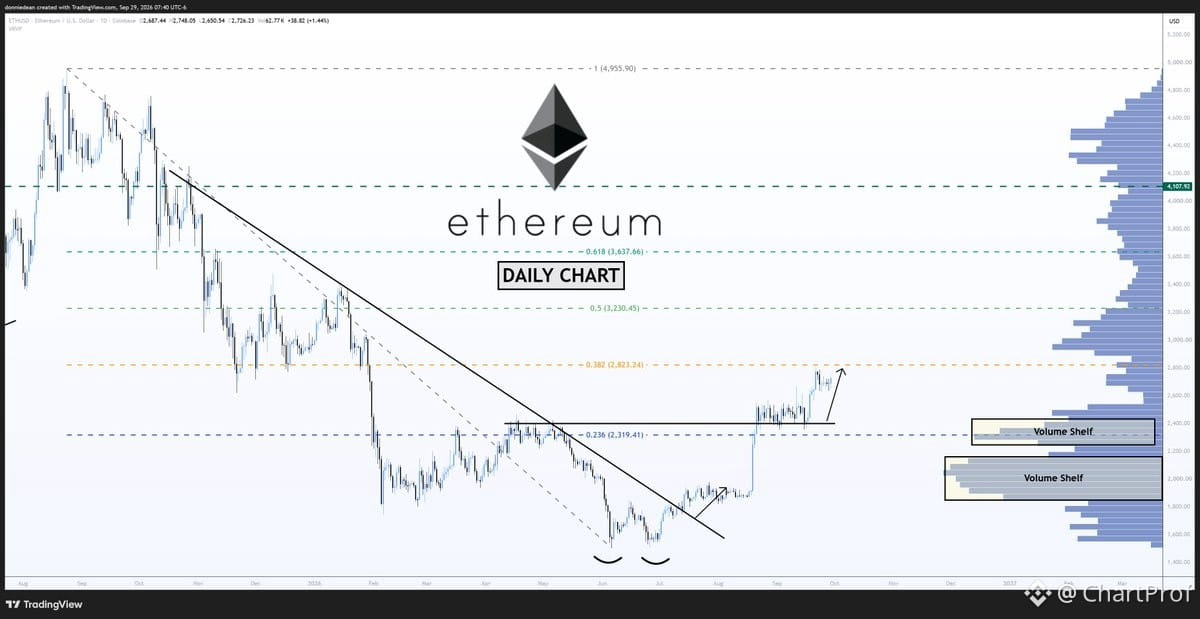
$A estrutura do $ETH é simples aqui — estamos abaixo de uma resistência em US$ 2,823, que é o primeiro teste. Esse é o seu nível de resistência imediato. Se o preço romper isso com volume e mantiver como suporte em um reteste, você terá confirmação para buscar níveis mais altos.
Próximos alvos em $3,230 e $3,638. O nível de $3,230 representa um movimento de 18,6% a partir do preço atual, enquanto $3,638 é uma extensão de 33,6% — ambas as projeções assumem que primeiro rompemos e mantemos acima de $2,823. Esses números não são aleatórios; são alvos estruturais baseados em zonas de resistência anteriores e em medidas.
A invalidação é simples: se o $ETH falhar em $2,823 e perder a mínima local, o cenário deixa de valer. Você está negociando o rompimento, não a esperança. Espere o nível romper, confirme a inversão e então gerencie o risco a partir daí. Sem adivinhação — deixe o gráfico te mostrar a estrutura e então aja.
$A estrutura do $ETH é simples aqui — estamos abaixo de uma resistência em US$ 2,823, que é o primeiro teste. Esse é o seu nível de resistência imediato. Se o preço romper isso com volume e mantiver como suporte em um reteste, você terá confirmação para buscar níveis mais altos.
Próximos alvos em $3,230 e $3,638. O nível de $3,230 representa um movimento de 18,6% a partir do preço atual, enquanto $3,638 é uma extensão de 33,6% — ambas as projeções assumem que primeiro rompemos e mantemos acima de $2,823. Esses números não são aleatórios; são alvos estruturais baseados em zonas de resistência anteriores e em medidas.
A invalidação é simples: se o $ETH falhar em $2,823 e perder a mínima local, o cenário deixa de valer. Você está negociando o rompimento, não a esperança. Espere o nível romper, confirme a inversão e então gerencie o risco a partir daí. Sem adivinhação — deixe o gráfico te mostrar a estrutura e então aja.
Próximos alvos em $3,230 e $3,638. O nível de $3,230 representa um movimento de 18,6% a partir do preço atual, enquanto $3,638 é uma extensão de 33,6% — ambas as projeções assumem que primeiro rompemos e mantemos acima de $2,823. Esses números não são aleatórios; são alvos estruturais baseados em zonas de resistência anteriores e em medidas.
A invalidação é simples: se o $ETH falhar em $2,823 e perder a mínima local, o cenário deixa de valer. Você está negociando o rompimento, não a esperança. Espere o nível romper, confirme a inversão e então gerencie o risco a partir daí. Sem adivinhação — deixe o gráfico te mostrar a estrutura e então aja.
36
·
--
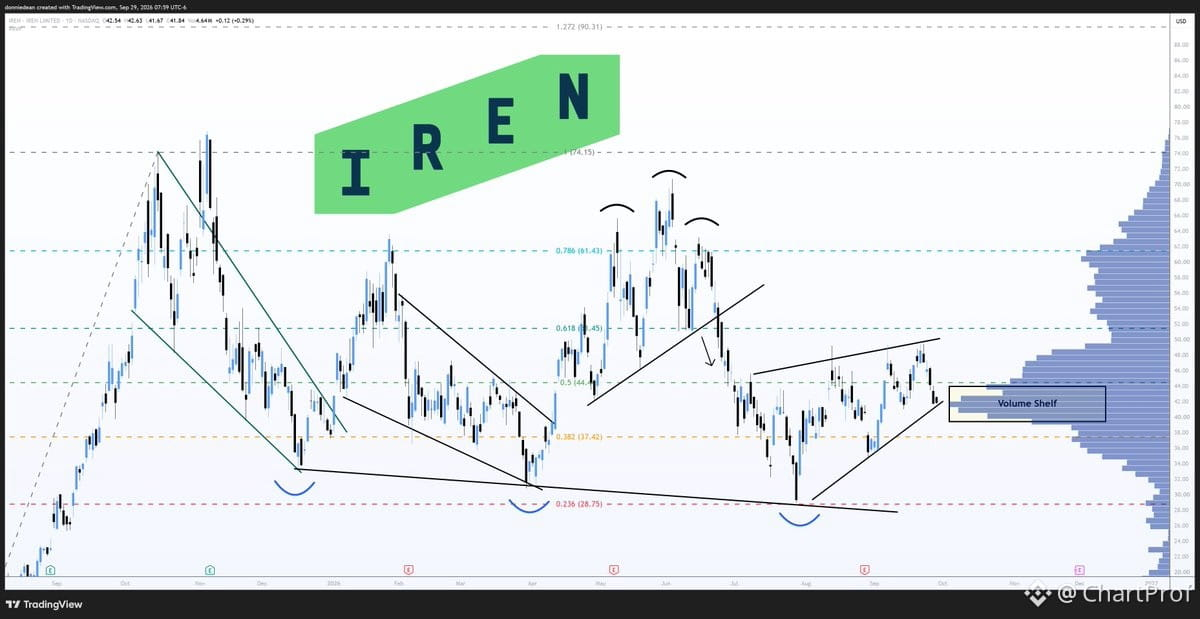
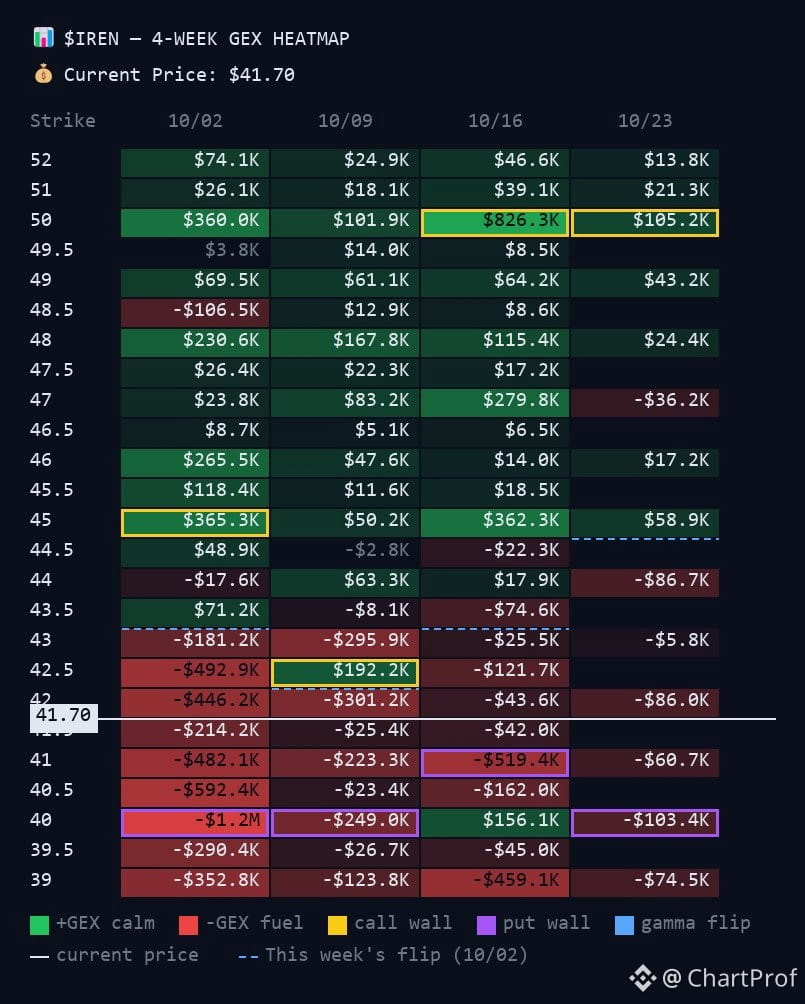
$IREN sentada bem na prateleira de volume e na linha de tendência em alta — um suporte clássico de livro-texto.
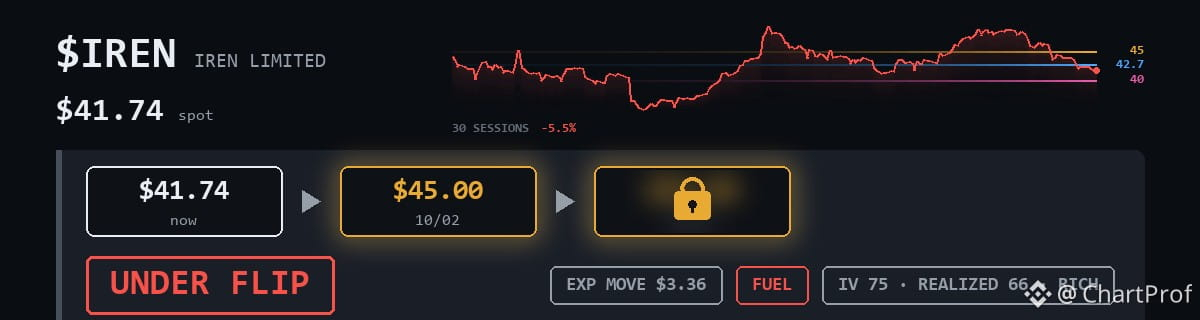
Atual: $41.74
Objetivo: $45.00 até 10/2
A estrutura é esta:
$40 é seu piso. É onde o volume construiu a base. Enquanto o preço se mantiver acima dele, você tem suporte estrutural.
A linha de tendência em alta adiciona um suporte dinâmico por baixo. Quando o preço se posiciona tanto sobre a prateleira de volume quanto sobre a linha, você tem confluência — dois motivos para os compradores defenderem.
Se $40 se mantiver, $45 é a primeira resistência lógica. Esse é seu primeiro destino.
A invalidação é simples: romper abaixo de $40 e o cenário acaba. Prateleira de volume rompida = sem base.
Setup limpo. Suporte em duas camadas. Alvo claro. Invalidação clara. É assim que você lê a estrutura.
$IREN sentada bem na prateleira de volume e na linha de tendência em alta — um suporte clássico de livro-texto.
Atual: $41.74
Objetivo: $45.00 até 10/2
A estrutura é esta:
$40 é seu piso. É onde o volume construiu a base. Enquanto o preço se mantiver acima dele, você tem suporte estrutural.
A linha de tendência em alta adiciona um suporte dinâmico por baixo. Quando o preço se posiciona tanto sobre a prateleira de volume quanto sobre a linha, você tem confluência — dois motivos para os compradores defenderem.
Se $40 se mantiver, $45 é a primeira resistência lógica. Esse é seu primeiro destino.
A invalidação é simples: romper abaixo de $40 e o cenário acaba. Prateleira de volume rompida = sem base.
Setup limpo. Suporte em duas camadas. Alvo claro. Invalidação clara. É assim que você lê a estrutura.
Atual: $41.74
Objetivo: $45.00 até 10/2
A estrutura é esta:
$40 é seu piso. É onde o volume construiu a base. Enquanto o preço se mantiver acima dele, você tem suporte estrutural.
A linha de tendência em alta adiciona um suporte dinâmico por baixo. Quando o preço se posiciona tanto sobre a prateleira de volume quanto sobre a linha, você tem confluência — dois motivos para os compradores defenderem.
Se $40 se mantiver, $45 é a primeira resistência lógica. Esse é seu primeiro destino.
A invalidação é simples: romper abaixo de $40 e o cenário acaba. Prateleira de volume rompida = sem base.
Setup limpo. Suporte em duas camadas. Alvo claro. Invalidação clara. É assim que você lê a estrutura.
94
·
--
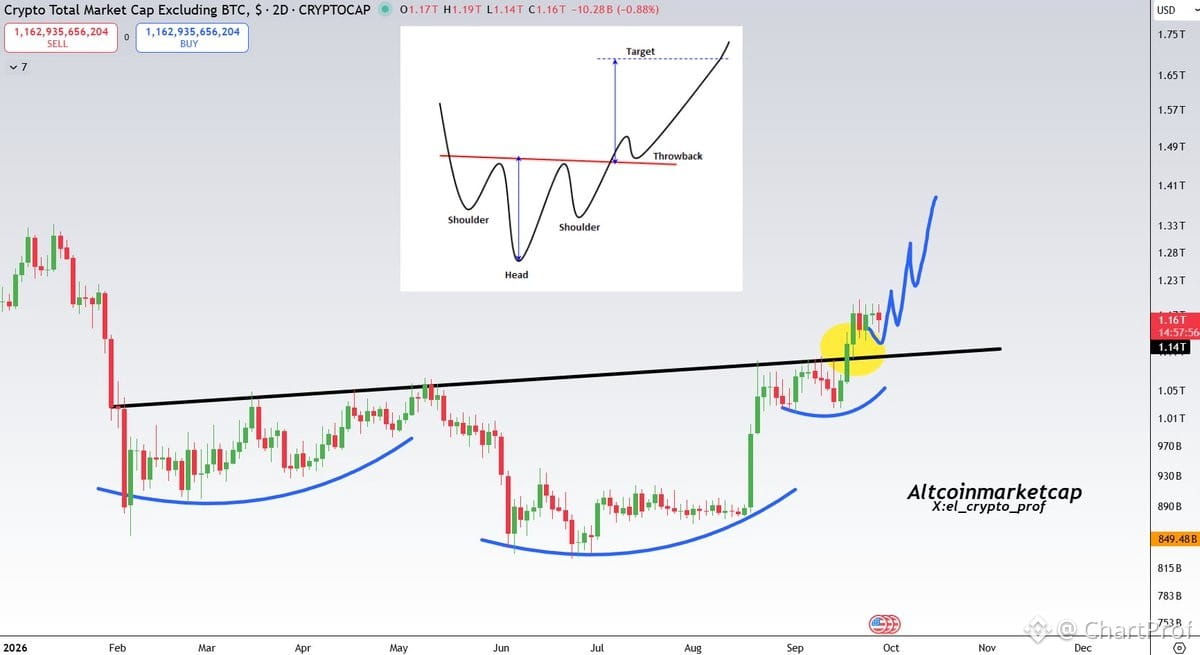
O TOTAL2 (capitalização do mercado de altcoins) acabou de romper uma inverse head-and-shoulders de 7 meses — uma estrutura clássica de reversão que sinaliza uma grande mudança de tendência.
Neste momento estamos em modo de consolidação, fazendo um reteste do nível de rompimento. Isso é comportamento típico após uma quebra de padrão — o preço precisa confirmar suporte onde antes havia resistência.
O que torna este setup bem limpo: o padrão levou 7 meses para se formar, então a base é sólida. Quanto mais longa a base, maior o potencial do rompimento.
O que observar: enquanto o TOTAL2 mantiver-se acima da linha do pescoço (neckline) neste reteste, a estrutura permanece intacta. Se ele recuperar e sustentar, essa é a confirmação para uma continuação mais alta.
Invalidação: uma quebra limpa de volta abaixo da neckline com impulso (momentum) destrói o setup.
Setups de altseason não ficam muito mais claros do que este. O reteste é o ponto em que você quer prestar atenção — não é correr atrás do impulso inicial, e sim esperar a estrutura se provar. Se aguentar, estamos olhando para um movimento bem maior entre as altcoins.
O TOTAL2 (capitalização do mercado de altcoins) acabou de romper uma inverse head-and-shoulders de 7 meses — uma estrutura clássica de reversão que sinaliza uma grande mudança de tendência.
Neste momento estamos em modo de consolidação, fazendo um reteste do nível de rompimento. Isso é comportamento típico após uma quebra de padrão — o preço precisa confirmar suporte onde antes havia resistência.
O que torna este setup bem limpo: o padrão levou 7 meses para se formar, então a base é sólida. Quanto mais longa a base, maior o potencial do rompimento.
O que observar: enquanto o TOTAL2 mantiver-se acima da linha do pescoço (neckline) neste reteste, a estrutura permanece intacta. Se ele recuperar e sustentar, essa é a confirmação para uma continuação mais alta.
Invalidação: uma quebra limpa de volta abaixo da neckline com impulso (momentum) destrói o setup.
Setups de altseason não ficam muito mais claros do que este. O reteste é o ponto em que você quer prestar atenção — não é correr atrás do impulso inicial, e sim esperar a estrutura se provar. Se aguentar, estamos olhando para um movimento bem maior entre as altcoins.
Neste momento estamos em modo de consolidação, fazendo um reteste do nível de rompimento. Isso é comportamento típico após uma quebra de padrão — o preço precisa confirmar suporte onde antes havia resistência.
O que torna este setup bem limpo: o padrão levou 7 meses para se formar, então a base é sólida. Quanto mais longa a base, maior o potencial do rompimento.
O que observar: enquanto o TOTAL2 mantiver-se acima da linha do pescoço (neckline) neste reteste, a estrutura permanece intacta. Se ele recuperar e sustentar, essa é a confirmação para uma continuação mais alta.
Invalidação: uma quebra limpa de volta abaixo da neckline com impulso (momentum) destrói o setup.
Setups de altseason não ficam muito mais claros do que este. O reteste é o ponto em que você quer prestar atenção — não é correr atrás do impulso inicial, e sim esperar a estrutura se provar. Se aguentar, estamos olhando para um movimento bem maior entre as altcoins.
189
·
--
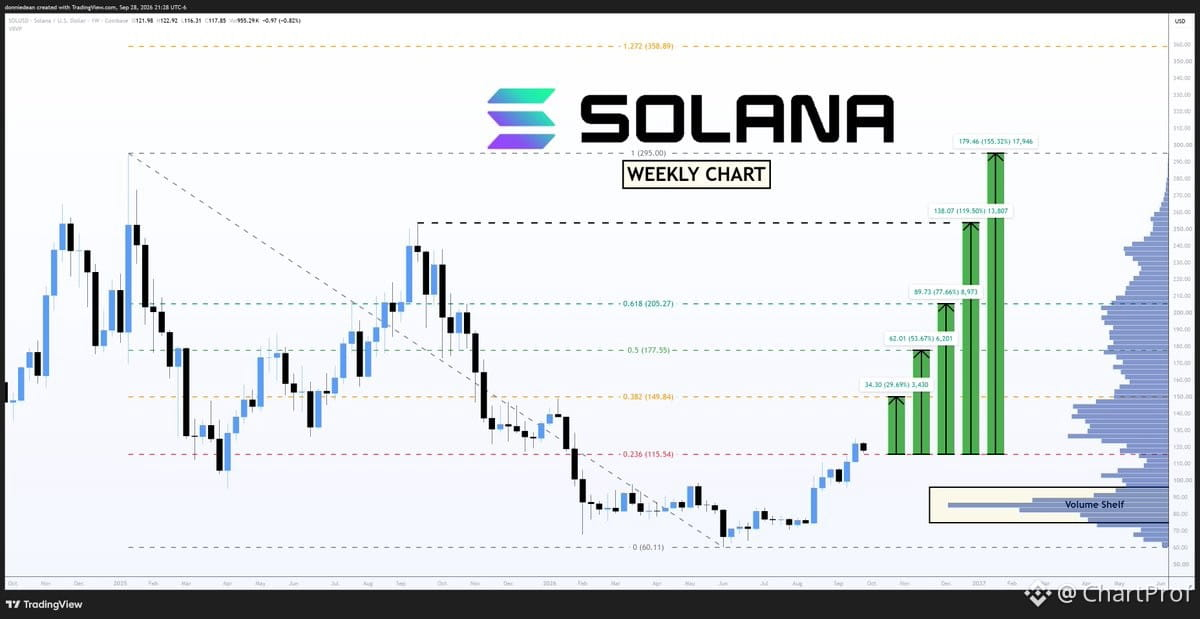
Gráfico semanal sobre $SOL — vamos dar um passo atrás e mapear a estrutura.
O preço está atualmente em uma consolidação em torno de $115, tentando confirmar isso como suporte. Este é o principal piso agora. Se ele se mantiver, temos uma base para trabalhar. Se romper, o cenário muda.
A próxima resistência relevante fica em $149,84 — isso representa um movimento limpo de +29% a partir dos níveis atuais. Esse é o seu alvo de alta se $115 segurar e o impulso ganhar força.
A configuração de trade aqui é direta:
• Suporte: $115 — precisa se manter para continuidade altista
• Alvo: $149,84 — próxima resistência estrutural
• Invalidação: Ruptura clara e fechamento abaixo de $115
Isso é trading clássico de nível a nível. Você está buscando confirmação no suporte e, depois, mirando a próxima zona de resistência. Sem adivinhação — apenas lendo os níveis que o gráfico está te mostrando.
Se $115 confirmar como suporte com volume e estrutura, o caminho até $149 se abre. Se falhar, você sai de cena e espera pela próxima configuração limpa. É assim que você se mantém alinhado com o gráfico.
Gráfico semanal sobre $SOL — vamos dar um passo atrás e mapear a estrutura.
O preço está atualmente em uma consolidação em torno de $115, tentando confirmar isso como suporte. Este é o principal piso agora. Se ele se mantiver, temos uma base para trabalhar. Se romper, o cenário muda.
A próxima resistência relevante fica em $149,84 — isso representa um movimento limpo de +29% a partir dos níveis atuais. Esse é o seu alvo de alta se $115 segurar e o impulso ganhar força.
A configuração de trade aqui é direta:
• Suporte: $115 — precisa se manter para continuidade altista
• Alvo: $149,84 — próxima resistência estrutural
• Invalidação: Ruptura clara e fechamento abaixo de $115
Isso é trading clássico de nível a nível. Você está buscando confirmação no suporte e, depois, mirando a próxima zona de resistência. Sem adivinhação — apenas lendo os níveis que o gráfico está te mostrando.
Se $115 confirmar como suporte com volume e estrutura, o caminho até $149 se abre. Se falhar, você sai de cena e espera pela próxima configuração limpa. É assim que você se mantém alinhado com o gráfico.
O preço está atualmente em uma consolidação em torno de $115, tentando confirmar isso como suporte. Este é o principal piso agora. Se ele se mantiver, temos uma base para trabalhar. Se romper, o cenário muda.
A próxima resistência relevante fica em $149,84 — isso representa um movimento limpo de +29% a partir dos níveis atuais. Esse é o seu alvo de alta se $115 segurar e o impulso ganhar força.
A configuração de trade aqui é direta:
• Suporte: $115 — precisa se manter para continuidade altista
• Alvo: $149,84 — próxima resistência estrutural
• Invalidação: Ruptura clara e fechamento abaixo de $115
Isso é trading clássico de nível a nível. Você está buscando confirmação no suporte e, depois, mirando a próxima zona de resistência. Sem adivinhação — apenas lendo os níveis que o gráfico está te mostrando.
Se $115 confirmar como suporte com volume e estrutura, o caminho até $149 se abre. Se falhar, você sai de cena e espera pela próxima configuração limpa. É assim que você se mantém alinhado com o gráfico.
258
·
--
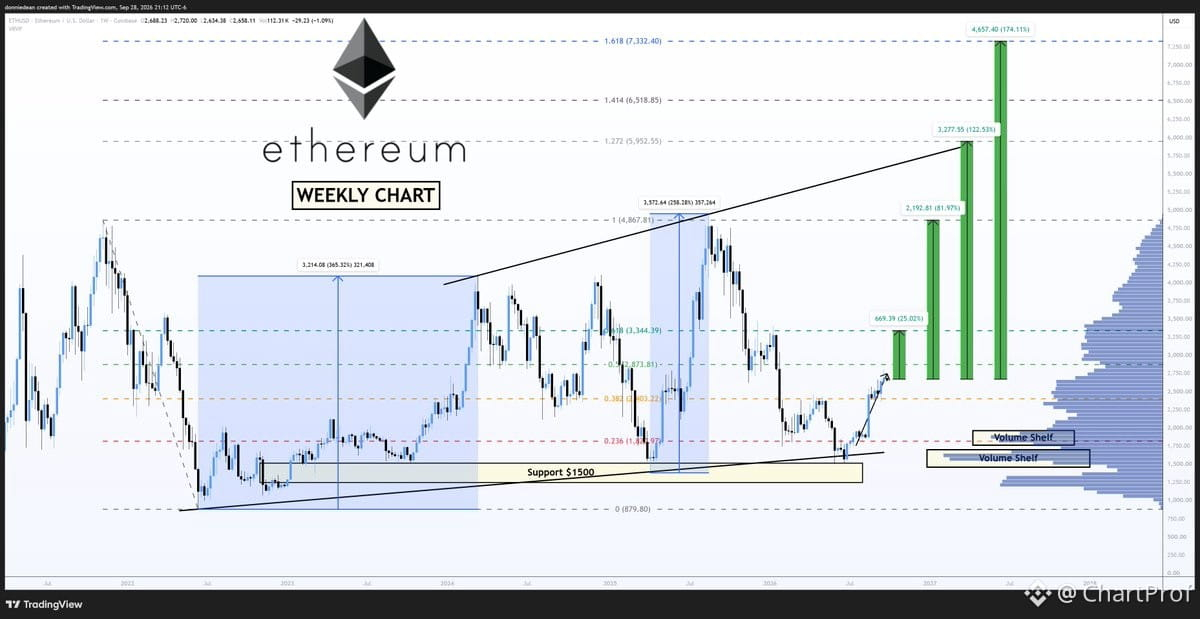
Vamos dar um zoom out no $ETH e ler a estrutura semanal — é aqui que a perspectiva importa.
Você tem três alvos claros de Fibonacci que enquadram o panorama maior:
$3,344 — a retração de 0.618. Este é o seu suporte estrutural se houver uma correção. Não é algo aleatório — é onde o swing macro encontra equilíbrio. Se o preço mantiver acima disso, a estrutura de alta continua intacta.
$4,867 — a extensão de 100%. Este é a primeira conclusão do movimento medido. Se o preço recuperar este nível, significa que toda a correção anterior foi totalmente retratada e a continuação foi confirmada. É o seu alvo-base para o próximo trecho.
$7,332 — a extensão da razão áurea 1.618. Esta é a sua projeção Fibonacci “de livro” para o próximo grande impulso. Não é esperança — é matemática. Se o momentum se mantiver e a estrutura confirmar, é aqui que o swing se completa.
O que importa: prazos semanais não mentem. Níveis como esses não são “chutes” — são derivados da estrutura do swing e da geometria de Fibonacci. O 0.618 é o seu piso de invalidação. O 100% é a confirmação de continuação. O 1.618 é o seu alvo se a tendência se estender.
Leia o gráfico como um mapa. Entenda onde você está, onde fica o suporte e para onde a estrutura projeta. É assim que você opera com convicção, em vez de reagir ao ruído.
Vamos dar um zoom out no $ETH e ler a estrutura semanal — é aqui que a perspectiva importa.
Você tem três alvos claros de Fibonacci que enquadram o panorama maior:
$3,344 — a retração de 0.618. Este é o seu suporte estrutural se houver uma correção. Não é algo aleatório — é onde o swing macro encontra equilíbrio. Se o preço mantiver acima disso, a estrutura de alta continua intacta.
$4,867 — a extensão de 100%. Este é a primeira conclusão do movimento medido. Se o preço recuperar este nível, significa que toda a correção anterior foi totalmente retratada e a continuação foi confirmada. É o seu alvo-base para o próximo trecho.
$7,332 — a extensão da razão áurea 1.618. Esta é a sua projeção Fibonacci “de livro” para o próximo grande impulso. Não é esperança — é matemática. Se o momentum se mantiver e a estrutura confirmar, é aqui que o swing se completa.
O que importa: prazos semanais não mentem. Níveis como esses não são “chutes” — são derivados da estrutura do swing e da geometria de Fibonacci. O 0.618 é o seu piso de invalidação. O 100% é a confirmação de continuação. O 1.618 é o seu alvo se a tendência se estender.
Leia o gráfico como um mapa. Entenda onde você está, onde fica o suporte e para onde a estrutura projeta. É assim que você opera com convicção, em vez de reagir ao ruído.
Você tem três alvos claros de Fibonacci que enquadram o panorama maior:
$3,344 — a retração de 0.618. Este é o seu suporte estrutural se houver uma correção. Não é algo aleatório — é onde o swing macro encontra equilíbrio. Se o preço mantiver acima disso, a estrutura de alta continua intacta.
$4,867 — a extensão de 100%. Este é a primeira conclusão do movimento medido. Se o preço recuperar este nível, significa que toda a correção anterior foi totalmente retratada e a continuação foi confirmada. É o seu alvo-base para o próximo trecho.
$7,332 — a extensão da razão áurea 1.618. Esta é a sua projeção Fibonacci “de livro” para o próximo grande impulso. Não é esperança — é matemática. Se o momentum se mantiver e a estrutura confirmar, é aqui que o swing se completa.
O que importa: prazos semanais não mentem. Níveis como esses não são “chutes” — são derivados da estrutura do swing e da geometria de Fibonacci. O 0.618 é o seu piso de invalidação. O 100% é a confirmação de continuação. O 1.618 é o seu alvo se a tendência se estender.
Leia o gráfico como um mapa. Entenda onde você está, onde fica o suporte e para onde a estrutura projeta. É assim que você opera com convicção, em vez de reagir ao ruído.
173
·
--
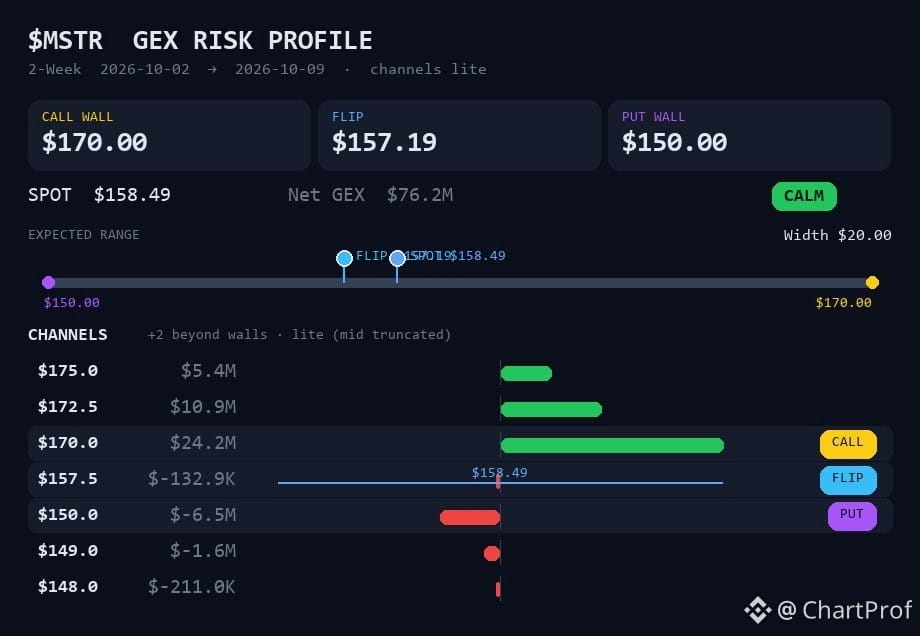
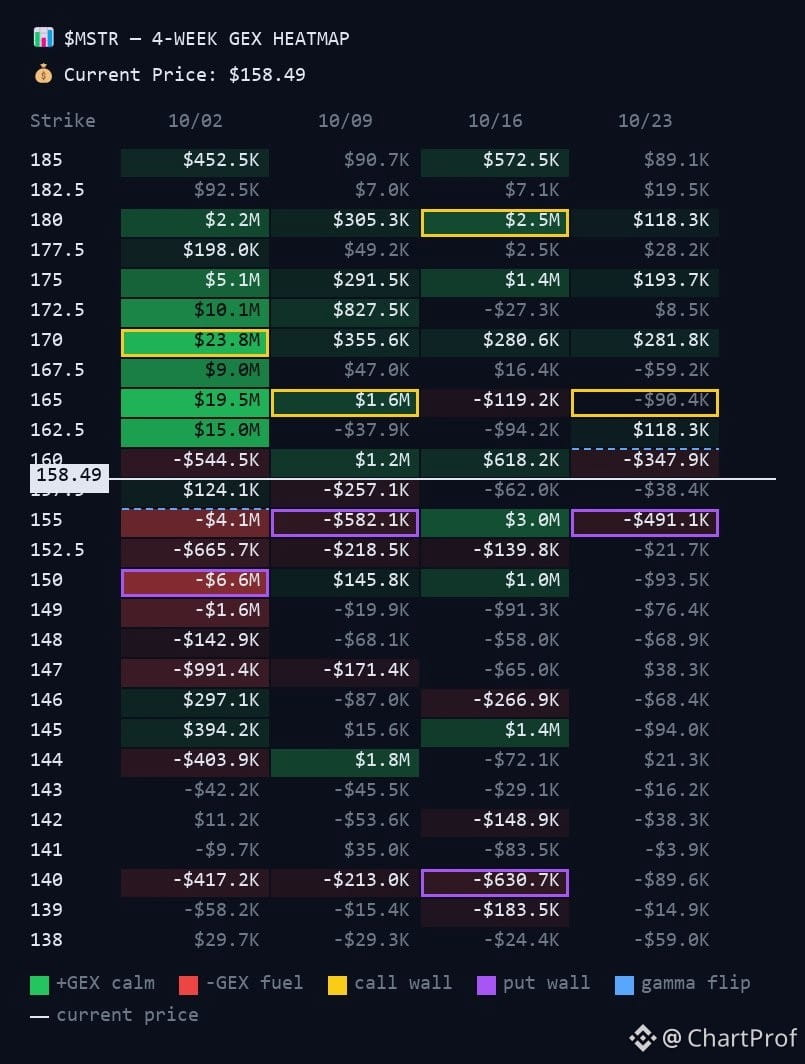
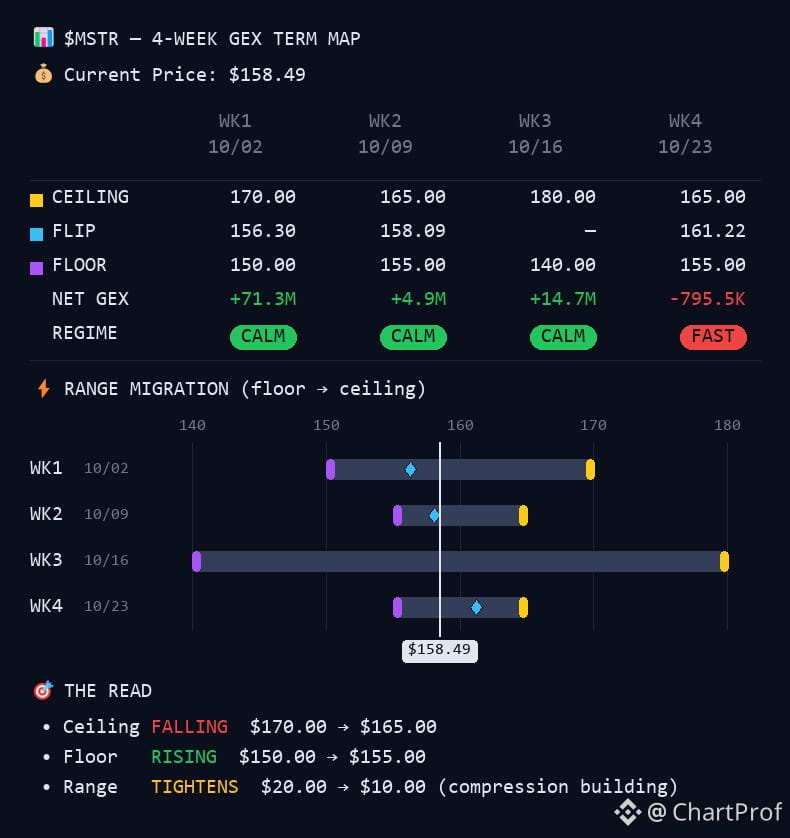
$MSTR operando em 158,49, logo acima da inversão gamma em 157,19. Vamos entender o que isso significa e por que importa.
A inversão é o ponto em que o comportamento de hedge do dealer muda. Acima da inversão, os market makers fazem hedge de um jeito que reduz a volatilidade — os movimentos tendem a ser mais calmos. Abaixo dela, o hedge amplifica os movimentos — o preço pode esticar mais forte em qualquer direção.
Agora, o preço está apenas 1,30 ponto acima da inversão. É uma “margem” fina. A própria inversão caiu de 158,21 antes, então a estrutura está se comprimindo.
Suas faixas:
- Muro de calls em 170: strike de call mais pesado, onde o hedge do dealer se apoia em altas. Esse é o seu teto.
- Muro de puts em 150: strike de put mais pesado, onde o hedge sustenta quedas. Esse é o seu piso.
Então a faixa é 150–170, e a inversão em 157,19 é o pivô dentro desse intervalo.
O cenário:
Manter acima de 157,19 → esperar ação mais calma, lateral, entre 150 e 170.
Perder 157,19 → esperar movimentos mais amplos e rápidos, provavelmente em direção ao piso 150.
157,19 é a sua linha. Observe como o preço respeita isso. Isso mostra se os dealers estão amortecendo ou amplificando o próximo movimento.
$MSTR operando em 158,49, logo acima da inversão gamma em 157,19. Vamos entender o que isso significa e por que importa.
A inversão é o ponto em que o comportamento de hedge do dealer muda. Acima da inversão, os market makers fazem hedge de um jeito que reduz a volatilidade — os movimentos tendem a ser mais calmos. Abaixo dela, o hedge amplifica os movimentos — o preço pode esticar mais forte em qualquer direção.
Agora, o preço está apenas 1,30 ponto acima da inversão. É uma “margem” fina. A própria inversão caiu de 158,21 antes, então a estrutura está se comprimindo.
Suas faixas:
- Muro de calls em 170: strike de call mais pesado, onde o hedge do dealer se apoia em altas. Esse é o seu teto.
- Muro de puts em 150: strike de put mais pesado, onde o hedge sustenta quedas. Esse é o seu piso.
Então a faixa é 150–170, e a inversão em 157,19 é o pivô dentro desse intervalo.
O cenário:
Manter acima de 157,19 → esperar ação mais calma, lateral, entre 150 e 170.
Perder 157,19 → esperar movimentos mais amplos e rápidos, provavelmente em direção ao piso 150.
157,19 é a sua linha. Observe como o preço respeita isso. Isso mostra se os dealers estão amortecendo ou amplificando o próximo movimento.
A inversão é o ponto em que o comportamento de hedge do dealer muda. Acima da inversão, os market makers fazem hedge de um jeito que reduz a volatilidade — os movimentos tendem a ser mais calmos. Abaixo dela, o hedge amplifica os movimentos — o preço pode esticar mais forte em qualquer direção.
Agora, o preço está apenas 1,30 ponto acima da inversão. É uma “margem” fina. A própria inversão caiu de 158,21 antes, então a estrutura está se comprimindo.
Suas faixas:
- Muro de calls em 170: strike de call mais pesado, onde o hedge do dealer se apoia em altas. Esse é o seu teto.
- Muro de puts em 150: strike de put mais pesado, onde o hedge sustenta quedas. Esse é o seu piso.
Então a faixa é 150–170, e a inversão em 157,19 é o pivô dentro desse intervalo.
O cenário:
Manter acima de 157,19 → esperar ação mais calma, lateral, entre 150 e 170.
Perder 157,19 → esperar movimentos mais amplos e rápidos, provavelmente em direção ao piso 150.
157,19 é a sua linha. Observe como o preço respeita isso. Isso mostra se os dealers estão amortecendo ou amplificando o próximo movimento.
60
·
--
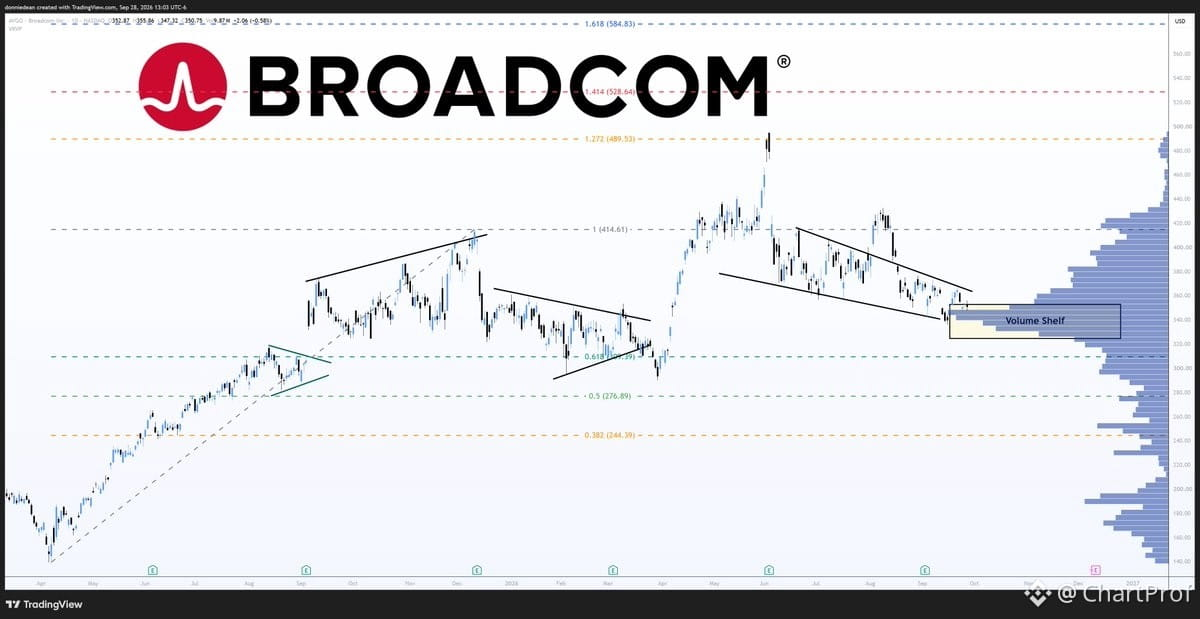
$AVGO sentado em $351 — logo acima da região de $350 put wall que está funcionando como o piso aqui.
Primeira resistência é a chamada $360 call wall. Rompa isso de forma limpa e você estará mirando $375, que funciona como teto até 9 de outubro.
A invalidação é simples: perder $350 e a configuração se quebra. Em termos de estrutura, ainda estamos dentro de uma ampla faixa de $300–$400, então isso é, na prática, um teste da borda inferior do intervalo de curto prazo.
Observe $350 como suporte, $360 como o primeiro nível de rompimento e $375 como o próximo alvo lógico se o momentum continuar.
$AVGO sentado em $351 — logo acima da região de $350 put wall que está funcionando como o piso aqui.
Primeira resistência é a chamada $360 call wall. Rompa isso de forma limpa e você estará mirando $375, que funciona como teto até 9 de outubro.
A invalidação é simples: perder $350 e a configuração se quebra. Em termos de estrutura, ainda estamos dentro de uma ampla faixa de $300–$400, então isso é, na prática, um teste da borda inferior do intervalo de curto prazo.
Observe $350 como suporte, $360 como o primeiro nível de rompimento e $375 como o próximo alvo lógico se o momentum continuar.
Primeira resistência é a chamada $360 call wall. Rompa isso de forma limpa e você estará mirando $375, que funciona como teto até 9 de outubro.
A invalidação é simples: perder $350 e a configuração se quebra. Em termos de estrutura, ainda estamos dentro de uma ampla faixa de $300–$400, então isso é, na prática, um teste da borda inferior do intervalo de curto prazo.
Observe $350 como suporte, $360 como o primeiro nível de rompimento e $375 como o próximo alvo lógico se o momentum continuar.
39
·
--
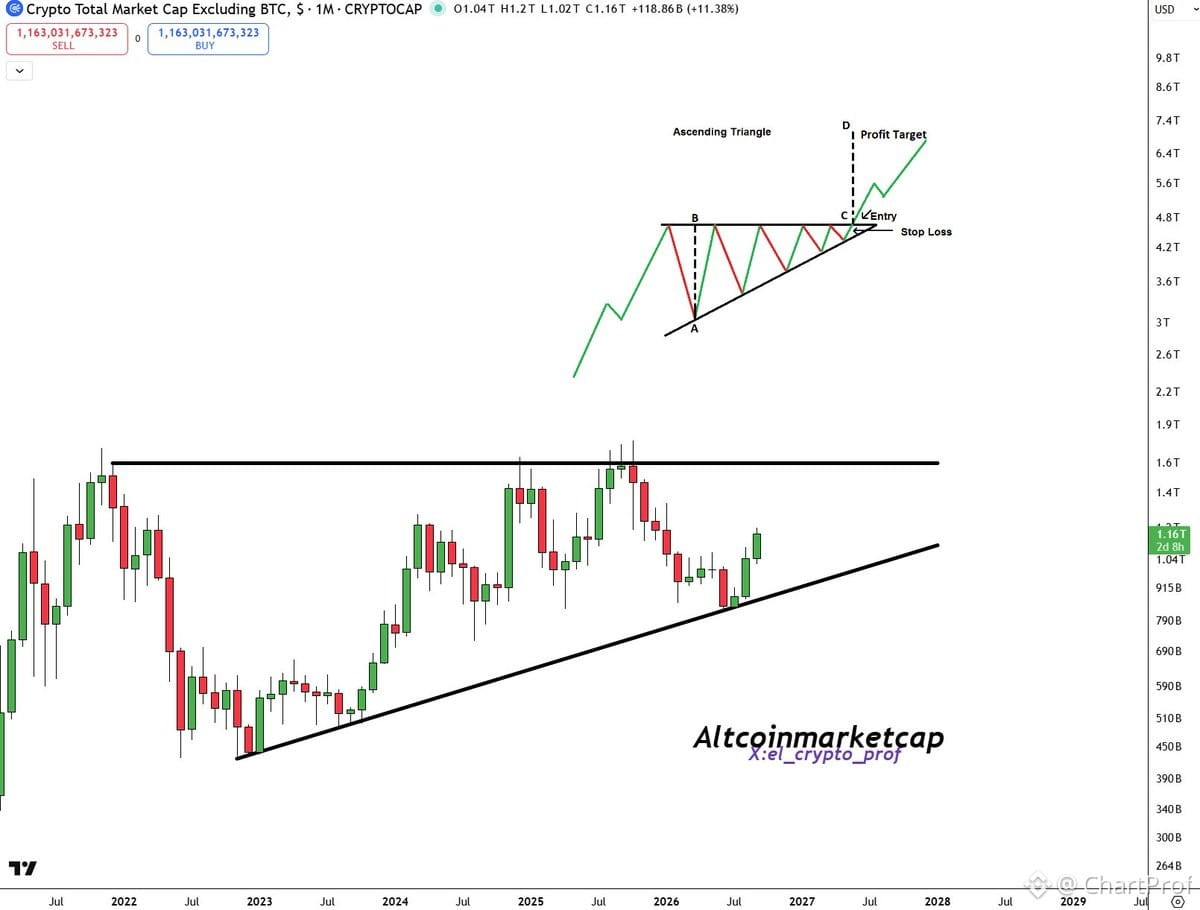
Vamos analisar a estrutura do mercado de altcoins porque este é um cenário de livro-texto que você precisa entender.
TOTAL2 — ou seja, todo o market cap do mercado de altcoins excluindo o $BTC — vem esculpindo um enorme triângulo ascendente há quase cinco anos. Isto não é ruído. É acumulação em escala.
Veja o que importa:
Triângulos ascendentes são padrões de continuação. Mínimos mais altos mostram compradores entrando com mais convicção a cada ciclo. A resistência horizontal no topo? É onde a oferta vem limitando o preço repetidamente. Quando isso finalmente rompe, você tem expansão — rápida.
Estamos bem agora no ápice. Quanto mais longo o tempo de formação de um padrão, mais violento tende a ser o rompimento. Cinco anos de compressão significam energia considerável armazenada nessa estrutura.
O que confirma o rompimento? Um fechamento semanal acima da resistência com volume. O que elimina essa tese? Uma quebra abaixo do suporte da linha de tendência ascendente — isso invalida todo o argumento.
Isto não é “hopium”. É estrutura. O gráfico está te mostrando que as altcoins vêm construindo uma plataforma de lançamento, não morrendo. Quando isso romper, o movimento será proporcional ao tempo que levou para construir.
Observe os níveis. Respeite a estrutura. E entenda o que você está vendo antes que o mercado te ensine do jeito mais difícil.
Vamos analisar a estrutura do mercado de altcoins porque este é um cenário de livro-texto que você precisa entender.
TOTAL2 — ou seja, todo o market cap do mercado de altcoins excluindo o $BTC — vem esculpindo um enorme triângulo ascendente há quase cinco anos. Isto não é ruído. É acumulação em escala.
Veja o que importa:
Triângulos ascendentes são padrões de continuação. Mínimos mais altos mostram compradores entrando com mais convicção a cada ciclo. A resistência horizontal no topo? É onde a oferta vem limitando o preço repetidamente. Quando isso finalmente rompe, você tem expansão — rápida.
Estamos bem agora no ápice. Quanto mais longo o tempo de formação de um padrão, mais violento tende a ser o rompimento. Cinco anos de compressão significam energia considerável armazenada nessa estrutura.
O que confirma o rompimento? Um fechamento semanal acima da resistência com volume. O que elimina essa tese? Uma quebra abaixo do suporte da linha de tendência ascendente — isso invalida todo o argumento.
Isto não é “hopium”. É estrutura. O gráfico está te mostrando que as altcoins vêm construindo uma plataforma de lançamento, não morrendo. Quando isso romper, o movimento será proporcional ao tempo que levou para construir.
Observe os níveis. Respeite a estrutura. E entenda o que você está vendo antes que o mercado te ensine do jeito mais difícil.
TOTAL2 — ou seja, todo o market cap do mercado de altcoins excluindo o $BTC — vem esculpindo um enorme triângulo ascendente há quase cinco anos. Isto não é ruído. É acumulação em escala.
Veja o que importa:
Triângulos ascendentes são padrões de continuação. Mínimos mais altos mostram compradores entrando com mais convicção a cada ciclo. A resistência horizontal no topo? É onde a oferta vem limitando o preço repetidamente. Quando isso finalmente rompe, você tem expansão — rápida.
Estamos bem agora no ápice. Quanto mais longo o tempo de formação de um padrão, mais violento tende a ser o rompimento. Cinco anos de compressão significam energia considerável armazenada nessa estrutura.
O que confirma o rompimento? Um fechamento semanal acima da resistência com volume. O que elimina essa tese? Uma quebra abaixo do suporte da linha de tendência ascendente — isso invalida todo o argumento.
Isto não é “hopium”. É estrutura. O gráfico está te mostrando que as altcoins vêm construindo uma plataforma de lançamento, não morrendo. Quando isso romper, o movimento será proporcional ao tempo que levou para construir.
Observe os níveis. Respeite a estrutura. E entenda o que você está vendo antes que o mercado te ensine do jeito mais difícil.
230
·
--
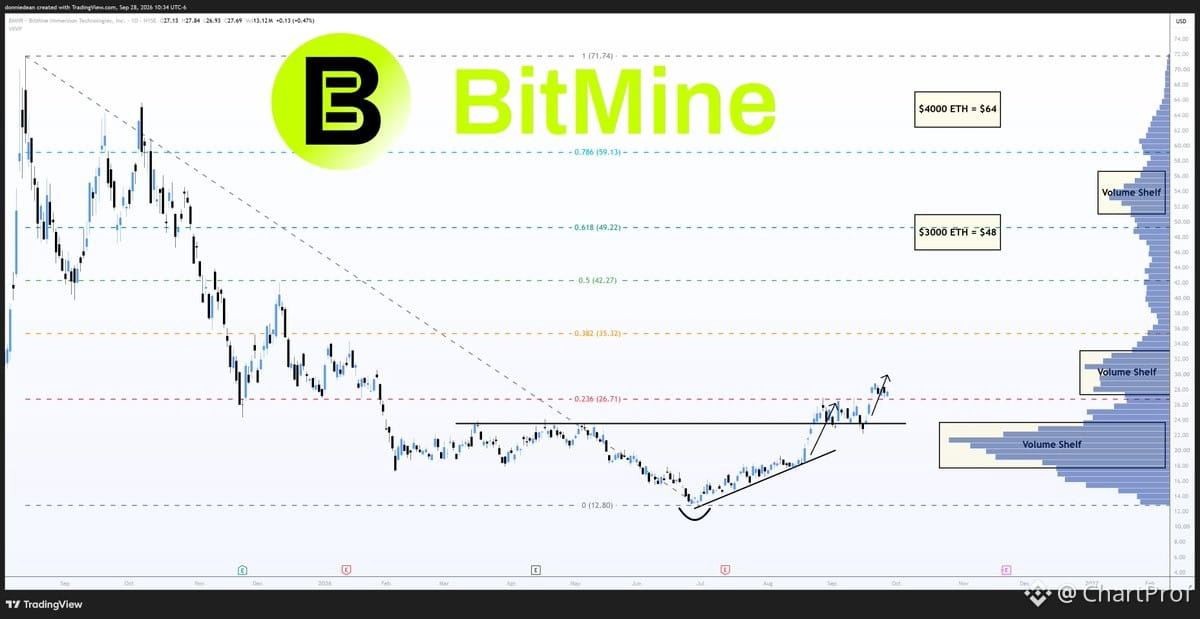
$BMNR BitMine mantém-se limpo acima da base após rompimento.
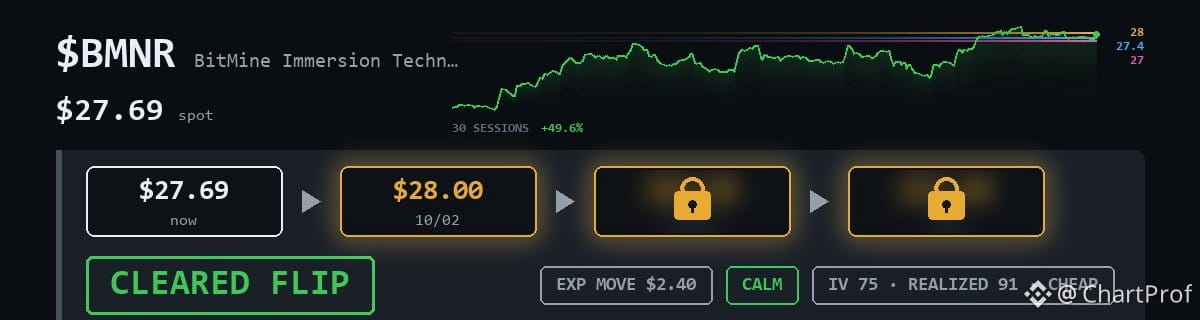
O preço saiu de $27.69 em direção a $28 — alta de 49,6% em 30 sessões. Rompeu acima da base de $23.50, retestou a estrutura e recuperou a fib de 0.236 em $26.71. É aí que está a sua confirmação.
$28 é o primeiro alvo. Se passar por isso, você deve observar continuação para fibs mais altas. Se perder $26.71, a estrutura do rompimento enfraquece e você reavalia.
Isso é base e reteste “de manual”. Rompimento, pullback para a estrutura, manutenção e depois continuação. O reteste é o que separa movimentos reais de fakeouts. O BMNR fez o trabalho — agora é sobre a continuidade acima de $28 ou a rejeição voltando para a faixa.
$BMNR BitMine mantém-se limpo acima da base após rompimento.
O preço saiu de $27.69 em direção a $28 — alta de 49,6% em 30 sessões. Rompeu acima da base de $23.50, retestou a estrutura e recuperou a fib de 0.236 em $26.71. É aí que está a sua confirmação.
$28 é o primeiro alvo. Se passar por isso, você deve observar continuação para fibs mais altas. Se perder $26.71, a estrutura do rompimento enfraquece e você reavalia.
Isso é base e reteste “de manual”. Rompimento, pullback para a estrutura, manutenção e depois continuação. O reteste é o que separa movimentos reais de fakeouts. O BMNR fez o trabalho — agora é sobre a continuidade acima de $28 ou a rejeição voltando para a faixa.
O preço saiu de $27.69 em direção a $28 — alta de 49,6% em 30 sessões. Rompeu acima da base de $23.50, retestou a estrutura e recuperou a fib de 0.236 em $26.71. É aí que está a sua confirmação.
$28 é o primeiro alvo. Se passar por isso, você deve observar continuação para fibs mais altas. Se perder $26.71, a estrutura do rompimento enfraquece e você reavalia.
Isso é base e reteste “de manual”. Rompimento, pullback para a estrutura, manutenção e depois continuação. O reteste é o que separa movimentos reais de fakeouts. O BMNR fez o trabalho — agora é sobre a continuidade acima de $28 ou a rejeição voltando para a faixa.
31
·
--
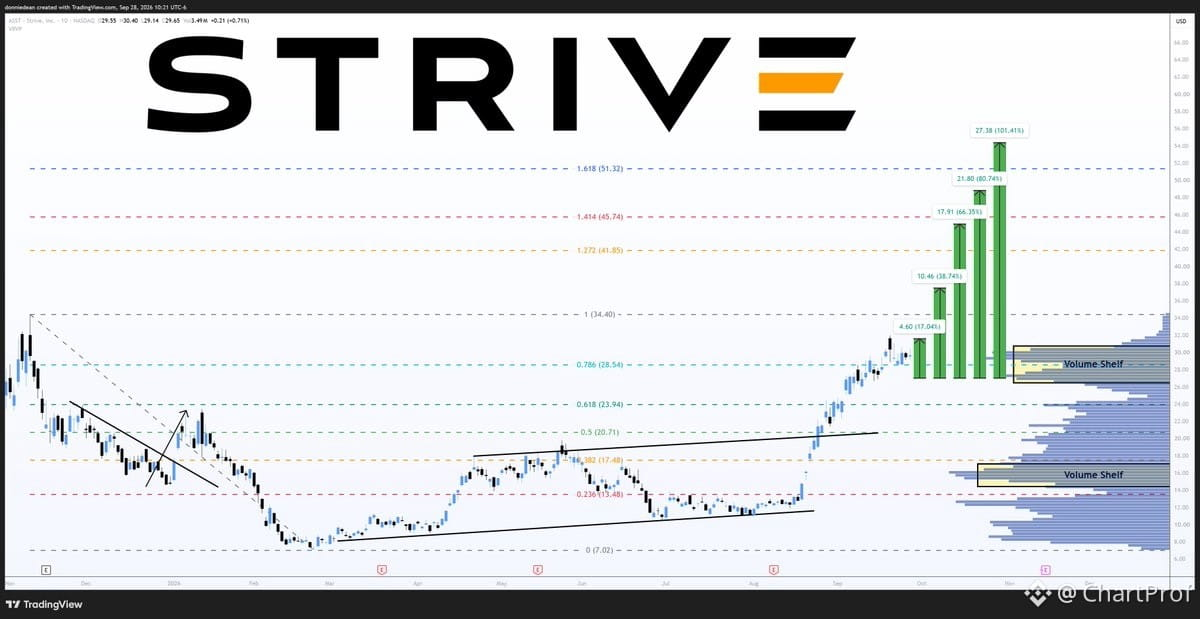
$ASST — A fuga do canal de Strive está se mantendo.
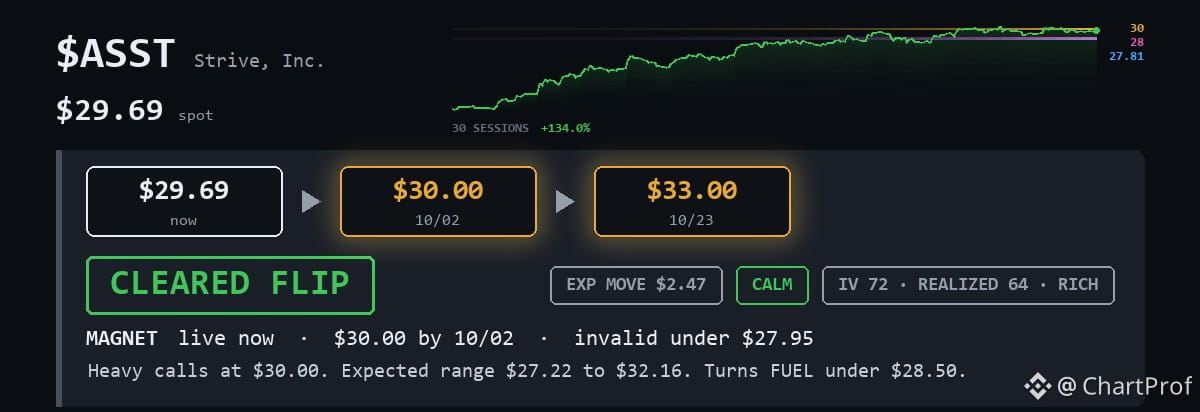
O preço saiu de $29.69, agora mirando $30 como o próximo ímã e depois $33.
Subiu 134% em 30 sessões. Rompeu seu canal de alta em agosto e está acima do fib 0,786 em $28,54 — esse é o seu piso estrutural.
Contexto: a Strive tem US$700M+ em warrants exercidos a $27, vencendo em meados de outubro. O preço está acima deles, então isso já ficou para trás.
$30 é o nível imediato. Depois disso, o fib 1,0 em $34,40 — a máxima de novembro — é o próximo alvo estrutural.
O setup está limpo: rompimento confirmado, fib segurando, warrants resolvidos. Observe $28,54 como sua invalidação. Acima de $30, você mira $33–$34,40.
$ASST — A fuga do canal de Strive está se mantendo.
O preço saiu de $29.69, agora mirando $30 como o próximo ímã e depois $33.
Subiu 134% em 30 sessões. Rompeu seu canal de alta em agosto e está acima do fib 0,786 em $28,54 — esse é o seu piso estrutural.
Contexto: a Strive tem US$700M+ em warrants exercidos a $27, vencendo em meados de outubro. O preço está acima deles, então isso já ficou para trás.
$30 é o nível imediato. Depois disso, o fib 1,0 em $34,40 — a máxima de novembro — é o próximo alvo estrutural.
O setup está limpo: rompimento confirmado, fib segurando, warrants resolvidos. Observe $28,54 como sua invalidação. Acima de $30, você mira $33–$34,40.
O preço saiu de $29.69, agora mirando $30 como o próximo ímã e depois $33.
Subiu 134% em 30 sessões. Rompeu seu canal de alta em agosto e está acima do fib 0,786 em $28,54 — esse é o seu piso estrutural.
Contexto: a Strive tem US$700M+ em warrants exercidos a $27, vencendo em meados de outubro. O preço está acima deles, então isso já ficou para trás.
$30 é o nível imediato. Depois disso, o fib 1,0 em $34,40 — a máxima de novembro — é o próximo alvo estrutural.
O setup está limpo: rompimento confirmado, fib segurando, warrants resolvidos. Observe $28,54 como sua invalidação. Acima de $30, você mira $33–$34,40.
57
·
--
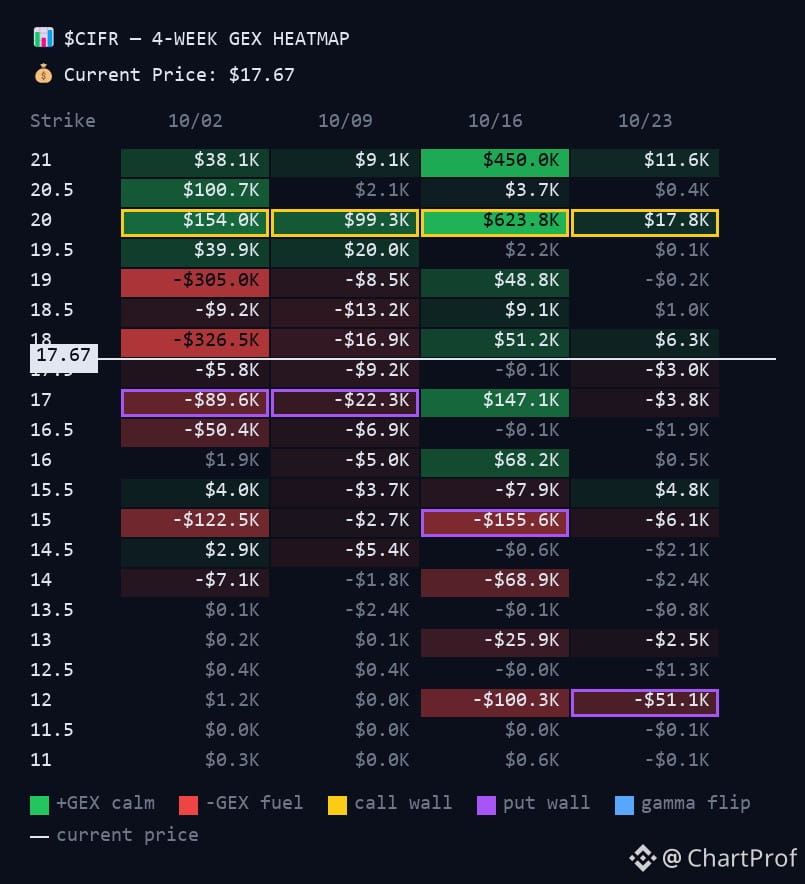
$CIFR deslizou para baixo de $17 esta manhã — ficando em $16.86. Ainda não é uma ruptura limpa, apenas alguns centavos abaixo da base da estrutura de sexta-feira.
Aqui está o mapa:
$20.00 — teto
$17.59 — o gatilho
$17.00 — o piso
$16.86 — preço atual
Primeira tarefa: recuperar $17. Abaixo de $17.59, você está em FUEL — os movimentos acontecem mais rápido em ambos os sentidos. Acima disso, as mesas entram e amortecem a ação.
Fique atento a uma recuperação acima de $17 ou a uma descarga mais profunda se não conseguir sustentar. A estrutura está clara — negocie o que confirma.
$CIFR deslizou para baixo de $17 esta manhã — ficando em $16.86. Ainda não é uma ruptura limpa, apenas alguns centavos abaixo da base da estrutura de sexta-feira.
Aqui está o mapa:
$20.00 — teto
$17.59 — o gatilho
$17.00 — o piso
$16.86 — preço atual
Primeira tarefa: recuperar $17. Abaixo de $17.59, você está em FUEL — os movimentos acontecem mais rápido em ambos os sentidos. Acima disso, as mesas entram e amortecem a ação.
Fique atento a uma recuperação acima de $17 ou a uma descarga mais profunda se não conseguir sustentar. A estrutura está clara — negocie o que confirma.
Aqui está o mapa:
$20.00 — teto
$17.59 — o gatilho
$17.00 — o piso
$16.86 — preço atual
Primeira tarefa: recuperar $17. Abaixo de $17.59, você está em FUEL — os movimentos acontecem mais rápido em ambos os sentidos. Acima disso, as mesas entram e amortecem a ação.
Fique atento a uma recuperação acima de $17 ou a uma descarga mais profunda se não conseguir sustentar. A estrutura está clara — negocie o que confirma.
143
·
--
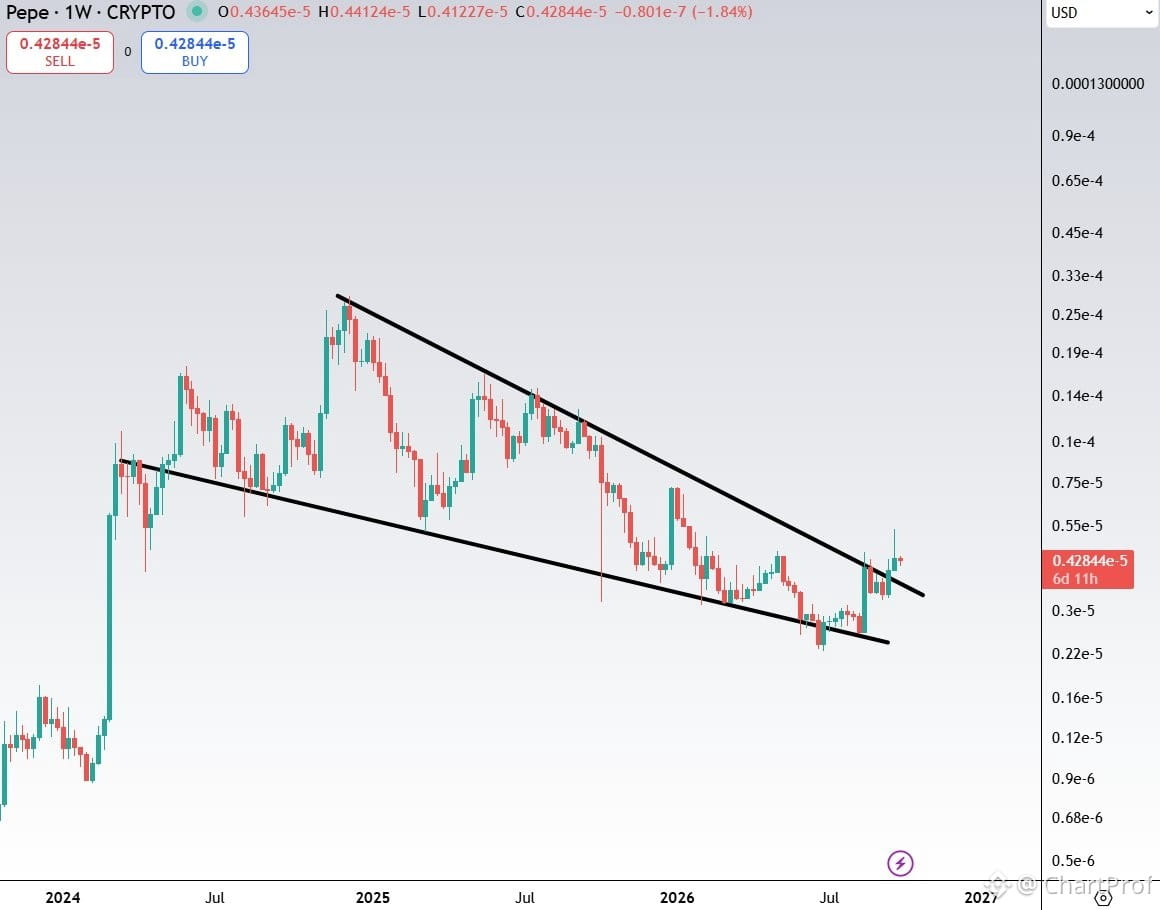
$PEPE acabou de sair de um wedge de baixa de 2,5 anos — uma estrutura bullish clássica em prazos mais altos.
Vamos entender o que isso significa:
Um wedge de baixa é um padrão de compressão em que o preço faz topos mais baixos e fundos mais baixos, mas a faixa vai se estreitando ao longo do tempo. Normalmente é uma configuração de continuação ou de reversão, dependendo do contexto. Aqui, após 2,5 anos de contração, o rompimento sugere que a acumulação terminou e que os compradores estão entrando com convicção.
O que confirma: Rompimento limpo acima da linha de tendência superior com volume. Se ele se mantiver acima da resistência do wedge numa retestagem, essa é a primeira confirmação. Observe a resistência antiga virar suporte.
O que invalida: Uma rejeição forte de volta para dentro do wedge, especialmente com volume. Se o preço não conseguir se manter acima do rompimento, a estrutura falha e você volta à compressão.
Isso faz parte de um tema mais amplo — muitos alts estão montando estruturas bem definidas em prazos mais altos agora. Wedges, bases, consolidações de vários meses que começam a se resolver. $PEPE é apenas um exemplo do que acontece quando estrutura encontra timing.
A configuração está lá. Agora é hora de observar a continuidade.
$PEPE acabou de sair de um wedge de baixa de 2,5 anos — uma estrutura bullish clássica em prazos mais altos.
Vamos entender o que isso significa:
Um wedge de baixa é um padrão de compressão em que o preço faz topos mais baixos e fundos mais baixos, mas a faixa vai se estreitando ao longo do tempo. Normalmente é uma configuração de continuação ou de reversão, dependendo do contexto. Aqui, após 2,5 anos de contração, o rompimento sugere que a acumulação terminou e que os compradores estão entrando com convicção.
O que confirma: Rompimento limpo acima da linha de tendência superior com volume. Se ele se mantiver acima da resistência do wedge numa retestagem, essa é a primeira confirmação. Observe a resistência antiga virar suporte.
O que invalida: Uma rejeição forte de volta para dentro do wedge, especialmente com volume. Se o preço não conseguir se manter acima do rompimento, a estrutura falha e você volta à compressão.
Isso faz parte de um tema mais amplo — muitos alts estão montando estruturas bem definidas em prazos mais altos agora. Wedges, bases, consolidações de vários meses que começam a se resolver. $PEPE é apenas um exemplo do que acontece quando estrutura encontra timing.
A configuração está lá. Agora é hora de observar a continuidade.
Vamos entender o que isso significa:
Um wedge de baixa é um padrão de compressão em que o preço faz topos mais baixos e fundos mais baixos, mas a faixa vai se estreitando ao longo do tempo. Normalmente é uma configuração de continuação ou de reversão, dependendo do contexto. Aqui, após 2,5 anos de contração, o rompimento sugere que a acumulação terminou e que os compradores estão entrando com convicção.
O que confirma: Rompimento limpo acima da linha de tendência superior com volume. Se ele se mantiver acima da resistência do wedge numa retestagem, essa é a primeira confirmação. Observe a resistência antiga virar suporte.
O que invalida: Uma rejeição forte de volta para dentro do wedge, especialmente com volume. Se o preço não conseguir se manter acima do rompimento, a estrutura falha e você volta à compressão.
Isso faz parte de um tema mais amplo — muitos alts estão montando estruturas bem definidas em prazos mais altos agora. Wedges, bases, consolidações de vários meses que começam a se resolver. $PEPE é apenas um exemplo do que acontece quando estrutura encontra timing.
A configuração está lá. Agora é hora de observar a continuidade.
540
·
--
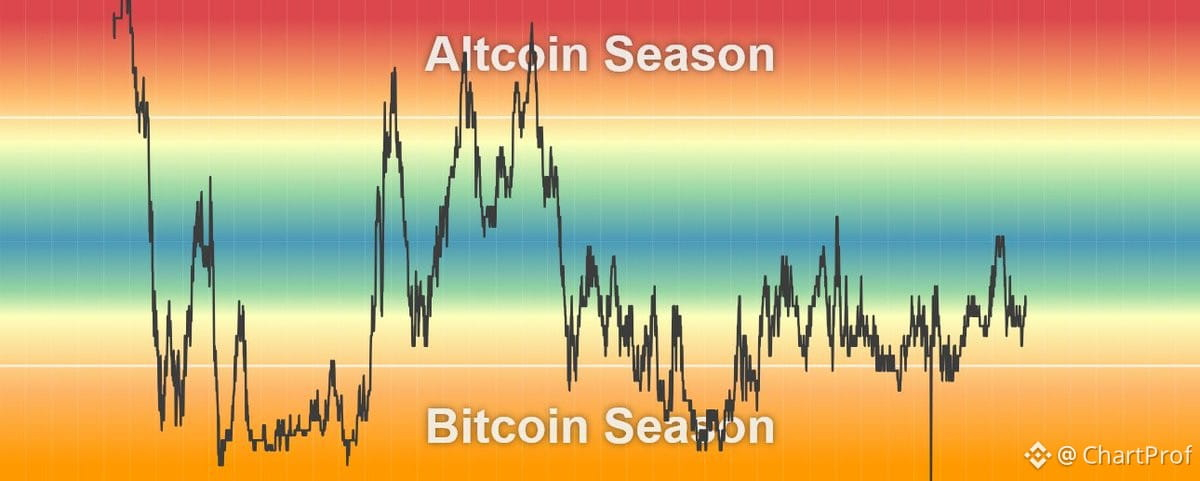
Vamos ler o Altcoin Season Index como um gráfico.
Agora estamos entrando na fase em que o $BTC sobe, mas as alts começam a acelerar com mais força — estrutura clássica de rotação. O roteiro de 2017: Bitcoin lidera, e as alts seguem com alavancagem.
O Altcoin Season Index mede quantos dos 50 principais ativos superam o $BTC ao longo de 90 dias. Quando está baixo, o Bitcoin domina. Quando sobe, as alts assumem. E agora? Ainda há bastante espaço para subir mais.
O que isso significa para suas estratégias:
$BTC ainda precisa manter a estrutura — é o ponto de ancoragem. Mas se você estiver posicionado em alts limpas, com rompimentos confirmados, este é o ambiente em que elas multiplicam mais rápido do que o Bitcoin.
Fique de olho nas zonas de consolidação do $BTC. É quando as alts explodem com mais força. Se o $BTC começar a negociar de lado depois de um movimento de alta, esse é o seu sinal para apostar no momentum das altcoins.
Invalidade: Se o índice virar cedo ou se o $BTC perder um suporte importante, as alts são esmagadas mais rápido do que subiram. A gestão de risco continua rigorosa.
Isso não é hype — é estrutura. O índice confirma o que o gráfico já está mostrando. As alts estão acordando.
Vamos ler o Altcoin Season Index como um gráfico.
Agora estamos entrando na fase em que o $BTC sobe, mas as alts começam a acelerar com mais força — estrutura clássica de rotação. O roteiro de 2017: Bitcoin lidera, e as alts seguem com alavancagem.
O Altcoin Season Index mede quantos dos 50 principais ativos superam o $BTC ao longo de 90 dias. Quando está baixo, o Bitcoin domina. Quando sobe, as alts assumem. E agora? Ainda há bastante espaço para subir mais.
O que isso significa para suas estratégias:
$BTC ainda precisa manter a estrutura — é o ponto de ancoragem. Mas se você estiver posicionado em alts limpas, com rompimentos confirmados, este é o ambiente em que elas multiplicam mais rápido do que o Bitcoin.
Fique de olho nas zonas de consolidação do $BTC. É quando as alts explodem com mais força. Se o $BTC começar a negociar de lado depois de um movimento de alta, esse é o seu sinal para apostar no momentum das altcoins.
Invalidade: Se o índice virar cedo ou se o $BTC perder um suporte importante, as alts são esmagadas mais rápido do que subiram. A gestão de risco continua rigorosa.
Isso não é hype — é estrutura. O índice confirma o que o gráfico já está mostrando. As alts estão acordando.
Agora estamos entrando na fase em que o $BTC sobe, mas as alts começam a acelerar com mais força — estrutura clássica de rotação. O roteiro de 2017: Bitcoin lidera, e as alts seguem com alavancagem.
O Altcoin Season Index mede quantos dos 50 principais ativos superam o $BTC ao longo de 90 dias. Quando está baixo, o Bitcoin domina. Quando sobe, as alts assumem. E agora? Ainda há bastante espaço para subir mais.
O que isso significa para suas estratégias:
$BTC ainda precisa manter a estrutura — é o ponto de ancoragem. Mas se você estiver posicionado em alts limpas, com rompimentos confirmados, este é o ambiente em que elas multiplicam mais rápido do que o Bitcoin.
Fique de olho nas zonas de consolidação do $BTC. É quando as alts explodem com mais força. Se o $BTC começar a negociar de lado depois de um movimento de alta, esse é o seu sinal para apostar no momentum das altcoins.
Invalidade: Se o índice virar cedo ou se o $BTC perder um suporte importante, as alts são esmagadas mais rápido do que subiram. A gestão de risco continua rigorosa.
Isso não é hype — é estrutura. O índice confirma o que o gráfico já está mostrando. As alts estão acordando.
289
·
--
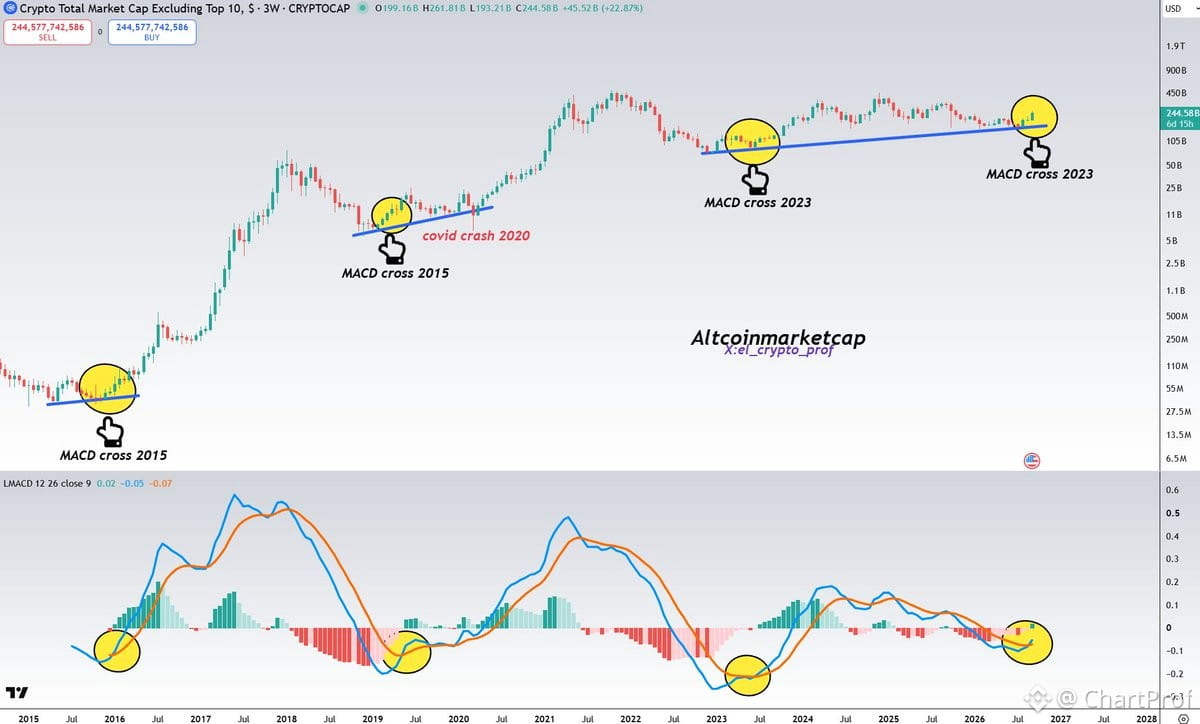
Tudo bem, vamos analisar o que está acontecendo com as altcoins sob uma perspectiva estrutural.
OTHERS acabou de imprimir um cruzamento bullish no timeframe de 3 semanas. Este é um sinal macro — não é uma configuração de day trade, mas sim um indicador de mudança de regime. Historicamente, quando esse cruzamento se confirma, vimos ralis de altcoins sustentados se desenrolarem nos meses seguintes. Pense nisso como um trem de carga que se move devagar: uma vez que ele começa, o momentum vai aumentando.
O que isso significa para o posicionamento?
Primeiro, entenda o timeframe. Um cruzamento de 3W não dispara pumps instantâneos. Ele te diz que a direção do vento mudou. As altcoins estão saindo de acumulação/sideways para entrar em modo de expansão. Seu trabalho agora é identificar quais altcoins estão liderando — estrutura limpa, confirmação por volume e força relativa contra o $BTC.
Segundo, este é um sinal para começar a construir convicção em setups de qualidade, e não para sair comprando tudo no modo “ape”. Procure altcoins rompendo zonas-chave de resistência com volume, mantendo topos mais altos (higher lows) e mostrando força relativa quando o $BTC estiver consolidando.
Invalidação? Se OTHERS não conseguir sustentar este cruzamento e voltar para baixo, o sinal morre. Simples.
Conclusão: este é seu sinal verde macro. Agora vá encontrar os gráficos limpos dentro do universo das alts e posicione-se de acordo. Estrutura primeiro, hype nunca.
Tudo bem, vamos analisar o que está acontecendo com as altcoins sob uma perspectiva estrutural.
OTHERS acabou de imprimir um cruzamento bullish no timeframe de 3 semanas. Este é um sinal macro — não é uma configuração de day trade, mas sim um indicador de mudança de regime. Historicamente, quando esse cruzamento se confirma, vimos ralis de altcoins sustentados se desenrolarem nos meses seguintes. Pense nisso como um trem de carga que se move devagar: uma vez que ele começa, o momentum vai aumentando.
O que isso significa para o posicionamento?
Primeiro, entenda o timeframe. Um cruzamento de 3W não dispara pumps instantâneos. Ele te diz que a direção do vento mudou. As altcoins estão saindo de acumulação/sideways para entrar em modo de expansão. Seu trabalho agora é identificar quais altcoins estão liderando — estrutura limpa, confirmação por volume e força relativa contra o $BTC.
Segundo, este é um sinal para começar a construir convicção em setups de qualidade, e não para sair comprando tudo no modo “ape”. Procure altcoins rompendo zonas-chave de resistência com volume, mantendo topos mais altos (higher lows) e mostrando força relativa quando o $BTC estiver consolidando.
Invalidação? Se OTHERS não conseguir sustentar este cruzamento e voltar para baixo, o sinal morre. Simples.
Conclusão: este é seu sinal verde macro. Agora vá encontrar os gráficos limpos dentro do universo das alts e posicione-se de acordo. Estrutura primeiro, hype nunca.
OTHERS acabou de imprimir um cruzamento bullish no timeframe de 3 semanas. Este é um sinal macro — não é uma configuração de day trade, mas sim um indicador de mudança de regime. Historicamente, quando esse cruzamento se confirma, vimos ralis de altcoins sustentados se desenrolarem nos meses seguintes. Pense nisso como um trem de carga que se move devagar: uma vez que ele começa, o momentum vai aumentando.
O que isso significa para o posicionamento?
Primeiro, entenda o timeframe. Um cruzamento de 3W não dispara pumps instantâneos. Ele te diz que a direção do vento mudou. As altcoins estão saindo de acumulação/sideways para entrar em modo de expansão. Seu trabalho agora é identificar quais altcoins estão liderando — estrutura limpa, confirmação por volume e força relativa contra o $BTC.
Segundo, este é um sinal para começar a construir convicção em setups de qualidade, e não para sair comprando tudo no modo “ape”. Procure altcoins rompendo zonas-chave de resistência com volume, mantendo topos mais altos (higher lows) e mostrando força relativa quando o $BTC estiver consolidando.
Invalidação? Se OTHERS não conseguir sustentar este cruzamento e voltar para baixo, o sinal morre. Simples.
Conclusão: este é seu sinal verde macro. Agora vá encontrar os gráficos limpos dentro do universo das alts e posicione-se de acordo. Estrutura primeiro, hype nunca.
155
·
--
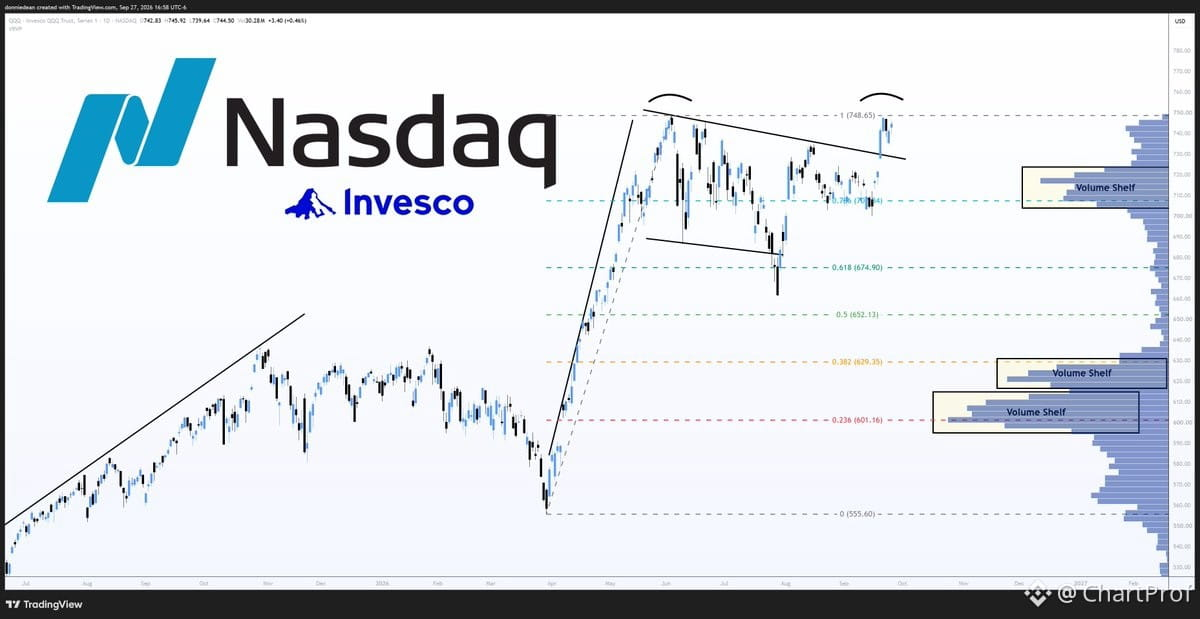
$QQQ está de volta à máxima de junho — mesmo nível, mesma retração de 1,0 em $748.65 que virou o movimento da última vez. Isso é uma configuração potencial de topo duplo no teto.
Já rompeu a linha de tendência de baixa de junho. Um avanço limpo acima de $750 remove a resistência e abre a porta para $760 até 16/10.
Se $750 segurar como uma tampa novamente, a primeira faixa de volume abaixo fica em torno de $705 a $722, bem na retração de 0.786 em $707.34. Foi aí que os compradores apareceram antes.
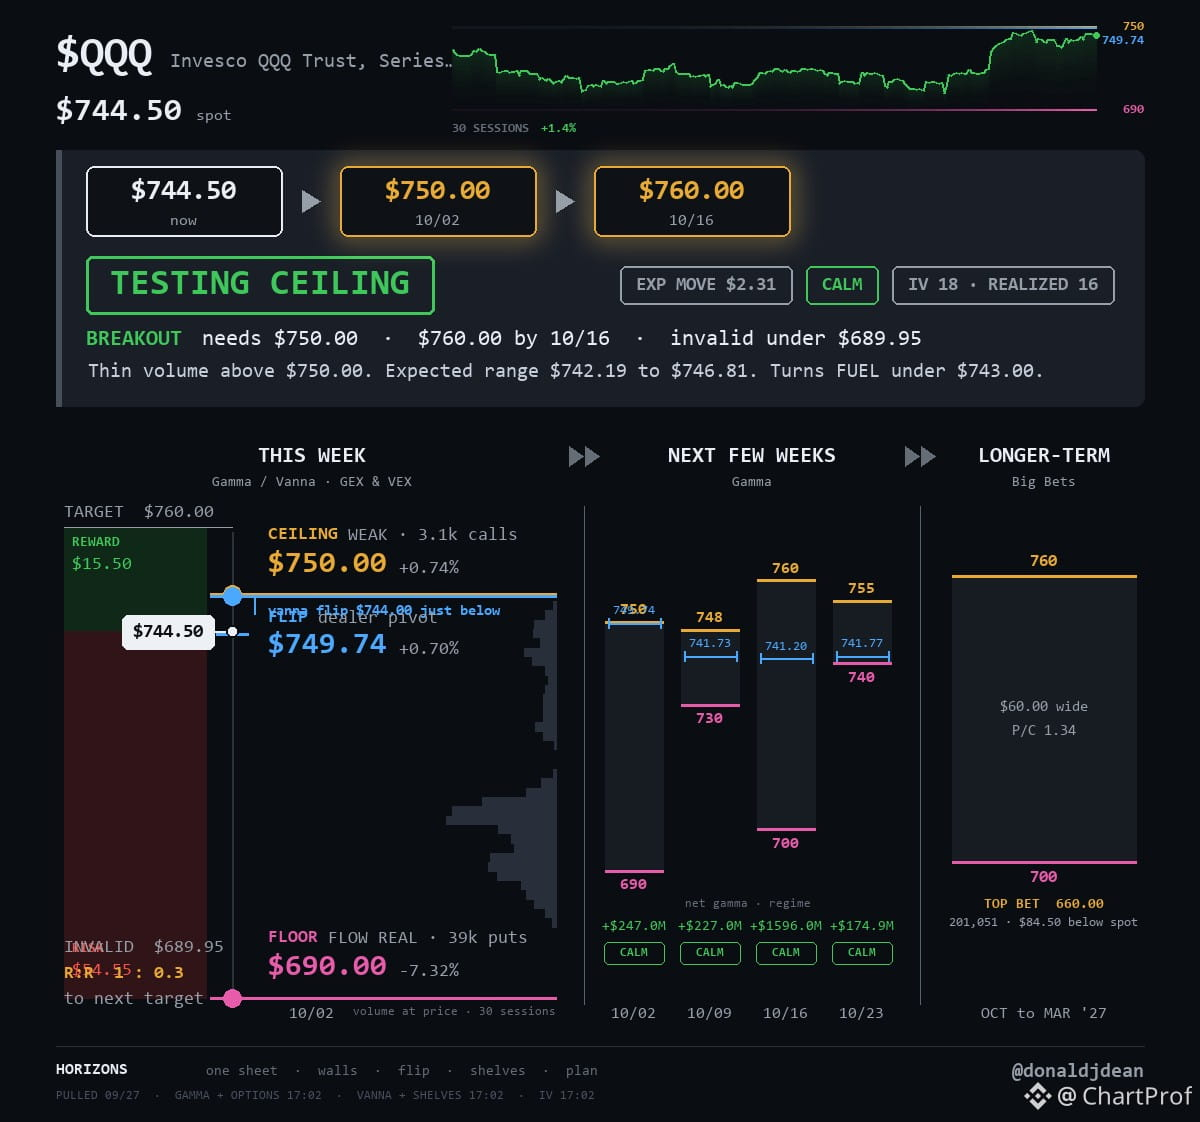
As mesas estão amortecendo os movimentos aqui. Abaixo de $743, esse amortecimento vira combustível — os movimentos ficam mais rápidos, para qualquer lado.
Setup: Topo duplo em $750. Confirmação acima de $750 mira $760. Invalidação abaixo de $743 abre $705-$722.
Caminho do Preço: $744.50 ➡️ $750 ➡️ $760
$750.00, o teto
$744.50, onde o preço está agora
$690.00, o piso
$QQQ está de volta à máxima de junho — mesmo nível, mesma retração de 1,0 em $748.65 que virou o movimento da última vez. Isso é uma configuração potencial de topo duplo no teto.
Já rompeu a linha de tendência de baixa de junho. Um avanço limpo acima de $750 remove a resistência e abre a porta para $760 até 16/10.
Se $750 segurar como uma tampa novamente, a primeira faixa de volume abaixo fica em torno de $705 a $722, bem na retração de 0.786 em $707.34. Foi aí que os compradores apareceram antes.
As mesas estão amortecendo os movimentos aqui. Abaixo de $743, esse amortecimento vira combustível — os movimentos ficam mais rápidos, para qualquer lado.
Setup: Topo duplo em $750. Confirmação acima de $750 mira $760. Invalidação abaixo de $743 abre $705-$722.
Caminho do Preço: $744.50 ➡️ $750 ➡️ $760
$750.00, o teto
$744.50, onde o preço está agora
$690.00, o piso
Já rompeu a linha de tendência de baixa de junho. Um avanço limpo acima de $750 remove a resistência e abre a porta para $760 até 16/10.
Se $750 segurar como uma tampa novamente, a primeira faixa de volume abaixo fica em torno de $705 a $722, bem na retração de 0.786 em $707.34. Foi aí que os compradores apareceram antes.
As mesas estão amortecendo os movimentos aqui. Abaixo de $743, esse amortecimento vira combustível — os movimentos ficam mais rápidos, para qualquer lado.
Setup: Topo duplo em $750. Confirmação acima de $750 mira $760. Invalidação abaixo de $743 abre $705-$722.
Caminho do Preço: $744.50 ➡️ $750 ➡️ $760
$750.00, o teto
$744.50, onde o preço está agora
$690.00, o piso
1
1
254
·
--
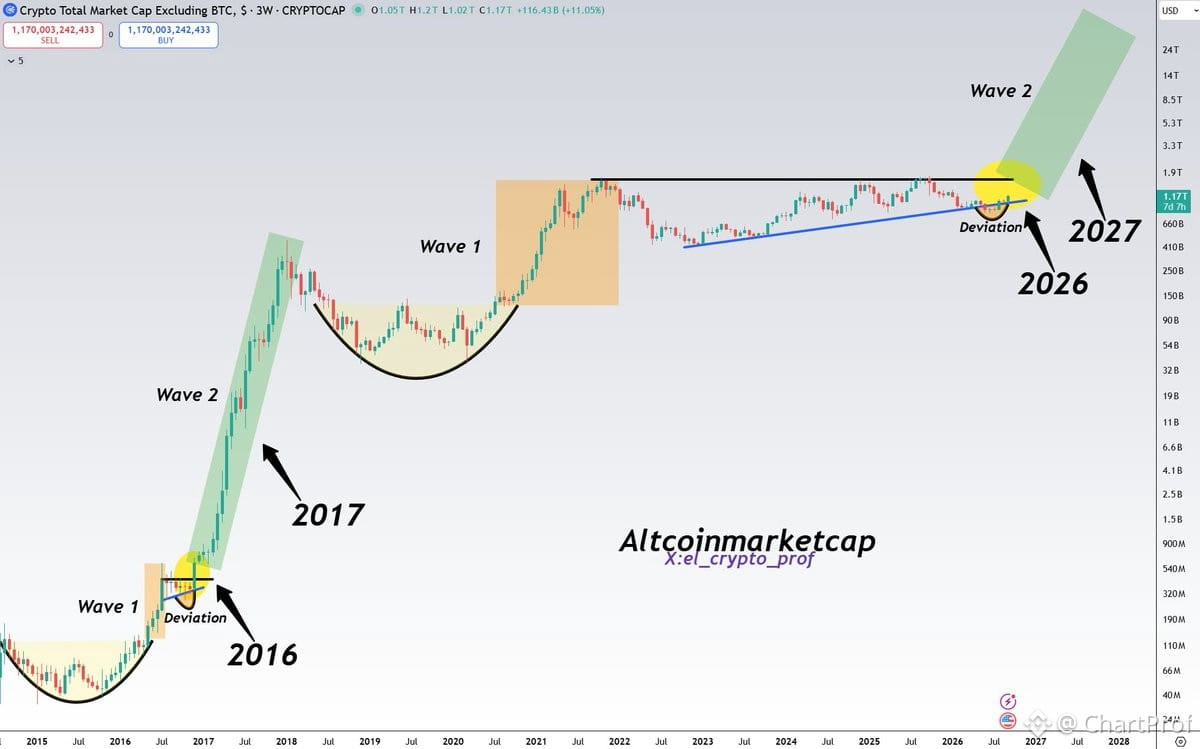
TOTAL2 — a capitalização de mercado agregada de todas as altcoins, excluindo US$ BTC — está voltando aos níveis que vimos pela última vez em 2016-2017. Foi o maior altseason já registrado.
Eis a estrutura: a história não se repete exatamente de um para um, mas ela rima. Qual é a diferença agora? A compressão do tempo se esticou. O que costumava se desenrolar em meses agora está acontecendo ao longo de trimestres, talvez anos. Mas o padrão — acumulação, rompimento, euforia — ainda está lá.
Por que isso importa: se o TOTAL2 recuperar e sustentar aqueles máximos de 2017 com convicção, não estamos apenas falando de um repique. Estamos falando da configuração para um altseason de ciclo completo. O tipo em que o capital gira com força para fora da dominância do US$ BTC e para tudo o resto.
O que confirma: fechamento semanal acima das máximas do ciclo anterior, expansão de volume e a dominância do US$ BTC virando. O que invalida: falha em recuperar e queda de volta para a faixa.
Os próximos meses podem ser os mais explosivos que vimos em anos. Mas apenas se a estrutura se mantiver. Observe o TOTAL2 como um livro — ele está ensinando a lição em tempo real.
TOTAL2 — a capitalização de mercado agregada de todas as altcoins, excluindo US$ BTC — está voltando aos níveis que vimos pela última vez em 2016-2017. Foi o maior altseason já registrado.
Eis a estrutura: a história não se repete exatamente de um para um, mas ela rima. Qual é a diferença agora? A compressão do tempo se esticou. O que costumava se desenrolar em meses agora está acontecendo ao longo de trimestres, talvez anos. Mas o padrão — acumulação, rompimento, euforia — ainda está lá.
Por que isso importa: se o TOTAL2 recuperar e sustentar aqueles máximos de 2017 com convicção, não estamos apenas falando de um repique. Estamos falando da configuração para um altseason de ciclo completo. O tipo em que o capital gira com força para fora da dominância do US$ BTC e para tudo o resto.
O que confirma: fechamento semanal acima das máximas do ciclo anterior, expansão de volume e a dominância do US$ BTC virando. O que invalida: falha em recuperar e queda de volta para a faixa.
Os próximos meses podem ser os mais explosivos que vimos em anos. Mas apenas se a estrutura se mantiver. Observe o TOTAL2 como um livro — ele está ensinando a lição em tempo real.
Eis a estrutura: a história não se repete exatamente de um para um, mas ela rima. Qual é a diferença agora? A compressão do tempo se esticou. O que costumava se desenrolar em meses agora está acontecendo ao longo de trimestres, talvez anos. Mas o padrão — acumulação, rompimento, euforia — ainda está lá.
Por que isso importa: se o TOTAL2 recuperar e sustentar aqueles máximos de 2017 com convicção, não estamos apenas falando de um repique. Estamos falando da configuração para um altseason de ciclo completo. O tipo em que o capital gira com força para fora da dominância do US$ BTC e para tudo o resto.
O que confirma: fechamento semanal acima das máximas do ciclo anterior, expansão de volume e a dominância do US$ BTC virando. O que invalida: falha em recuperar e queda de volta para a faixa.
Os próximos meses podem ser os mais explosivos que vimos em anos. Mas apenas se a estrutura se mantiver. Observe o TOTAL2 como um livro — ele está ensinando a lição em tempo real.
1
580
·
--
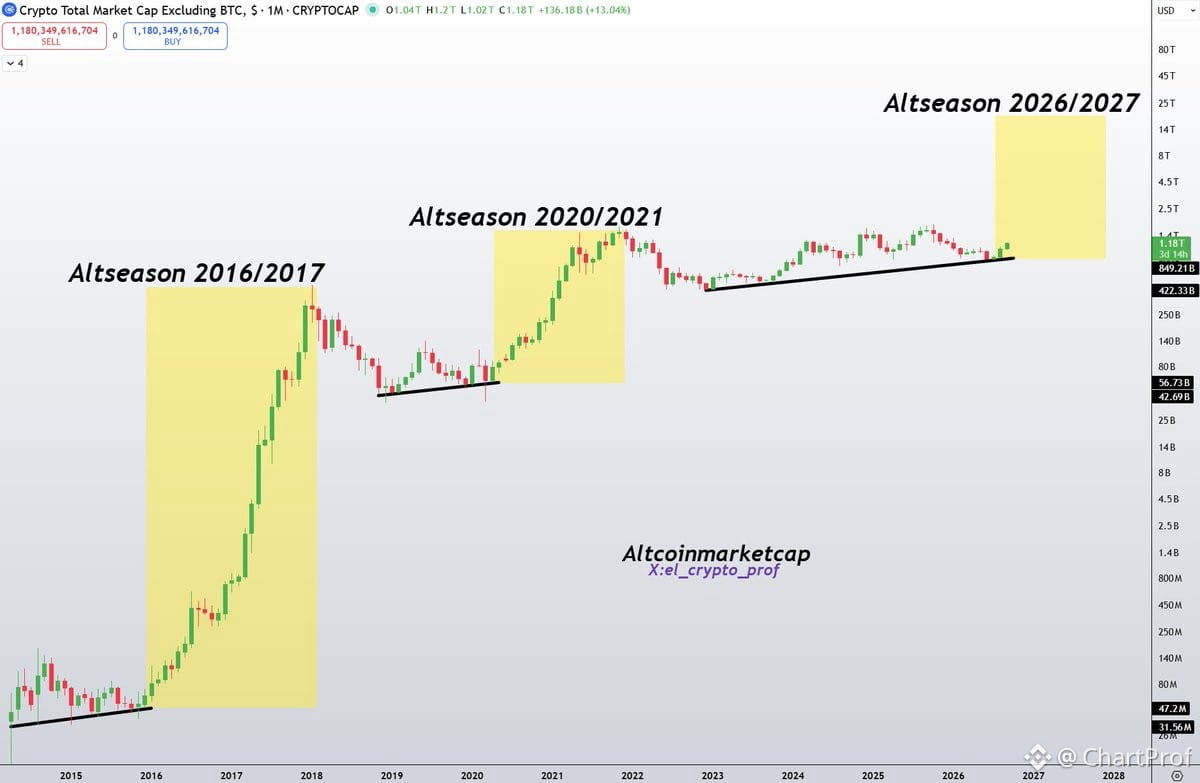
O TOTAL2 acabou de lançar a maior alta em altcoins desde 2016–2017 e 2020–2021.
Vamos entender o que isso significa estruturalmente. TOTAL2 é a capitalização de mercado total de todas as altcoins excluindo o $BTC — é o indicador macro mais limpo da força das altcoins. Quando o TOTAL2 rompe uma consolidação de vários anos e começa a fazer uma tendência forte, isso sinaliza uma rotação ampla de capital para as altcoins. É exatamente o que está acontecendo agora.
Por que isso importa:
- Estamos vendo a mesma configuração estrutural que antecedeu as temporadas de altcoins de 2017 e 2021. O TOTAL2 rompeu uma base longa, segurou o reteste e agora está expandindo para cima.
- Isso não é um impulso aleatório — é uma mudança macro. Quando o TOTAL2 se move assim, confirma que a aversão ao risco está migrando para as altcoins em geral, e não apenas para alguns poucos temas.
O que observar:
- Continuidade acima desta zona de rompimento. Se o TOTAL2 mantiver a estrutura nas correções e continuar fazendo topos e fundos mais altos, a alta tem fôlego.
- Altcoins individuais que estão liderando vs. ficando para trás. Nem todas as altcoins disparam igualmente — foque nas que têm técnicos claros e forte força relativa em relação ao $BTC.
- A invalidação ocorre se o TOTAL2 perder o nível do rompimento e voltar para dentro da faixa antiga. Isso sinalizaria que a rotação travou.
Este é um momento didático: a estrutura macro te diz quando a maré está virando. O rompimento do TOTAL2 é a maré. Agora você aproveita as oportunidades que estão alinhadas com isso.
O TOTAL2 acabou de lançar a maior alta em altcoins desde 2016–2017 e 2020–2021.
Vamos entender o que isso significa estruturalmente. TOTAL2 é a capitalização de mercado total de todas as altcoins excluindo o $BTC — é o indicador macro mais limpo da força das altcoins. Quando o TOTAL2 rompe uma consolidação de vários anos e começa a fazer uma tendência forte, isso sinaliza uma rotação ampla de capital para as altcoins. É exatamente o que está acontecendo agora.
Por que isso importa:
- Estamos vendo a mesma configuração estrutural que antecedeu as temporadas de altcoins de 2017 e 2021. O TOTAL2 rompeu uma base longa, segurou o reteste e agora está expandindo para cima.
- Isso não é um impulso aleatório — é uma mudança macro. Quando o TOTAL2 se move assim, confirma que a aversão ao risco está migrando para as altcoins em geral, e não apenas para alguns poucos temas.
O que observar:
- Continuidade acima desta zona de rompimento. Se o TOTAL2 mantiver a estrutura nas correções e continuar fazendo topos e fundos mais altos, a alta tem fôlego.
- Altcoins individuais que estão liderando vs. ficando para trás. Nem todas as altcoins disparam igualmente — foque nas que têm técnicos claros e forte força relativa em relação ao $BTC.
- A invalidação ocorre se o TOTAL2 perder o nível do rompimento e voltar para dentro da faixa antiga. Isso sinalizaria que a rotação travou.
Este é um momento didático: a estrutura macro te diz quando a maré está virando. O rompimento do TOTAL2 é a maré. Agora você aproveita as oportunidades que estão alinhadas com isso.
Vamos entender o que isso significa estruturalmente. TOTAL2 é a capitalização de mercado total de todas as altcoins excluindo o $BTC — é o indicador macro mais limpo da força das altcoins. Quando o TOTAL2 rompe uma consolidação de vários anos e começa a fazer uma tendência forte, isso sinaliza uma rotação ampla de capital para as altcoins. É exatamente o que está acontecendo agora.
Por que isso importa:
- Estamos vendo a mesma configuração estrutural que antecedeu as temporadas de altcoins de 2017 e 2021. O TOTAL2 rompeu uma base longa, segurou o reteste e agora está expandindo para cima.
- Isso não é um impulso aleatório — é uma mudança macro. Quando o TOTAL2 se move assim, confirma que a aversão ao risco está migrando para as altcoins em geral, e não apenas para alguns poucos temas.
O que observar:
- Continuidade acima desta zona de rompimento. Se o TOTAL2 mantiver a estrutura nas correções e continuar fazendo topos e fundos mais altos, a alta tem fôlego.
- Altcoins individuais que estão liderando vs. ficando para trás. Nem todas as altcoins disparam igualmente — foque nas que têm técnicos claros e forte força relativa em relação ao $BTC.
- A invalidação ocorre se o TOTAL2 perder o nível do rompimento e voltar para dentro da faixa antiga. Isso sinalizaria que a rotação travou.
Este é um momento didático: a estrutura macro te diz quando a maré está virando. O rompimento do TOTAL2 é a maré. Agora você aproveita as oportunidades que estão alinhadas com isso.
1
628
·
--
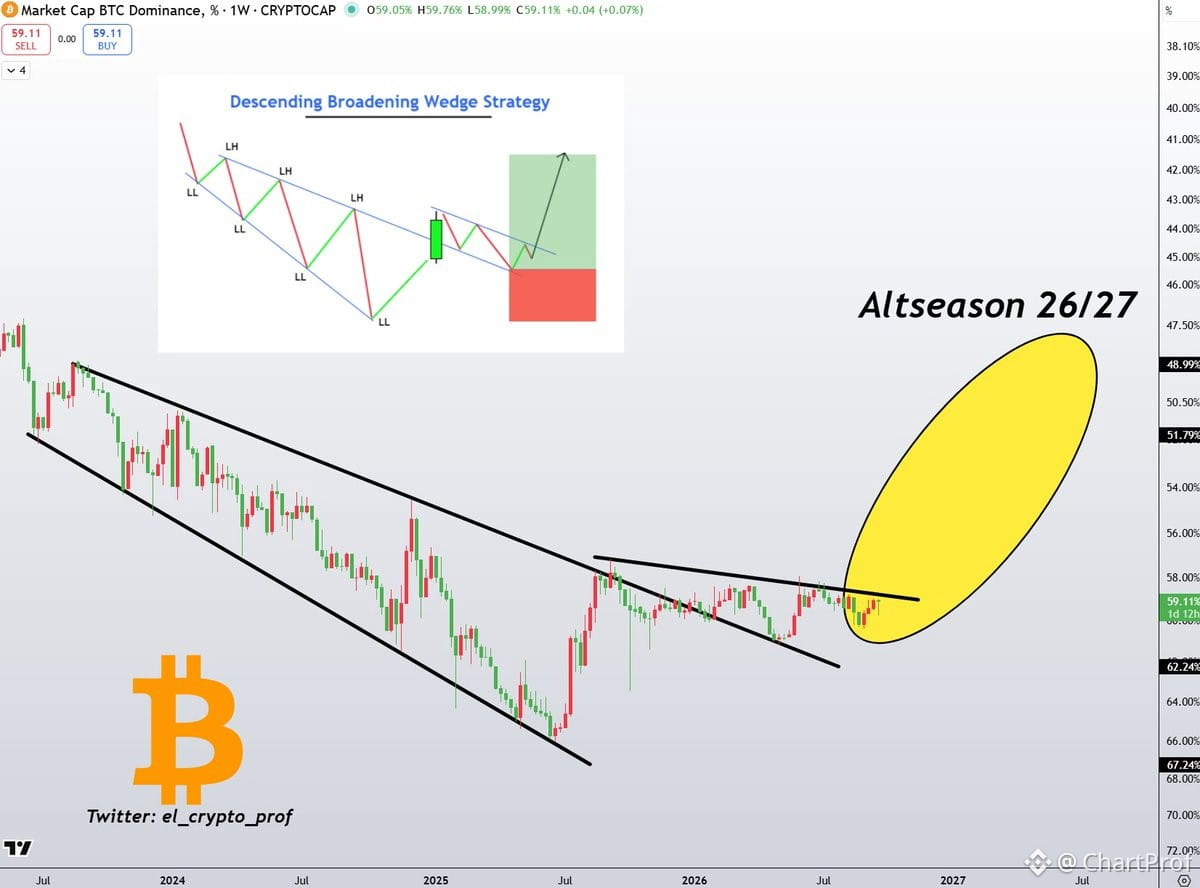
Timing do altseason: 2026/2027.
A inversão da dominância do $BTC conta a história. Quando a dominância vira e começa a sangrar para baixo, é aí que os alts pegam fogo. O gráfico está mostrando o cenário — a dominância atinge o pico e, depois, o capital gira. Já vimos esse filme antes.
E agora? Estamos na fase de acumulação. A dominância ainda está elevada, o que significa que o $BTC ainda está em evidência. Mas a estrutura sugere uma virada futura. Quando a dominância se rompe, as altcoins disparam.
O que confirma: fique de olho para a dominância perder níveis-chave de suporte. Esse é o seu sinal de que o dinheiro está migrando para as alts. O que invalida: a dominância continua subindo ou consolida de lado por anos — isso adia ou mata a festa das alts.
A lição: altseasons não vêm de hype. Elas vêm da rotação de capital. A dominância é o mapa. Leia como um livro-texto e você vai saber quando carregar o barco.
Timing do altseason: 2026/2027.
A inversão da dominância do $BTC conta a história. Quando a dominância vira e começa a sangrar para baixo, é aí que os alts pegam fogo. O gráfico está mostrando o cenário — a dominância atinge o pico e, depois, o capital gira. Já vimos esse filme antes.
E agora? Estamos na fase de acumulação. A dominância ainda está elevada, o que significa que o $BTC ainda está em evidência. Mas a estrutura sugere uma virada futura. Quando a dominância se rompe, as altcoins disparam.
O que confirma: fique de olho para a dominância perder níveis-chave de suporte. Esse é o seu sinal de que o dinheiro está migrando para as alts. O que invalida: a dominância continua subindo ou consolida de lado por anos — isso adia ou mata a festa das alts.
A lição: altseasons não vêm de hype. Elas vêm da rotação de capital. A dominância é o mapa. Leia como um livro-texto e você vai saber quando carregar o barco.
A inversão da dominância do $BTC conta a história. Quando a dominância vira e começa a sangrar para baixo, é aí que os alts pegam fogo. O gráfico está mostrando o cenário — a dominância atinge o pico e, depois, o capital gira. Já vimos esse filme antes.
E agora? Estamos na fase de acumulação. A dominância ainda está elevada, o que significa que o $BTC ainda está em evidência. Mas a estrutura sugere uma virada futura. Quando a dominância se rompe, as altcoins disparam.
O que confirma: fique de olho para a dominância perder níveis-chave de suporte. Esse é o seu sinal de que o dinheiro está migrando para as alts. O que invalida: a dominância continua subindo ou consolida de lado por anos — isso adia ou mata a festa das alts.
A lição: altseasons não vêm de hype. Elas vêm da rotação de capital. A dominância é o mapa. Leia como um livro-texto e você vai saber quando carregar o barco.
603
Faça login para explorar mais conteúdos
Junte-se a usuários de criptomoedas de todo o mundo no Binance Square.
⚡️ Obter informações mais recentes e úteis sobre criptomoeda.
💬 Com a confiança da maior corretora de criptomoedas do mundo.
👍 Descubra insights reais de criadores verificados.
E-mail / número de telefone
Tópicos em Alta
EarningsSeason
240,476 visualizações
2,152 discutindo
Temporada de Resultados: Resultados do 4T da Micron — Touro ou Urso?
Binance Square Official
·346 curtidas
·698.4k visualizações
BitwiseLaunchesFirstSpotNEARETF
13,309 visualizações
391 discutindo
USJobOpeningsFallToFiveMonthLow
18,952 visualizações
290 discutindo