

吃猫猫的狐狸
2.2k Publicações

吃猫猫的狐狸
Denunciar
Bloquear usuário
猫猫的尾巴长,狐狸的尾巴更长
32 Seguindo
2.0K+ Seguidores
1.9K+ Curtiu
Publicações
Todas
Citações
·
--
Ethereum Market Trend Analysis 20250729The 4-hour level rebound has created a top divergence pattern. The price has dropped and retraced, failing to reach the 4-hour EMA52 support, instead rebounding at the 2-hour EMA52 support. After the 2-hour level rebound, the price still needs to decline further to seek the support levels of 4-hour (3696) or 8-hour (3500) before there is greater energy to continue the rebound.
Therefore, the next rebound can still be used to continue to position short orders at high points. After taking profits at the support levels on the 4-hour and 8-hour charts, reverse to open short-term long orders.
The daily line is a small bearish candle with upper and lower shadows, and the trading volume is normal. The daily MA30 line maintains an upward trend, while the MACD shows a continuous weakening of bullish momentum above the zero axis. The fast and slow lines are about to form a death cross. If a death cross occurs, the price will need to undergo a period of adjustment, waiting for the MACD to return to the zero axis or the price to return to the zero axis before there is an opportunity for further upward movement.
Ethereum Market Trend Analysis 20250729
The 4-hour level rebound has created a top divergence pattern. The price has dropped and retraced, failing to reach the 4-hour EMA52 support, instead rebounding at the 2-hour EMA52 support. After the 2-hour level rebound, the price still needs to decline further to seek the support levels of 4-hour (3696) or 8-hour (3500) before there is greater energy to continue the rebound.
Therefore, the next rebound can still be used to continue to position short orders at high points. After taking profits at the support levels on the 4-hour and 8-hour charts, reverse to open short-term long orders.
The daily line is a small bearish candle with upper and lower shadows, and the trading volume is normal. The daily MA30 line maintains an upward trend, while the MACD shows a continuous weakening of bullish momentum above the zero axis. The fast and slow lines are about to form a death cross. If a death cross occurs, the price will need to undergo a period of adjustment, waiting for the MACD to return to the zero axis or the price to return to the zero axis before there is an opportunity for further upward movement.
Therefore, the next rebound can still be used to continue to position short orders at high points. After taking profits at the support levels on the 4-hour and 8-hour charts, reverse to open short-term long orders.
The daily line is a small bearish candle with upper and lower shadows, and the trading volume is normal. The daily MA30 line maintains an upward trend, while the MACD shows a continuous weakening of bullish momentum above the zero axis. The fast and slow lines are about to form a death cross. If a death cross occurs, the price will need to undergo a period of adjustment, waiting for the MACD to return to the zero axis or the price to return to the zero axis before there is an opportunity for further upward movement.
1
940
·
--
Bitcoin Market Trend Analysis 20250729After a high-level fluctuation, the 1-hour chart has started to decline. Currently, it is in a 12-hour rebound within a 2-day line rebound, returning to near the 6-hour EMA52. The 12-hour rebound is still not completed, but the 12-hour MACD has not formed a golden cross and instead shows an increase in bearish momentum. In the next 48 hours, if this situation cannot change, the price will further decline.
From the daily perspective, it is still fluctuating at a high level, with normal trading volume. The daily MA30 line maintains an upward trend, and the MACD shows an increase in bearish momentum above the zero axis.
Bitcoin Market Trend Analysis 20250729
After a high-level fluctuation, the 1-hour chart has started to decline. Currently, it is in a 12-hour rebound within a 2-day line rebound, returning to near the 6-hour EMA52. The 12-hour rebound is still not completed, but the 12-hour MACD has not formed a golden cross and instead shows an increase in bearish momentum. In the next 48 hours, if this situation cannot change, the price will further decline.
From the daily perspective, it is still fluctuating at a high level, with normal trading volume. The daily MA30 line maintains an upward trend, and the MACD shows an increase in bearish momentum above the zero axis.
From the daily perspective, it is still fluctuating at a high level, with normal trading volume. The daily MA30 line maintains an upward trend, and the MACD shows an increase in bearish momentum above the zero axis.
1
520
·
--
Ethereum Market Trend Analysis 20250728The weekly line is a bullish candle with a long lower shadow, and the trading volume is a quarter less than last week. The trend still maintains strength, and the weekly line is currently in a five consecutive bullish candle formation. The last time there was a five consecutive bullish candles was from January to March 2024, and after that, there were two large bearish candles.
Price increase space is getting smaller, the higher it goes, the greater the pressure. The previous few times were all knocked down at the 4000-4100 level, and here it is still about reducing positions.
The daily line is a small bullish candle, with trading volume only about half of last week's average daily trading volume. The weekend is still in a state of reduced volume, but the price has reached a new high.
Ethereum Market Trend Analysis 20250728
The weekly line is a bullish candle with a long lower shadow, and the trading volume is a quarter less than last week. The trend still maintains strength, and the weekly line is currently in a five consecutive bullish candle formation. The last time there was a five consecutive bullish candles was from January to March 2024, and after that, there were two large bearish candles.
Price increase space is getting smaller, the higher it goes, the greater the pressure. The previous few times were all knocked down at the 4000-4100 level, and here it is still about reducing positions.
The daily line is a small bullish candle, with trading volume only about half of last week's average daily trading volume. The weekend is still in a state of reduced volume, but the price has reached a new high.
Price increase space is getting smaller, the higher it goes, the greater the pressure. The previous few times were all knocked down at the 4000-4100 level, and here it is still about reducing positions.
The daily line is a small bullish candle, with trading volume only about half of last week's average daily trading volume. The weekend is still in a state of reduced volume, but the price has reached a new high.
345
·
--
Bitcoin Market Trend Analysis 20250728The weekly line shows a small bullish candle with short upper and lower shadows, and the trading volume is basically flat compared to last week. The weekly MA30 line is still in an upward trend, and the MACD shows a slowly strengthening upward momentum at a distance above the zero axis.
The price is consolidating at a high level, and there is still room for further increases after the adjustment ends, but on the daily chart, there will be relatively large fluctuations. The weekly chart will continue to oscillate, so be patient and wait.
The daily line shows a small bullish candle, with trading volume slightly higher than the previous day. The weekend trading volume is relatively weak, maintaining a high-level oscillating trend.
Currently, we are seeing a rebound on the 2-day line returning to the support level of the 12-hour rebounding within a 30-minute to 1-hour rebound and the 15-minute rebound trend.
Bitcoin Market Trend Analysis 20250728
The weekly line shows a small bullish candle with short upper and lower shadows, and the trading volume is basically flat compared to last week. The weekly MA30 line is still in an upward trend, and the MACD shows a slowly strengthening upward momentum at a distance above the zero axis.
The price is consolidating at a high level, and there is still room for further increases after the adjustment ends, but on the daily chart, there will be relatively large fluctuations. The weekly chart will continue to oscillate, so be patient and wait.
The daily line shows a small bullish candle, with trading volume slightly higher than the previous day. The weekend trading volume is relatively weak, maintaining a high-level oscillating trend.
Currently, we are seeing a rebound on the 2-day line returning to the support level of the 12-hour rebounding within a 30-minute to 1-hour rebound and the 15-minute rebound trend.
The price is consolidating at a high level, and there is still room for further increases after the adjustment ends, but on the daily chart, there will be relatively large fluctuations. The weekly chart will continue to oscillate, so be patient and wait.
The daily line shows a small bullish candle, with trading volume slightly higher than the previous day. The weekend trading volume is relatively weak, maintaining a high-level oscillating trend.
Currently, we are seeing a rebound on the 2-day line returning to the support level of the 12-hour rebounding within a 30-minute to 1-hour rebound and the 15-minute rebound trend.
321
·
--
Ethereum Market Trend Analysis 20250726Ethereum is still rebounding after returning to the 4-hour EMA52 support. Currently, it continues to maintain a fluctuating trend at the 4-hour level, with the 4-hour MACD entangled above the zero axis. It will either break upwards or fall back to test the 8-hour EMA52 before continuing to rebound.
Currently, Ethereum's trend still remains strong, so as long as Bitcoin does not decline, it is highly likely that Ethereum will continue to break upwards.
Today is Saturday, and the market is still mainly dominated by fluctuations. In the afternoon to evening on Sunday, the volatility will increase, so please pay attention.
Ethereum's altcoins will take the opportunity to repair the K-line this weekend, waiting for Ethereum to sound the charge.
Ethereum Market Trend Analysis 20250726
Ethereum is still rebounding after returning to the 4-hour EMA52 support. Currently, it continues to maintain a fluctuating trend at the 4-hour level, with the 4-hour MACD entangled above the zero axis. It will either break upwards or fall back to test the 8-hour EMA52 before continuing to rebound.
Currently, Ethereum's trend still remains strong, so as long as Bitcoin does not decline, it is highly likely that Ethereum will continue to break upwards.
Today is Saturday, and the market is still mainly dominated by fluctuations. In the afternoon to evening on Sunday, the volatility will increase, so please pay attention.
Ethereum's altcoins will take the opportunity to repair the K-line this weekend, waiting for Ethereum to sound the charge.
Currently, Ethereum's trend still remains strong, so as long as Bitcoin does not decline, it is highly likely that Ethereum will continue to break upwards.
Today is Saturday, and the market is still mainly dominated by fluctuations. In the afternoon to evening on Sunday, the volatility will increase, so please pay attention.
Ethereum's altcoins will take the opportunity to repair the K-line this weekend, waiting for Ethereum to sound the charge.
2
843
·
--
Bitcoin Market Trend Analysis 20250726After the price dropped and retraced to the 12-hour EMA52 line, it began to rebound. It is currently oscillating around 117400, which is a resistance level in the 1-4 hour range and also coincidentally near the lower edge of the box oscillation. If it breaks up after oscillation, it will trigger a rebound at the 12-hour level. If that rebound is effective, there will be opportunities to continue challenging new highs.
Many people believe that the selling off by ancient whales led to the price drop, but this is one-sided; the price was already at a point where it was due for a correction. The whales' selling merely accelerated this process. Perhaps the galaxy helped the whales by establishing a short position with one hand while selling with the other?
Bitcoin Market Trend Analysis 20250726
After the price dropped and retraced to the 12-hour EMA52 line, it began to rebound. It is currently oscillating around 117400, which is a resistance level in the 1-4 hour range and also coincidentally near the lower edge of the box oscillation. If it breaks up after oscillation, it will trigger a rebound at the 12-hour level. If that rebound is effective, there will be opportunities to continue challenging new highs.
Many people believe that the selling off by ancient whales led to the price drop, but this is one-sided; the price was already at a point where it was due for a correction. The whales' selling merely accelerated this process. Perhaps the galaxy helped the whales by establishing a short position with one hand while selling with the other?
Many people believe that the selling off by ancient whales led to the price drop, but this is one-sided; the price was already at a point where it was due for a correction. The whales' selling merely accelerated this process. Perhaps the galaxy helped the whales by establishing a short position with one hand while selling with the other?
1
1
3
2k
·
--
SOL Market Trend Analysis 20250725The daily chart is still showing a bearish candle, with trading volume remaining the same as the previous day. Two consecutive bearish candles have completely swallowed the previous gains.
The daily MA30 line is still in an upward trend, with the MACD showing weakening upward momentum above the zero axis.
The current price has bounced back after hitting the support of the 6-hour EMA52 line, forming a one-hour level rebound, but the 6-hour MACD is still in the process of returning to the zero axis, making the rebound relatively weak.
Next, a short-term long position can be taken near the MA30 line on the daily chart, which happens to be near the upper edge of the red box (164-168) (aiming for around 183).
Daily level resistance at 193-210-220, support at 175-166-156-145.
SOL Market Trend Analysis 20250725
The daily chart is still showing a bearish candle, with trading volume remaining the same as the previous day. Two consecutive bearish candles have completely swallowed the previous gains.
The daily MA30 line is still in an upward trend, with the MACD showing weakening upward momentum above the zero axis.
The current price has bounced back after hitting the support of the 6-hour EMA52 line, forming a one-hour level rebound, but the 6-hour MACD is still in the process of returning to the zero axis, making the rebound relatively weak.
Next, a short-term long position can be taken near the MA30 line on the daily chart, which happens to be near the upper edge of the red box (164-168) (aiming for around 183).
Daily level resistance at 193-210-220, support at 175-166-156-145.
The daily MA30 line is still in an upward trend, with the MACD showing weakening upward momentum above the zero axis.
The current price has bounced back after hitting the support of the 6-hour EMA52 line, forming a one-hour level rebound, but the 6-hour MACD is still in the process of returning to the zero axis, making the rebound relatively weak.
Next, a short-term long position can be taken near the MA30 line on the daily chart, which happens to be near the upper edge of the red box (164-168) (aiming for around 183).
Daily level resistance at 193-210-220, support at 175-166-156-145.
1
657
·
--
以太坊行情走势分析20250725回踩4小时EMA52线的反弹目前没有带动MACD出现金叉的走势,如果这里直接跌下去,那么就是上涨动能不足,价格还会去到更低的8小时EMA52线(3340),可以做一波8小时的反弹。
日线是带有上下影线的小阳线,成交量与前一天基本持平,日线MACD在零轴上方远点呈现上涨动能减弱。
价格还在高位做震荡,但是上涨动能持续减弱,如果没有大阳线突破,那么再继续震荡下去的话,就会出现瀑布下跌。
以太坊行情走势分析20250725
回踩4小时EMA52线的反弹目前没有带动MACD出现金叉的走势,如果这里直接跌下去,那么就是上涨动能不足,价格还会去到更低的8小时EMA52线(3340),可以做一波8小时的反弹。
日线是带有上下影线的小阳线,成交量与前一天基本持平,日线MACD在零轴上方远点呈现上涨动能减弱。
价格还在高位做震荡,但是上涨动能持续减弱,如果没有大阳线突破,那么再继续震荡下去的话,就会出现瀑布下跌。
日线是带有上下影线的小阳线,成交量与前一天基本持平,日线MACD在零轴上方远点呈现上涨动能减弱。
价格还在高位做震荡,但是上涨动能持续减弱,如果没有大阳线突破,那么再继续震荡下去的话,就会出现瀑布下跌。
1
417
·
--
Bitcoin Market Trend Analysis 20250725Currently, it is following a 2-day line rebound within a 6-12 hour joint rebound back to the 6-hour EMA52 after a pullback, showing a trend of oscillation. It has consistently failed to effectively touch the 8-hour EMA52 line. The support at the 8-hour here will weaken, and next we can wait to add positions at the 12-hour EMA52 line (114910).
The daily line shows a small bearish candlestick with a doji pattern, and the trading volume is flat compared to the previous day, maintaining a high-level oscillation trend.
The viewpoint remains the same as yesterday; there will not be a crash for the time being. The price is slowly dropping towards the 12-hour support before rebounding. If the rebound cannot create a new high, then it will need to go to the 1-day line support before rebounding again.
Bitcoin Market Trend Analysis 20250725
Currently, it is following a 2-day line rebound within a 6-12 hour joint rebound back to the 6-hour EMA52 after a pullback, showing a trend of oscillation. It has consistently failed to effectively touch the 8-hour EMA52 line. The support at the 8-hour here will weaken, and next we can wait to add positions at the 12-hour EMA52 line (114910).
The daily line shows a small bearish candlestick with a doji pattern, and the trading volume is flat compared to the previous day, maintaining a high-level oscillation trend.
The viewpoint remains the same as yesterday; there will not be a crash for the time being. The price is slowly dropping towards the 12-hour support before rebounding. If the rebound cannot create a new high, then it will need to go to the 1-day line support before rebounding again.
The daily line shows a small bearish candlestick with a doji pattern, and the trading volume is flat compared to the previous day, maintaining a high-level oscillation trend.
The viewpoint remains the same as yesterday; there will not be a crash for the time being. The price is slowly dropping towards the 12-hour support before rebounding. If the rebound cannot create a new high, then it will need to go to the 1-day line support before rebounding again.
1
367
·
--
Ethereum Market Trend Analysis 20250724Yesterday, on the hourly level, there was a continuous decline, ultimately arriving near the 4-hour EMA52 line (3500) where it found support and formed a rebound on the hourly level. Currently, the rebound seems relatively strong, but the 4-hour MACD is still in the process of returning to the zero line. If the fast and slow lines form a golden cross, then the 4-hour rebound will be effective, and the price can continue to rise.
The daily line is a bearish candle with a long lower shadow and a short upper shadow, the trading volume is basically flat compared to the previous day, and the MACD shows a weakening upward momentum far above the zero line.
Currently, a short-term top pattern has emerged. We have mentioned that the higher it goes, the more we should take profits in batches. There is a divergence in funds here, with $4000 being a key level and also a previous high. If the market does not reach a consensus and the price cannot rise here, it is likely to drop sharply.
Ethereum Market Trend Analysis 20250724
Yesterday, on the hourly level, there was a continuous decline, ultimately arriving near the 4-hour EMA52 line (3500) where it found support and formed a rebound on the hourly level. Currently, the rebound seems relatively strong, but the 4-hour MACD is still in the process of returning to the zero line. If the fast and slow lines form a golden cross, then the 4-hour rebound will be effective, and the price can continue to rise.
The daily line is a bearish candle with a long lower shadow and a short upper shadow, the trading volume is basically flat compared to the previous day, and the MACD shows a weakening upward momentum far above the zero line.
Currently, a short-term top pattern has emerged. We have mentioned that the higher it goes, the more we should take profits in batches. There is a divergence in funds here, with $4000 being a key level and also a previous high. If the market does not reach a consensus and the price cannot rise here, it is likely to drop sharply.
The daily line is a bearish candle with a long lower shadow and a short upper shadow, the trading volume is basically flat compared to the previous day, and the MACD shows a weakening upward momentum far above the zero line.
Currently, a short-term top pattern has emerged. We have mentioned that the higher it goes, the more we should take profits in batches. There is a divergence in funds here, with $4000 being a key level and also a previous high. If the market does not reach a consensus and the price cannot rise here, it is likely to drop sharply.
1
287
·
--
Bitcoin Market Trend Analysis 20250724Currently, there is a 2-day rebound within the 6-12 hour joint rebound returning to the 6-hour EMA52 oscillating trend, and it has been unable to effectively touch the 8-hour EMA52 line. The support here at the 8-hour will become weaker, and next, we can wait to buy at the 12-hour EMA52 line (114660).
The daily candlestick is a small bearish candle with a lower shadow, and the trading volume is one-third less than the previous day, continuing to maintain a high-level oscillating trend.
There won't be a drastic drop for now, it will still be oscillating back and forth. If the 12-hour level rebound cannot create a new high, then it will need to go to the daily support before rebounding.
Bitcoin Market Trend Analysis 20250724
Currently, there is a 2-day rebound within the 6-12 hour joint rebound returning to the 6-hour EMA52 oscillating trend, and it has been unable to effectively touch the 8-hour EMA52 line. The support here at the 8-hour will become weaker, and next, we can wait to buy at the 12-hour EMA52 line (114660).
The daily candlestick is a small bearish candle with a lower shadow, and the trading volume is one-third less than the previous day, continuing to maintain a high-level oscillating trend.
There won't be a drastic drop for now, it will still be oscillating back and forth. If the 12-hour level rebound cannot create a new high, then it will need to go to the daily support before rebounding.
The daily candlestick is a small bearish candle with a lower shadow, and the trading volume is one-third less than the previous day, continuing to maintain a high-level oscillating trend.
There won't be a drastic drop for now, it will still be oscillating back and forth. If the 12-hour level rebound cannot create a new high, then it will need to go to the daily support before rebounding.
1
633
·
--
SOL Market Trend Analysis 20250723The daily chart shows a three consecutive bullish candlestick pattern, with two days of strong bullish candles accompanied by increased trading volume, indicating that there is still room for further price increases. This time, the target will be the 210-220 area.
As long as Bitcoin doesn't drop, SOL will continue to rise, but it should be noted that the higher the price rises, the greater the pressure will be. Unless there is a strong bullish breakout, once it stagnates, the price will quickly fall back.
Daily level resistance at 220-240-256, support at 186-168-156-145
SOL Market Trend Analysis 20250723
The daily chart shows a three consecutive bullish candlestick pattern, with two days of strong bullish candles accompanied by increased trading volume, indicating that there is still room for further price increases. This time, the target will be the 210-220 area.
As long as Bitcoin doesn't drop, SOL will continue to rise, but it should be noted that the higher the price rises, the greater the pressure will be. Unless there is a strong bullish breakout, once it stagnates, the price will quickly fall back.
Daily level resistance at 220-240-256, support at 186-168-156-145
As long as Bitcoin doesn't drop, SOL will continue to rise, but it should be noted that the higher the price rises, the greater the pressure will be. Unless there is a strong bullish breakout, once it stagnates, the price will quickly fall back.
Daily level resistance at 220-240-256, support at 186-168-156-145
2
827
·
--
SOL行情走势分析20250722日线是一根实体比较长的阳线,成交量开始放大,日线MA30线保持上行趋势,MACD在零轴上方呈现上涨动能增强的走势。
价格上冲到了200附近形成了小级别的回踩,高位盘整之后又开始继续上冲,如果有效突破200的压制,那么价格可以继续去到210-220这个区间。
只要比特币不下跌,那么SOL依然还有机会向上冲击更高的价格,希望比特币能够给点机会。
日线级别压力位205-220-240-256,支撑位186-168-156-145
SOL行情走势分析20250722
日线是一根实体比较长的阳线,成交量开始放大,日线MA30线保持上行趋势,MACD在零轴上方呈现上涨动能增强的走势。
价格上冲到了200附近形成了小级别的回踩,高位盘整之后又开始继续上冲,如果有效突破200的压制,那么价格可以继续去到210-220这个区间。
只要比特币不下跌,那么SOL依然还有机会向上冲击更高的价格,希望比特币能够给点机会。
日线级别压力位205-220-240-256,支撑位186-168-156-145
价格上冲到了200附近形成了小级别的回踩,高位盘整之后又开始继续上冲,如果有效突破200的压制,那么价格可以继续去到210-220这个区间。
只要比特币不下跌,那么SOL依然还有机会向上冲击更高的价格,希望比特币能够给点机会。
日线级别压力位205-220-240-256,支撑位186-168-156-145
2
598
·
--
Bitcoin Market Trend Analysis 20250722The daily candlestick is a small bullish line with a long upper shadow and a short lower shadow, with trading volume about a quarter more than the previous day, still maintaining normal trading volume.
The daily MA30 line maintains an upward trend, and the MACD shows a slight death cross of the fast and slow lines above the zero axis, indicating an increase in downward momentum.
The rebound after the 6-hour level support mentioned yesterday was not very strong, and the price has returned to the vicinity of the 6-hour EMA52 line.
Next, a long position can still be taken at the 8-hour EMA52 (115550) and 12-hour EMA52 (113860) lines.
Daily level resistance at 120000-131700-150000, support at 113600-111800-105100-100500
Bitcoin Market Trend Analysis 20250722
The daily candlestick is a small bullish line with a long upper shadow and a short lower shadow, with trading volume about a quarter more than the previous day, still maintaining normal trading volume.
The daily MA30 line maintains an upward trend, and the MACD shows a slight death cross of the fast and slow lines above the zero axis, indicating an increase in downward momentum.
The rebound after the 6-hour level support mentioned yesterday was not very strong, and the price has returned to the vicinity of the 6-hour EMA52 line.
Next, a long position can still be taken at the 8-hour EMA52 (115550) and 12-hour EMA52 (113860) lines.
Daily level resistance at 120000-131700-150000, support at 113600-111800-105100-100500
The daily MA30 line maintains an upward trend, and the MACD shows a slight death cross of the fast and slow lines above the zero axis, indicating an increase in downward momentum.
The rebound after the 6-hour level support mentioned yesterday was not very strong, and the price has returned to the vicinity of the 6-hour EMA52 line.
Next, a long position can still be taken at the 8-hour EMA52 (115550) and 12-hour EMA52 (113860) lines.
Daily level resistance at 120000-131700-150000, support at 113600-111800-105100-100500
1
411
·
--
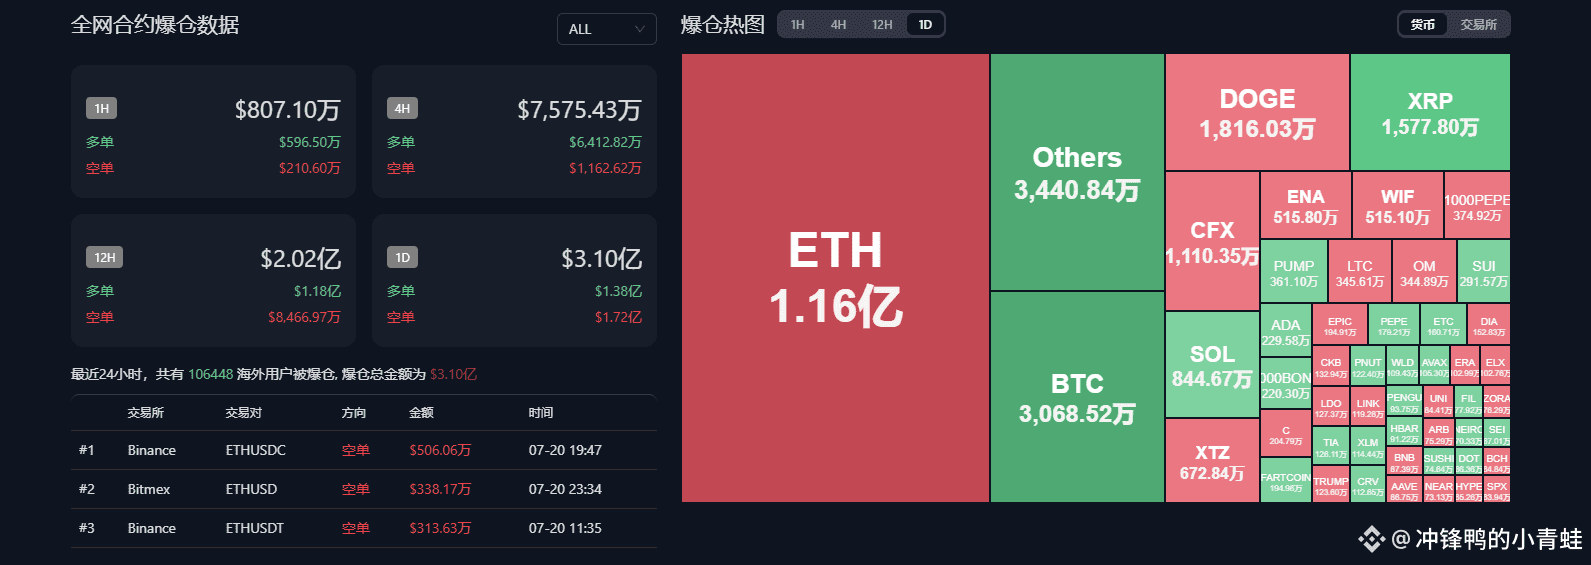
全网合约爆仓数据:
最近24小时,共有 106446 用户被爆仓, 爆仓总金额为 R$3,10亿
全网合约爆仓数据:
最近24小时,共有 106446 用户被爆仓, 爆仓总金额为 R$3,10亿
最近24小时,共有 106446 用户被爆仓, 爆仓总金额为 R$3,10亿
1.9k
·
--
Análise de Tendência do Mercado SOL 20250721A linha semanal é uma vela de alta com aumento superior a 17%, comparado ao Ethereum, o aumento da linha semanal do SOL é menor, e ainda mantém uma tendência de alta em oscilações.
O preço também chegou à posição da linha de pescoço no nível semanal, a pressão aqui será considerável, e o movimento normal será uma falsa quebra seguida de uma queda e um retorno.
O movimento específico ainda depende de como o Bitcoin se comporta; enquanto o Bitcoin não cair, o SOL terá oportunidades.
A linha diária é uma vela de alta com sombra superior, e o volume de negociação é um pouco maior do que o dia anterior, mas ainda assim inferior à média de volume dos últimos dias de negociação.
Análise de Tendência do Mercado SOL 20250721
A linha semanal é uma vela de alta com aumento superior a 17%, comparado ao Ethereum, o aumento da linha semanal do SOL é menor, e ainda mantém uma tendência de alta em oscilações.
O preço também chegou à posição da linha de pescoço no nível semanal, a pressão aqui será considerável, e o movimento normal será uma falsa quebra seguida de uma queda e um retorno.
O movimento específico ainda depende de como o Bitcoin se comporta; enquanto o Bitcoin não cair, o SOL terá oportunidades.
A linha diária é uma vela de alta com sombra superior, e o volume de negociação é um pouco maior do que o dia anterior, mas ainda assim inferior à média de volume dos últimos dias de negociação.
O preço também chegou à posição da linha de pescoço no nível semanal, a pressão aqui será considerável, e o movimento normal será uma falsa quebra seguida de uma queda e um retorno.
O movimento específico ainda depende de como o Bitcoin se comporta; enquanto o Bitcoin não cair, o SOL terá oportunidades.
A linha diária é uma vela de alta com sombra superior, e o volume de negociação é um pouco maior do que o dia anterior, mas ainda assim inferior à média de volume dos últimos dias de negociação.
1
493
·
--
Análise do comportamento do mercado de Bitcoin 20250721A linha semanal é uma pequena vela de baixa com uma longa sombra superior e uma sombra inferior curta, com um volume de negócios cerca de 30% maior do que na semana anterior.
A linha MA30 semanal apresenta uma leve tendência de alta, o MACD mostra um aumento na força de alta acima do eixo zero. Se esta semana continuar a fechar em vela de baixa, a força de alta pode se mostrar insuficiente, e será necessário um novo ajuste.
O nível de ajuste está na faixa de 112000-109700.
O gráfico diário mostra uma formação de quatro velas de baixa, a linha MA30 diária ainda está em tendência de alta, o MACD, um pouco afastado do eixo zero, mostra uma redução na força de alta, as linhas rápida e lenta estão prestes a cruzar, então, a partir de agora, o Bitcoin continuará a se ajustar, e aqui ainda será uma oscilação em alta em vez de uma queda.
Análise do comportamento do mercado de Bitcoin 20250721
A linha semanal é uma pequena vela de baixa com uma longa sombra superior e uma sombra inferior curta, com um volume de negócios cerca de 30% maior do que na semana anterior.
A linha MA30 semanal apresenta uma leve tendência de alta, o MACD mostra um aumento na força de alta acima do eixo zero. Se esta semana continuar a fechar em vela de baixa, a força de alta pode se mostrar insuficiente, e será necessário um novo ajuste.
O nível de ajuste está na faixa de 112000-109700.
O gráfico diário mostra uma formação de quatro velas de baixa, a linha MA30 diária ainda está em tendência de alta, o MACD, um pouco afastado do eixo zero, mostra uma redução na força de alta, as linhas rápida e lenta estão prestes a cruzar, então, a partir de agora, o Bitcoin continuará a se ajustar, e aqui ainda será uma oscilação em alta em vez de uma queda.
A linha MA30 semanal apresenta uma leve tendência de alta, o MACD mostra um aumento na força de alta acima do eixo zero. Se esta semana continuar a fechar em vela de baixa, a força de alta pode se mostrar insuficiente, e será necessário um novo ajuste.
O nível de ajuste está na faixa de 112000-109700.
O gráfico diário mostra uma formação de quatro velas de baixa, a linha MA30 diária ainda está em tendência de alta, o MACD, um pouco afastado do eixo zero, mostra uma redução na força de alta, as linhas rápida e lenta estão prestes a cruzar, então, a partir de agora, o Bitcoin continuará a se ajustar, e aqui ainda será uma oscilação em alta em vez de uma queda.
1
293
Faça login para explorar mais conteúdos
Junte-se a usuários de criptomoedas de todo o mundo no Binance Square.
⚡️ Obter informações mais recentes e úteis sobre criptomoeda.
💬 Com a confiança da maior corretora de criptomoedas do mundo.
👍 Descubra insights reais de criadores verificados.
E-mail / número de telefone
Tópicos em Alta
BinanceWillListHyperliquid(HYPE)
125,104 visualizações
2,356 discutindo
Binance vai Listar Hyperliquid (HYPE) com uma Tag de Seed
Binance News
·73 curtidas
·71.6k visualizações
FedOctoberRateHikeOddsRiseTo69.7%
38,194 visualizações
942 discutindo
BitcoinFallsBelow$83,000
3,671 visualizações
20 discutindo