

CryptoTraders.com
466 Publicações

CryptoTraders.com
Denunciar
Bloquear usuário
Home of Top Analysts, Elite Trade Alerts, Cutting-Edge Algorithms, and Powerful Scanners — all built to give you the edge in any market. Join & Activate your 14-day free trial now to see the results yourself!
0 Seguindo
4 Seguidores
5 Curtiu
Publicações
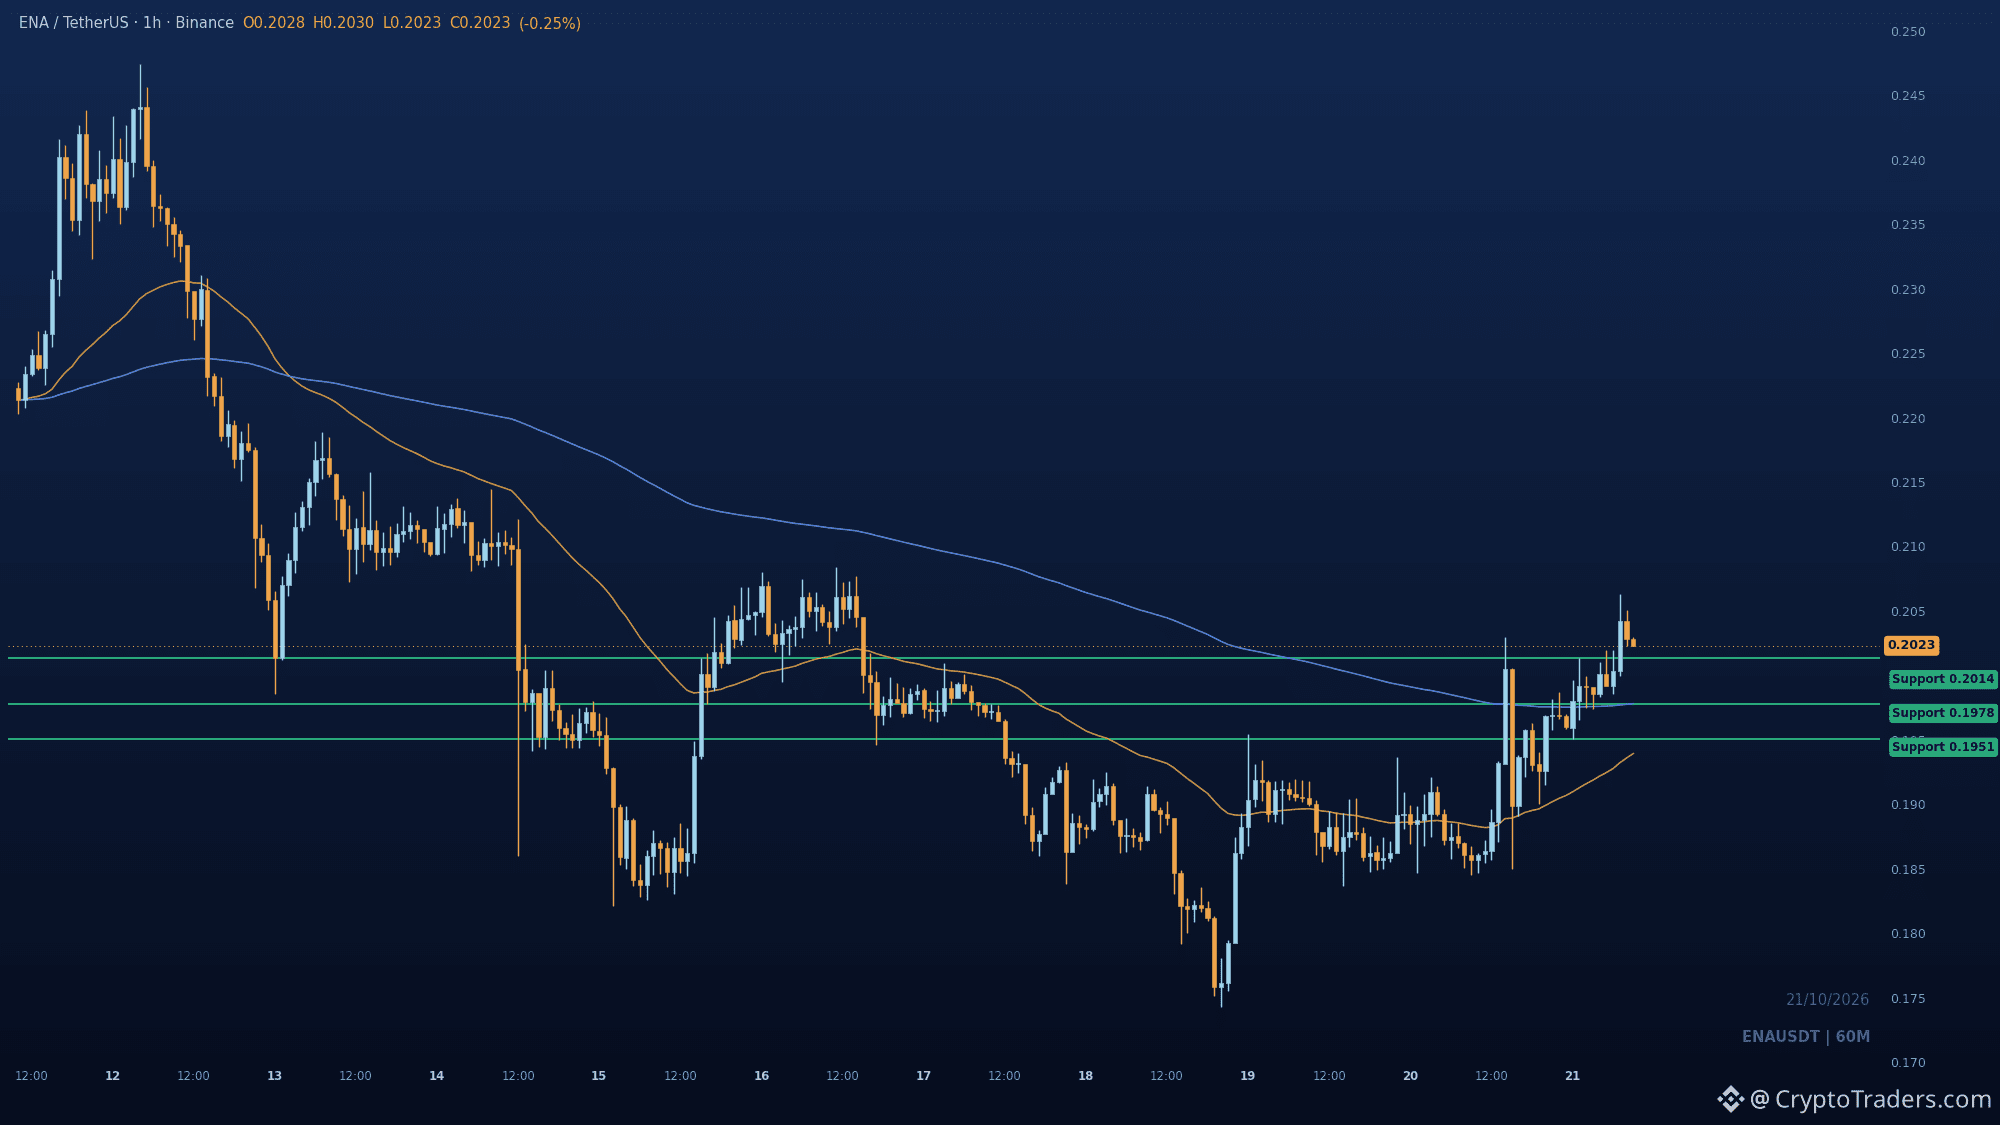
A galera está tratando essa alta do $ENA como um repique de gato morto, mas o gráfico de 1h já registrou uma ruptura altista da estrutura acima de 0.20136. O preço ainda está na zona de desconto do range, então há espaço para o movimento avançar antes de ficar congestionado. As duas EMAs foram recuperadas. A EMA 200, em 0.1978, é a referência para um recuo caso 0.20136 seja perdido. Abaixo disso, 0.19509 é o nível em que a leitura altista se desfaz. Quantas horas você acha que faltam para o reteste de 0.20136? Gráficos como este são analisados com o grupo todas as manhãs. #Temporada das Altcoins#
A galera está tratando essa alta do $ENA como um repique de gato morto, mas o gráfico de 1h já registrou uma ruptura altista da estrutura acima de 0.20136. O preço ainda está na zona de desconto do range, então há espaço para o movimento avançar antes de ficar congestionado. As duas EMAs foram recuperadas. A EMA 200, em 0.1978, é a referência para um recuo caso 0.20136 seja perdido. Abaixo disso, 0.19509 é o nível em que a leitura altista se desfaz. Quantas horas você acha que faltam para o reteste de 0.20136? Gráficos como este são analisados com o grupo todas as manhãs. #Temporada das Altcoins#
25
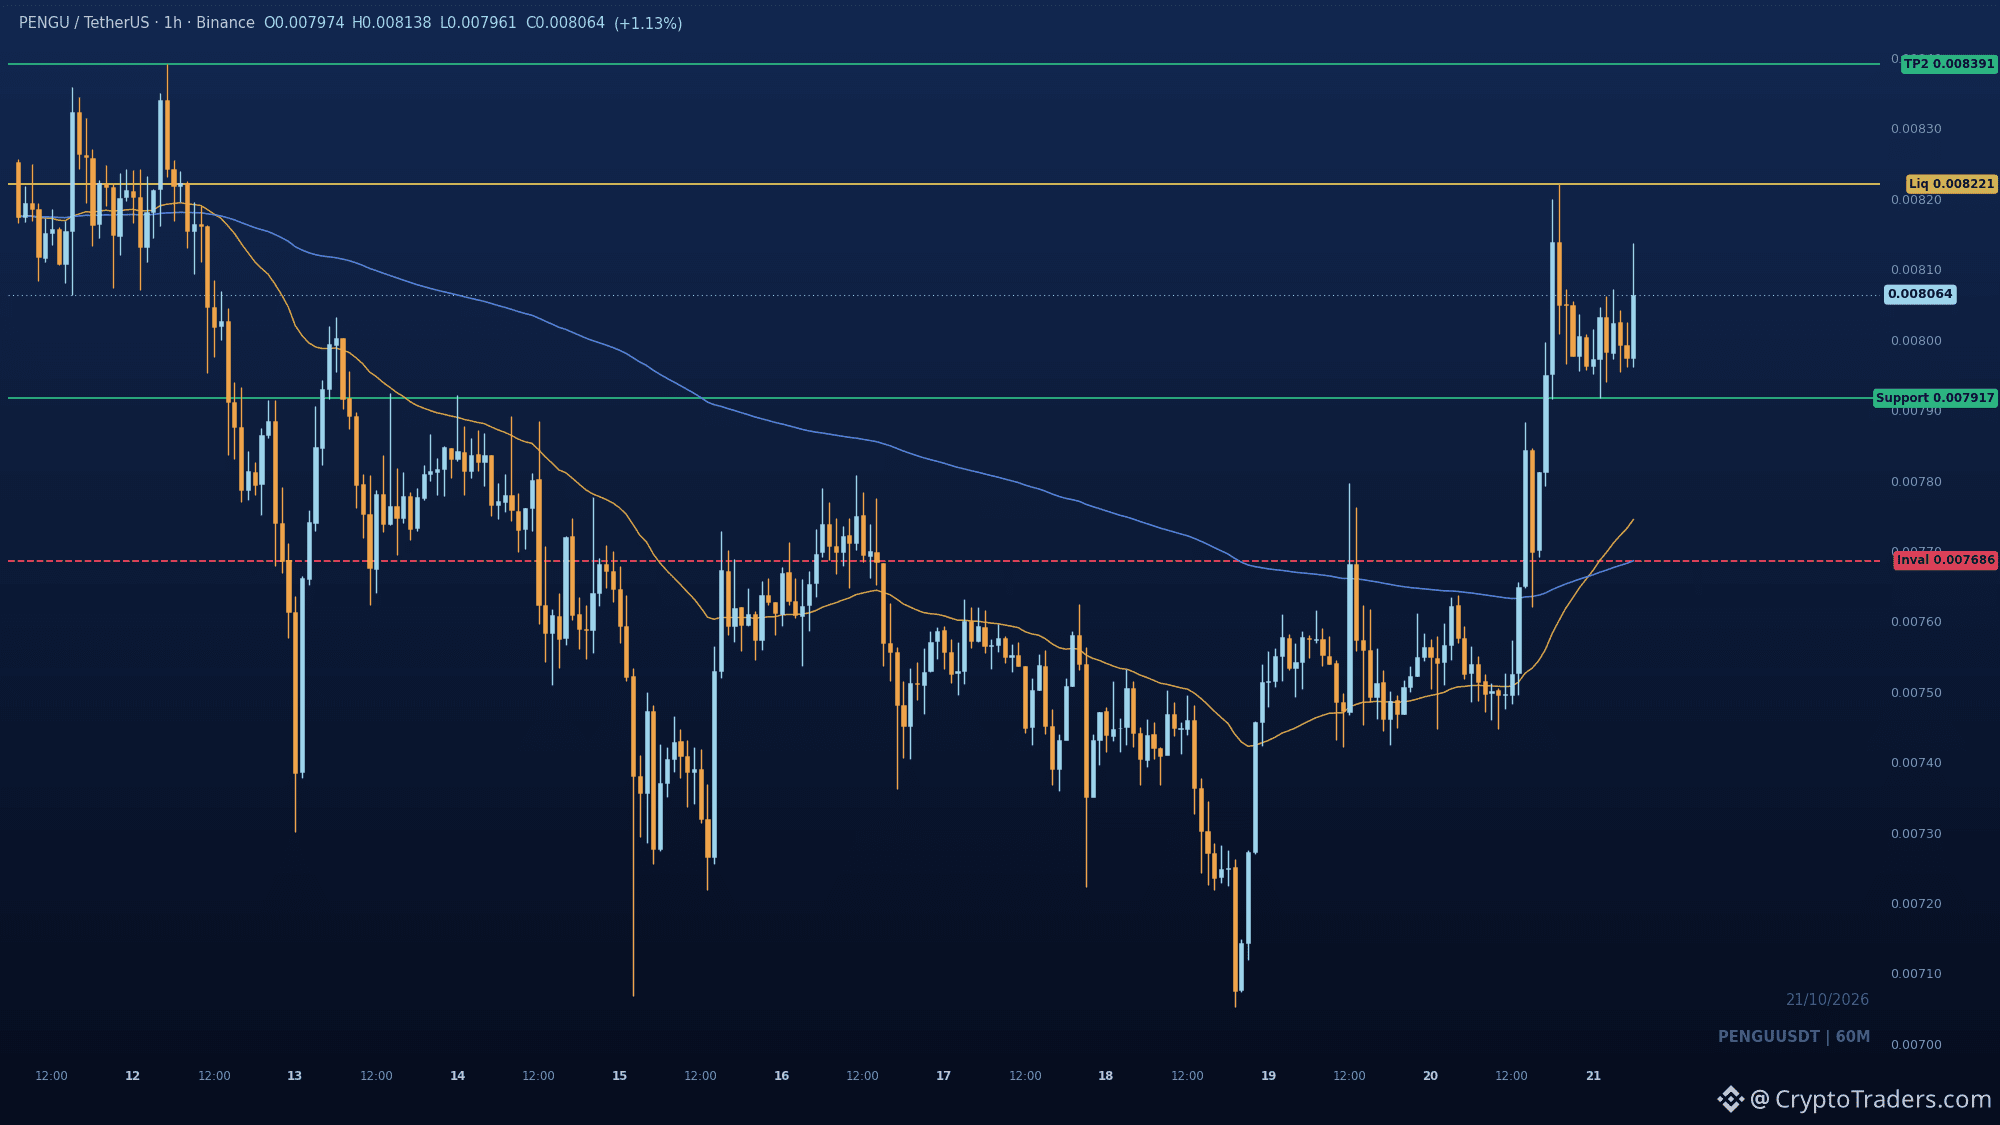
$PENGU está preso entre o nível de suporte do recuo em 0.007917 e o pool de liquidez compradora em 0.008221, e o lado que ceder primeiro definirá o próximo movimento. O gráfico de 1h passou de tendência de baixa para um CHoCH/BOS de alta após varrer as mínimas do intervalo, e ambas as EMAs foram recuperadas e estão abaixo do preço. A mínima do swing em 0.007917 é o sinal: se os compradores aparecerem nesse nível, o mercado continua premiando quem compra nas quedas, e 0.008221, seguido de 0.008391, entra em jogo. Se esse suporte falhar, os compradores que pagaram pelo rompimento deixam de comprar, e 0.00768614 é o nível que confirma a mudança. Você está de olho no reteste ou em uma nova tentativa de rompimento? Mais análises como esta são publicadas diariamente no grupo; o link para entrar está na bio. #Temporada das altcoins#
$PENGU está preso entre o nível de suporte do recuo em 0.007917 e o pool de liquidez compradora em 0.008221, e o lado que ceder primeiro definirá o próximo movimento. O gráfico de 1h passou de tendência de baixa para um CHoCH/BOS de alta após varrer as mínimas do intervalo, e ambas as EMAs foram recuperadas e estão abaixo do preço. A mínima do swing em 0.007917 é o sinal: se os compradores aparecerem nesse nível, o mercado continua premiando quem compra nas quedas, e 0.008221, seguido de 0.008391, entra em jogo. Se esse suporte falhar, os compradores que pagaram pelo rompimento deixam de comprar, e 0.00768614 é o nível que confirma a mudança. Você está de olho no reteste ou em uma nova tentativa de rompimento? Mais análises como esta são publicadas diariamente no grupo; o link para entrar está na bio. #Temporada das altcoins#
29
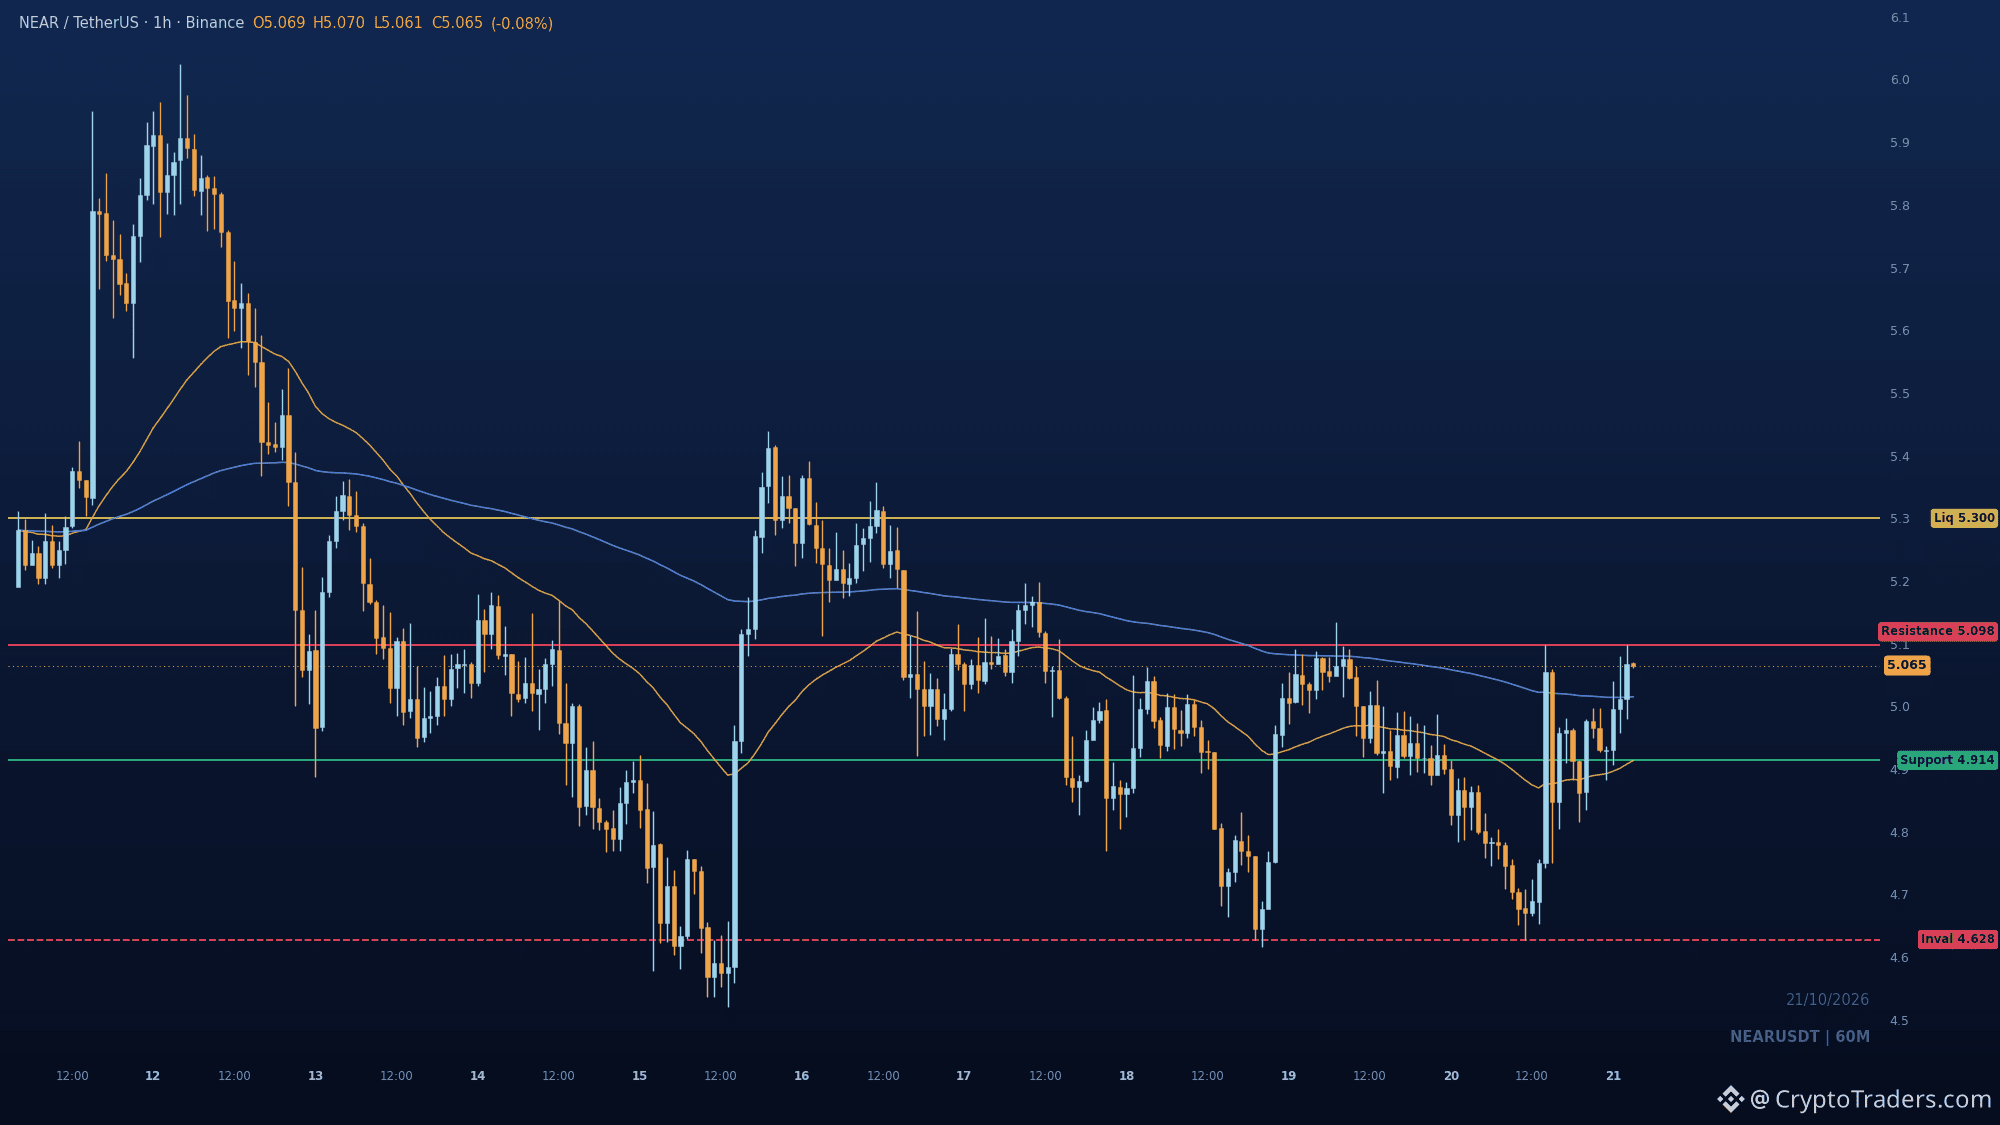
5.098 é o número que importa no $NEAR agora. O preço varreu 4.63, recuperou as duas EMAs e subiu até o desconto da faixa, em 5.07. Esse topo do movimento é o ponto decisivo: manter-se acima dele coloca 5.3 no radar, os topos da recuperação anterior. Perder a EMA rápida em 4.914 transforma isso em mais uma rotação, com 4.628 como o nível que invalida a recuperação. Até onde você acha que o NEAR pode subir se romper 5.098? Leituras como esta são publicadas diariamente no grupo; os detalhes estão na bio. #Temporada das Altcoins#
5.098 é o número que importa no $NEAR agora. O preço varreu 4.63, recuperou as duas EMAs e subiu até o desconto da faixa, em 5.07. Esse topo do movimento é o ponto decisivo: manter-se acima dele coloca 5.3 no radar, os topos da recuperação anterior. Perder a EMA rápida em 4.914 transforma isso em mais uma rotação, com 4.628 como o nível que invalida a recuperação. Até onde você acha que o NEAR pode subir se romper 5.098? Leituras como esta são publicadas diariamente no grupo; os detalhes estão na bio. #Temporada das Altcoins#
41
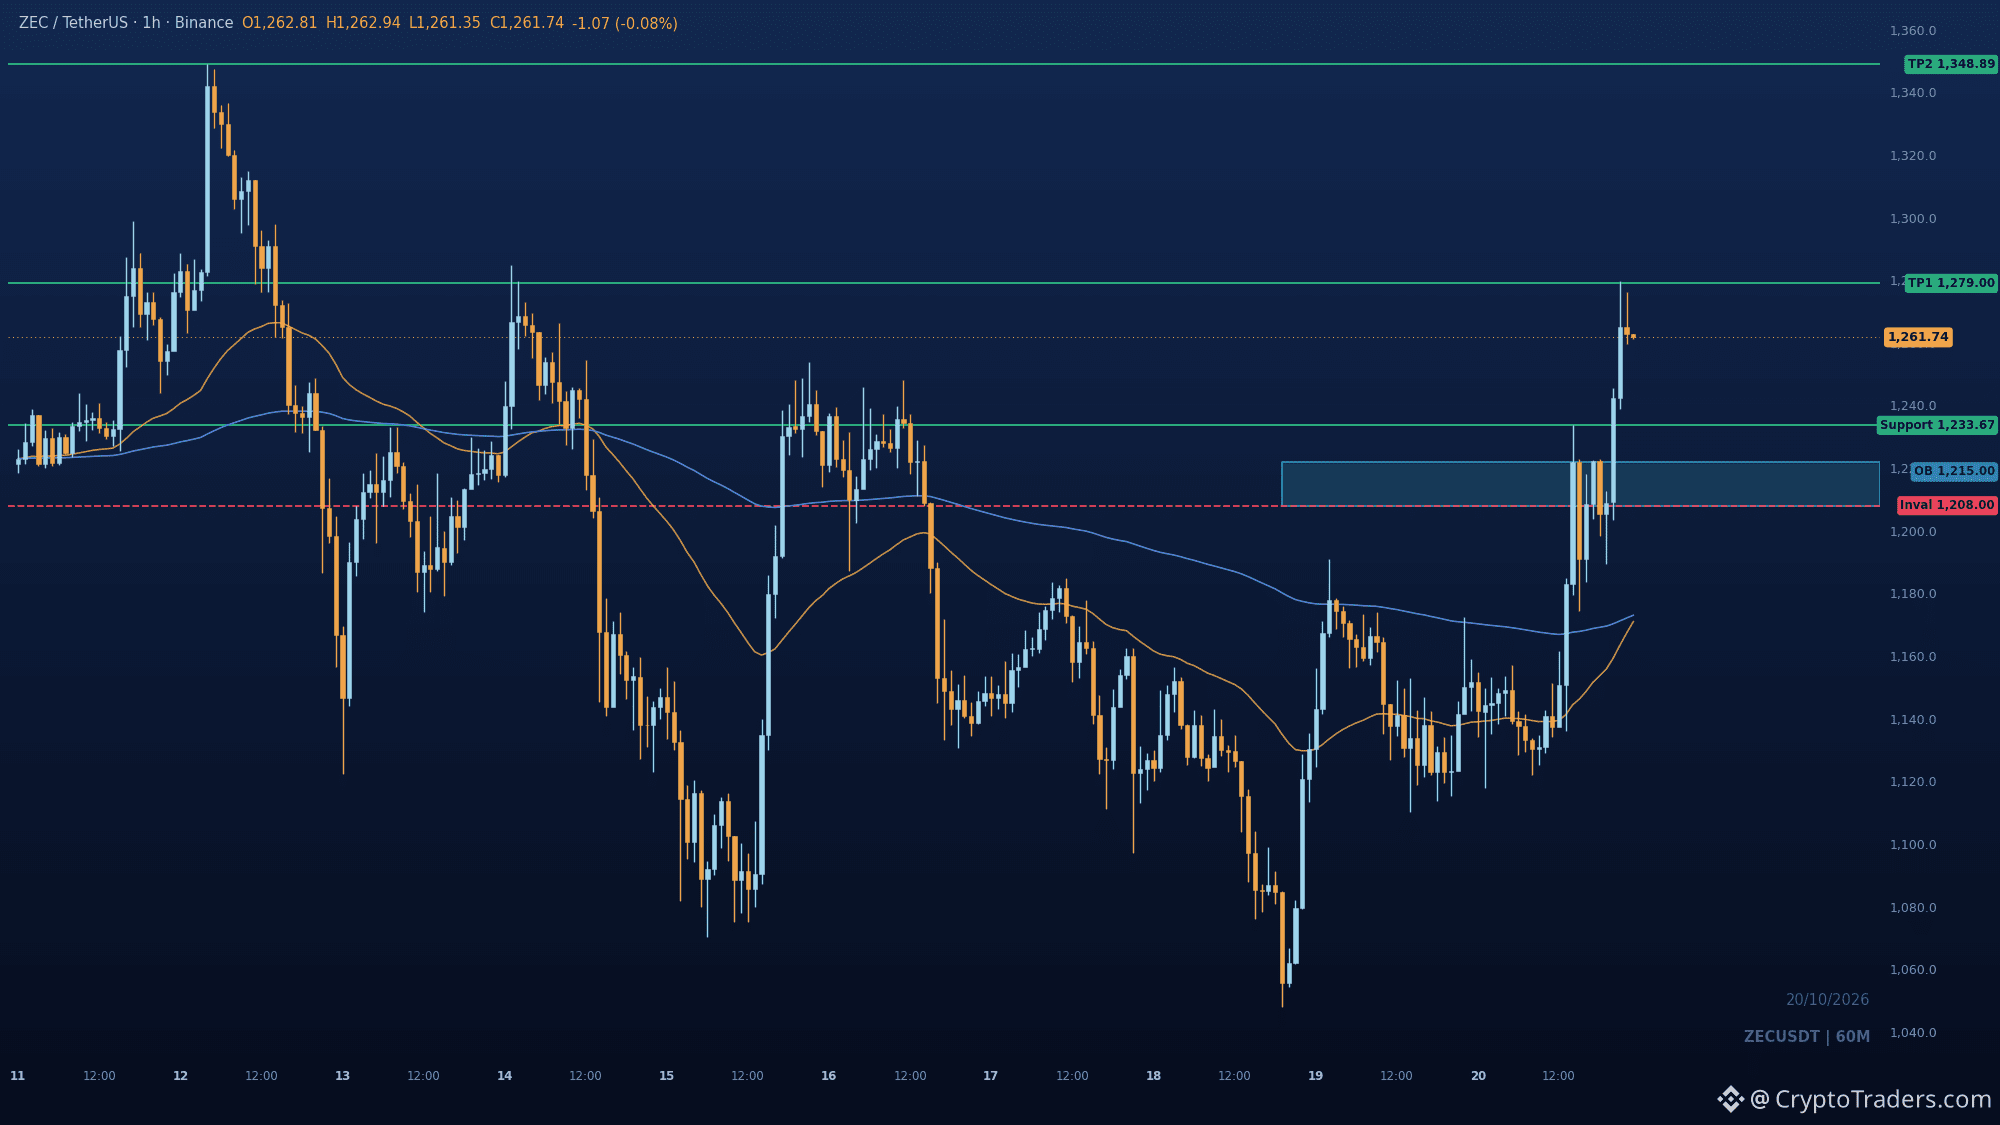
O $ZEC consegue se manter em 1233.67 agora que esse nível virou suporte em vez de resistência? O BOS acima de 1233.67 veio acompanhado de um forte momentum após a varredura perto de 1048, e o preço ainda está sendo negociado na faixa premium. A zona de pullback é 1233.67, com o bloco de ordens de alta entre 1208 e 1222 logo abaixo. Defender essa base mantém 1279 no radar, seguido pela máxima anterior em 1348.89. Perder 1208 muda o cenário: os vendedores assumem o controle, e o rompimento vira uma armadilha. Você está de olho no reteste ou esperando 1279 aparecer primeiro? Análises como esta são publicadas diariamente no grupo; o link está na bio. #Temporada das Altcoins#
O $ZEC consegue se manter em 1233.67 agora que esse nível virou suporte em vez de resistência? O BOS acima de 1233.67 veio acompanhado de um forte momentum após a varredura perto de 1048, e o preço ainda está sendo negociado na faixa premium. A zona de pullback é 1233.67, com o bloco de ordens de alta entre 1208 e 1222 logo abaixo. Defender essa base mantém 1279 no radar, seguido pela máxima anterior em 1348.89. Perder 1208 muda o cenário: os vendedores assumem o controle, e o rompimento vira uma armadilha. Você está de olho no reteste ou esperando 1279 aparecer primeiro? Análises como esta são publicadas diariamente no grupo; o link está na bio. #Temporada das Altcoins#
55
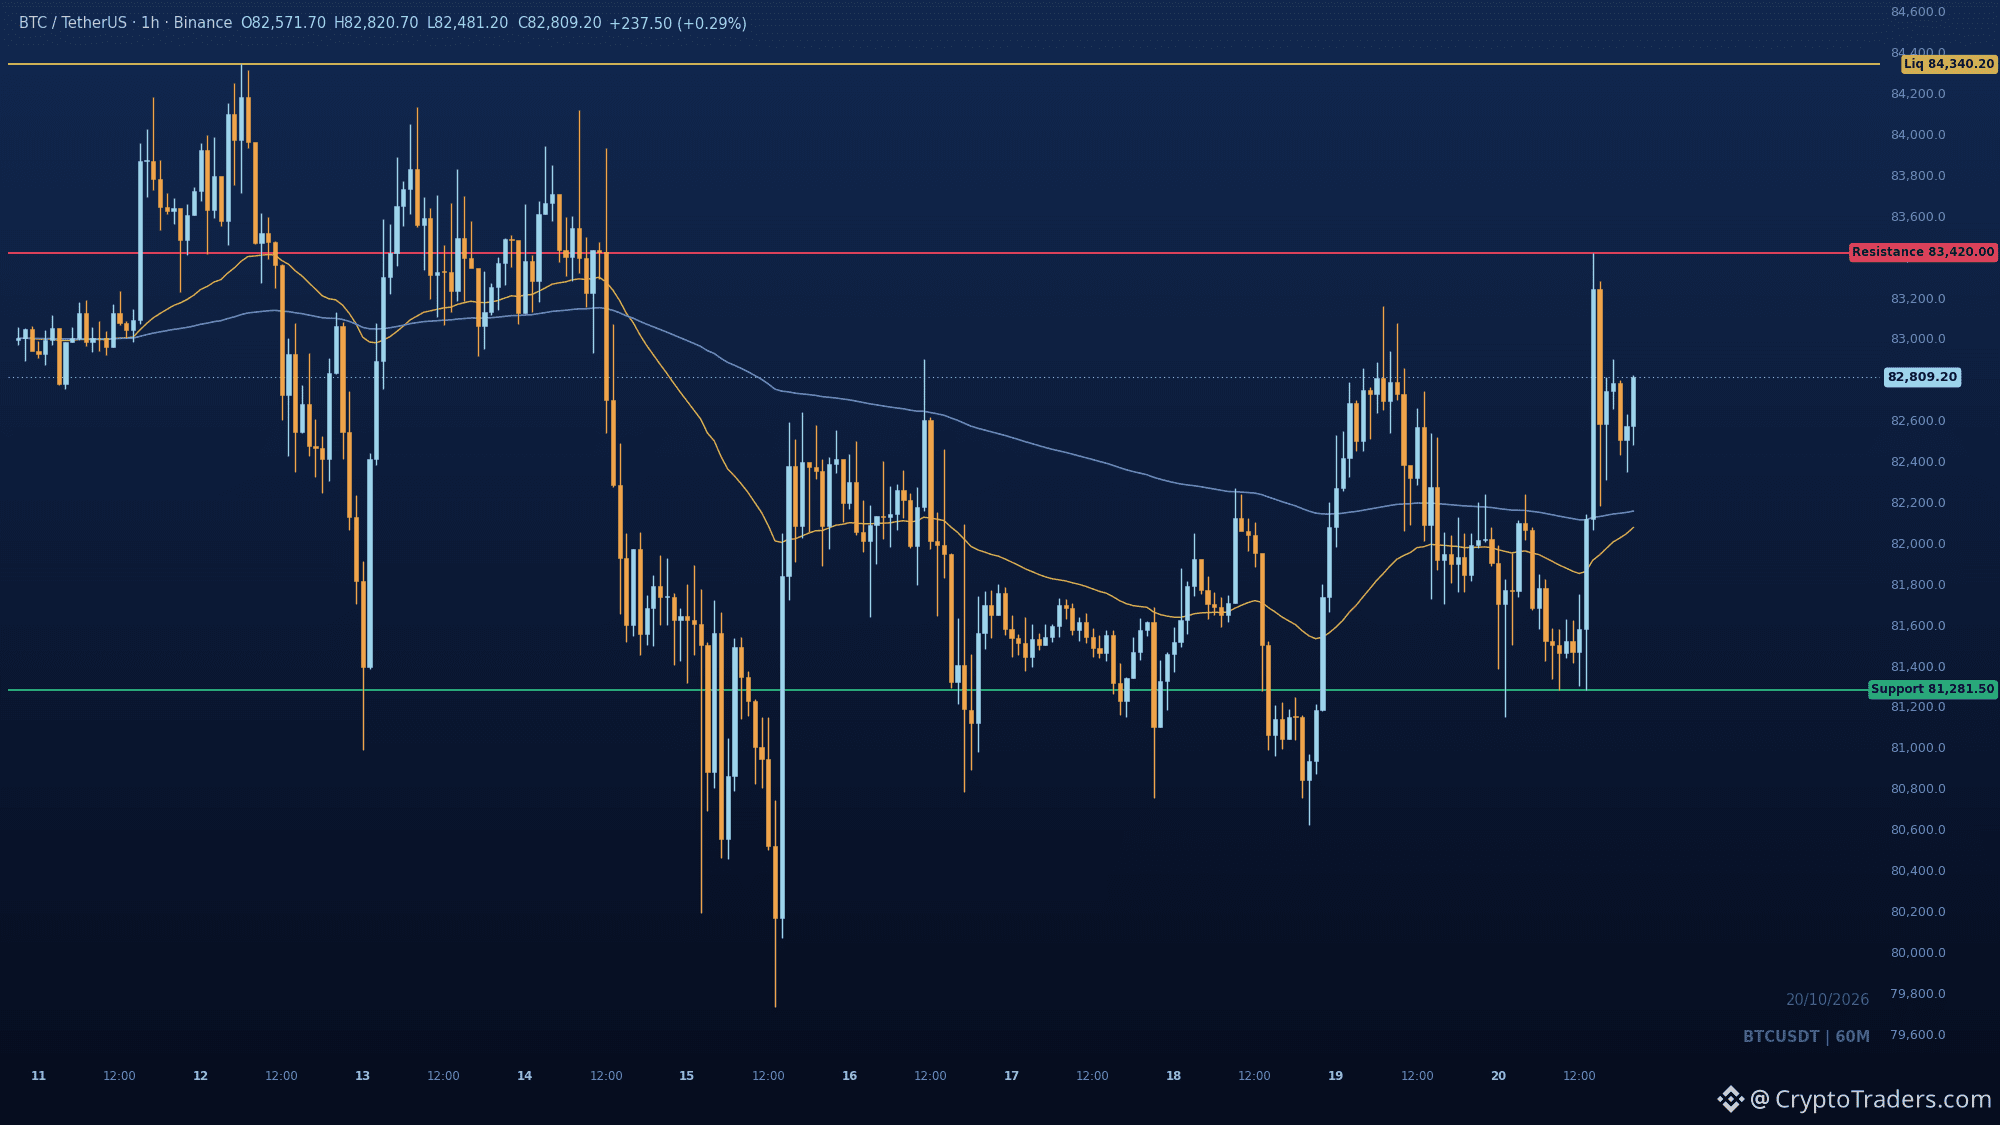
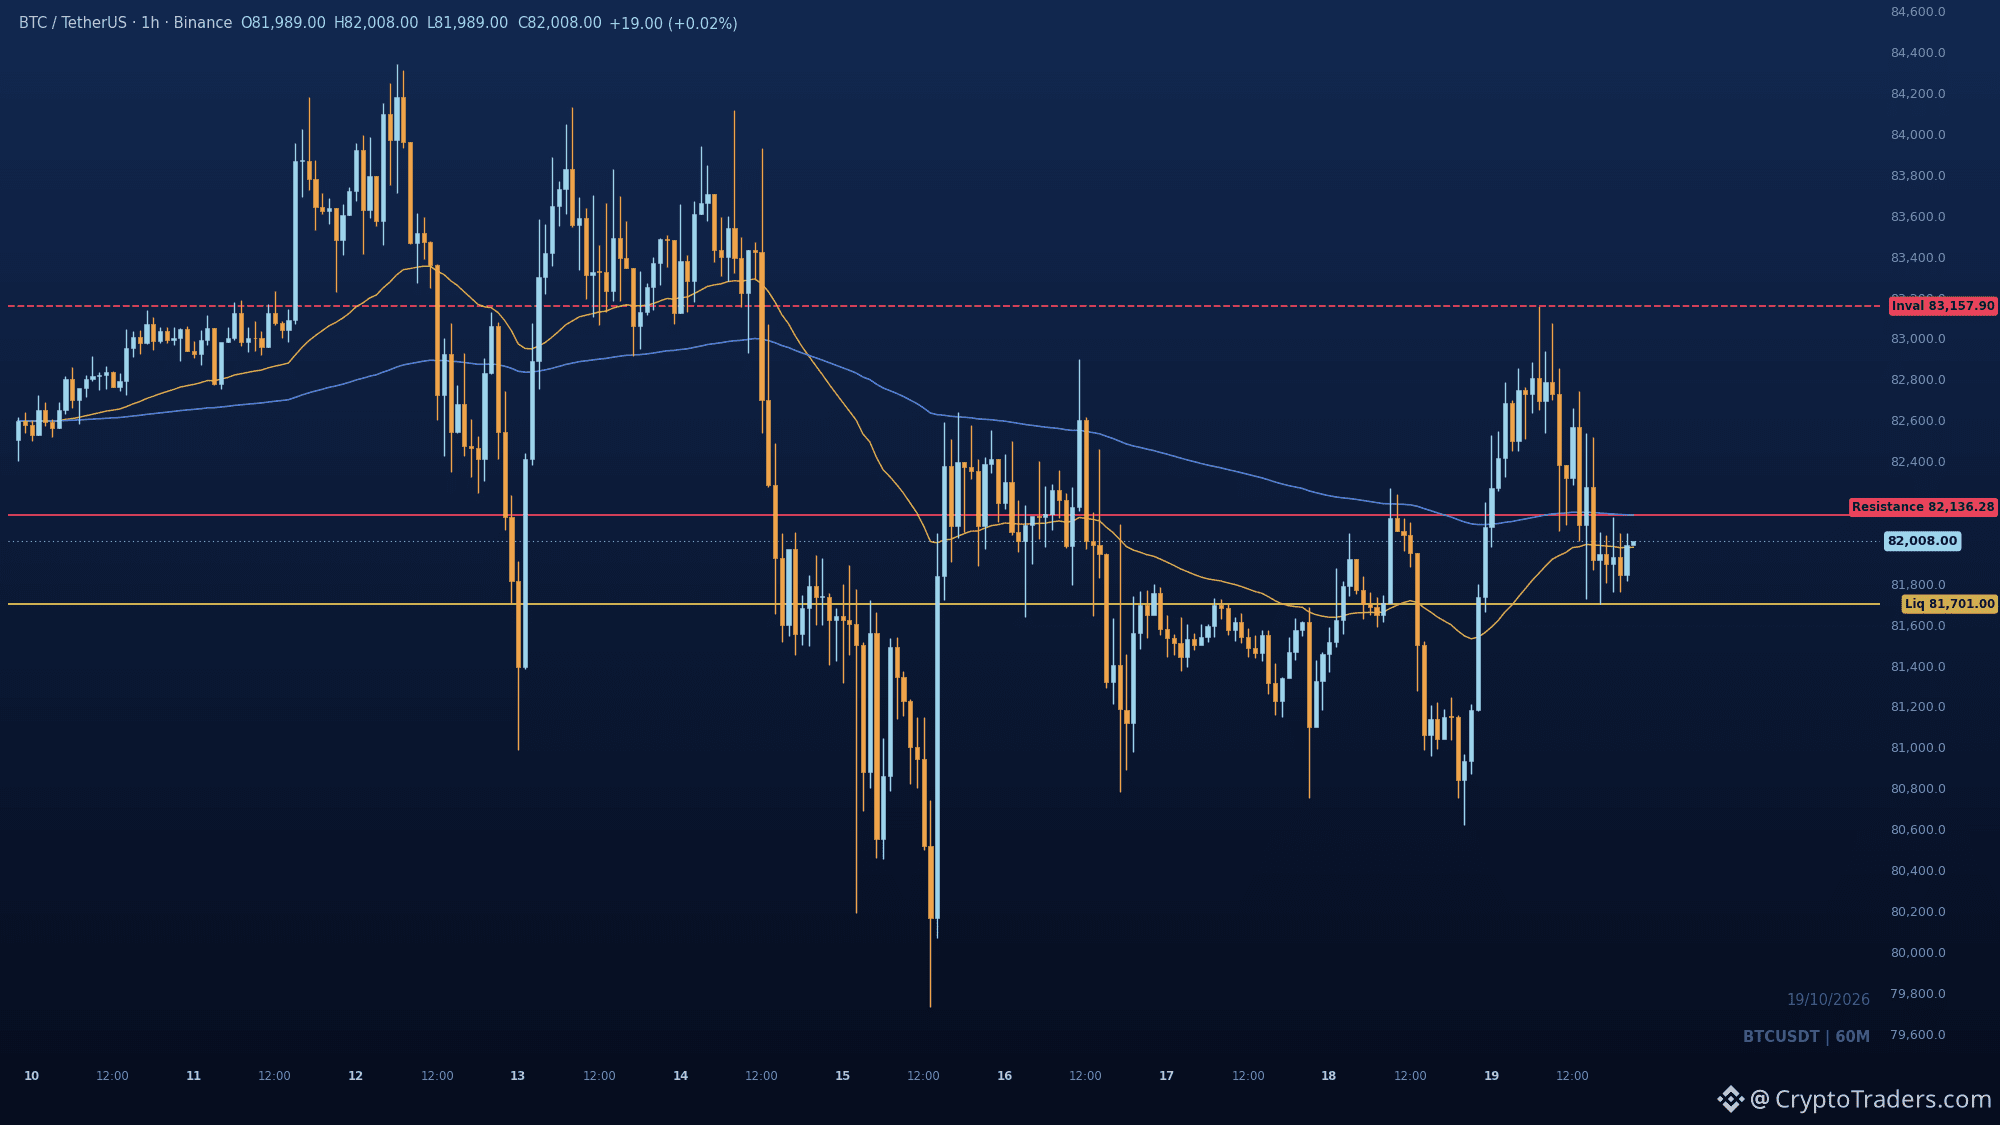
A Strategy está a transferir discretamente capital das compras de $BTC para as suas próprias ações preferenciais 📉 1⃣ Recompras em vez de acumulação: a Strategy gastou 193,1 milhões na recompra de ações preferenciais STRC entre 12 e 18 de outubro, enquanto comprou apenas 267 BTC por 22,1 milhões. Os custos de financiamento e a gestão de passivos estão agora a absorver mais capital do que a acumulação de novos ativos. 2⃣ Fluxos de ETFs divididos: os ETFs de Bitcoin à vista dos EUA registaram entradas líquidas de 526,7 milhões em 19 de outubro, lideradas pelo IBIT da BlackRock, mas os fluxos acumulados de 5 a 19 de outubro continuam negativos em 380,6 milhões. Uma sessão forte não reverte duas semanas de saídas, e as criações de unidades nem sempre correspondem a novas compras à vista. 3⃣ Mesmo assim, o preço mantém-se: o BTC está nos 82.847, com uma subida de 0,9 por cento no dia, apesar de o maior detentor empresarial estar a abrandar as compras e de os fluxos dos ETFs continuarem líquidos negativos ao longo das duas semanas. A história da procura é mais fraca do que sugere o título sobre as entradas, e o preço ainda não reflete isso. Que sinal importa mais neste caso: os dados dos ETFs de um único dia ou as saídas acumuladas ao longo de duas semanas? Todos os dias, a comunidade recebe mais análises como esta; a minha bio indica como participar. #Análise do preço do BTC# #Previsão do preço do Bitcoin: qual será o próximo movimento do Bitcoin?# #Análises macroeconómicas#
A Strategy está a transferir discretamente capital das compras de $BTC para as suas próprias ações preferenciais 📉 1⃣ Recompras em vez de acumulação: a Strategy gastou 193,1 milhões na recompra de ações preferenciais STRC entre 12 e 18 de outubro, enquanto comprou apenas 267 BTC por 22,1 milhões. Os custos de financiamento e a gestão de passivos estão agora a absorver mais capital do que a acumulação de novos ativos. 2⃣ Fluxos de ETFs divididos: os ETFs de Bitcoin à vista dos EUA registaram entradas líquidas de 526,7 milhões em 19 de outubro, lideradas pelo IBIT da BlackRock, mas os fluxos acumulados de 5 a 19 de outubro continuam negativos em 380,6 milhões. Uma sessão forte não reverte duas semanas de saídas, e as criações de unidades nem sempre correspondem a novas compras à vista. 3⃣ Mesmo assim, o preço mantém-se: o BTC está nos 82.847, com uma subida de 0,9 por cento no dia, apesar de o maior detentor empresarial estar a abrandar as compras e de os fluxos dos ETFs continuarem líquidos negativos ao longo das duas semanas. A história da procura é mais fraca do que sugere o título sobre as entradas, e o preço ainda não reflete isso. Que sinal importa mais neste caso: os dados dos ETFs de um único dia ou as saídas acumuladas ao longo de duas semanas? Todos os dias, a comunidade recebe mais análises como esta; a minha bio indica como participar. #Análise do preço do BTC# #Previsão do preço do Bitcoin: qual será o próximo movimento do Bitcoin?# #Análises macroeconómicas#
5
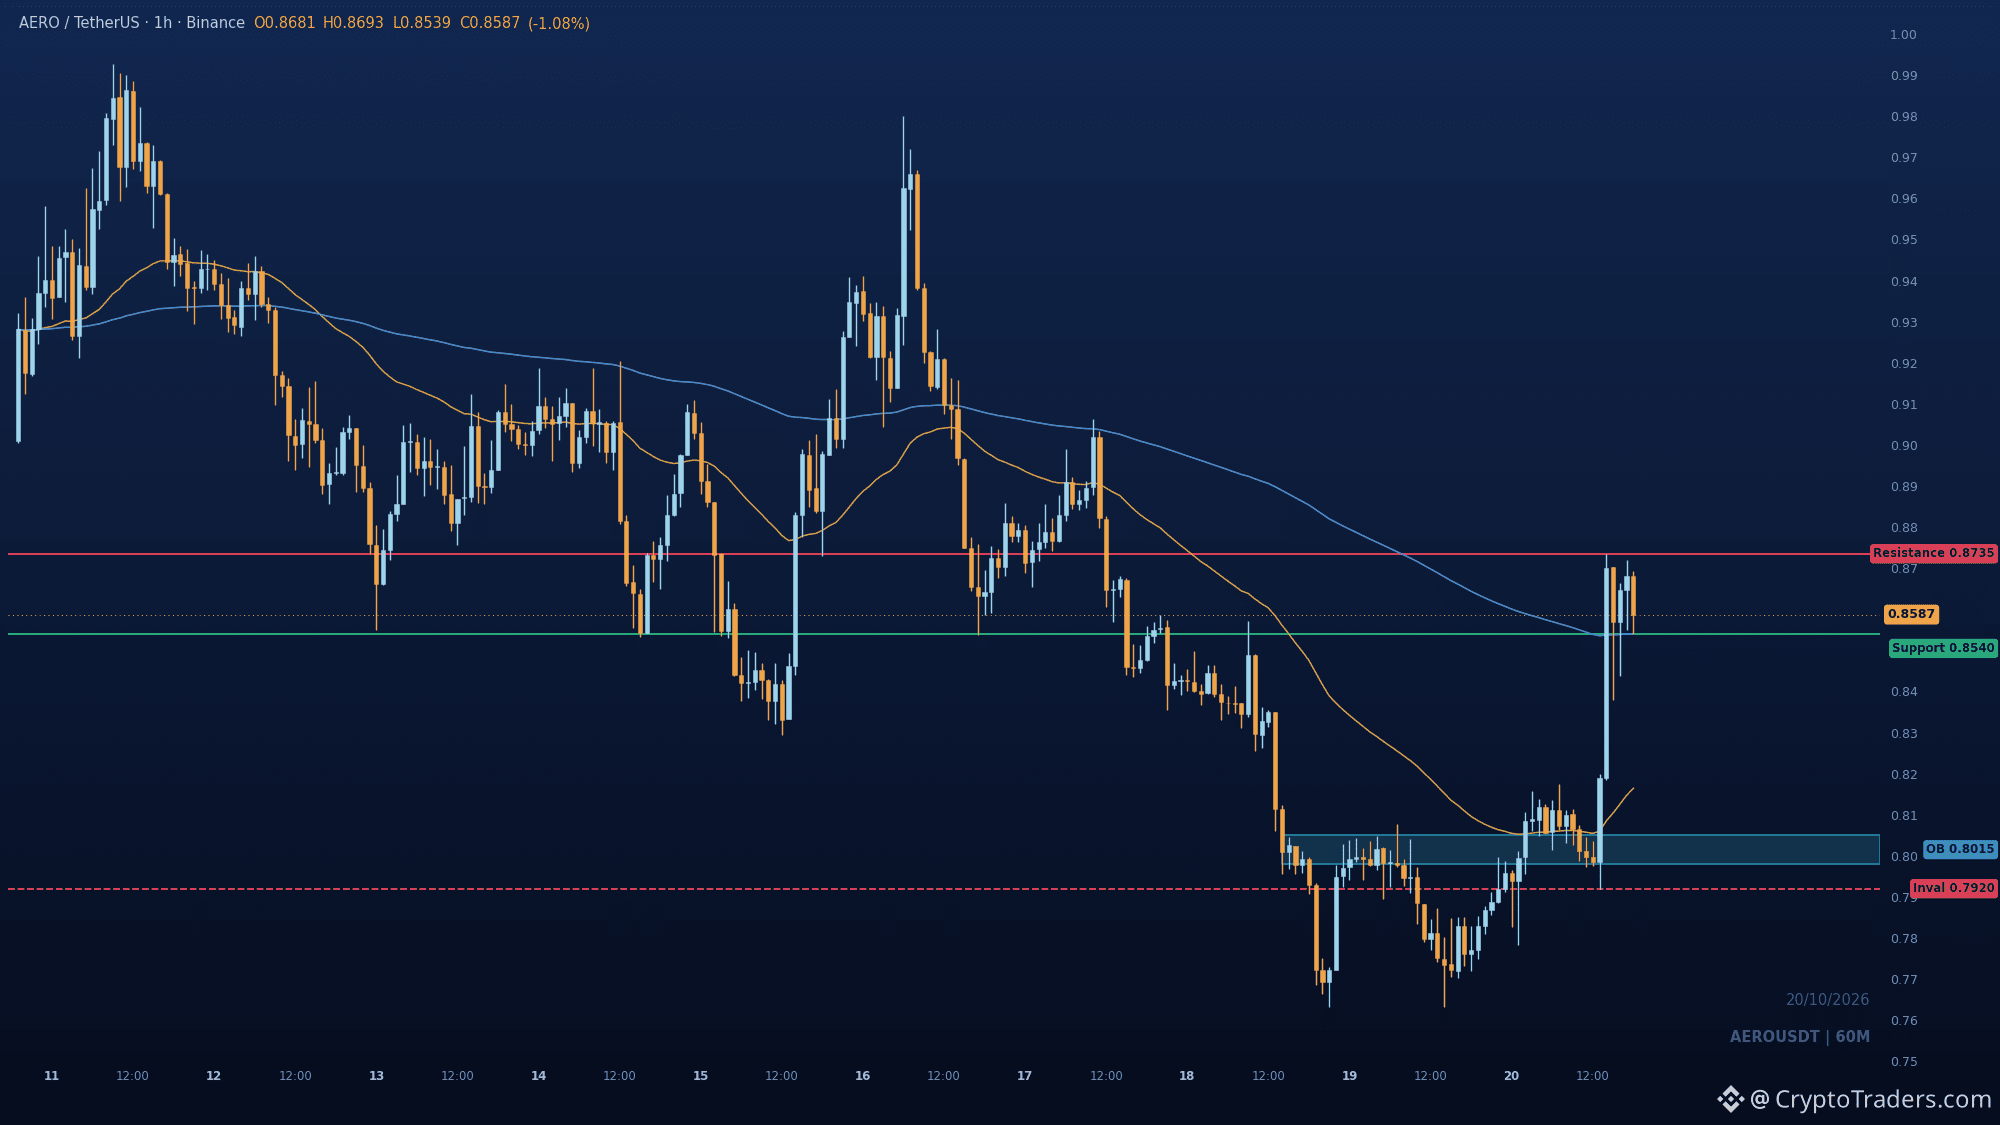
$AERO está preso entre a máxima do swing em 0.8735 e a EMA lenta em 0.854, e o mercado precisa escolher qual cede primeiro. Esse nível de 0.8735 já rejeitou o preço uma vez neste período, então um segundo teste será o sinal decisivo. Depois da varrida em 0.7633, os compradores recuperaram terreno acima da EMA rápida e estagnaram logo abaixo dessa máxima. Um recuo para a faixa de 0.854 a 0.816 que se mantenha daria espaço para um novo teste; perder 0.792 rompe o CHoCH de alta. Qual lado de 0.8735 você acha que cede primeiro? Mais análises como esta chegam diariamente ao grupo; confira os detalhes na minha bio. #Temporada das altcoins#
$AERO está preso entre a máxima do swing em 0.8735 e a EMA lenta em 0.854, e o mercado precisa escolher qual cede primeiro. Esse nível de 0.8735 já rejeitou o preço uma vez neste período, então um segundo teste será o sinal decisivo. Depois da varrida em 0.7633, os compradores recuperaram terreno acima da EMA rápida e estagnaram logo abaixo dessa máxima. Um recuo para a faixa de 0.854 a 0.816 que se mantenha daria espaço para um novo teste; perder 0.792 rompe o CHoCH de alta. Qual lado de 0.8735 você acha que cede primeiro? Mais análises como esta chegam diariamente ao grupo; confira os detalhes na minha bio. #Temporada das altcoins#
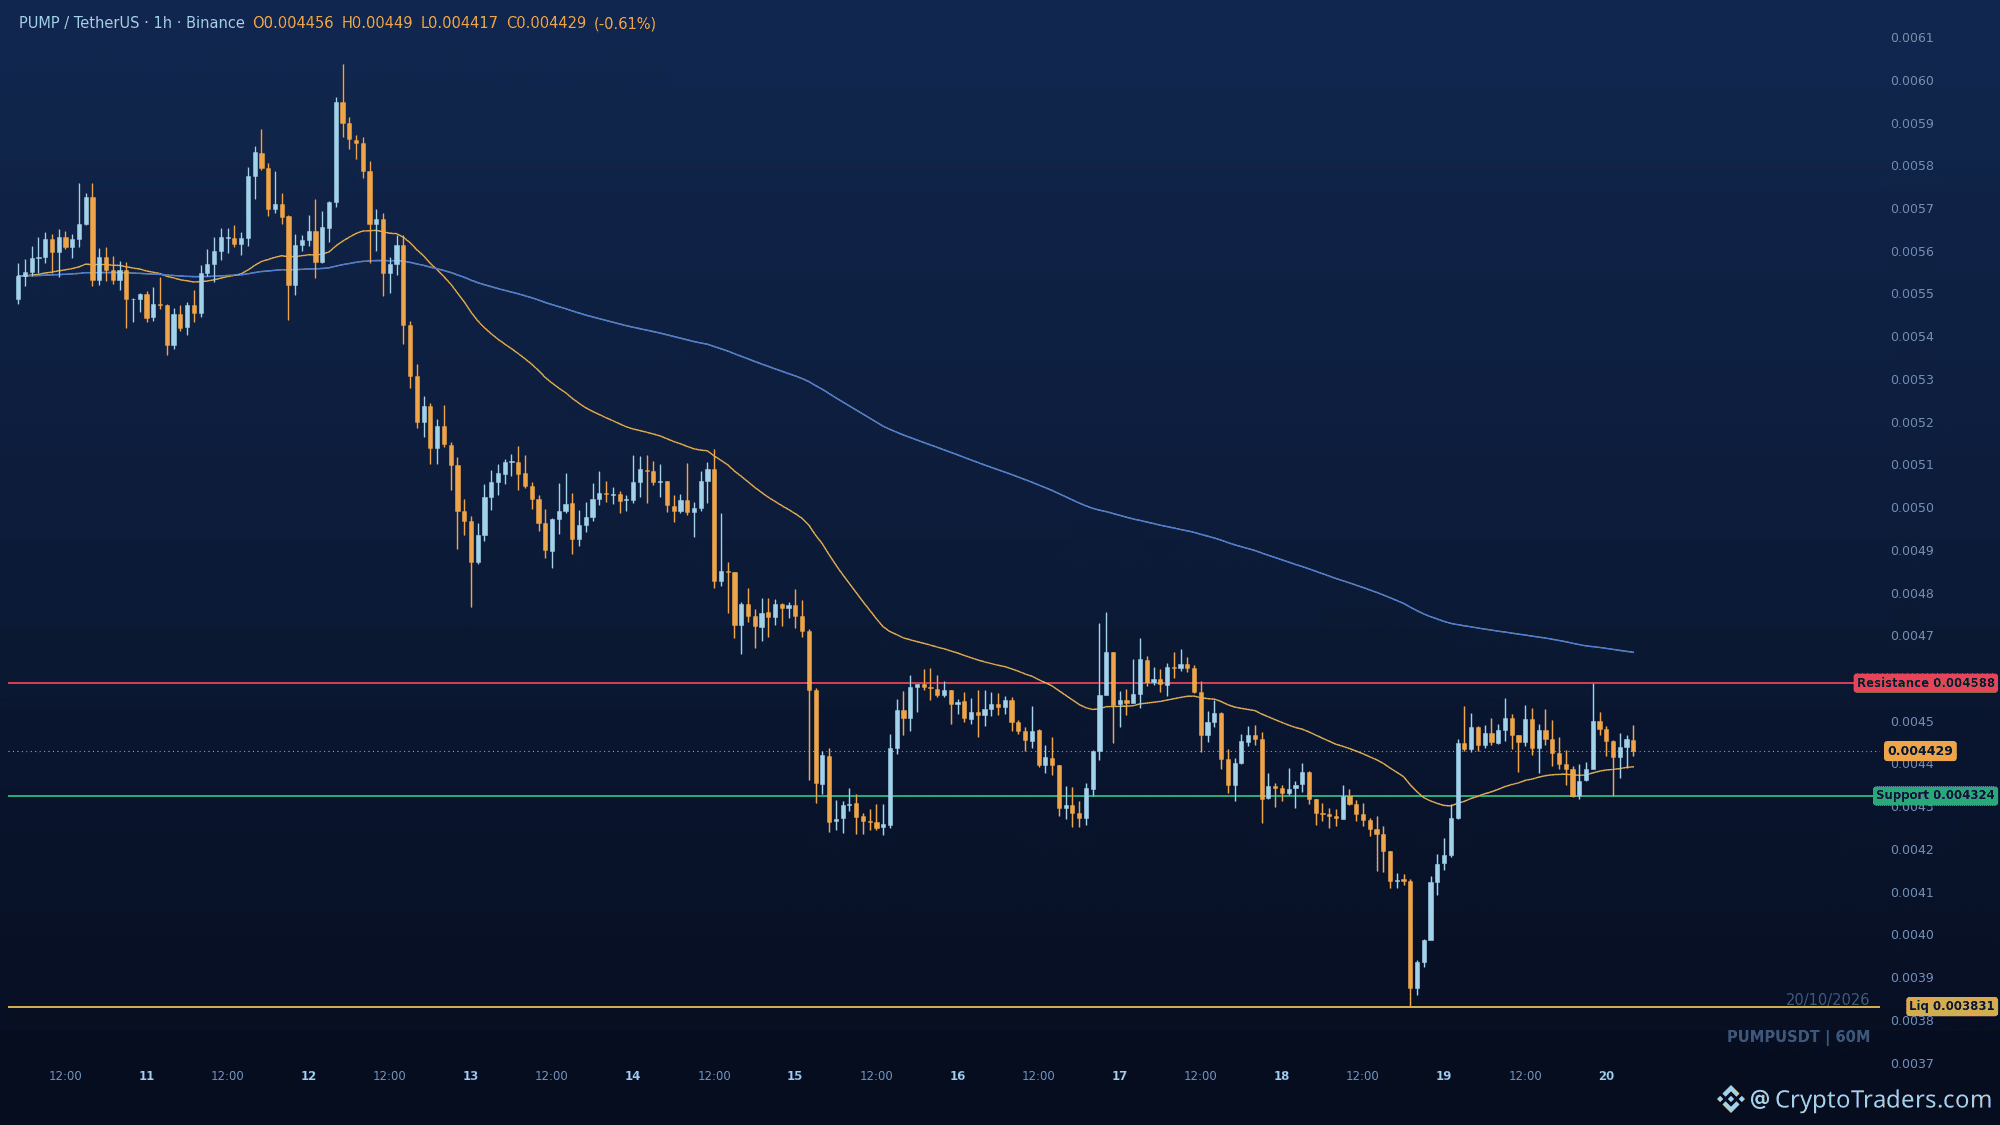
$PUMP varreu a mínima da faixa e reagiu, mas a máxima de poucas horas atrás continua intacta — e essa é a anomalia aqui. O gráfico de 1h segue formando máximas mais baixas, o preço está abaixo da EMA 200, e essa recuperação parou bem antes de 0.004588. A máxima de oscilação em 0.004588 é o nível-chave. Se recuperar esse nível, a sequência de máximas mais baixas finalmente se rompe; se for rejeitado ali, é provável que os vendedores tentem levar o preço de volta a 0.004324. Se perder 0.004324, a mínima varrida em 0.003831 volta a entrar em jogo como a próxima zona de liquidez vendedora. Quanto tempo você acha que essa recuperação vai durar antes de perder força? Mais setups como este aparecem diariamente no grupo. O link para entrar está na bio. #TemporadaDasAltcoins#
$PUMP varreu a mínima da faixa e reagiu, mas a máxima de poucas horas atrás continua intacta — e essa é a anomalia aqui. O gráfico de 1h segue formando máximas mais baixas, o preço está abaixo da EMA 200, e essa recuperação parou bem antes de 0.004588. A máxima de oscilação em 0.004588 é o nível-chave. Se recuperar esse nível, a sequência de máximas mais baixas finalmente se rompe; se for rejeitado ali, é provável que os vendedores tentem levar o preço de volta a 0.004324. Se perder 0.004324, a mínima varrida em 0.003831 volta a entrar em jogo como a próxima zona de liquidez vendedora. Quanto tempo você acha que essa recuperação vai durar antes de perder força? Mais setups como este aparecem diariamente no grupo. O link para entrar está na bio. #TemporadaDasAltcoins#
29
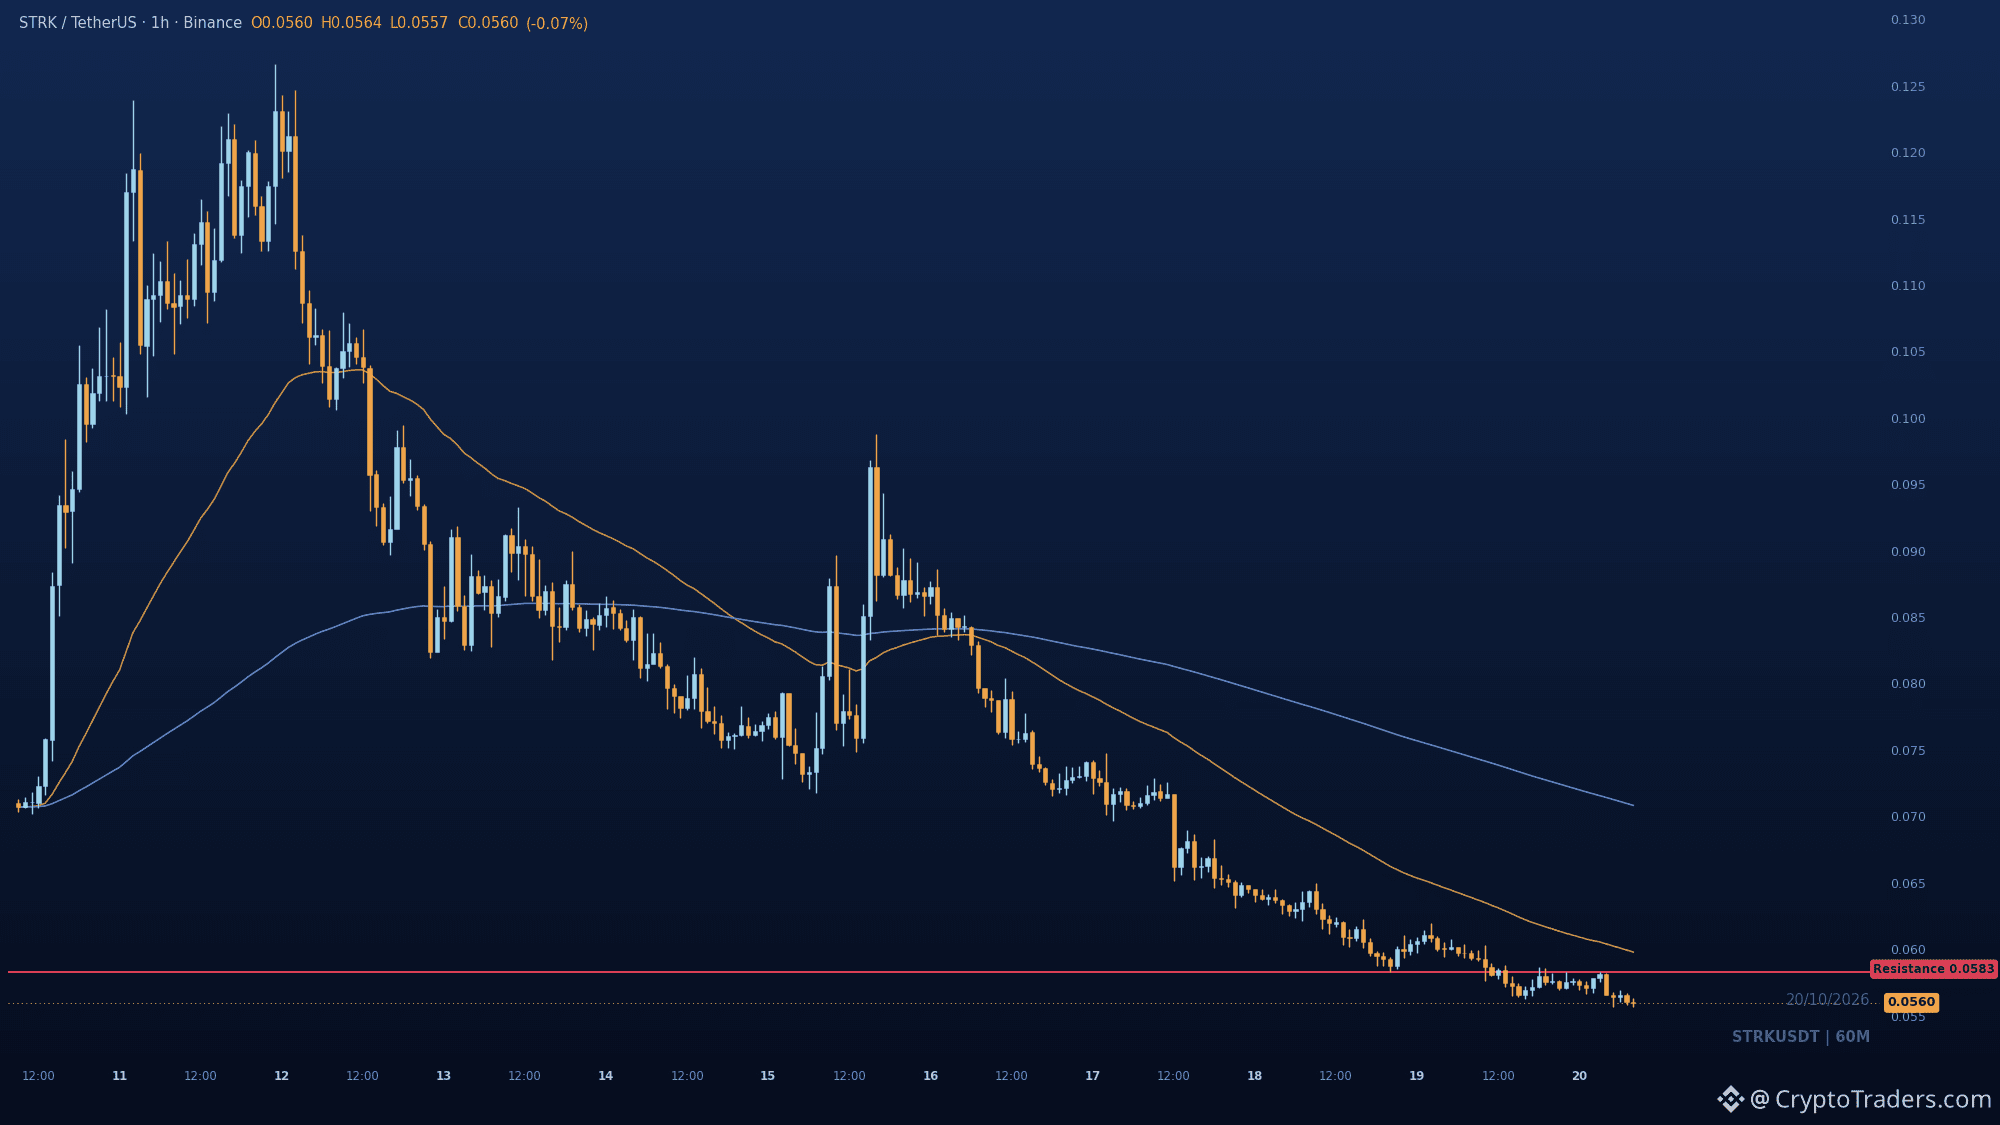
$STRK está num impasse entre a mínima do intervalo em 0.05568 e a máxima de oscilação em 0.0583, e o mercado precisa escolher um lado. Cada repique nesta sessão parou abaixo das duas EMAs, formando mais uma máxima descendente. Perder 0.05568 coloca o preço em território desconhecido, sem nenhum suporte abaixo — é aí que os detentores sentem mais dor. Recuperar 0.0583 é a única coisa que invalida a leitura de baixa. Quem ainda está comprado aqui, qual é o seu limite? Todas as manhãs, analisamos com a comunidade configurações como esta; confira os detalhes no perfil. #Temporada das Altcoins#
$STRK está num impasse entre a mínima do intervalo em 0.05568 e a máxima de oscilação em 0.0583, e o mercado precisa escolher um lado. Cada repique nesta sessão parou abaixo das duas EMAs, formando mais uma máxima descendente. Perder 0.05568 coloca o preço em território desconhecido, sem nenhum suporte abaixo — é aí que os detentores sentem mais dor. Recuperar 0.0583 é a única coisa que invalida a leitura de baixa. Quem ainda está comprado aqui, qual é o seu limite? Todas as manhãs, analisamos com a comunidade configurações como esta; confira os detalhes no perfil. #Temporada das Altcoins#
25
Os ETFs de Bitcoin perderam 614,7 milhões, enquanto o $BTC ainda subiu 1,4%, e essa diferença conta a verdadeira história 📊
1⃣ **Os fluxos favorecem o BTC em relação ao ETH**
Os ETFs spot de Ether dos EUA perderam 924,5 milhões entre 1 e 16 de outubro, mais do que eliminando os 825,3 milhões que receberam em setembro, com resgates em 11 de 12 sessões. Os fundos de Bitcoin perderam 614,7 milhões, mas mantiveram a maior parte dos 2,65 bilhões recebidos em setembro. Isso mostra que a demanda institucional está arrefecendo de forma desigual e que o BTC está em posição mais forte.
2⃣ **O risco de custódia passa para o hardware**
Segundo relatos, um Ledger Nano X comprado de um varejista alemão foi encontrado com um implante capaz de ler e transmitir as palavras de recuperação durante a configuração, e a verificação de autenticidade do dispositivo pode não detectá-lo. Isso representa um problema na cadeia de suprimentos para a confiança na autocustódia, não uma questão de preço — pelo menos por enquanto.
3⃣ **Lacunas de liquidez se escondem nos pools de staking**
A Papertrade pagou 2,12 milhões aos participantes do staking, mas os fundos próprios, após os lucros em aberto, ficaram em 4,22 milhões, contra um saldo de 4,91 milhões no pool de liquidez. Nenhum déficit foi relatado, embora os pagamentos possam entrar em fila se os traders vencedores retirarem mais USDC do que há disponível.
A resiliência do preço é real, mas a divergência nos fluxos e as notícias sobre custódia indicam que a convicção é menor do que o candle verde sugere.
O que importa mais para o próximo movimento: os fluxos dos ETFs ou a confiança na autocustódia?
Um conjunto de gráficos mais completo como este é publicado no grupo todos os dias, e a minha bio mostra o caminho.
#Análise do preço do BTC#
#Previsão do preço do Bitcoin: qual será o próximo movimento do Bitcoin?#
#Análises macroeconômicas#
Os ETFs de Bitcoin perderam 614,7 milhões, enquanto o $BTC ainda subiu 1,4%, e essa diferença conta a verdadeira história 📊
1⃣ **Os fluxos favorecem o BTC em relação ao ETH**
Os ETFs spot de Ether dos EUA perderam 924,5 milhões entre 1 e 16 de outubro, mais do que eliminando os 825,3 milhões que receberam em setembro, com resgates em 11 de 12 sessões. Os fundos de Bitcoin perderam 614,7 milhões, mas mantiveram a maior parte dos 2,65 bilhões recebidos em setembro. Isso mostra que a demanda institucional está arrefecendo de forma desigual e que o BTC está em posição mais forte.
2⃣ **O risco de custódia passa para o hardware**
Segundo relatos, um Ledger Nano X comprado de um varejista alemão foi encontrado com um implante capaz de ler e transmitir as palavras de recuperação durante a configuração, e a verificação de autenticidade do dispositivo pode não detectá-lo. Isso representa um problema na cadeia de suprimentos para a confiança na autocustódia, não uma questão de preço — pelo menos por enquanto.
3⃣ **Lacunas de liquidez se escondem nos pools de staking**
A Papertrade pagou 2,12 milhões aos participantes do staking, mas os fundos próprios, após os lucros em aberto, ficaram em 4,22 milhões, contra um saldo de 4,91 milhões no pool de liquidez. Nenhum déficit foi relatado, embora os pagamentos possam entrar em fila se os traders vencedores retirarem mais USDC do que há disponível.
A resiliência do preço é real, mas a divergência nos fluxos e as notícias sobre custódia indicam que a convicção é menor do que o candle verde sugere.
O que importa mais para o próximo movimento: os fluxos dos ETFs ou a confiança na autocustódia?
Um conjunto de gráficos mais completo como este é publicado no grupo todos os dias, e a minha bio mostra o caminho.
#Análise do preço do BTC#
#Previsão do preço do Bitcoin: qual será o próximo movimento do Bitcoin?#
#Análises macroeconômicas#
1⃣ **Os fluxos favorecem o BTC em relação ao ETH**
Os ETFs spot de Ether dos EUA perderam 924,5 milhões entre 1 e 16 de outubro, mais do que eliminando os 825,3 milhões que receberam em setembro, com resgates em 11 de 12 sessões. Os fundos de Bitcoin perderam 614,7 milhões, mas mantiveram a maior parte dos 2,65 bilhões recebidos em setembro. Isso mostra que a demanda institucional está arrefecendo de forma desigual e que o BTC está em posição mais forte.
2⃣ **O risco de custódia passa para o hardware**
Segundo relatos, um Ledger Nano X comprado de um varejista alemão foi encontrado com um implante capaz de ler e transmitir as palavras de recuperação durante a configuração, e a verificação de autenticidade do dispositivo pode não detectá-lo. Isso representa um problema na cadeia de suprimentos para a confiança na autocustódia, não uma questão de preço — pelo menos por enquanto.
3⃣ **Lacunas de liquidez se escondem nos pools de staking**
A Papertrade pagou 2,12 milhões aos participantes do staking, mas os fundos próprios, após os lucros em aberto, ficaram em 4,22 milhões, contra um saldo de 4,91 milhões no pool de liquidez. Nenhum déficit foi relatado, embora os pagamentos possam entrar em fila se os traders vencedores retirarem mais USDC do que há disponível.
A resiliência do preço é real, mas a divergência nos fluxos e as notícias sobre custódia indicam que a convicção é menor do que o candle verde sugere.
O que importa mais para o próximo movimento: os fluxos dos ETFs ou a confiança na autocustódia?
Um conjunto de gráficos mais completo como este é publicado no grupo todos os dias, e a minha bio mostra o caminho.
#Análise do preço do BTC#
#Previsão do preço do Bitcoin: qual será o próximo movimento do Bitcoin?#
#Análises macroeconômicas#
74
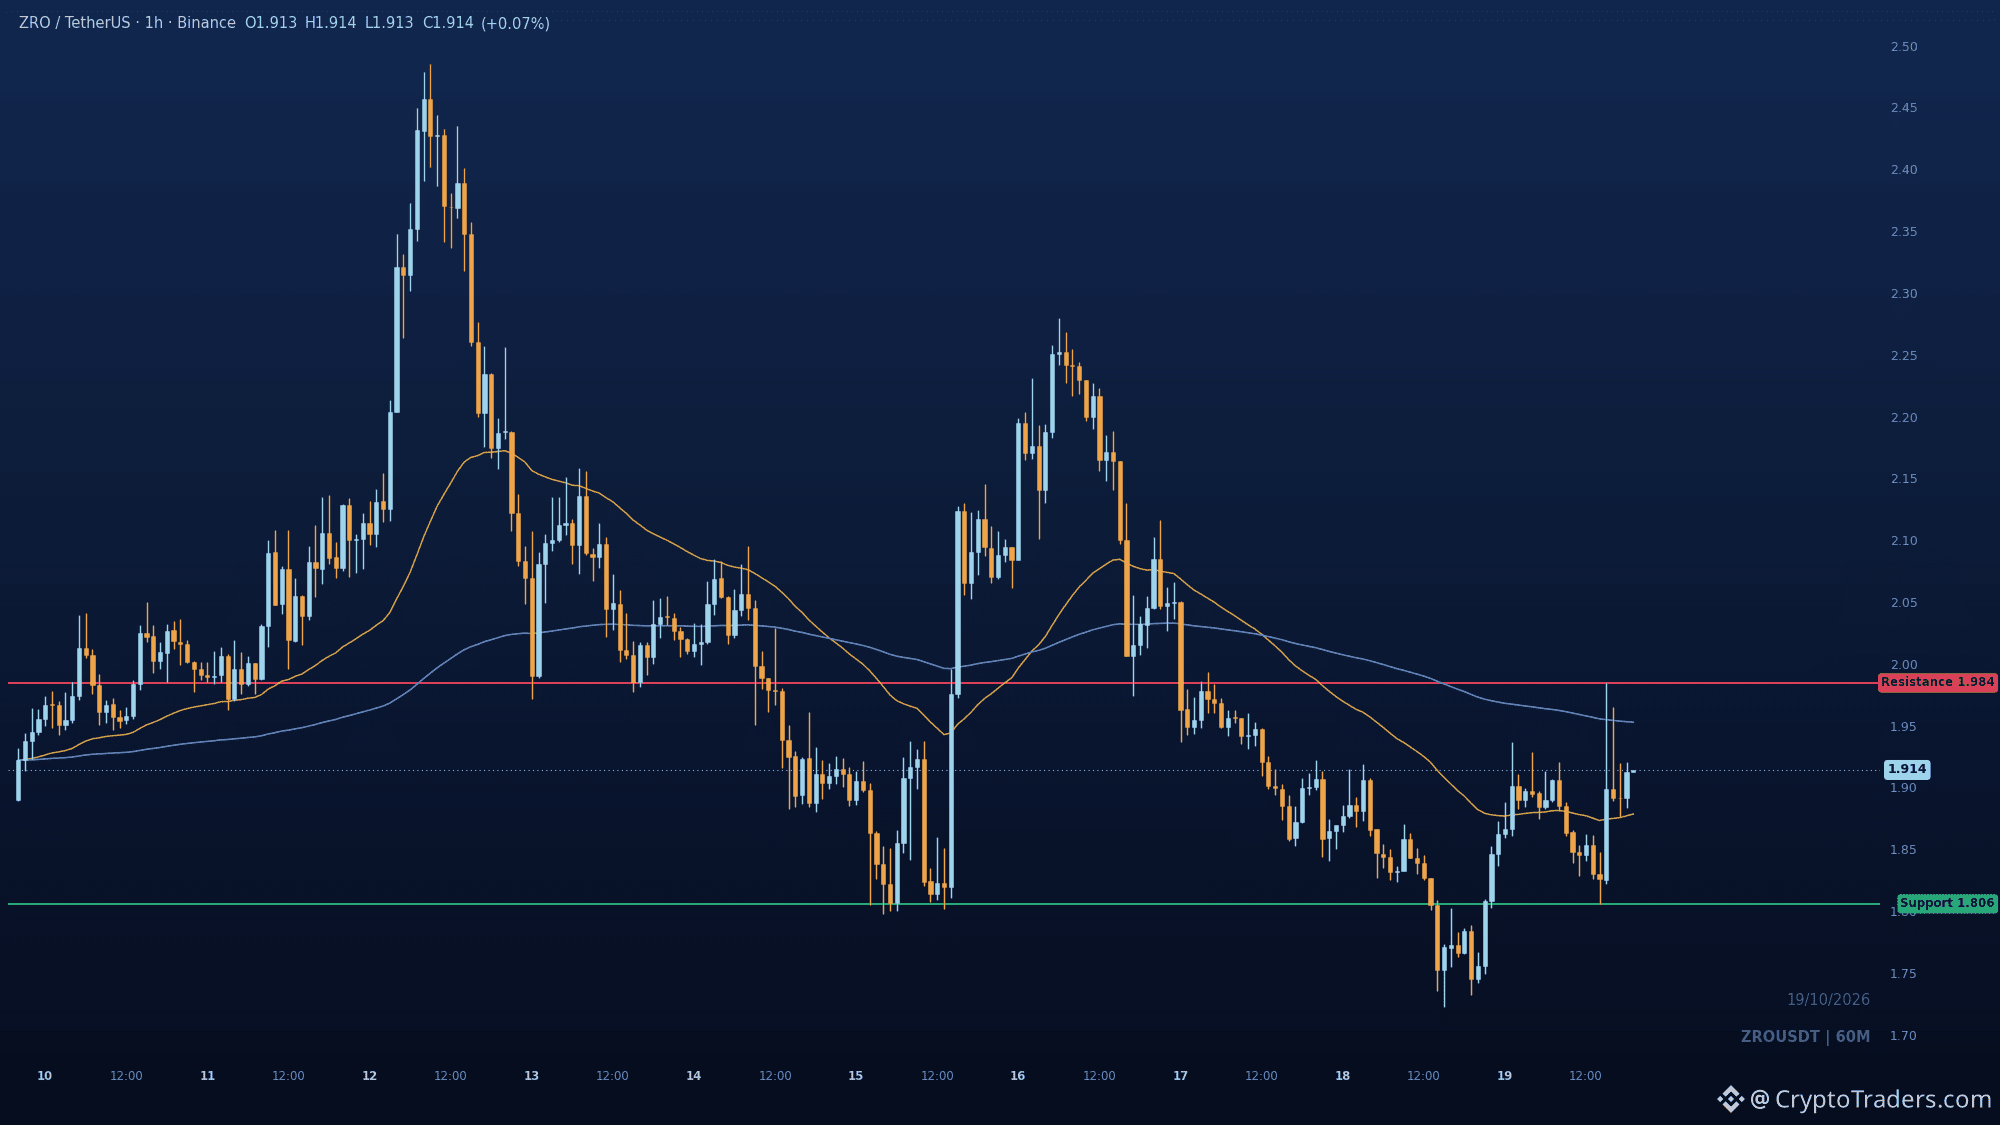
$ZRO varreu as mínimas em 1.74, recuperou a estrutura de curto prazo e agora está em alta de 7.2% no dia, mas a recuperação esbarra na oferta acima. O gráfico de 1h mostra um CHoCH de alta saindo da zona de desconto, enquanto a tendência mais ampla continua baixista e o preço está na metade inferior da faixa. O suporte principal está em 1.8058, a mínima recente. Manter-se acima desse nível mantém a recuperação em jogo. O alvo de alta é 1.9845, a máxima recente onde há liquidez compradora. Uma rejeição nesse nível favorece uma nova queda. O que vem primeiro para você: uma alta até 1.9845 ou uma queda abaixo de 1.8058? Mais análises como esta são publicadas diariamente no grupo. Link na bio. #Temporada das Altcoins#
$ZRO varreu as mínimas em 1.74, recuperou a estrutura de curto prazo e agora está em alta de 7.2% no dia, mas a recuperação esbarra na oferta acima. O gráfico de 1h mostra um CHoCH de alta saindo da zona de desconto, enquanto a tendência mais ampla continua baixista e o preço está na metade inferior da faixa. O suporte principal está em 1.8058, a mínima recente. Manter-se acima desse nível mantém a recuperação em jogo. O alvo de alta é 1.9845, a máxima recente onde há liquidez compradora. Uma rejeição nesse nível favorece uma nova queda. O que vem primeiro para você: uma alta até 1.9845 ou uma queda abaixo de 1.8058? Mais análises como esta são publicadas diariamente no grupo. Link na bio. #Temporada das Altcoins#
29
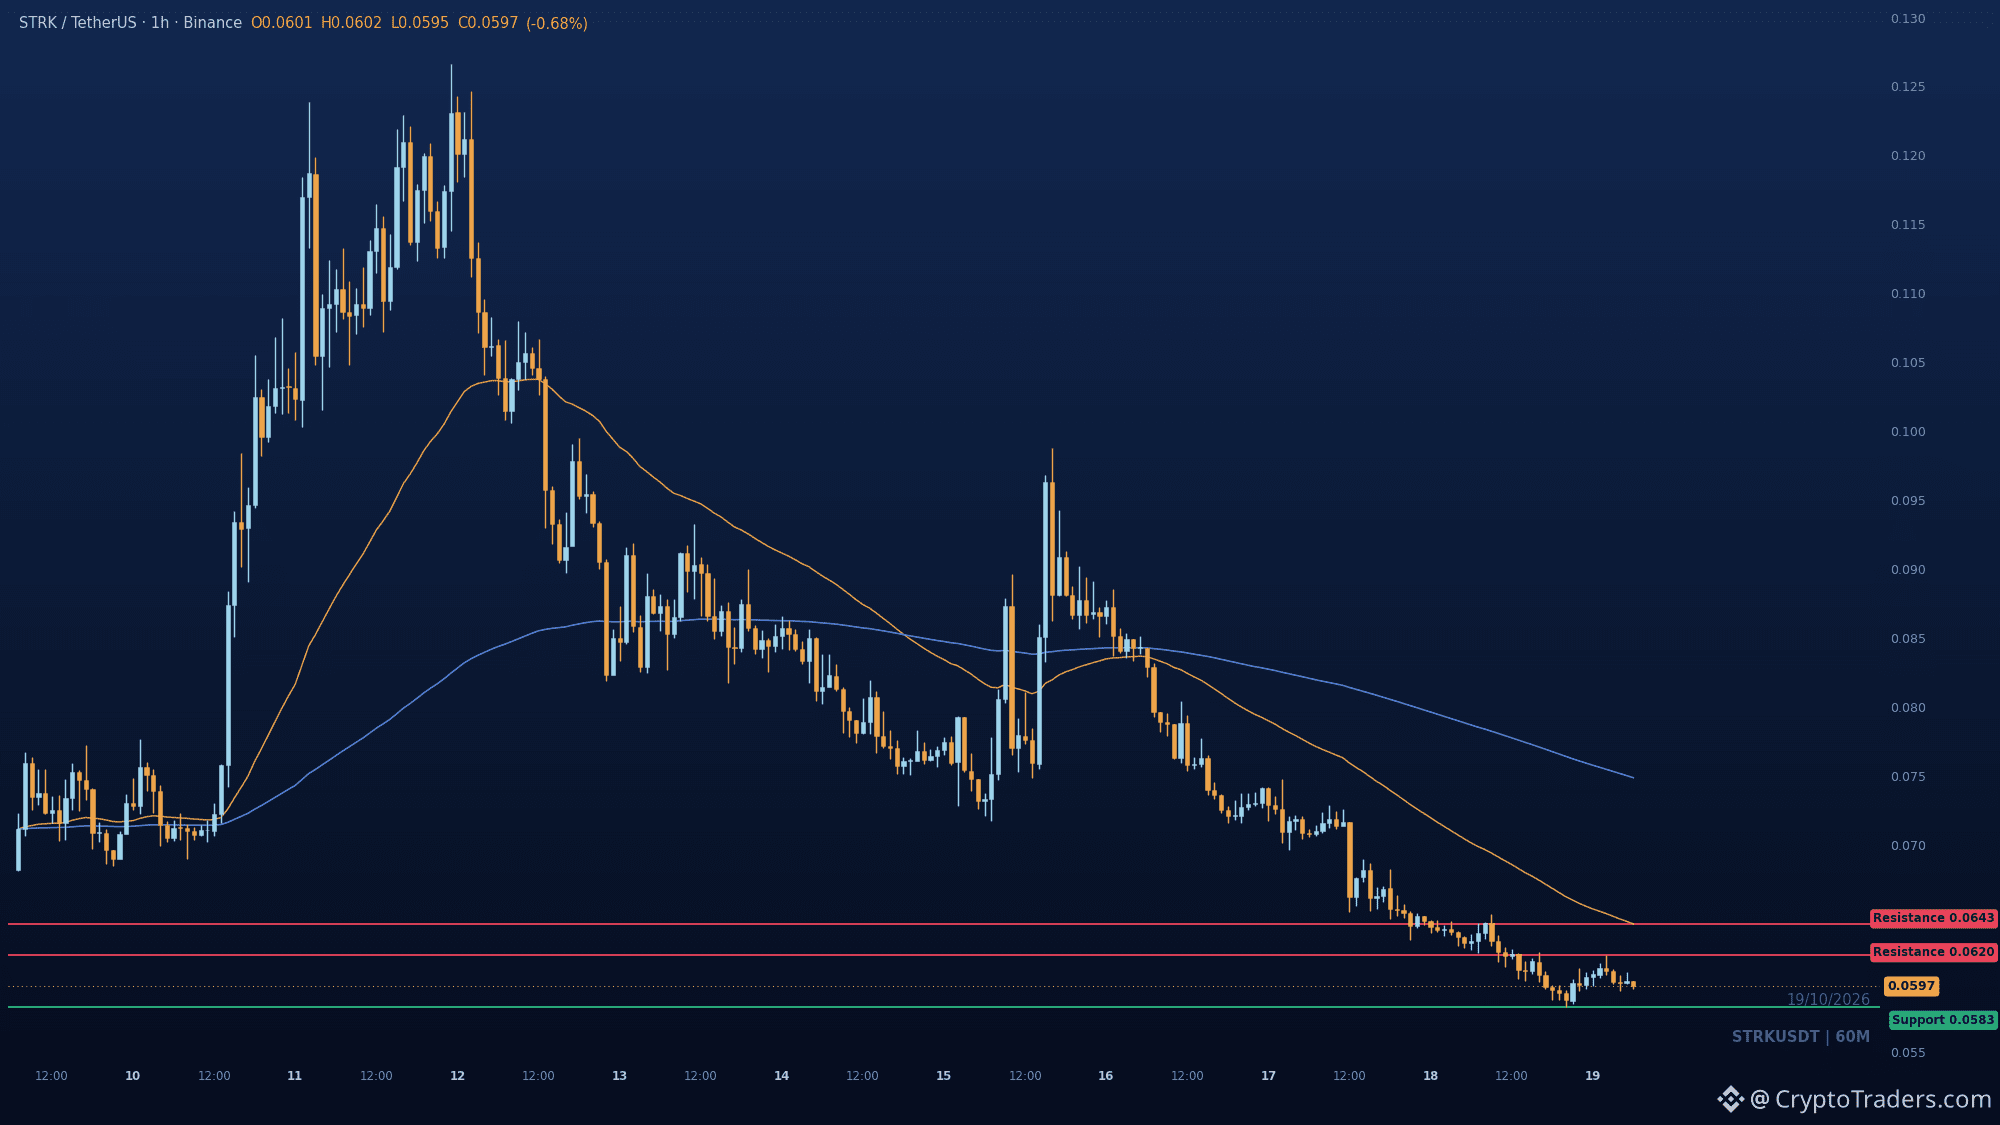
$STRK caiu até 0.05827 e está exatamente nesse nível, com queda de 5,3% no dia. A estrutura de 1h continua formando mínimas mais baixas, e o preço segue preso abaixo das duas EMAs, então a faixa está sendo negociada com desconto. Uma recuperação daqui provavelmente encontrará resistência primeiro em 0.06199, sendo 0.06426671 o verdadeiro limite decisivo. Se 0.05827 não se mantiver no próximo fechamento de 1h, há pouco suporte abaixo para segurar o preço. Quanto tempo você acha que o suporte em 0.05827 aguenta antes de ceder? Análises como esta são publicadas diariamente no grupo; o caminho para entrar está na bio. #Temporada das altcoins#
$STRK caiu até 0.05827 e está exatamente nesse nível, com queda de 5,3% no dia. A estrutura de 1h continua formando mínimas mais baixas, e o preço segue preso abaixo das duas EMAs, então a faixa está sendo negociada com desconto. Uma recuperação daqui provavelmente encontrará resistência primeiro em 0.06199, sendo 0.06426671 o verdadeiro limite decisivo. Se 0.05827 não se mantiver no próximo fechamento de 1h, há pouco suporte abaixo para segurar o preço. Quanto tempo você acha que o suporte em 0.05827 aguenta antes de ceder? Análises como esta são publicadas diariamente no grupo; o caminho para entrar está na bio. #Temporada das altcoins#
43
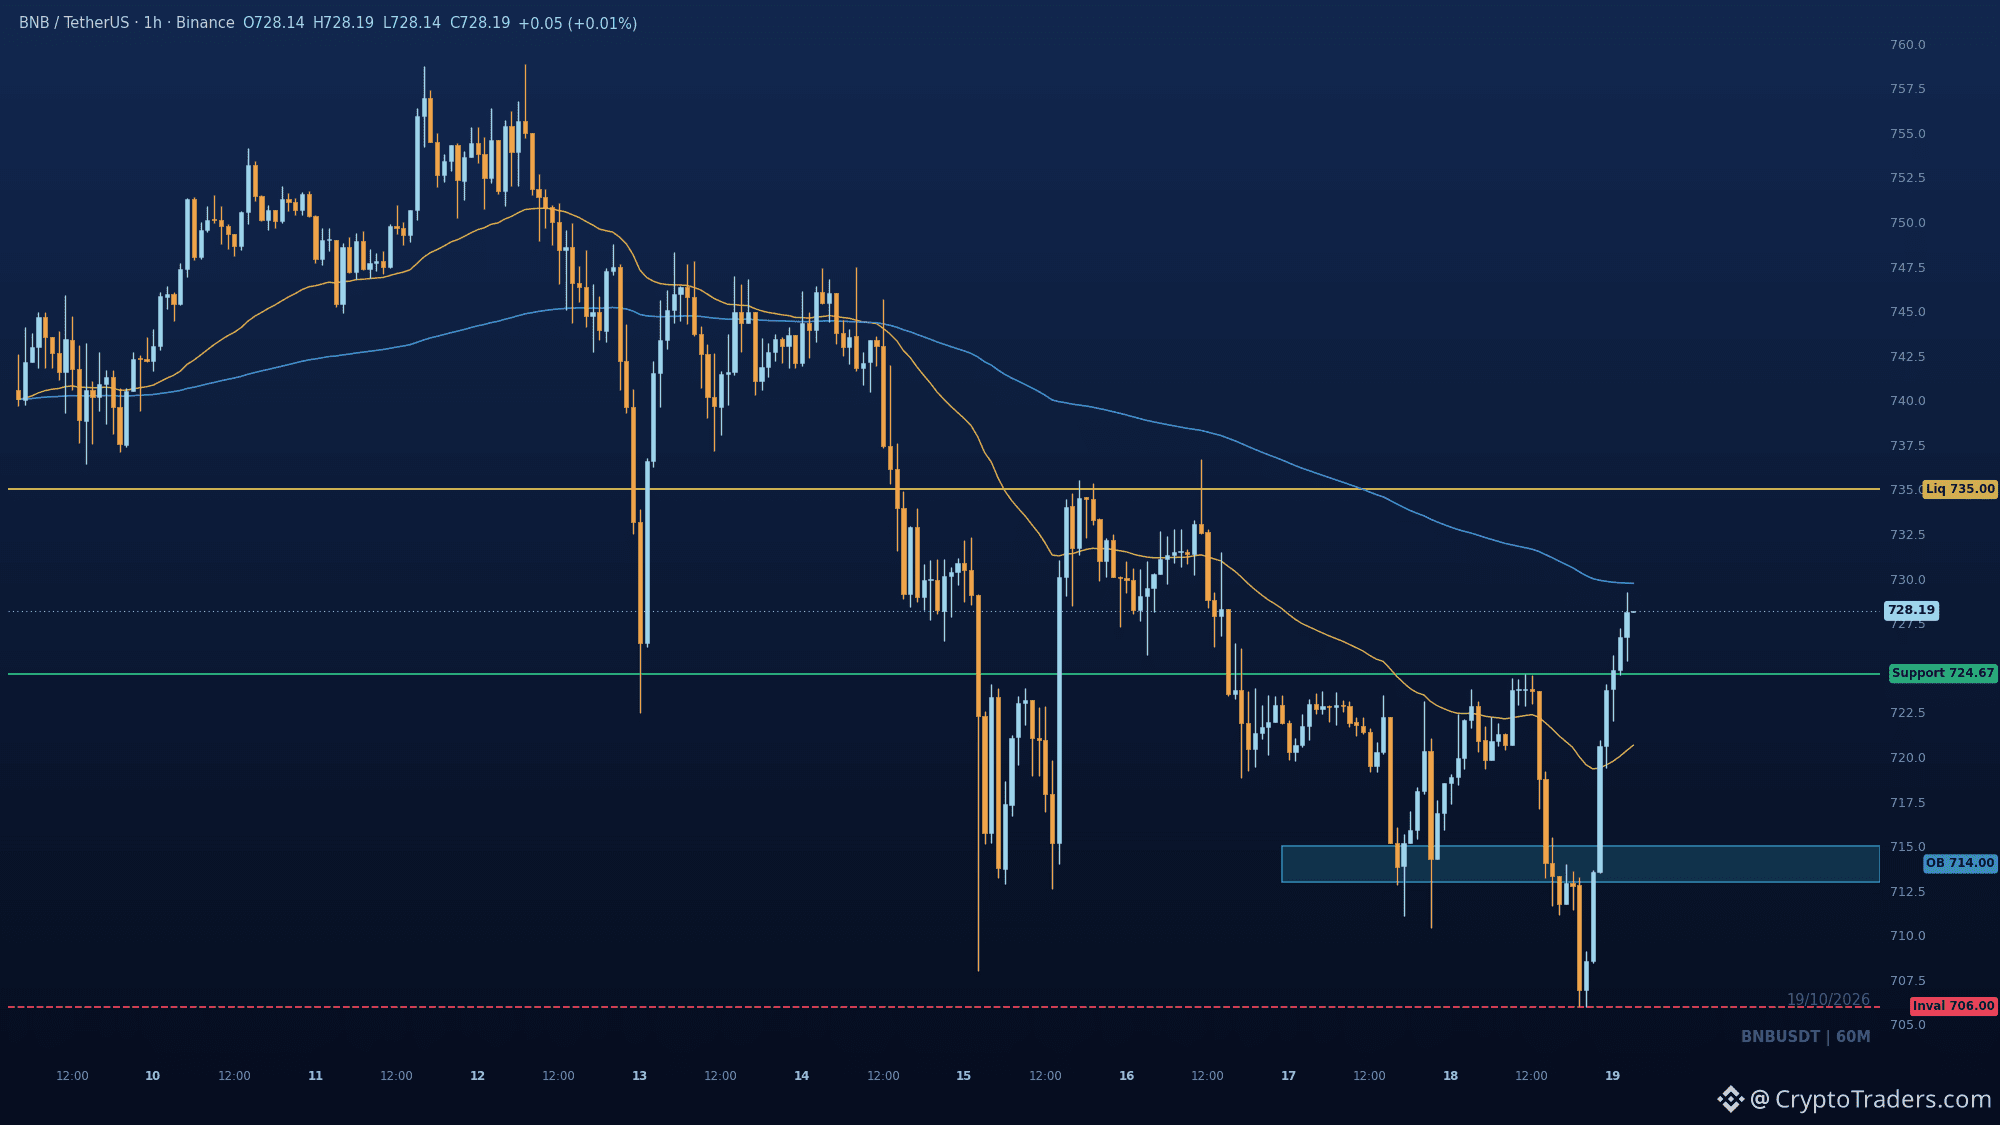
BNB mantém a recuperação de 724,67 enquanto uma exploração da Cysic afeta o sentimento em relação à BSC $BNB está a ser negociado perto de 727,75, com uma subida de 0,8% no dia, e o gráfico de uma hora revela mais do que sugere o valor em destaque. A quebra do nível 706,00 foi revertida e o anterior máximo oscilatório, em 724,67, foi recuperado — uma mudança de caráter altista nesse período. O contexto é misto. Rastreadores on-chain assinalaram a emissão não autorizada de 10 milhões de CYS na BNB Smart Chain a 17 de outubro, e a Cysic suspendeu a sua ponte entre cadeias em resposta. Cerca de 2,8 milhões de CYS permaneceram no endereço destinatário depois de este ter sido colocado na lista negra; o impacto em dólares ainda está a ser avaliado, e o projeto afirma que a mainnet e os ativos detidos pelos utilizadores não foram afetados. Os danos estão contidos, mas pesam sobre o sentimento em relação às infraestruturas da BNB Chain, e não sobre a própria BNB. O fator favorável é a atenção: ver a BNB na televisão nacional do Vietname, ao lado da BTC e da ETH, é o tipo de cobertura que atrai o interesse dos investidores de retalho. No gráfico: depois de varrer o mínimo de 706,00, o preço encontra-se na metade de desconto da faixa de negociação. O máximo oscilatório recuperado em 724,67 é o nível importante e, mesmo abaixo dele, um bloco de ordens estreito entre 713 e 715 assinala a base que desencadeou a recuperação. Espero que o novo teste de 724,67 seja defendido, seguido de uma subida até 735,00, onde o máximo da recuperação anterior concentra liquidez do lado comprador. Uma queda abaixo de 724,67 enfraquece esta mudança, e um fecho novamente abaixo de 706,00 invalida-a. O que observar: se 724,67 se mantém num novo teste, se a base entre 713 e 715 é tocada sem quebrar em baixa e qualquer movimento dos 2,8 milhões de CYS que permanecem no endereço colocado na lista negra. O que acontecerá primeiro: o novo teste de 724,67 ou a subida até à liquidez em 735,00? Publico análises de gráficos como esta diariamente no grupo; encontram o acesso na bio. #Temporada das Altcoins# #Perspetivas Macroeconómicas#
BNB mantém a recuperação de 724,67 enquanto uma exploração da Cysic afeta o sentimento em relação à BSC $BNB está a ser negociado perto de 727,75, com uma subida de 0,8% no dia, e o gráfico de uma hora revela mais do que sugere o valor em destaque. A quebra do nível 706,00 foi revertida e o anterior máximo oscilatório, em 724,67, foi recuperado — uma mudança de caráter altista nesse período. O contexto é misto. Rastreadores on-chain assinalaram a emissão não autorizada de 10 milhões de CYS na BNB Smart Chain a 17 de outubro, e a Cysic suspendeu a sua ponte entre cadeias em resposta. Cerca de 2,8 milhões de CYS permaneceram no endereço destinatário depois de este ter sido colocado na lista negra; o impacto em dólares ainda está a ser avaliado, e o projeto afirma que a mainnet e os ativos detidos pelos utilizadores não foram afetados. Os danos estão contidos, mas pesam sobre o sentimento em relação às infraestruturas da BNB Chain, e não sobre a própria BNB. O fator favorável é a atenção: ver a BNB na televisão nacional do Vietname, ao lado da BTC e da ETH, é o tipo de cobertura que atrai o interesse dos investidores de retalho. No gráfico: depois de varrer o mínimo de 706,00, o preço encontra-se na metade de desconto da faixa de negociação. O máximo oscilatório recuperado em 724,67 é o nível importante e, mesmo abaixo dele, um bloco de ordens estreito entre 713 e 715 assinala a base que desencadeou a recuperação. Espero que o novo teste de 724,67 seja defendido, seguido de uma subida até 735,00, onde o máximo da recuperação anterior concentra liquidez do lado comprador. Uma queda abaixo de 724,67 enfraquece esta mudança, e um fecho novamente abaixo de 706,00 invalida-a. O que observar: se 724,67 se mantém num novo teste, se a base entre 713 e 715 é tocada sem quebrar em baixa e qualquer movimento dos 2,8 milhões de CYS que permanecem no endereço colocado na lista negra. O que acontecerá primeiro: o novo teste de 724,67 ou a subida até à liquidez em 735,00? Publico análises de gráficos como esta diariamente no grupo; encontram o acesso na bio. #Temporada das Altcoins# #Perspetivas Macroeconómicas#
72
Ou o $XRP mantém 1.2949 e avança aos poucos de volta para 1.3036, ou esse suporte cede e 1.2553 volta a entrar no radar. A recuperação após a mínima varrida é real, mas a EMA 200 descendente ainda pesa sobre o preço, e a faixa segue em zona de desconto. 1.2949 é a EMA rápida, então observe como o primeiro recuo até ela se comporta. Um fechamento acima de 1.3036 enfraqueceria a leitura de continuação baixista e voltaria a colocar a máxima recente do swing em foco. Não conseguir defender 1.2949 mantém 1.2553 como alvo estrutural abaixo. Qual lado de 1.2949 você acha que será testado primeiro? Mais análises como esta são publicadas diariamente no grupo; o caminho para entrar está na minha bio. #Temporada das altcoins#
Ou o $XRP mantém 1.2949 e avança aos poucos de volta para 1.3036, ou esse suporte cede e 1.2553 volta a entrar no radar. A recuperação após a mínima varrida é real, mas a EMA 200 descendente ainda pesa sobre o preço, e a faixa segue em zona de desconto. 1.2949 é a EMA rápida, então observe como o primeiro recuo até ela se comporta. Um fechamento acima de 1.3036 enfraqueceria a leitura de continuação baixista e voltaria a colocar a máxima recente do swing em foco. Não conseguir defender 1.2949 mantém 1.2553 como alvo estrutural abaixo. Qual lado de 1.2949 você acha que será testado primeiro? Mais análises como esta são publicadas diariamente no grupo; o caminho para entrar está na minha bio. #Temporada das altcoins#
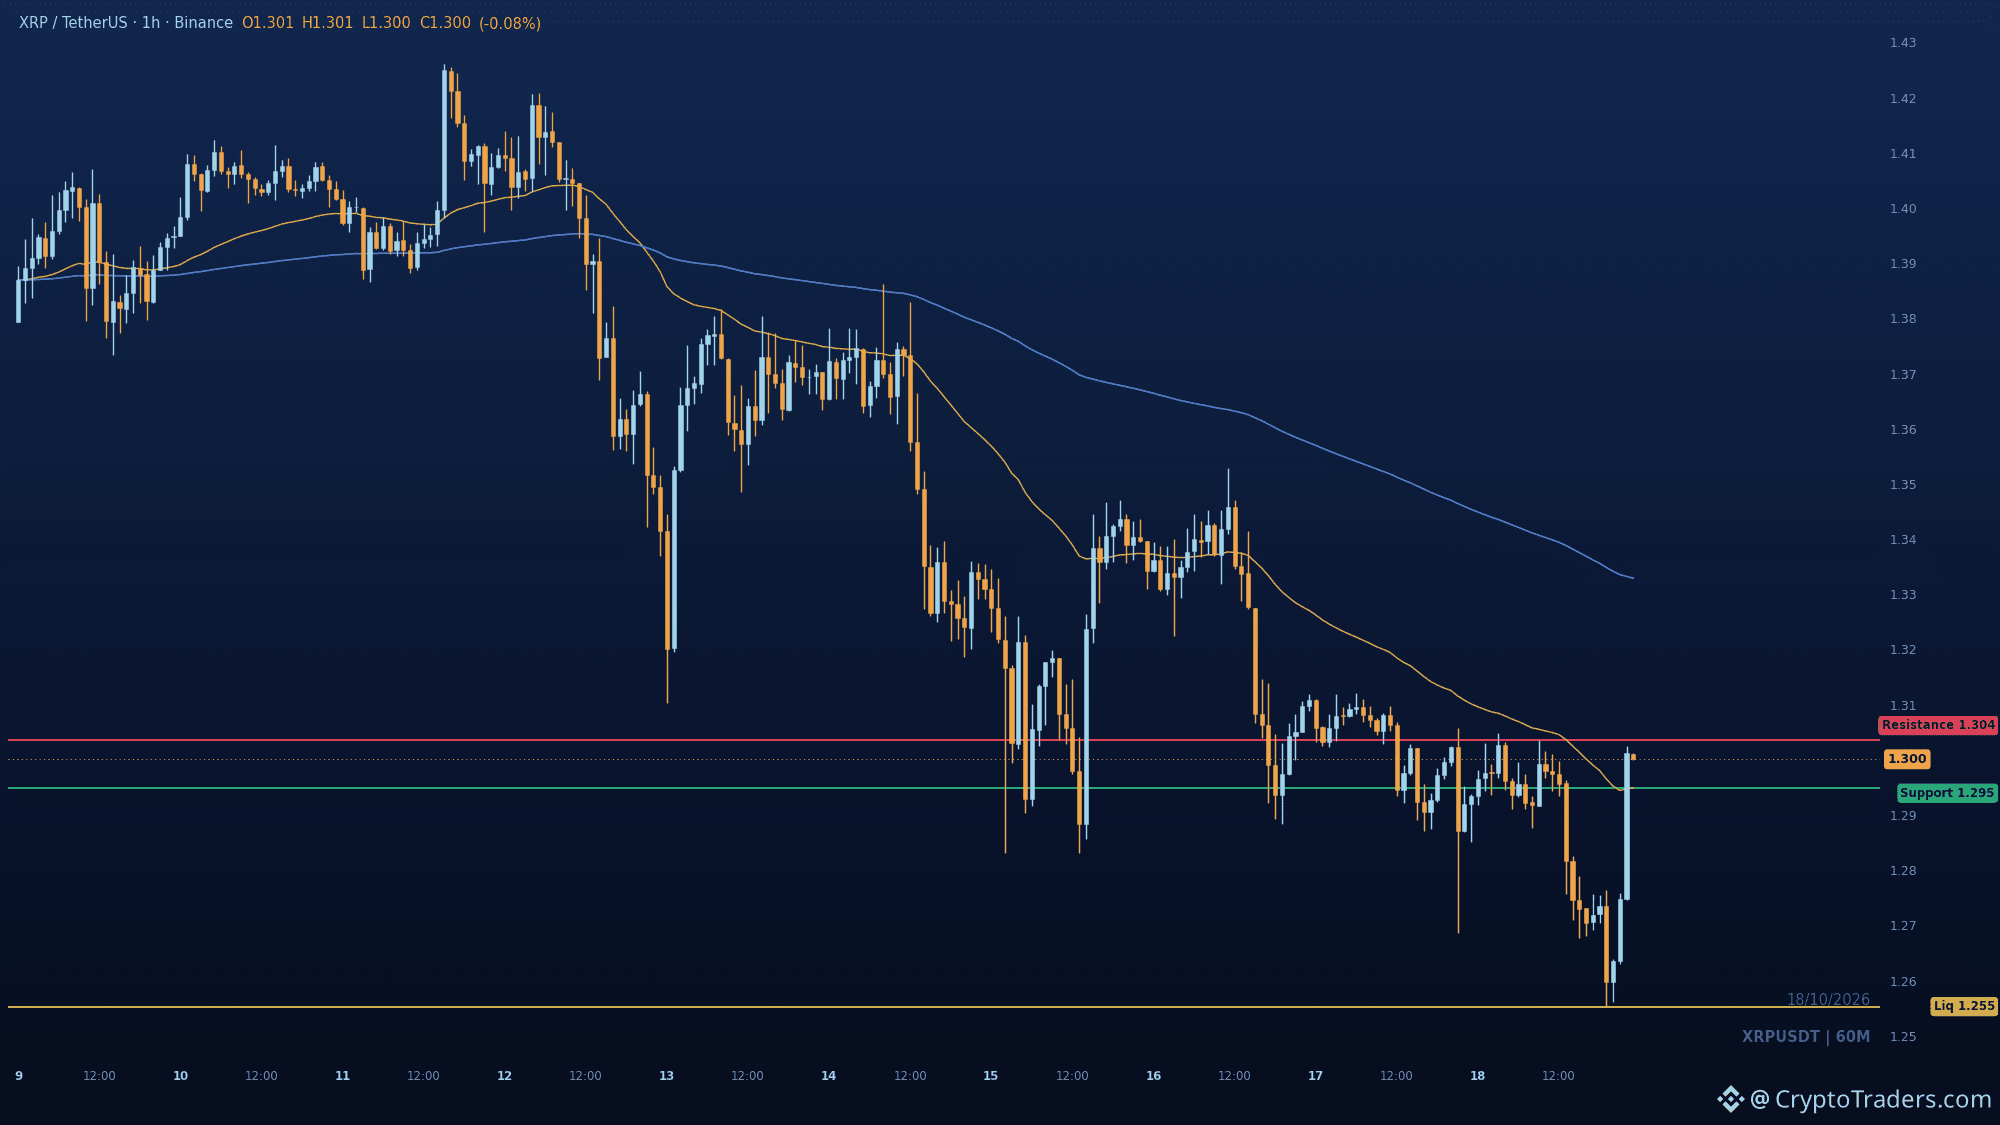
Ou o $XRP sustenta 1.2949 e avança gradualmente de volta para 1.3036, ou esse suporte cede e 1.2553 volta a entrar em jogo. A recuperação após a mínima varrida é real, mas a EMA 200 descendente ainda paira sobre o preço, e a faixa continua na zona de desconto. 1.2949 é a EMA rápida, então observe como será o primeiro recuo até ela. Um fechamento acima de 1.3036 enfraqueceria a leitura de continuação baixista e voltaria a colocar a máxima recente do movimento em foco. Se não conseguir defender 1.2949, 1.2553 continuará sendo o alvo estrutural abaixo. Qual lado de 1.2949 você acha que será testado primeiro? Mais análises como esta são publicadas diariamente no grupo, e você encontra o acesso na minha bio. #TemporadaDasAltcoins#
Ou o $XRP sustenta 1.2949 e avança gradualmente de volta para 1.3036, ou esse suporte cede e 1.2553 volta a entrar em jogo. A recuperação após a mínima varrida é real, mas a EMA 200 descendente ainda paira sobre o preço, e a faixa continua na zona de desconto. 1.2949 é a EMA rápida, então observe como será o primeiro recuo até ela. Um fechamento acima de 1.3036 enfraqueceria a leitura de continuação baixista e voltaria a colocar a máxima recente do movimento em foco. Se não conseguir defender 1.2949, 1.2553 continuará sendo o alvo estrutural abaixo. Qual lado de 1.2949 você acha que será testado primeiro? Mais análises como esta são publicadas diariamente no grupo, e você encontra o acesso na minha bio. #TemporadaDasAltcoins#
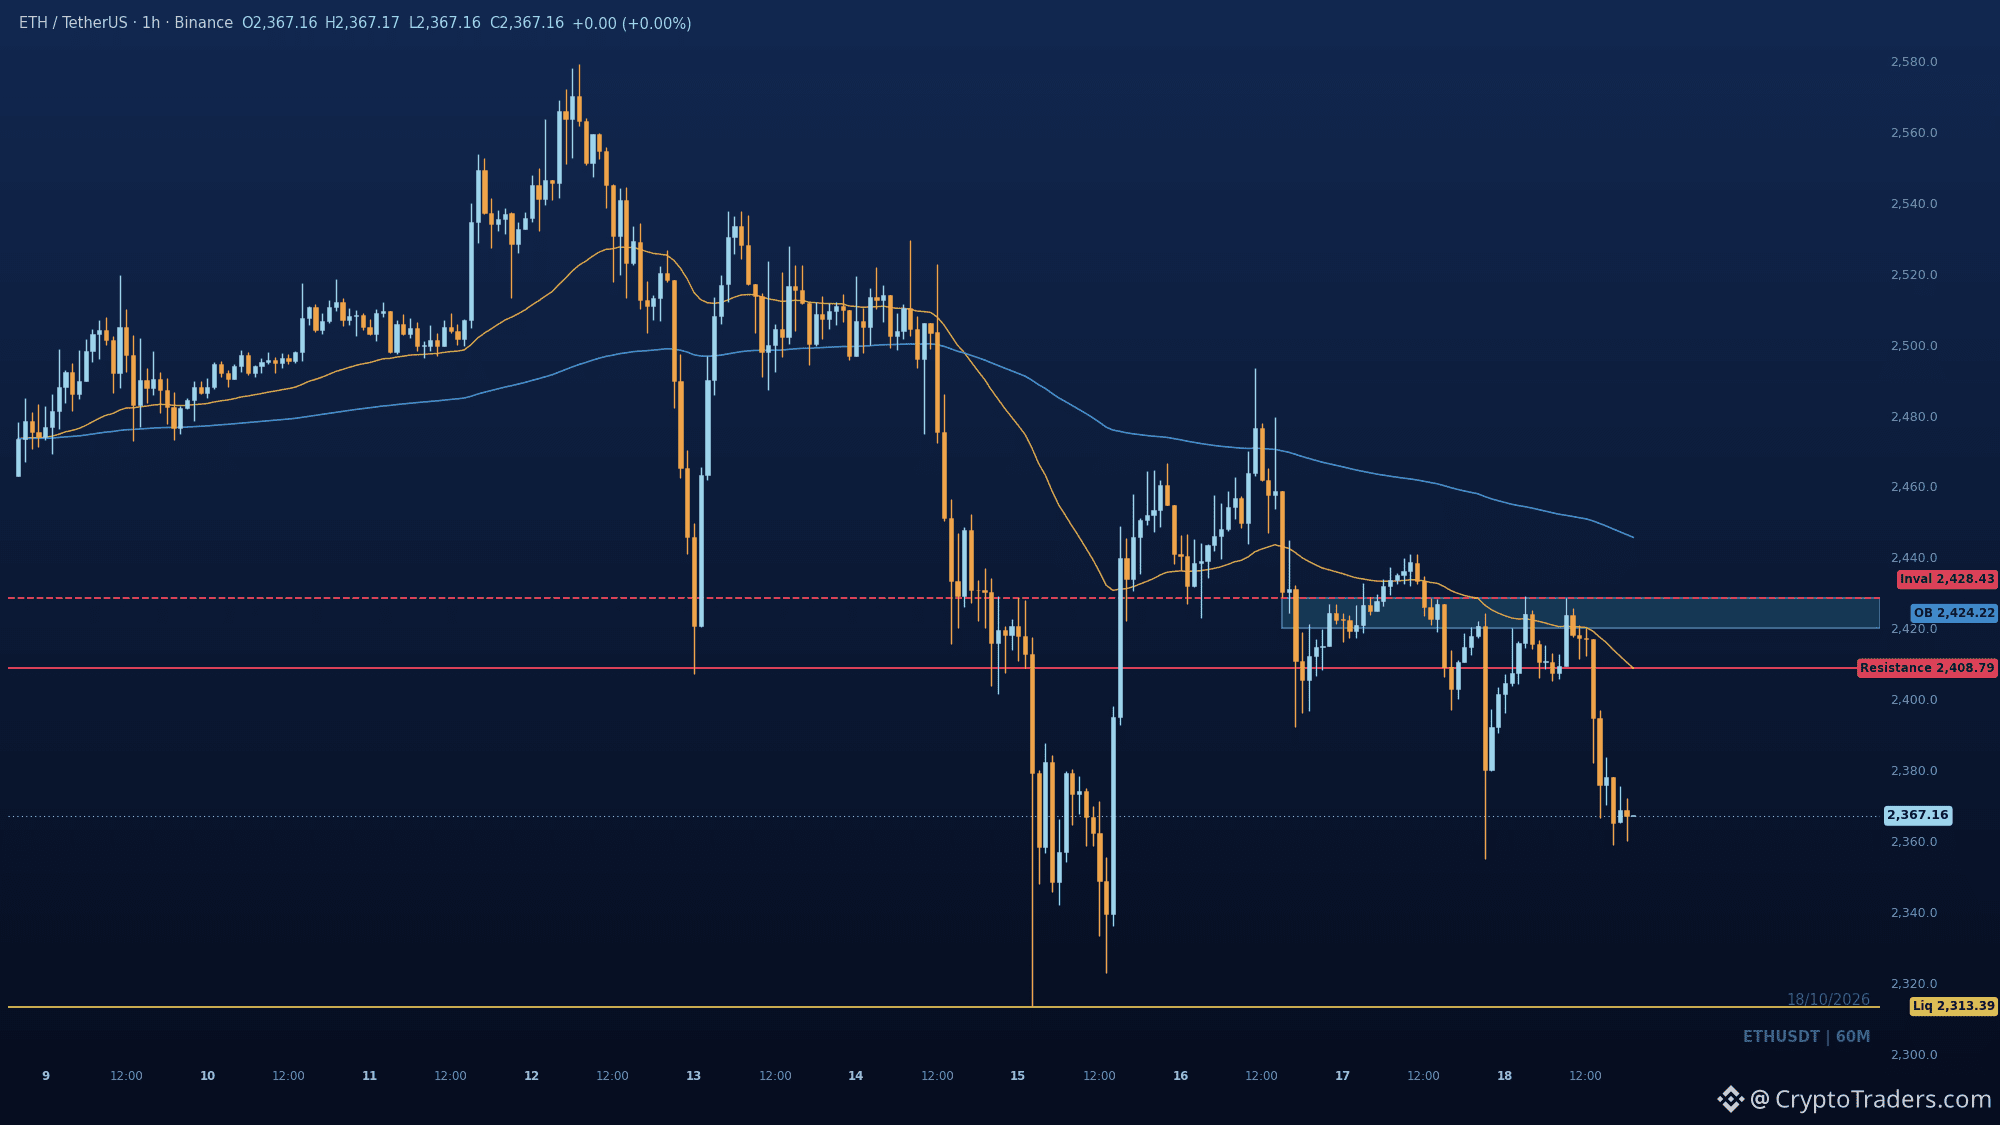
$ETH entrou na lista de observação hoje por um motivo: 2359 ainda está se mantendo, e essa é a última barreira entre este gráfico e um movimento direto até a mínima da janela. O preço está abaixo das duas EMAs descendentes, e o rompimento de 2400 já confirmou a estrutura de topos descendentes. A liquidez do lado vendedor está em 2313.39, e a mínima de oscilação em 2359 é o caminho até ela. Um recuo para a faixa de 2408 a 2428 seria onde os vendedores voltariam a entrar, e um fechamento acima de 2428.43 invalidaria esta leitura. Você está observando 2359 para ver se rompe ou se segura? Mais análises como esta são publicadas diariamente no grupo; o link para entrar está na bio. #Temporada das Altcoins#
$ETH entrou na lista de observação hoje por um motivo: 2359 ainda está se mantendo, e essa é a última barreira entre este gráfico e um movimento direto até a mínima da janela. O preço está abaixo das duas EMAs descendentes, e o rompimento de 2400 já confirmou a estrutura de topos descendentes. A liquidez do lado vendedor está em 2313.39, e a mínima de oscilação em 2359 é o caminho até ela. Um recuo para a faixa de 2408 a 2428 seria onde os vendedores voltariam a entrar, e um fechamento acima de 2428.43 invalidaria esta leitura. Você está observando 2359 para ver se rompe ou se segura? Mais análises como esta são publicadas diariamente no grupo; o link para entrar está na bio. #Temporada das Altcoins#
29
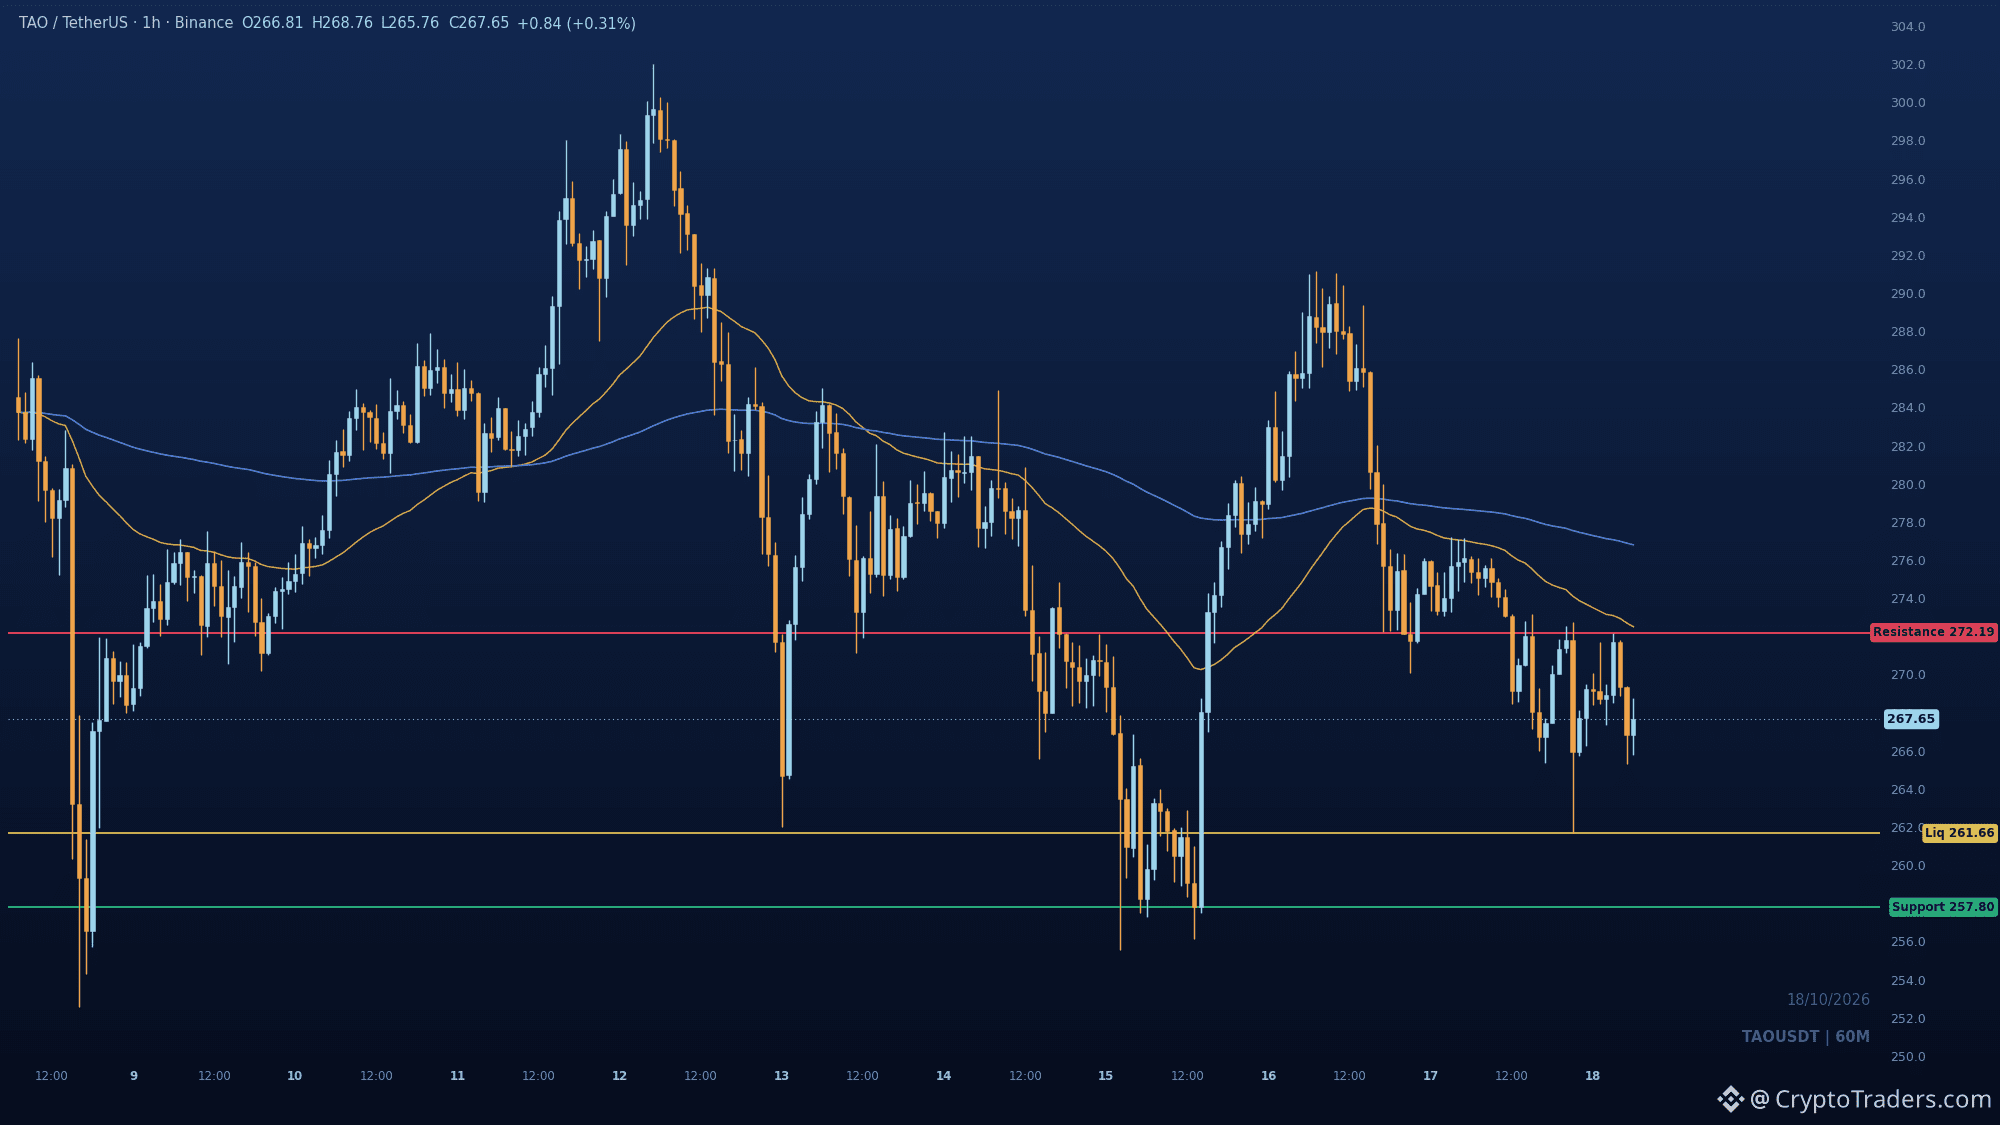
A parte curiosa do $TAO é o repique: recuperou a partir de 261.66, mas perdeu força abaixo das duas EMAs sem nunca tocar em 272.19. Desde a queda a partir de 290, os máximos descendentes têm-se acumulado, e o preço continua com desconto em relação à amplitude da janela. 261.66 é a zona de liquidez vendedora que todos conseguem ver, com 257.8 como mínimo da reação anterior por detrás. Uma recuperação decisiva de 272.19 muda a leitura; até lá, o gráfico de 1h continua inclinado para baixo. Que lado de 272.19 achas que será testado primeiro? Todos os dias partilho mais análises como esta no grupo; tens os detalhes na minha bio. #Temporada das Altcoins#
A parte curiosa do $TAO é o repique: recuperou a partir de 261.66, mas perdeu força abaixo das duas EMAs sem nunca tocar em 272.19. Desde a queda a partir de 290, os máximos descendentes têm-se acumulado, e o preço continua com desconto em relação à amplitude da janela. 261.66 é a zona de liquidez vendedora que todos conseguem ver, com 257.8 como mínimo da reação anterior por detrás. Uma recuperação decisiva de 272.19 muda a leitura; até lá, o gráfico de 1h continua inclinado para baixo. Que lado de 272.19 achas que será testado primeiro? Todos os dias partilho mais análises como esta no grupo; tens os detalhes na minha bio. #Temporada das Altcoins#
29
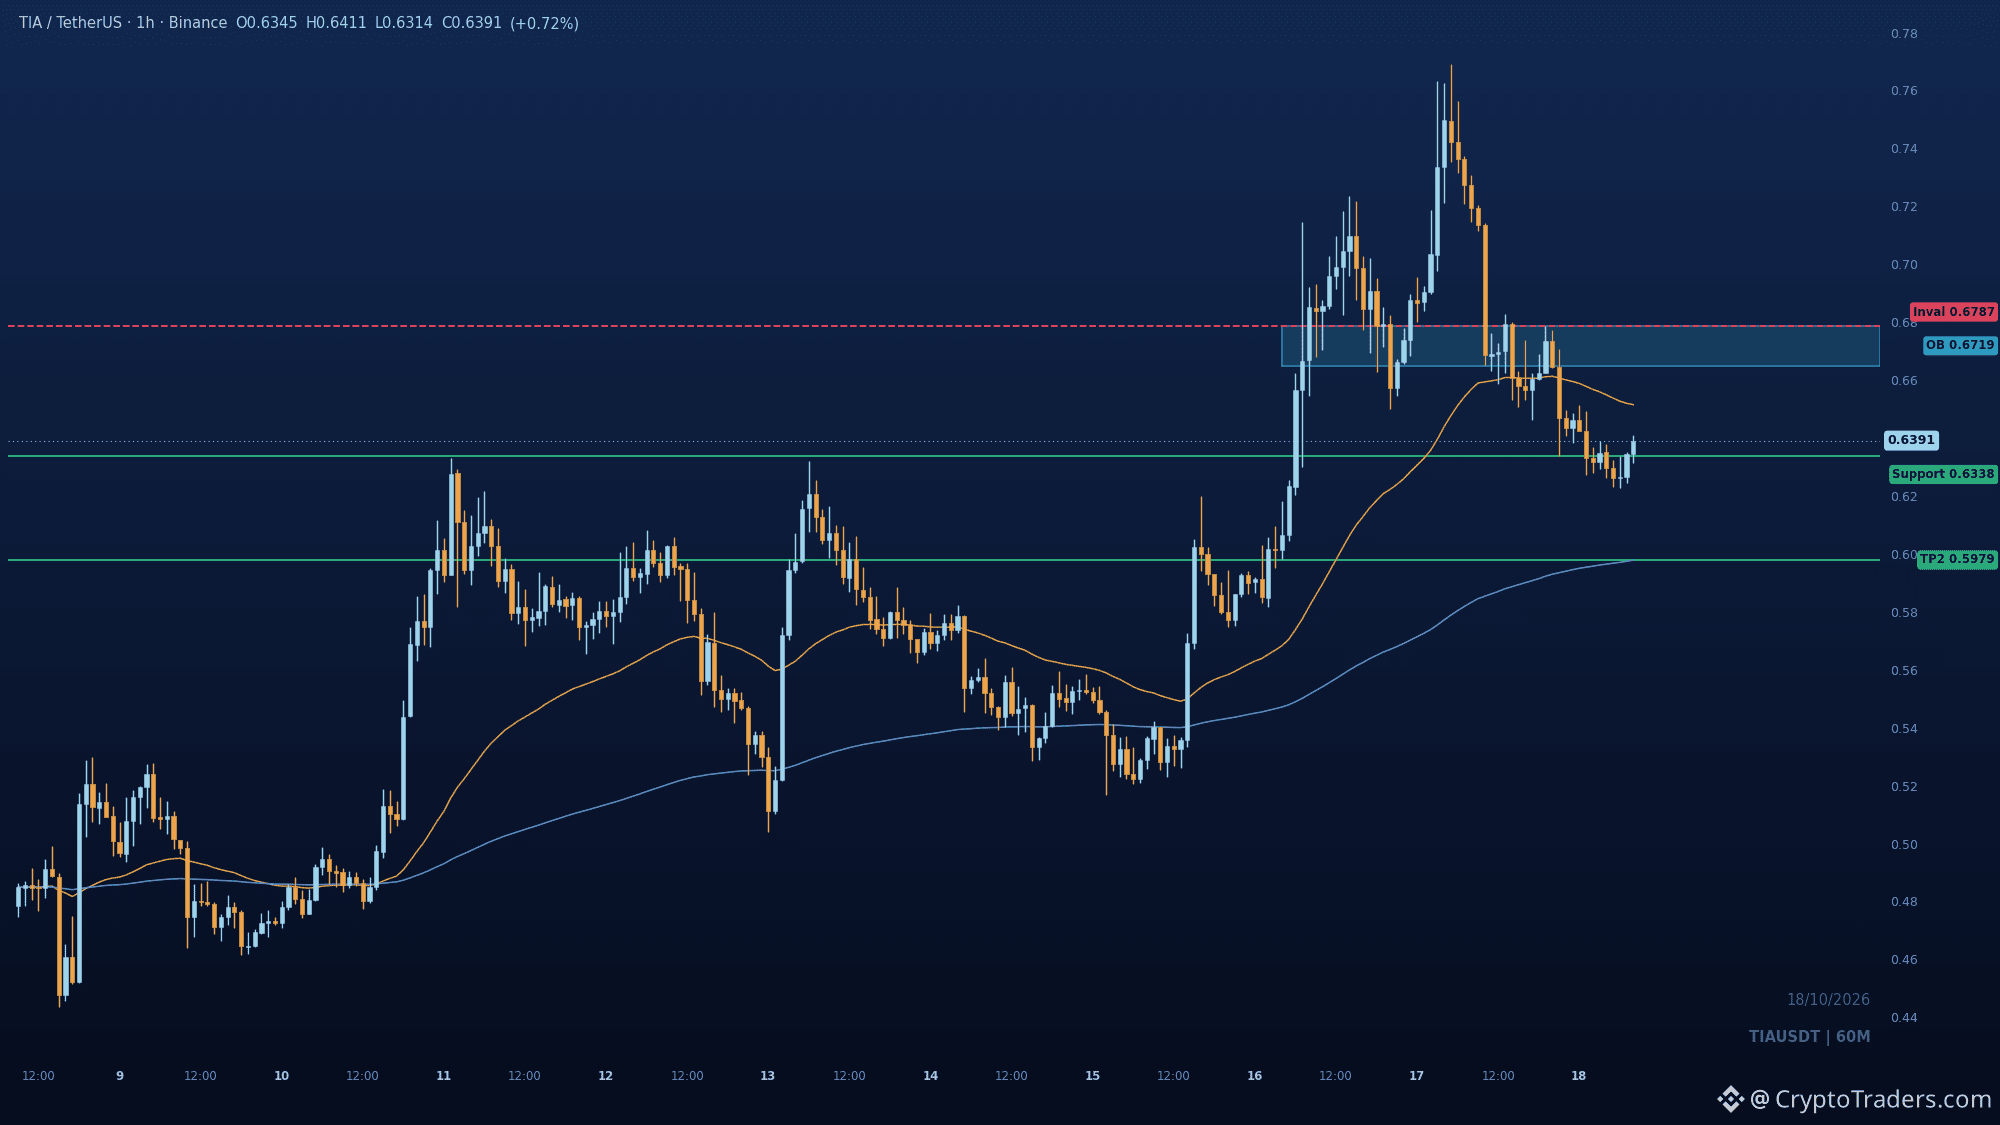
0.6338. Essa mínima de oscilação é a única coisa entre $TIA e uma queda mais acentuada depois de um dia de baixa de 12.4%. Os compradores levaram o preço a 0.769, mas depois perderam o suporte em 0.66 e formaram uma quebra baixista da estrutura no gráfico de 1h. A faixa de 0.665 a 0.6787 agora é uma zona de oferta acima do preço, que continua na zona premium. Perder 0.6338 colocaria 0.5979 no radar. Um fechamento acima de 0.6787 seria a surpresa que invalidaria o cenário de continuação da queda. Onde você acha que o preço vai encontrar suporte: em 0.63 ou abaixo? Mapeamos setups como este todos os dias com a comunidade. Mais detalhes no perfil. #Temporada das Altcoins#
0.6338. Essa mínima de oscilação é a única coisa entre $TIA e uma queda mais acentuada depois de um dia de baixa de 12.4%. Os compradores levaram o preço a 0.769, mas depois perderam o suporte em 0.66 e formaram uma quebra baixista da estrutura no gráfico de 1h. A faixa de 0.665 a 0.6787 agora é uma zona de oferta acima do preço, que continua na zona premium. Perder 0.6338 colocaria 0.5979 no radar. Um fechamento acima de 0.6787 seria a surpresa que invalidaria o cenário de continuação da queda. Onde você acha que o preço vai encontrar suporte: em 0.63 ou abaixo? Mapeamos setups como este todos os dias com a comunidade. Mais detalhes no perfil. #Temporada das Altcoins#
44
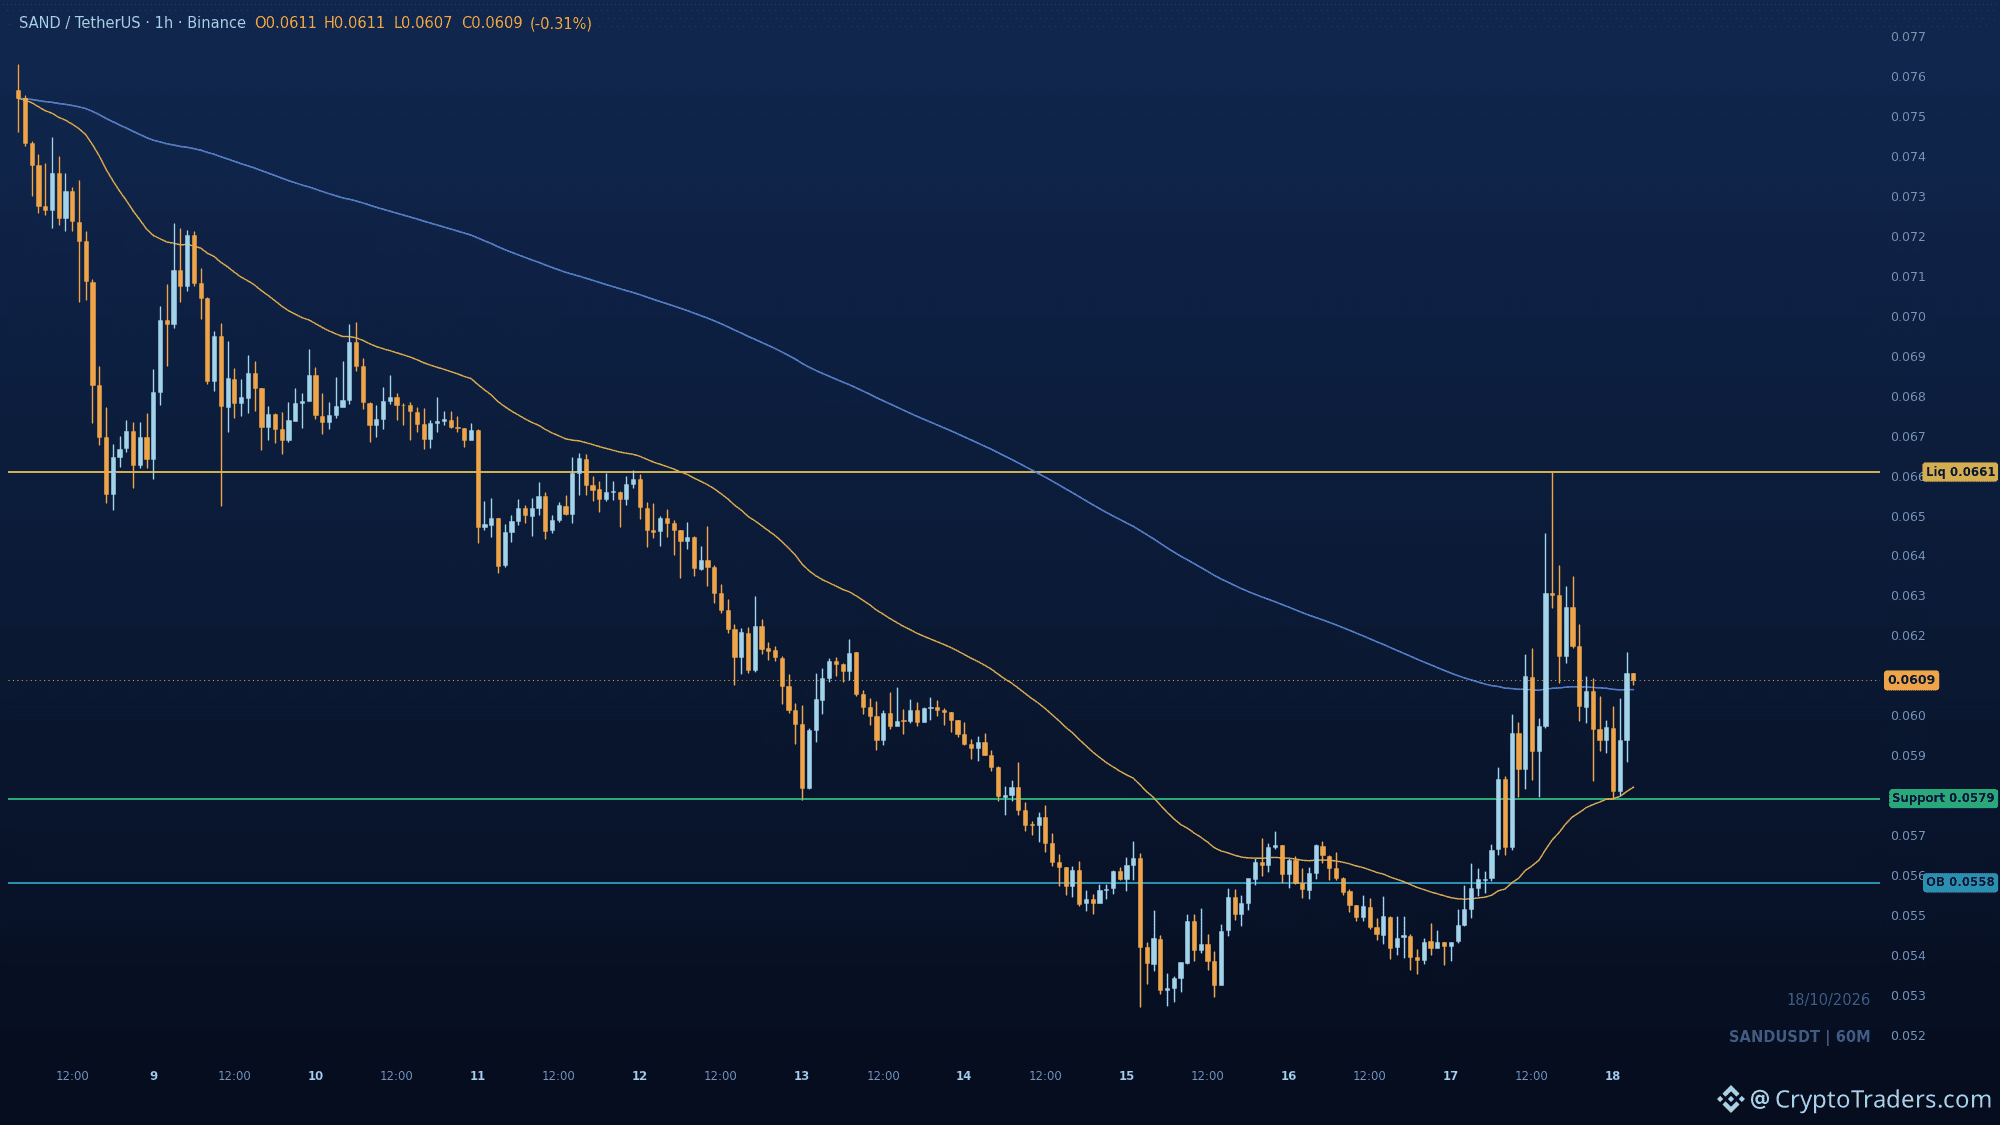
$SAND acabou de inverter sua estrutura de curto prazo, enquanto a EMA de 200 está bem acima do preço, em 0.06064. Isso significa que o repique ainda não foi testado exatamente no nível que costuma definir o movimento. O período mais longo ainda aponta para uma tendência de baixa. O CHoCH é real, e o preço está sendo negociado com desconto dentro do intervalo, por isso os compradores apareceram na mínima. Para subir, é preciso se manter com firmeza acima de 0.06064; depois, 0.06609 é a liquidez compradora que todos conseguem ver. Para baixo, a zona que me interessa vai de 0.05791 a 0.0562: o último candle de baixa antes do impulso. Um pavio que entre nessa zona e feche acima é o sinal. Abaixo de 0.0558, todo o repique perde a validade. Você prefere ver a EMA ser retomada primeiro ou o recuo ser preenchido primeiro? Mais análises como esta chegam diariamente ao grupo; o caminho para entrar está na bio. #Temporada das Altcoins#
$SAND acabou de inverter sua estrutura de curto prazo, enquanto a EMA de 200 está bem acima do preço, em 0.06064. Isso significa que o repique ainda não foi testado exatamente no nível que costuma definir o movimento. O período mais longo ainda aponta para uma tendência de baixa. O CHoCH é real, e o preço está sendo negociado com desconto dentro do intervalo, por isso os compradores apareceram na mínima. Para subir, é preciso se manter com firmeza acima de 0.06064; depois, 0.06609 é a liquidez compradora que todos conseguem ver. Para baixo, a zona que me interessa vai de 0.05791 a 0.0562: o último candle de baixa antes do impulso. Um pavio que entre nessa zona e feche acima é o sinal. Abaixo de 0.0558, todo o repique perde a validade. Você prefere ver a EMA ser retomada primeiro ou o recuo ser preenchido primeiro? Mais análises como esta chegam diariamente ao grupo; o caminho para entrar está na bio. #Temporada das Altcoins#
46
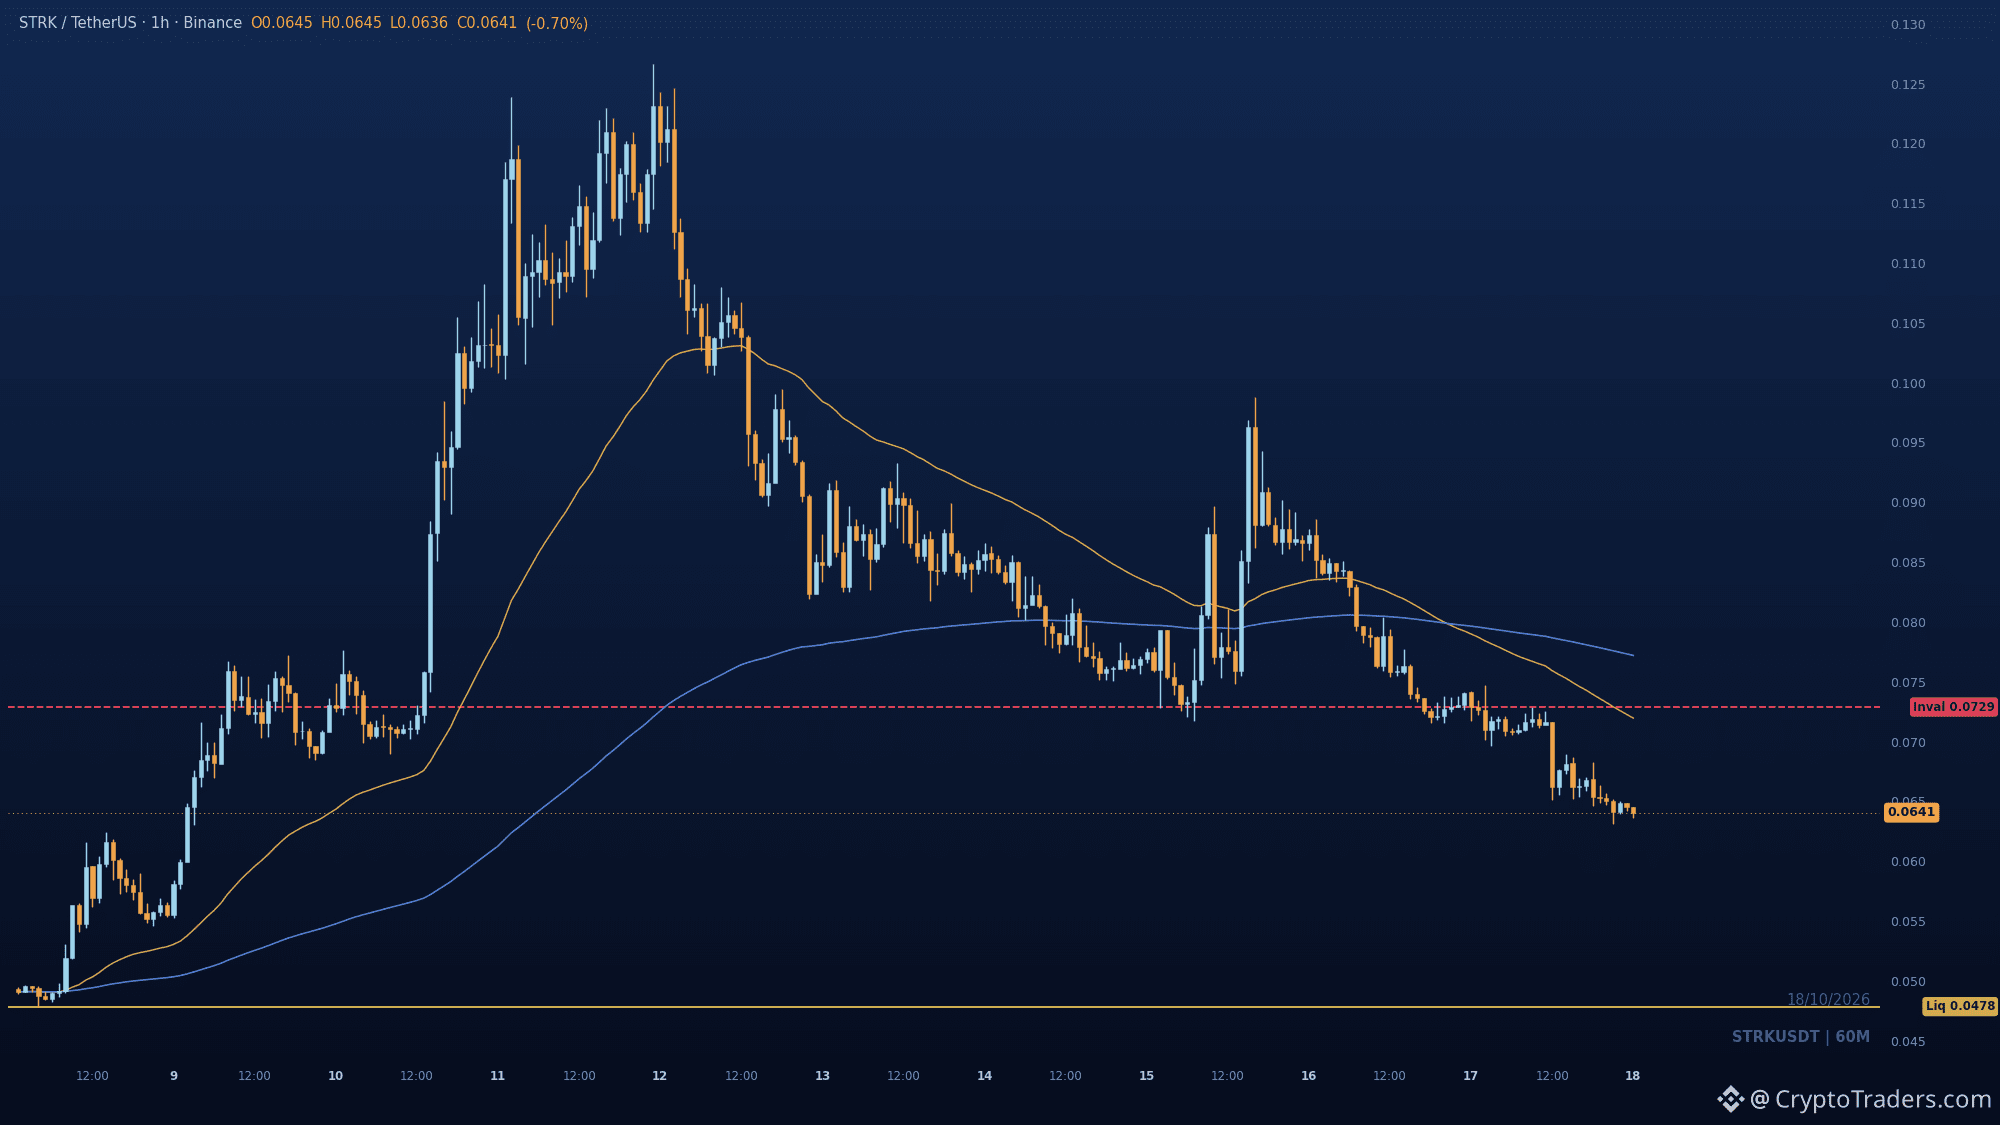
0.06408. Essa é a história toda sobre $STRK neste momento, com o preço logo abaixo do nível que define se isto é uma pausa ou uma continuação. O gráfico de 1h mostra uma sequência clara de máximas descendentes desde o topo da faixa, e o rompimento mais recente levou o preço abaixo do fundo anterior. Os vendedores estão consolidando perto desse rompimento. Uma recuperação fraca em direção a 0.06307 é a primeira coisa a observar, e uma rejeição nesse nível mantém 0.04785 como alvo estrutural. O que mudaria o cenário: uma recuperação que volte acima de 0.07289 invalidaria totalmente a leitura de baixa. O que realmente convenceria você de que essa recuperação tem força para continuar? #Temporada das Altcoins#
0.06408. Essa é a história toda sobre $STRK neste momento, com o preço logo abaixo do nível que define se isto é uma pausa ou uma continuação. O gráfico de 1h mostra uma sequência clara de máximas descendentes desde o topo da faixa, e o rompimento mais recente levou o preço abaixo do fundo anterior. Os vendedores estão consolidando perto desse rompimento. Uma recuperação fraca em direção a 0.06307 é a primeira coisa a observar, e uma rejeição nesse nível mantém 0.04785 como alvo estrutural. O que mudaria o cenário: uma recuperação que volte acima de 0.07289 invalidaria totalmente a leitura de baixa. O que realmente convenceria você de que essa recuperação tem força para continuar? #Temporada das Altcoins#
75
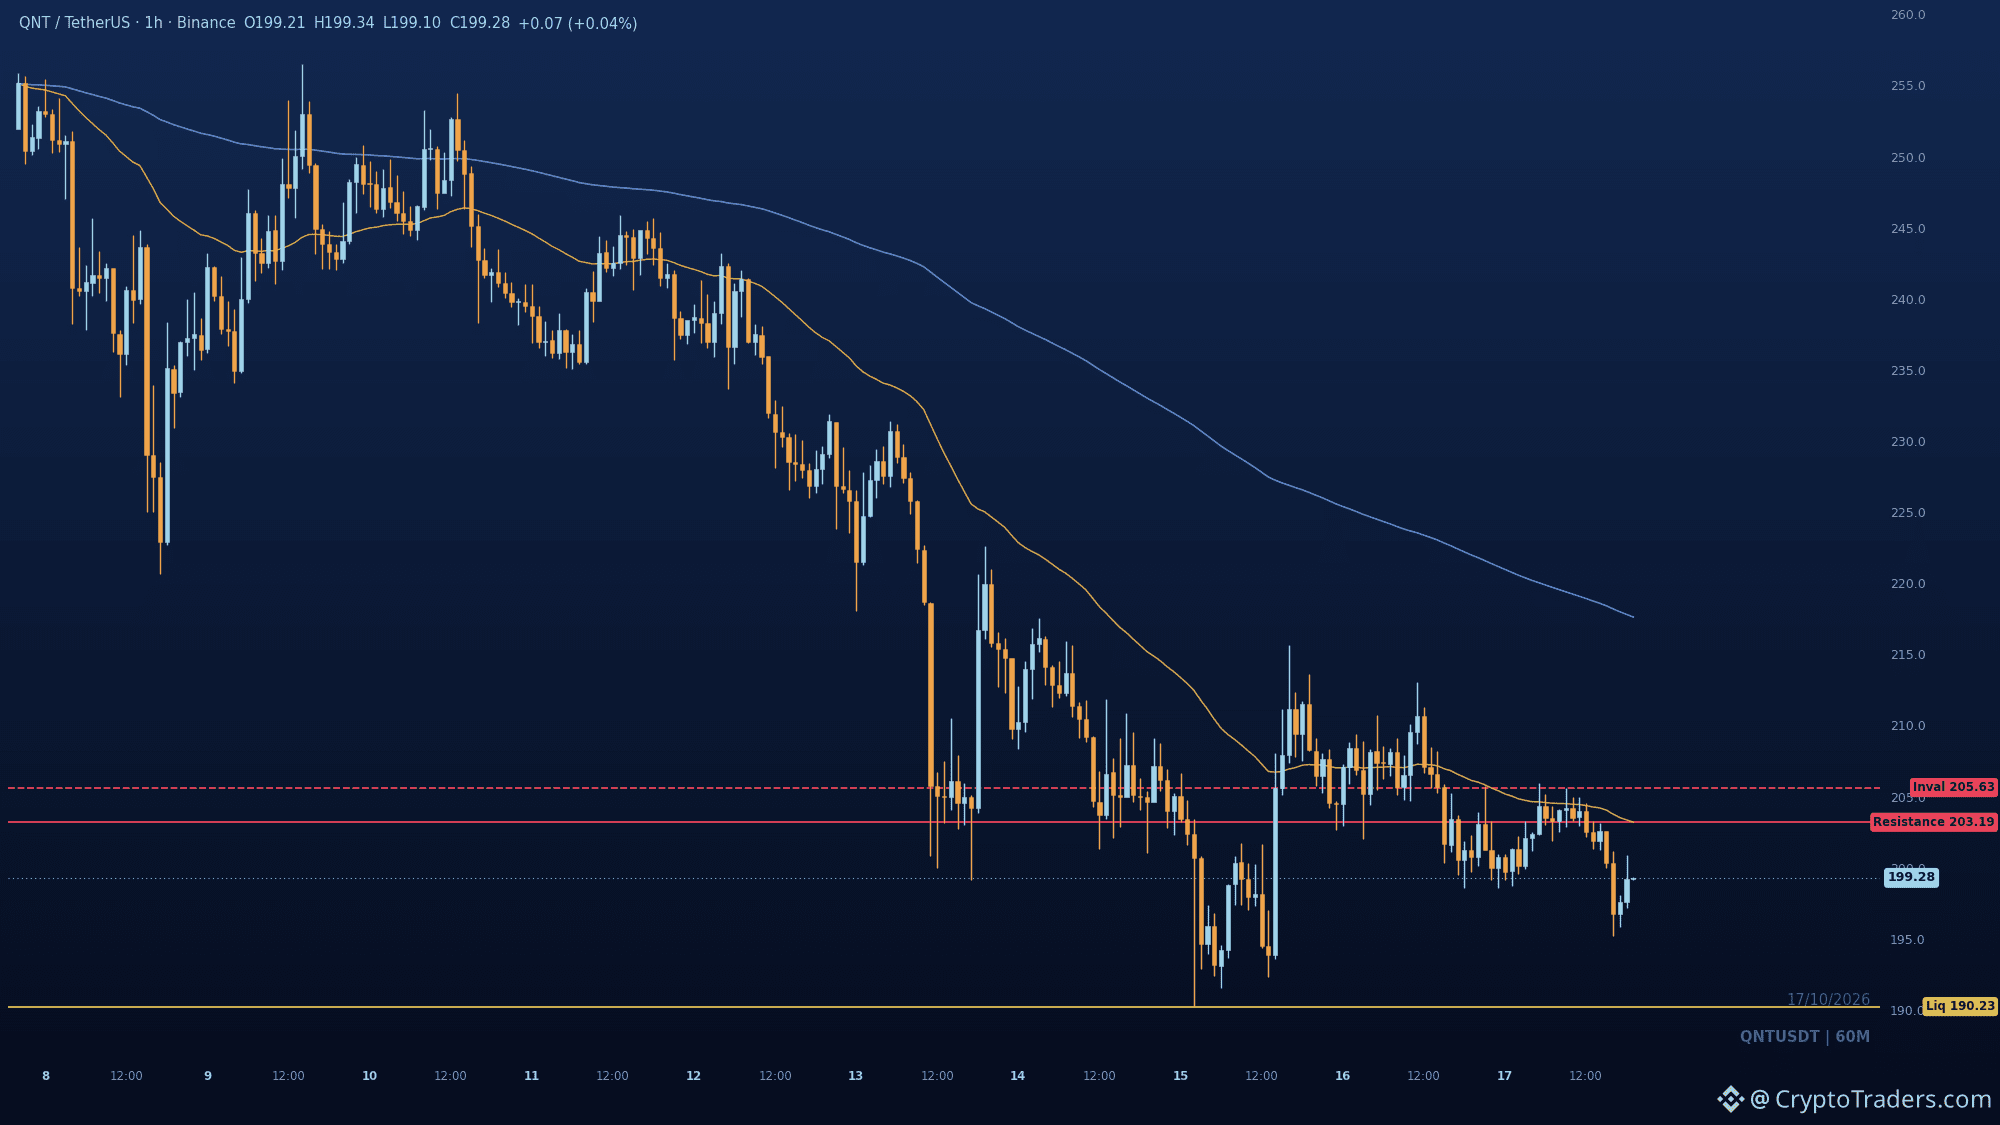
$QNT ou recupera até 203–205 e é vendido, ou salta a recuperação e segue direto para 190,23. A estrutura continua a apresentar máximos e mínimos descendentes, com as duas EMAs a cair acima do preço. O mínimo em 195,21 provocou uma recuperação, mas não recuperou nenhum nível; por isso, é na EMA de 50 períodos, em 203,19, e na faixa entre 203,19 e 205,63 que deverá surgir pressão vendedora. O que preciso de ver antes de acreditar numa inversão para alta: um fecho acima de 205,63, não apenas um pavio até esse nível. O que confirmaria a descida: uma rejeição nessa faixa, seguida de um movimento em direção à zona de liquidez vendedora dos 190,23. Uma recuperação de 205,63 mudaria a tua leitura? Mais análises de gráficos como esta chegam diariamente ao grupo; o link está na bio. #Temporada das Altcoins#
$QNT ou recupera até 203–205 e é vendido, ou salta a recuperação e segue direto para 190,23. A estrutura continua a apresentar máximos e mínimos descendentes, com as duas EMAs a cair acima do preço. O mínimo em 195,21 provocou uma recuperação, mas não recuperou nenhum nível; por isso, é na EMA de 50 períodos, em 203,19, e na faixa entre 203,19 e 205,63 que deverá surgir pressão vendedora. O que preciso de ver antes de acreditar numa inversão para alta: um fecho acima de 205,63, não apenas um pavio até esse nível. O que confirmaria a descida: uma rejeição nessa faixa, seguida de um movimento em direção à zona de liquidez vendedora dos 190,23. Uma recuperação de 205,63 mudaria a tua leitura? Mais análises de gráficos como esta chegam diariamente ao grupo; o link está na bio. #Temporada das Altcoins#
28
Faça login para explorar mais conteúdos
Junte-se a usuários de criptomoedas de todo o mundo no Binance Square.
⚡️ Obter informações mais recentes e úteis sobre criptomoeda.
💬 Com a confiança da maior corretora de criptomoedas do mundo.
👍 Descubra insights reais de criadores verificados.
E-mail / número de telefone
Tópicos em Alta
BinancePick
3M visualizações
152,357 discutindo
Participe da #TemporadaDeResultados: preveja resultados no Binance Pick e compartilhe sua opinião no Binance Square!
Binance Square Official
·409 curtidas
·342.8k visualizações
EarningsSeason
5.3M visualizações
25,899 discutindo
AnthropicTTMRevenueGrewAbout1200%
25,481 visualizações
376 discutindo