

CryptoMind学道
3.9k Publicações

CryptoMind学道
Denunciar
Bloquear Utilizador
交易员 | Reading Liquidity, Flow & Structure | Spot • Futures • New Listings | BTC ETH BNB & Momentum Alts | Risk First

Detentor de NVDAB
Trader Frequente
2.7 ano(s)
4 A seguir
776 Seguidores
2.7K+ Gostaram
Publicações
Tudo
Cotações
·
--
Ver tradução
𝗚𝗼𝘁 𝘄𝗿𝗲𝗰𝗸𝗲𝗱 𝗼𝗻 𝗮 𝘀𝗽𝗶𝗸𝗲 𝗹𝗶𝗸𝗲 𝘁𝗵𝗶𝘀 𝗹𝗮𝘀𝘁 𝗺𝗼𝗻𝘁𝗵, 𝘀𝗼 𝗜'𝗺 𝗻𝗼𝘁 𝗰𝗵𝗮𝘀𝗶𝗻𝗴 𝗶𝘁. 😘
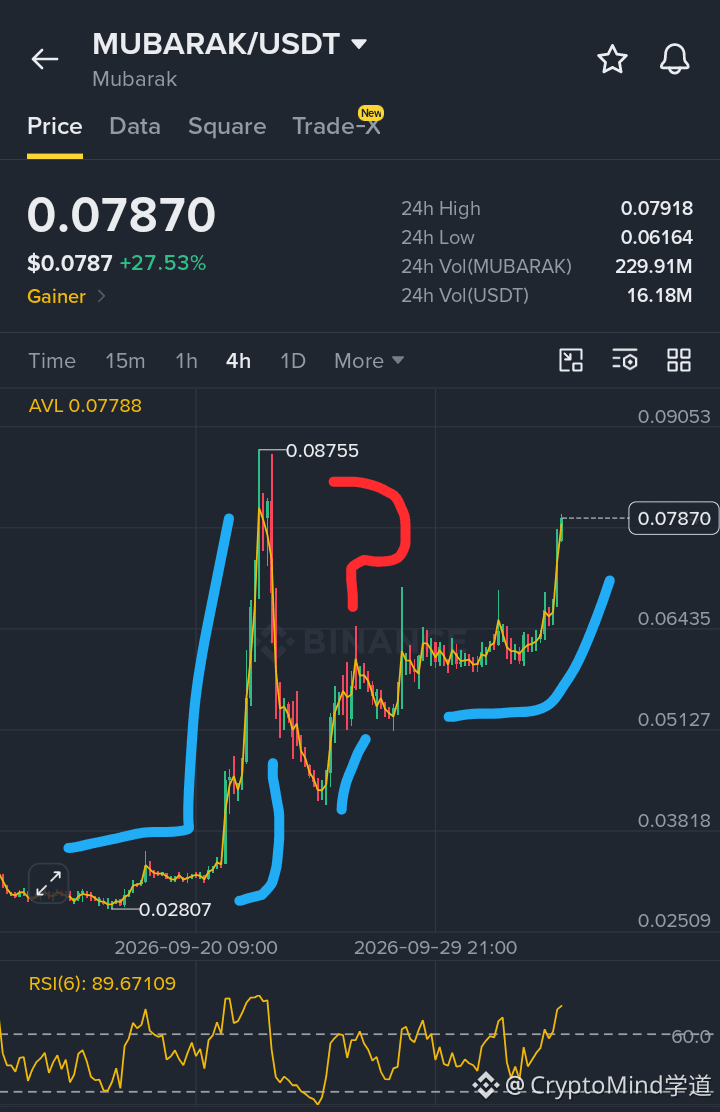
$MUBARAK ran 27% in a day with RSI(6) near 90 That's usually where I get greedy and regret it. I'm waiting for a pullback and only looking long between 0.066 and 0.070. Targets are 0.0792 first, then 0.0875 where it got rejected before. Stop under 0.0610, below the daily low
3x max on this. Thin alts like $MUBARAK wick through stops fast, and funding is probably heating up, so check it before you enter
Honestly, not sure it even dips
{future}(MUBARAKUSDT)
𝗚𝗼𝘁 𝘄𝗿𝗲𝗰𝗸𝗲𝗱 𝗼𝗻 𝗮 𝘀𝗽𝗶𝗸𝗲 𝗹𝗶𝗸𝗲 𝘁𝗵𝗶𝘀 𝗹𝗮𝘀𝘁 𝗺𝗼𝗻𝘁𝗵, 𝘀𝗼 𝗜'𝗺 𝗻𝗼𝘁 𝗰𝗵𝗮𝘀𝗶𝗻𝗴 𝗶𝘁. 😘
$MUBARAK ran 27% in a day with RSI(6) near 90 That's usually where I get greedy and regret it. I'm waiting for a pullback and only looking long between 0.066 and 0.070. Targets are 0.0792 first, then 0.0875 where it got rejected before. Stop under 0.0610, below the daily low
3x max on this. Thin alts like $MUBARAK wick through stops fast, and funding is probably heating up, so check it before you enter
Honestly, not sure it even dips
$MUBARAK ran 27% in a day with RSI(6) near 90 That's usually where I get greedy and regret it. I'm waiting for a pullback and only looking long between 0.066 and 0.070. Targets are 0.0792 first, then 0.0875 where it got rejected before. Stop under 0.0610, below the daily low
3x max on this. Thin alts like $MUBARAK wick through stops fast, and funding is probably heating up, so check it before you enter
Honestly, not sure it even dips
2
·
--
O dinheiro inteligente não está escolhendo lados; está construindo uma barra em “barbell”
Ao analisar os dados on-chain mais recentes, surge uma narrativa clara de eficiência de capital. O Ethereum continua sendo o inquestionável pilar institucional, comandando mais de US$ 404B em TVL via ponte, com uma taxa constante de crescimento mensal de 7%. Ele é a base da segurança e da liquidez profunda
Por outro lado, a Solana está capturando o apetite tático do mercado. Com uma expansão mensal de 13% no TVL, fica evidente que os traders estão rotacionando agressivamente o capital para ecossistemas de alta velocidade. Essa divergência não é um jogo de soma zero — é uma rotação sofisticada entre estabilidade e momentum
Enquanto navegamos essa bifurcação de liquidez, como você está balanceando seu portfólio entre a segurança do Ethereum e a velocidade da Solana?
$ETH $SOL #Crypto #defi #Ethereum #solana
O dinheiro inteligente não está escolhendo lados; está construindo uma barra em “barbell”
Ao analisar os dados on-chain mais recentes, surge uma narrativa clara de eficiência de capital. O Ethereum continua sendo o inquestionável pilar institucional, comandando mais de US$ 404B em TVL via ponte, com uma taxa constante de crescimento mensal de 7%. Ele é a base da segurança e da liquidez profunda
Por outro lado, a Solana está capturando o apetite tático do mercado. Com uma expansão mensal de 13% no TVL, fica evidente que os traders estão rotacionando agressivamente o capital para ecossistemas de alta velocidade. Essa divergência não é um jogo de soma zero — é uma rotação sofisticada entre estabilidade e momentum
Enquanto navegamos essa bifurcação de liquidez, como você está balanceando seu portfólio entre a segurança do Ethereum e a velocidade da Solana?
$ETH $SOL #Crypto #defi #Ethereum #solana
Ao analisar os dados on-chain mais recentes, surge uma narrativa clara de eficiência de capital. O Ethereum continua sendo o inquestionável pilar institucional, comandando mais de US$ 404B em TVL via ponte, com uma taxa constante de crescimento mensal de 7%. Ele é a base da segurança e da liquidez profunda
Por outro lado, a Solana está capturando o apetite tático do mercado. Com uma expansão mensal de 13% no TVL, fica evidente que os traders estão rotacionando agressivamente o capital para ecossistemas de alta velocidade. Essa divergência não é um jogo de soma zero — é uma rotação sofisticada entre estabilidade e momentum
Enquanto navegamos essa bifurcação de liquidez, como você está balanceando seu portfólio entre a segurança do Ethereum e a velocidade da Solana?
$ETH $SOL #Crypto #defi #Ethereum #solana

1
37
·
--
🚨 XTZ está ficando mais alto… 👀
$XTZ subiu 4,7% em 24H com 362K+ de engajamentos sociais. 📈
Esse tipo de atenção pode impulsionar o momentum, mas também pode criar um falso rompimento brusco.
🔥 Compradores empurrando para cima? 🛑 Ou é o cenário antes de uma correção?
Acompanhe $XTZ de perto. O hype social está crescendo rapidamente. 👀
#xtz #Tezos #Crypto #altcoins #Binance $ZEC
{future}(XTZUSDT)
🚨 XTZ está ficando mais alto… 👀
$XTZ subiu 4,7% em 24H com 362K+ de engajamentos sociais. 📈
Esse tipo de atenção pode impulsionar o momentum, mas também pode criar um falso rompimento brusco.
🔥 Compradores empurrando para cima? 🛑 Ou é o cenário antes de uma correção?
Acompanhe $XTZ de perto. O hype social está crescendo rapidamente. 👀
#xtz #Tezos #Crypto #altcoins #Binance $ZEC
$XTZ subiu 4,7% em 24H com 362K+ de engajamentos sociais. 📈
Esse tipo de atenção pode impulsionar o momentum, mas também pode criar um falso rompimento brusco.
🔥 Compradores empurrando para cima? 🛑 Ou é o cenário antes de uma correção?
Acompanhe $XTZ de perto. O hype social está crescendo rapidamente. 👀
#xtz #Tezos #Crypto #altcoins #Binance $ZEC
1️⃣ Bullish breakout 🚀
2️⃣ Fakeout incoming 🐻
22 hora(s) restante(s)
1
13
·
--
🚨 O BITCOIN SEGURA US$ 85K! Está a caminho uma GRANDE quebra? 🚀
O mercado cripto está mostrando uma força incrível agora! O Bitcoin $BTC está sustentando firmemente sua posição na faixa dos $85.199. Os traders estão fortemente inclinados ao modo otimista (bullish) e, se este suporte-chave se mantiver, talvez estejamos prestes a ver a próxima grande perna de alta bem em breve! 📈
Enquanto isso, no front das altcoins, os dados das redes sociais estão explodindo para $TRUMP Ele registrou mais de 737 mil engajamentos sociais nas últimas 24 horas, tornando-se um dos ativos mais comentados hoje. 🤯 Quando o volume social dispara assim, espere uma volatilidade intensa pela frente!
Qual é o seu movimento? 👇
O BTC vai romper e atingir $88K esta semana, ou estamos prestes a ter uma correção de curto prazo? Deixe suas previsões nos comentários abaixo!
{future}(TRUMPUSDT)
{future}(BTCUSDT)
#Bitcoin #TRUMP #CryptoNews #TradingUpdates #Crypto
🚨 O BITCOIN SEGURA US$ 85K! Está a caminho uma GRANDE quebra? 🚀
O mercado cripto está mostrando uma força incrível agora! O Bitcoin $BTC está sustentando firmemente sua posição na faixa dos $85.199. Os traders estão fortemente inclinados ao modo otimista (bullish) e, se este suporte-chave se mantiver, talvez estejamos prestes a ver a próxima grande perna de alta bem em breve! 📈
Enquanto isso, no front das altcoins, os dados das redes sociais estão explodindo para $TRUMP Ele registrou mais de 737 mil engajamentos sociais nas últimas 24 horas, tornando-se um dos ativos mais comentados hoje. 🤯 Quando o volume social dispara assim, espere uma volatilidade intensa pela frente!
Qual é o seu movimento? 👇
O BTC vai romper e atingir $88K esta semana, ou estamos prestes a ter uma correção de curto prazo? Deixe suas previsões nos comentários abaixo!
#Bitcoin #TRUMP #CryptoNews #TradingUpdates #Crypto
O mercado cripto está mostrando uma força incrível agora! O Bitcoin $BTC está sustentando firmemente sua posição na faixa dos $85.199. Os traders estão fortemente inclinados ao modo otimista (bullish) e, se este suporte-chave se mantiver, talvez estejamos prestes a ver a próxima grande perna de alta bem em breve! 📈
Enquanto isso, no front das altcoins, os dados das redes sociais estão explodindo para $TRUMP Ele registrou mais de 737 mil engajamentos sociais nas últimas 24 horas, tornando-se um dos ativos mais comentados hoje. 🤯 Quando o volume social dispara assim, espere uma volatilidade intensa pela frente!
Qual é o seu movimento? 👇
O BTC vai romper e atingir $88K esta semana, ou estamos prestes a ter uma correção de curto prazo? Deixe suas previsões nos comentários abaixo!
#Bitcoin #TRUMP #CryptoNews #TradingUpdates #Crypto
Smash $88K! 🚀
Short-term Drop 📉
21 hora(s) restante(s)
1
38
·
--
Artigo
Ver tradução
Every Time I Chase A Green Candle, I Hand My Wallet To Someone ElseThe first thing I noticed wasn't a price. It was the whiplash. One of these charts ran from 0.019 to 0.217 in a single session, then gave almost all of it back before most people finished their coffee.
That's the tape. It doesn't reward urgency. It punishes it. I've been on the wrong side of that exact candle more times than I care to count.
$SKHYNIX is the first one. This is the AI memory play that came to market with a $26.5 billion Nasdaq listing, the largest ever by a foreign company. The tape has been a slow climb from 976 to a high of 1,439, and it's now sitting around 1,373.
Funding is essentially neutral at 0.0000% on most venues. Open interest on Hyperliquid alone was over $571 million earlier this year, with Binance another $501 million. That's a lot of leveraged money sitting in this name. The headline is the Intel partnership talks. If that translates into a manufacturing deal at Intel's Ohio complex, it changes the US supply chain story.
The level that matters is $1,439. A clean break above it opens the door toward $1,600. Lose $1,232 and the bid thins out.
Above $1,439 and I'm watching $1,600 first, then $1,750. Lose $1,232 and I'm done. I've held a slow grinder too long before, watching a solid gain turn into a round trip because I got bored and stopped paying attention.
{future}(SKHYNIXUSDT)
$AIN is the second chart. And this one is a different beast entirely. It ran from 0.019 to 0.217 in a single session, then got absolutely crushed back to 0.055. That's a 90% swing in both directions.
Funding is positive at 0.3069% on KuCoin. That's not a typo. Longs are paying shorts nearly a third of a percent every eight hours. That's the market telling you the crowd is leaning one way, hard. The headline is the brand evolution plan, a ticker replacement that doesn't change the contract or tokenomics.
The level that matters is $0.217. That's the high from the spike. A clean reclaim opens the door toward $0.25. Lose $0.055 and the bid disappears.
Above $0.217 and I'm watching $0.25 first, then $0.30. Lose $0.055 and I'm out. I once held a ticker-change "catalyst" all the way to zero because I thought a rebrand meant a new product. It didn't.
{future}(AINUSDT)
$SAND is the third chart. This is the quietest of the three, but the headline is the cleanest. Upbit and Bithumb removed the "trading caution" label on October 2, and the token ripped 53% in a day. The tape shows a move from 0.032 to a high of 0.084, and it's now sitting around 0.076.
Funding is neutral at 0.0019% on KuCoin. Open interest is around $23.8 million. That's not a crowded trade. The volume is there, but the leverage isn't stretched. The level that matters is $0.084. A clean break above it opens the door toward $0.095. Lose $0.072 and the bid thins out.
Above $0.084 and I'm watching $0.095 first, then $0.11. Lose $0.072 and I'm out.
{future}(SANDUSDT)
The wider market matters here. Bitcoin is holding near $84,000 after tapping $87,000. Dominance is around 58.7%, still below the 60% line that would signal a full risk-off rotation. The Altcoin Season Index is at 61 out of 100, up from 23 a month ago. Still below the 75 threshold, but the direction is clear.
Open interest across crypto perps is elevated. The crowd is leaning into new listings and narrative plays. Where I could be wrong is if Bitcoin dominance reclaims 60% and this rotation stalls. Then the late longs get paid and these breakouts fail.
I've been on the wrong side of a "confirmed breakout" before. The chart looked perfect, every box checked, and then the bid vanished. That's why I don't trust a wick at the high.
The levels are the levels. The tape will tell you which ones matter.
Are you a trader, or are you a spectator?
Every Time I Chase A Green Candle, I Hand My Wallet To Someone Else
The first thing I noticed wasn't a price. It was the whiplash. One of these charts ran from 0.019 to 0.217 in a single session, then gave almost all of it back before most people finished their coffee.
That's the tape. It doesn't reward urgency. It punishes it. I've been on the wrong side of that exact candle more times than I care to count.
$SKHYNIX is the first one. This is the AI memory play that came to market with a $26.5 billion Nasdaq listing, the largest ever by a foreign company. The tape has been a slow climb from 976 to a high of 1,439, and it's now sitting around 1,373.
Funding is essentially neutral at 0.0000% on most venues. Open interest on Hyperliquid alone was over $571 million earlier this year, with Binance another $501 million. That's a lot of leveraged money sitting in this name. The headline is the Intel partnership talks. If that translates into a manufacturing deal at Intel's Ohio complex, it changes the US supply chain story.
The level that matters is $1,439. A clean break above it opens the door toward $1,600. Lose $1,232 and the bid thins out.
Above $1,439 and I'm watching $1,600 first, then $1,750. Lose $1,232 and I'm done. I've held a slow grinder too long before, watching a solid gain turn into a round trip because I got bored and stopped paying attention.
$AIN is the second chart. And this one is a different beast entirely. It ran from 0.019 to 0.217 in a single session, then got absolutely crushed back to 0.055. That's a 90% swing in both directions.
Funding is positive at 0.3069% on KuCoin. That's not a typo. Longs are paying shorts nearly a third of a percent every eight hours. That's the market telling you the crowd is leaning one way, hard. The headline is the brand evolution plan, a ticker replacement that doesn't change the contract or tokenomics.
The level that matters is $0.217. That's the high from the spike. A clean reclaim opens the door toward $0.25. Lose $0.055 and the bid disappears.
Above $0.217 and I'm watching $0.25 first, then $0.30. Lose $0.055 and I'm out. I once held a ticker-change "catalyst" all the way to zero because I thought a rebrand meant a new product. It didn't.
$SAND is the third chart. This is the quietest of the three, but the headline is the cleanest. Upbit and Bithumb removed the "trading caution" label on October 2, and the token ripped 53% in a day. The tape shows a move from 0.032 to a high of 0.084, and it's now sitting around 0.076.
Funding is neutral at 0.0019% on KuCoin. Open interest is around $23.8 million. That's not a crowded trade. The volume is there, but the leverage isn't stretched. The level that matters is $0.084. A clean break above it opens the door toward $0.095. Lose $0.072 and the bid thins out.
Above $0.084 and I'm watching $0.095 first, then $0.11. Lose $0.072 and I'm out.
The wider market matters here. Bitcoin is holding near $84,000 after tapping $87,000. Dominance is around 58.7%, still below the 60% line that would signal a full risk-off rotation. The Altcoin Season Index is at 61 out of 100, up from 23 a month ago. Still below the 75 threshold, but the direction is clear.
Open interest across crypto perps is elevated. The crowd is leaning into new listings and narrative plays. Where I could be wrong is if Bitcoin dominance reclaims 60% and this rotation stalls. Then the late longs get paid and these breakouts fail.
I've been on the wrong side of a "confirmed breakout" before. The chart looked perfect, every box checked, and then the bid vanished. That's why I don't trust a wick at the high.
The levels are the levels. The tape will tell you which ones matter.
Are you a trader, or are you a spectator?
That's the tape. It doesn't reward urgency. It punishes it. I've been on the wrong side of that exact candle more times than I care to count.
$SKHYNIX is the first one. This is the AI memory play that came to market with a $26.5 billion Nasdaq listing, the largest ever by a foreign company. The tape has been a slow climb from 976 to a high of 1,439, and it's now sitting around 1,373.
Funding is essentially neutral at 0.0000% on most venues. Open interest on Hyperliquid alone was over $571 million earlier this year, with Binance another $501 million. That's a lot of leveraged money sitting in this name. The headline is the Intel partnership talks. If that translates into a manufacturing deal at Intel's Ohio complex, it changes the US supply chain story.
The level that matters is $1,439. A clean break above it opens the door toward $1,600. Lose $1,232 and the bid thins out.
Above $1,439 and I'm watching $1,600 first, then $1,750. Lose $1,232 and I'm done. I've held a slow grinder too long before, watching a solid gain turn into a round trip because I got bored and stopped paying attention.
$AIN is the second chart. And this one is a different beast entirely. It ran from 0.019 to 0.217 in a single session, then got absolutely crushed back to 0.055. That's a 90% swing in both directions.
Funding is positive at 0.3069% on KuCoin. That's not a typo. Longs are paying shorts nearly a third of a percent every eight hours. That's the market telling you the crowd is leaning one way, hard. The headline is the brand evolution plan, a ticker replacement that doesn't change the contract or tokenomics.
The level that matters is $0.217. That's the high from the spike. A clean reclaim opens the door toward $0.25. Lose $0.055 and the bid disappears.
Above $0.217 and I'm watching $0.25 first, then $0.30. Lose $0.055 and I'm out. I once held a ticker-change "catalyst" all the way to zero because I thought a rebrand meant a new product. It didn't.
$SAND is the third chart. This is the quietest of the three, but the headline is the cleanest. Upbit and Bithumb removed the "trading caution" label on October 2, and the token ripped 53% in a day. The tape shows a move from 0.032 to a high of 0.084, and it's now sitting around 0.076.
Funding is neutral at 0.0019% on KuCoin. Open interest is around $23.8 million. That's not a crowded trade. The volume is there, but the leverage isn't stretched. The level that matters is $0.084. A clean break above it opens the door toward $0.095. Lose $0.072 and the bid thins out.
Above $0.084 and I'm watching $0.095 first, then $0.11. Lose $0.072 and I'm out.
The wider market matters here. Bitcoin is holding near $84,000 after tapping $87,000. Dominance is around 58.7%, still below the 60% line that would signal a full risk-off rotation. The Altcoin Season Index is at 61 out of 100, up from 23 a month ago. Still below the 75 threshold, but the direction is clear.
Open interest across crypto perps is elevated. The crowd is leaning into new listings and narrative plays. Where I could be wrong is if Bitcoin dominance reclaims 60% and this rotation stalls. Then the late longs get paid and these breakouts fail.
I've been on the wrong side of a "confirmed breakout" before. The chart looked perfect, every box checked, and then the bid vanished. That's why I don't trust a wick at the high.
The levels are the levels. The tape will tell you which ones matter.
Are you a trader, or are you a spectator?
226
·
--
Em Alta
Correr atrás desta vela é como você fica preso
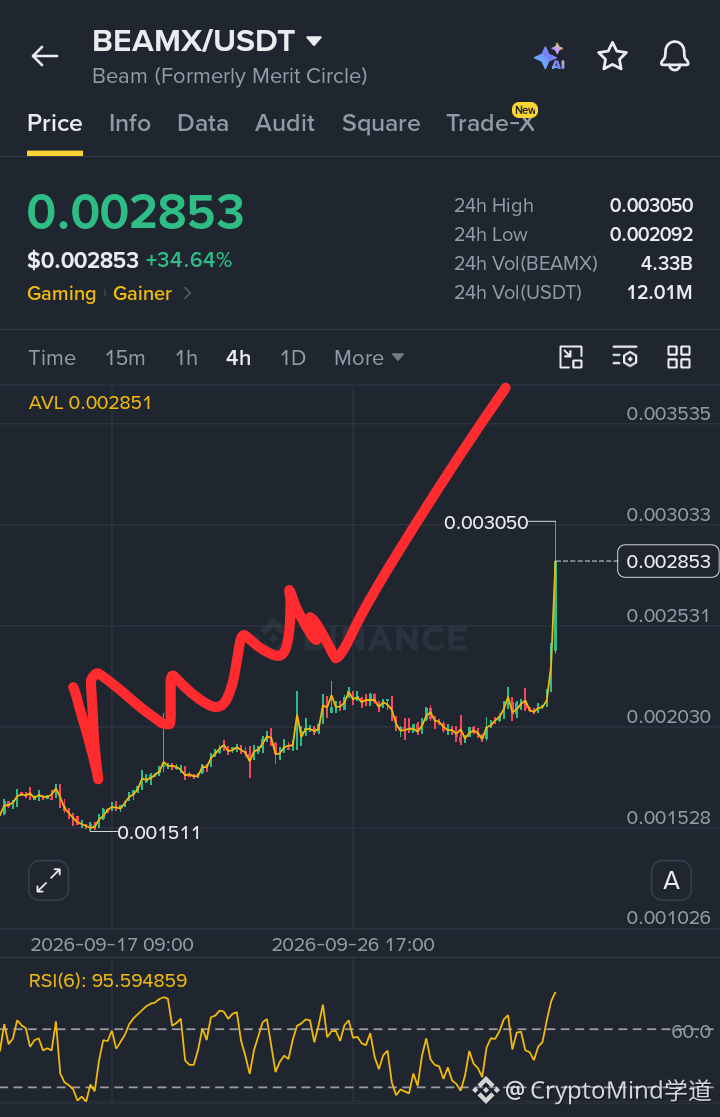
$BEAMX acabou de ir de 0.001511 para 0.003050 sem pausa. O RSI está em 95. Eu já fui a liquidez de saída em movimentos como esse várias vezes.
Zona de Compra: 0.002400 - 0.002700
TP1: 0.003050
TP2: 0.003600
Invalidação: 0.002000
Vou deixar $BEAMX esfriar e vir até mim — não o contrário
Você vai comprar esta ruptura do $BEAMX ou vai esperar a correção? Siga para setups de elite
{spot}(BEAMXUSDT)
Correr atrás desta vela é como você fica preso
$BEAMX acabou de ir de 0.001511 para 0.003050 sem pausa. O RSI está em 95. Eu já fui a liquidez de saída em movimentos como esse várias vezes.
Zona de Compra: 0.002400 - 0.002700
TP1: 0.003050
TP2: 0.003600
Invalidação: 0.002000
Vou deixar $BEAMX esfriar e vir até mim — não o contrário
Você vai comprar esta ruptura do $BEAMX ou vai esperar a correção? Siga para setups de elite
$BEAMX acabou de ir de 0.001511 para 0.003050 sem pausa. O RSI está em 95. Eu já fui a liquidez de saída em movimentos como esse várias vezes.
Zona de Compra: 0.002400 - 0.002700
TP1: 0.003050
TP2: 0.003600
Invalidação: 0.002000
Vou deixar $BEAMX esfriar e vir até mim — não o contrário
Você vai comprar esta ruptura do $BEAMX ou vai esperar a correção? Siga para setups de elite
95
·
--
Em Baixa
Ver tradução
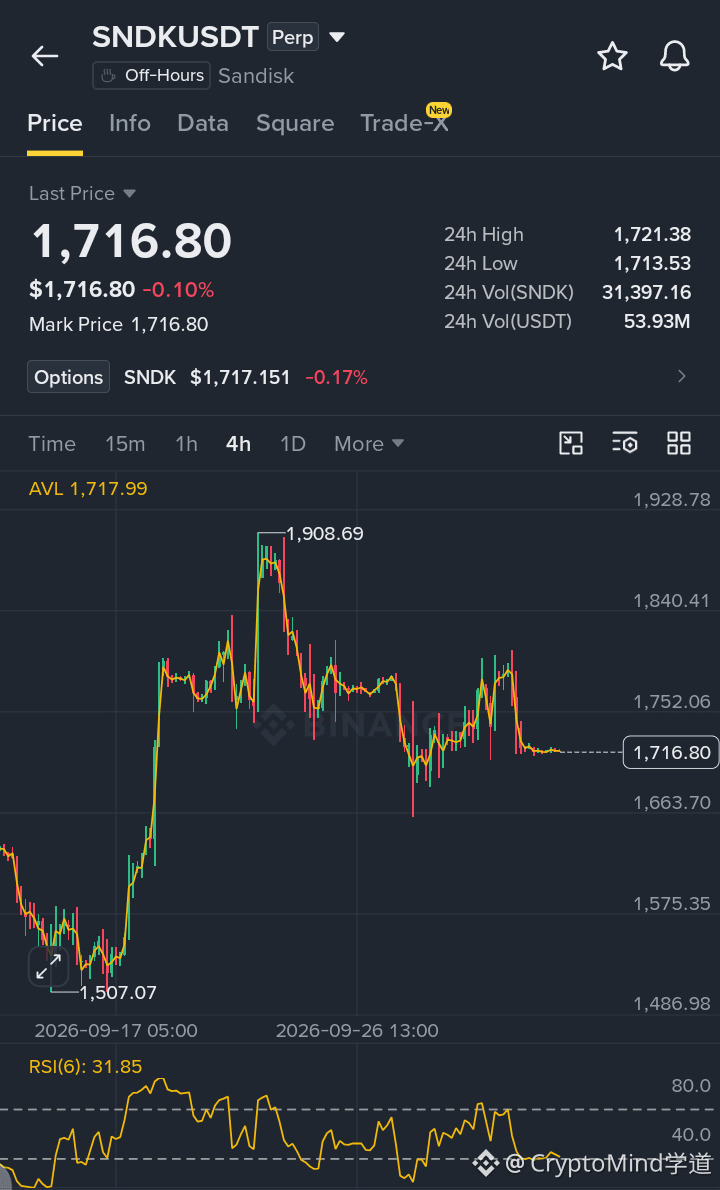
Lost 1,800. RSI 31.85. Structure's broken. 📉
🔴 Short $SNDK
🚪 Entry 1716.80
💰 Targets 1650.00, 1580.00
🛑 Stop 1760.00
Which level matters most to you?
{future}(SNDKUSDT)
Lost 1,800. RSI 31.85. Structure's broken. 📉
🔴 Short $SNDK
🚪 Entry 1716.80
💰 Targets 1650.00, 1580.00
🛑 Stop 1760.00
Which level matters most to you?
🔴 Short $SNDK
🚪 Entry 1716.80
💰 Targets 1650.00, 1580.00
🛑 Stop 1760.00
Which level matters most to you?
75
·
--
Artigo
Ver tradução
I Watched $806 Million Vanish OvernightI was about to close my laptop Thursday night when the alert hit. Bitcoin had just touched $87,200. Ten minutes later it was under $84,000. I sat back down.
A friend called me at 11 p.m. His voice was different. He’d been long since $82K, leveraged, feeling smart. He wasn’t feeling smart anymore.
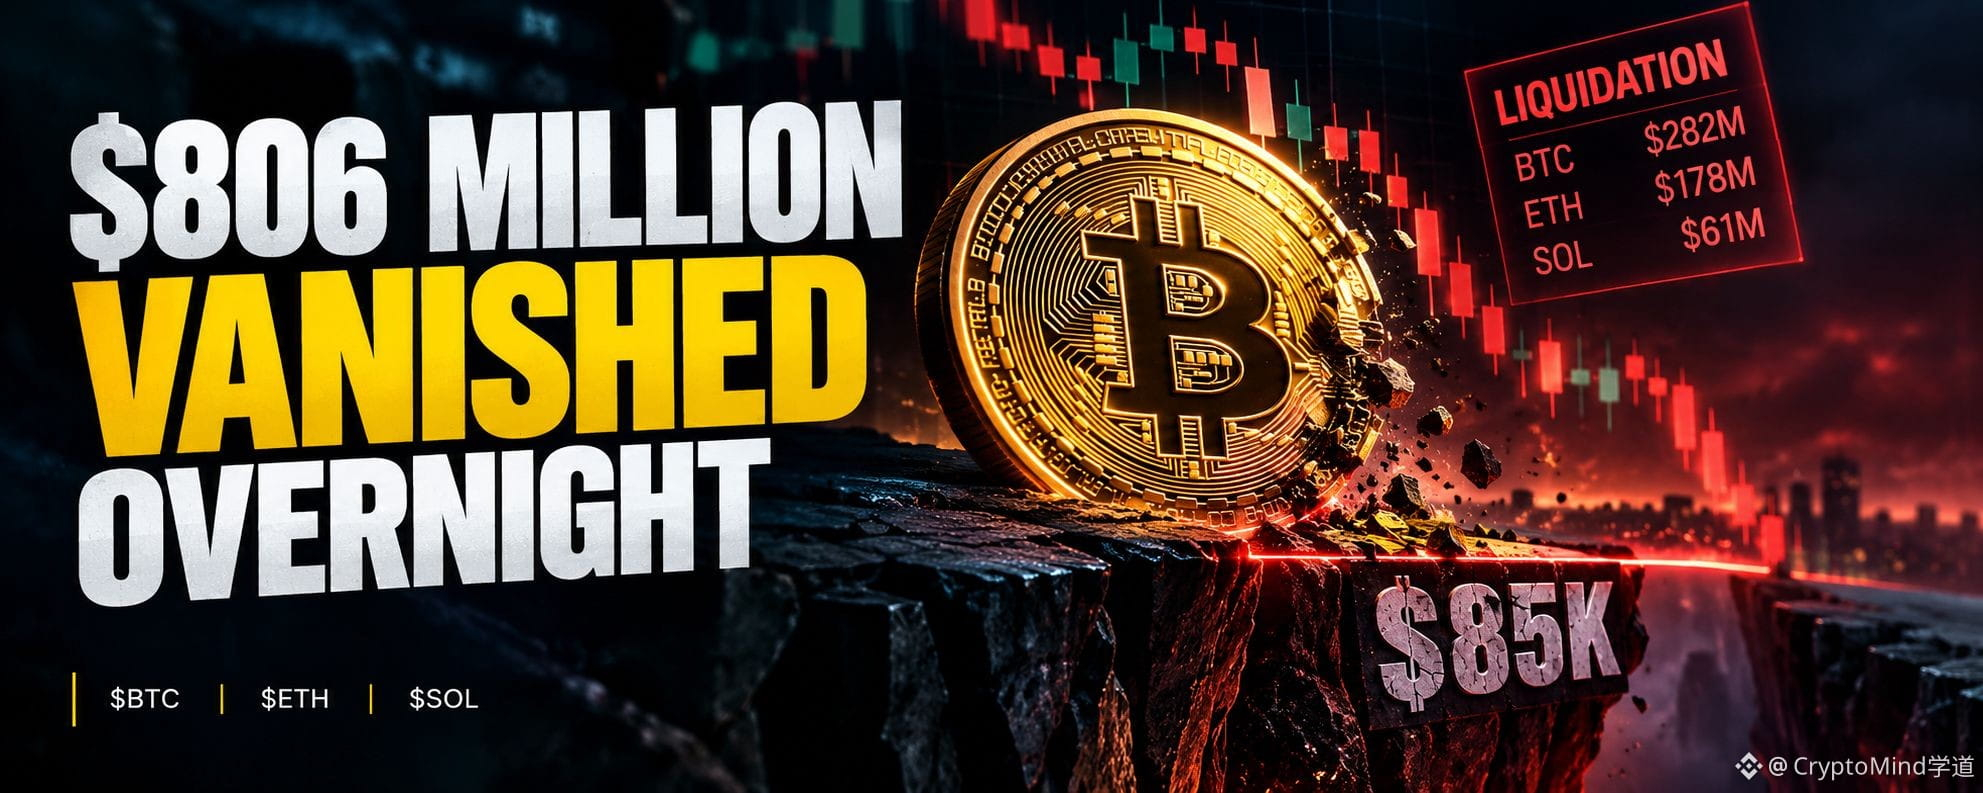
Over $806 million in futures positions were liquidated across crypto in the 24 hours ending October 3. Bitcoin led with $282 million. Ethereum followed at $178 million. Solana and XRP bled another $61 million combined.
I’ve been on that side before. Back in 2021, I was long ETH at what I thought was a sure thing. The funding was positive, the crowd was euphoric, everything looked perfect. Then a single red candle took me out in under three minutes. I remember refreshing the page like the number would come back. It didn’t.
Here’s what actually happened.
The U.S. jobs report dropped Thursday morning. September nonfarm payrolls grew by just 29,000 — roughly a third of what consensus expected. Unemployment ticked up to 4.2%. The initial reaction made sense: weak jobs data means the Fed might hold off on rate hikes, which is good for risk assets. Bitcoin jumped from $86,000 to $87,200 in moments. Then the reversal started.
BTC shed more than $3,000 in a few hours. First $85,500. Then below $84,000. A single Binance liquidation order of nearly $12 million hit the tape. That’s not a trader exiting a position. That’s a forced sale. A margin call executed at market, no negotiation, no waiting for a better price.
Here’s the part nobody’s saying. Everyone’s blaming the jobs report. But the report wasn’t bearish. It was the excuse. The real setup was the leverage that built up before the data dropped. Open interest on Bitcoin futures climbed by $2.3 billion in the days leading up to Thursday. Funding rates tripled from around 3% to 10%. That means traders were paying 10% annualized just to hold long positions. They were that confident. They were that crowded. And they were that vulnerable.
I’m not bearish. I’m just saying the people who got liquidated weren’t unlucky. They were positioned badly in a market that punishes that.
The contrarian angle is this: everyone’s watching the jobs report headlines, but the real signal was the order book. A wall of sell orders sat around $85,000 all week. Once buyers cleared that wall, the remaining sell orders got pulled. That’s what let price accelerate upward to $86,857. Then the same thin liquidity that helped the pump made the dump violent. When forced selling hit, there was nothing underneath to catch it.
Liquidation cascades don’t tell you direction. They tell you positioning. The longs were positioned for $90K. The market showed them $83K instead.
The level that matters now is $85,000. BTC broke above it during Friday’s short squeeze, triggering $122 million in short liquidations. That’s the flip side of Thursday’s pain. The same mechanism that destroyed longs on Thursday destroyed shorts on Friday. Over $210 million in shorts across crypto got liquidated when BTC pushed back toward $87,000.
If $85,000 holds as support on a daily close, the shorts that just got liquidated will start rebuilding. They’ll cluster above $87,000. If the pattern holds, those clusters become the fuel for the next squeeze. If $85,000 breaks? The forced buying that drove Friday’s rally disappears. The spot bid underneath was thin. The same cascade can run in reverse. Again.
What’s happening on the whale side tells a different story. Bitcoin whales reduced their holdings by about 30,000 BTC — roughly $2.52 billion — during the recent sideways stretch. Ethereum whales added 60,000 ETH. Solana’s stablecoin market cap just crossed $15 billion, with Fiserv putting a live bank stablecoin on the network this week. That’s not a uniform signal. It’s a market where big money is rotating, not accumulating everything.
Spot Bitcoin ETFs flipped back to inflows on the first trading day of October, pulling in $102.7 million after their strongest quarter of 2026. Ethereum ETFs bled $55.4 million the same day — their third straight day of outflows. The fear and greed index sits at 72. Greed. Down two points from yesterday. Still greed.
$BTC $ETH $SOL
#Bitcoin #crypto #liquidation
The move was real. $806 million in forced closes is real. But real moves still need a base to stand on. Right now, the base is $85,000. Everything above it is leverage and hope. Everything below it is a vacuum.
If you got liquidated Thursday night, did you learn something — or did you just get angry?
I Watched $806 Million Vanish Overnight
I was about to close my laptop Thursday night when the alert hit. Bitcoin had just touched $87,200. Ten minutes later it was under $84,000. I sat back down.
A friend called me at 11 p.m. His voice was different. He’d been long since $82K, leveraged, feeling smart. He wasn’t feeling smart anymore.
Over $806 million in futures positions were liquidated across crypto in the 24 hours ending October 3. Bitcoin led with $282 million. Ethereum followed at $178 million. Solana and XRP bled another $61 million combined.
I’ve been on that side before. Back in 2021, I was long ETH at what I thought was a sure thing. The funding was positive, the crowd was euphoric, everything looked perfect. Then a single red candle took me out in under three minutes. I remember refreshing the page like the number would come back. It didn’t.
Here’s what actually happened.
The U.S. jobs report dropped Thursday morning. September nonfarm payrolls grew by just 29,000 — roughly a third of what consensus expected. Unemployment ticked up to 4.2%. The initial reaction made sense: weak jobs data means the Fed might hold off on rate hikes, which is good for risk assets. Bitcoin jumped from $86,000 to $87,200 in moments. Then the reversal started.
BTC shed more than $3,000 in a few hours. First $85,500. Then below $84,000. A single Binance liquidation order of nearly $12 million hit the tape. That’s not a trader exiting a position. That’s a forced sale. A margin call executed at market, no negotiation, no waiting for a better price.
Here’s the part nobody’s saying. Everyone’s blaming the jobs report. But the report wasn’t bearish. It was the excuse. The real setup was the leverage that built up before the data dropped. Open interest on Bitcoin futures climbed by $2.3 billion in the days leading up to Thursday. Funding rates tripled from around 3% to 10%. That means traders were paying 10% annualized just to hold long positions. They were that confident. They were that crowded. And they were that vulnerable.
I’m not bearish. I’m just saying the people who got liquidated weren’t unlucky. They were positioned badly in a market that punishes that.
The contrarian angle is this: everyone’s watching the jobs report headlines, but the real signal was the order book. A wall of sell orders sat around $85,000 all week. Once buyers cleared that wall, the remaining sell orders got pulled. That’s what let price accelerate upward to $86,857. Then the same thin liquidity that helped the pump made the dump violent. When forced selling hit, there was nothing underneath to catch it.
Liquidation cascades don’t tell you direction. They tell you positioning. The longs were positioned for $90K. The market showed them $83K instead.
The level that matters now is $85,000. BTC broke above it during Friday’s short squeeze, triggering $122 million in short liquidations. That’s the flip side of Thursday’s pain. The same mechanism that destroyed longs on Thursday destroyed shorts on Friday. Over $210 million in shorts across crypto got liquidated when BTC pushed back toward $87,000.
If $85,000 holds as support on a daily close, the shorts that just got liquidated will start rebuilding. They’ll cluster above $87,000. If the pattern holds, those clusters become the fuel for the next squeeze. If $85,000 breaks? The forced buying that drove Friday’s rally disappears. The spot bid underneath was thin. The same cascade can run in reverse. Again.
What’s happening on the whale side tells a different story. Bitcoin whales reduced their holdings by about 30,000 BTC — roughly $2.52 billion — during the recent sideways stretch. Ethereum whales added 60,000 ETH. Solana’s stablecoin market cap just crossed $15 billion, with Fiserv putting a live bank stablecoin on the network this week. That’s not a uniform signal. It’s a market where big money is rotating, not accumulating everything.
Spot Bitcoin ETFs flipped back to inflows on the first trading day of October, pulling in $102.7 million after their strongest quarter of 2026. Ethereum ETFs bled $55.4 million the same day — their third straight day of outflows. The fear and greed index sits at 72. Greed. Down two points from yesterday. Still greed.
$BTC $ETH $SOL
#Bitcoin #crypto #liquidation
The move was real. $806 million in forced closes is real. But real moves still need a base to stand on. Right now, the base is $85,000. Everything above it is leverage and hope. Everything below it is a vacuum.
If you got liquidated Thursday night, did you learn something — or did you just get angry?
A friend called me at 11 p.m. His voice was different. He’d been long since $82K, leveraged, feeling smart. He wasn’t feeling smart anymore.
Over $806 million in futures positions were liquidated across crypto in the 24 hours ending October 3. Bitcoin led with $282 million. Ethereum followed at $178 million. Solana and XRP bled another $61 million combined.
I’ve been on that side before. Back in 2021, I was long ETH at what I thought was a sure thing. The funding was positive, the crowd was euphoric, everything looked perfect. Then a single red candle took me out in under three minutes. I remember refreshing the page like the number would come back. It didn’t.
Here’s what actually happened.
The U.S. jobs report dropped Thursday morning. September nonfarm payrolls grew by just 29,000 — roughly a third of what consensus expected. Unemployment ticked up to 4.2%. The initial reaction made sense: weak jobs data means the Fed might hold off on rate hikes, which is good for risk assets. Bitcoin jumped from $86,000 to $87,200 in moments. Then the reversal started.
BTC shed more than $3,000 in a few hours. First $85,500. Then below $84,000. A single Binance liquidation order of nearly $12 million hit the tape. That’s not a trader exiting a position. That’s a forced sale. A margin call executed at market, no negotiation, no waiting for a better price.
Here’s the part nobody’s saying. Everyone’s blaming the jobs report. But the report wasn’t bearish. It was the excuse. The real setup was the leverage that built up before the data dropped. Open interest on Bitcoin futures climbed by $2.3 billion in the days leading up to Thursday. Funding rates tripled from around 3% to 10%. That means traders were paying 10% annualized just to hold long positions. They were that confident. They were that crowded. And they were that vulnerable.
I’m not bearish. I’m just saying the people who got liquidated weren’t unlucky. They were positioned badly in a market that punishes that.
The contrarian angle is this: everyone’s watching the jobs report headlines, but the real signal was the order book. A wall of sell orders sat around $85,000 all week. Once buyers cleared that wall, the remaining sell orders got pulled. That’s what let price accelerate upward to $86,857. Then the same thin liquidity that helped the pump made the dump violent. When forced selling hit, there was nothing underneath to catch it.
Liquidation cascades don’t tell you direction. They tell you positioning. The longs were positioned for $90K. The market showed them $83K instead.
The level that matters now is $85,000. BTC broke above it during Friday’s short squeeze, triggering $122 million in short liquidations. That’s the flip side of Thursday’s pain. The same mechanism that destroyed longs on Thursday destroyed shorts on Friday. Over $210 million in shorts across crypto got liquidated when BTC pushed back toward $87,000.
If $85,000 holds as support on a daily close, the shorts that just got liquidated will start rebuilding. They’ll cluster above $87,000. If the pattern holds, those clusters become the fuel for the next squeeze. If $85,000 breaks? The forced buying that drove Friday’s rally disappears. The spot bid underneath was thin. The same cascade can run in reverse. Again.
What’s happening on the whale side tells a different story. Bitcoin whales reduced their holdings by about 30,000 BTC — roughly $2.52 billion — during the recent sideways stretch. Ethereum whales added 60,000 ETH. Solana’s stablecoin market cap just crossed $15 billion, with Fiserv putting a live bank stablecoin on the network this week. That’s not a uniform signal. It’s a market where big money is rotating, not accumulating everything.
Spot Bitcoin ETFs flipped back to inflows on the first trading day of October, pulling in $102.7 million after their strongest quarter of 2026. Ethereum ETFs bled $55.4 million the same day — their third straight day of outflows. The fear and greed index sits at 72. Greed. Down two points from yesterday. Still greed.
$BTC $ETH $SOL
#Bitcoin #crypto #liquidation
The move was real. $806 million in forced closes is real. But real moves still need a base to stand on. Right now, the base is $85,000. Everything above it is leverage and hope. Everything below it is a vacuum.
If you got liquidated Thursday night, did you learn something — or did you just get angry?
1
65
·
--
Em Alta
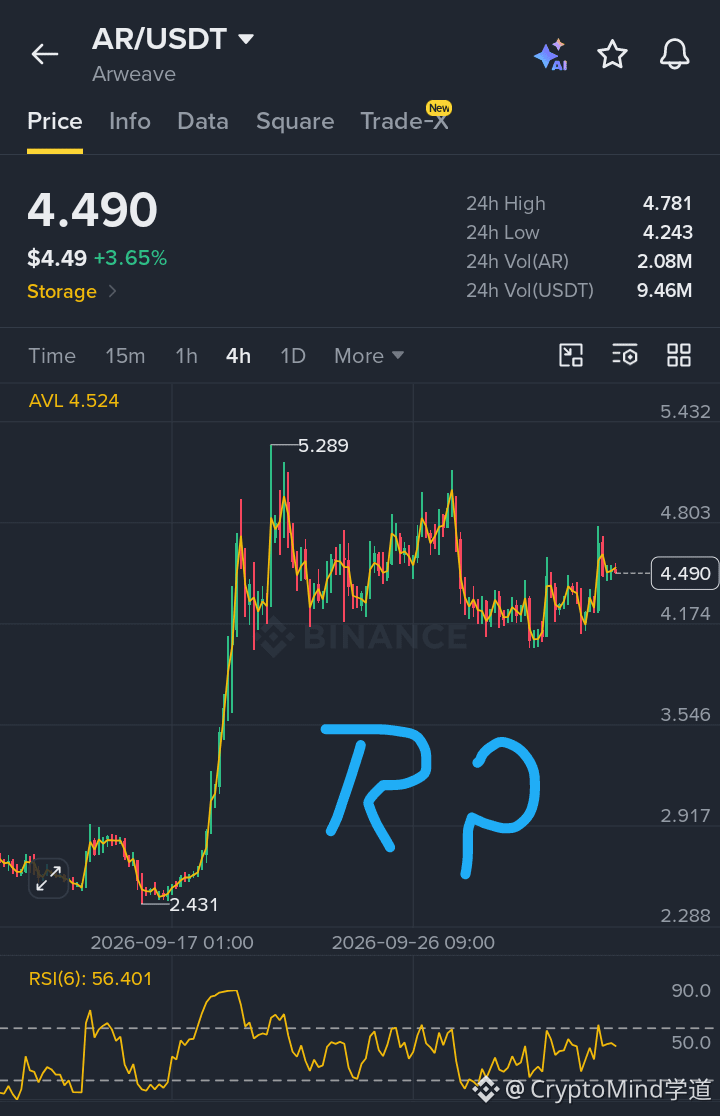
Rapazes, a maioria ignora $AR como apenas armazenamento, mas a atualização do AO faz dele um computador hiper-paralelo descentralizado. Isso é um fosso enorme.
O RSI está saudável em 56, ainda há bastante espaço antes de superaquecer. Estou fazendo DCA neste vai e vem.
Estou acumulando por volta de 4.20, virando uma antiga resistência em suporte. As metas são 4.80 e uma nova testagem de 5.28. Será invalidado se perdermos 3.50
{spot}(ARUSDT)
O mercado já está precificando a virada em computação?
Rapazes, a maioria ignora $AR como apenas armazenamento, mas a atualização do AO faz dele um computador hiper-paralelo descentralizado. Isso é um fosso enorme.
O RSI está saudável em 56, ainda há bastante espaço antes de superaquecer. Estou fazendo DCA neste vai e vem.
Estou acumulando por volta de 4.20, virando uma antiga resistência em suporte. As metas são 4.80 e uma nova testagem de 5.28. Será invalidado se perdermos 3.50
O mercado já está precificando a virada em computação?
O RSI está saudável em 56, ainda há bastante espaço antes de superaquecer. Estou fazendo DCA neste vai e vem.
Estou acumulando por volta de 4.20, virando uma antiga resistência em suporte. As metas são 4.80 e uma nova testagem de 5.28. Será invalidado se perdermos 3.50
O mercado já está precificando a virada em computação?

115
·
--
Parcialmente verdadeiro
Artigo
STRK AVANÇA ANTES DA ATUALIZAÇÃO DA REDE ENQUANTO OS TRADERS CORREM PARA ENTRARA sessão asiática fechou há algumas horas.
Londres está na metade do seu dia.
Nova York ainda não abriu.
É quando o mercado fica silencioso e a leitura real aparece.
As últimas quatro horas mal mexeram no indicador.
Mas esse pavio até 0,05344 disse algo.
$STRK funding está em 0,0100% na Binance, Bybit e Hyperliquid.
A Kraken está a gritar a 0,1467%, sinalizando longs lotados nesse venue.
O open interest explodiu 25,71% em 24 horas para US$ 74,68 milhões.
O OI da Bybit disparou 64%, a Hyperliquid subiu 69% e a Gate quase dobrou em 73%.
STRK AVANÇA ANTES DA ATUALIZAÇÃO DA REDE ENQUANTO OS TRADERS CORREM PARA ENTRAR
A sessão asiática fechou há algumas horas.
Londres está na metade do seu dia.
Nova York ainda não abriu.
É quando o mercado fica silencioso e a leitura real aparece.
As últimas quatro horas mal mexeram no indicador.
Mas esse pavio até 0,05344 disse algo.
$STRK funding está em 0,0100% na Binance, Bybit e Hyperliquid.
A Kraken está a gritar a 0,1467%, sinalizando longs lotados nesse venue.
O open interest explodiu 25,71% em 24 horas para US$ 74,68 milhões.
O OI da Bybit disparou 64%, a Hyperliquid subiu 69% e a Gate quase dobrou em 73%.
Londres está na metade do seu dia.
Nova York ainda não abriu.
É quando o mercado fica silencioso e a leitura real aparece.
As últimas quatro horas mal mexeram no indicador.
Mas esse pavio até 0,05344 disse algo.
$STRK funding está em 0,0100% na Binance, Bybit e Hyperliquid.
A Kraken está a gritar a 0,1467%, sinalizando longs lotados nesse venue.
O open interest explodiu 25,71% em 24 horas para US$ 74,68 milhões.
O OI da Bybit disparou 64%, a Hyperliquid subiu 69% e a Gate quase dobrou em 73%.
26
·
--
Em Baixa
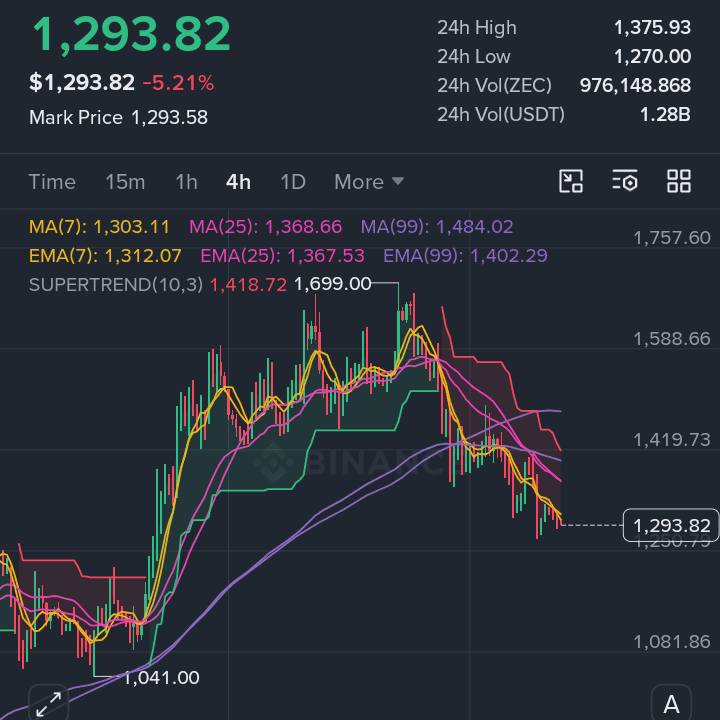
Ei, pessoal. Cada repique em $ZEC continua sendo vendido. Estou ficando para o próximo... 📉
Estou procurando uma entrada curta por volta de 1.300 - 1.310
É aí que as duas últimas altas morreram, então essa é minha linha vermelha
Primeiro alvo 1.270. 🎯
A mínima recente. Quando quebrar, os vendedores entram rápido
Depois 1.200. 🎯
Números redondos puxam o preço como um ímã
Se realmente der caminho, 1.081. 🎯
Piso antigo do mês passado, lá parado, esperando
Pare em 1.370. 🛑
Acima disso, a tese de venda está errada e eu saio, sem discussão
Aprendi da forma mais difícil: uma vez eu mantive um short perdedor durante um repique porque movi meu stop apenas uma vez. Perdi um mês inteiro bom. O stop fica exatamente onde eu coloquei
Tamanho pequeno para um pavio subir não te tirar antes mesmo da jogada acontecer
Esse $ZEC repica aqui ou despenca mais abaixo? Curioso com o que vocês acham
{future}(ZECUSDT)
#ZECUSDT $AIN
Ei, pessoal. Cada repique em $ZEC continua sendo vendido. Estou ficando para o próximo... 📉
Estou procurando uma entrada curta por volta de 1.300 - 1.310
É aí que as duas últimas altas morreram, então essa é minha linha vermelha
Primeiro alvo 1.270. 🎯
A mínima recente. Quando quebrar, os vendedores entram rápido
Depois 1.200. 🎯
Números redondos puxam o preço como um ímã
Se realmente der caminho, 1.081. 🎯
Piso antigo do mês passado, lá parado, esperando
Pare em 1.370. 🛑
Acima disso, a tese de venda está errada e eu saio, sem discussão
Aprendi da forma mais difícil: uma vez eu mantive um short perdedor durante um repique porque movi meu stop apenas uma vez. Perdi um mês inteiro bom. O stop fica exatamente onde eu coloquei
Tamanho pequeno para um pavio subir não te tirar antes mesmo da jogada acontecer
Esse $ZEC repica aqui ou despenca mais abaixo? Curioso com o que vocês acham
#ZECUSDT $AIN
Estou procurando uma entrada curta por volta de 1.300 - 1.310
É aí que as duas últimas altas morreram, então essa é minha linha vermelha
Primeiro alvo 1.270. 🎯
A mínima recente. Quando quebrar, os vendedores entram rápido
Depois 1.200. 🎯
Números redondos puxam o preço como um ímã
Se realmente der caminho, 1.081. 🎯
Piso antigo do mês passado, lá parado, esperando
Pare em 1.370. 🛑
Acima disso, a tese de venda está errada e eu saio, sem discussão
Aprendi da forma mais difícil: uma vez eu mantive um short perdedor durante um repique porque movi meu stop apenas uma vez. Perdi um mês inteiro bom. O stop fica exatamente onde eu coloquei
Tamanho pequeno para um pavio subir não te tirar antes mesmo da jogada acontecer
Esse $ZEC repica aqui ou despenca mais abaixo? Curioso com o que vocês acham
#ZECUSDT $AIN
25
·
--
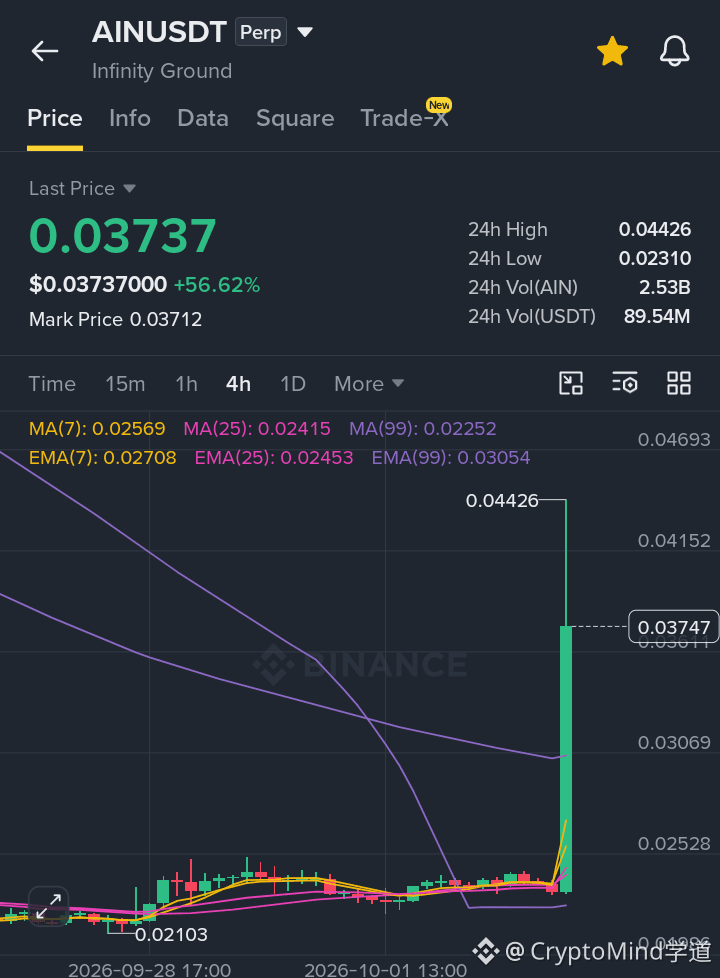
O pavio de 0.04426 foi rejeitado com força. Um pico pesado de volume, mas os compradores desapareceram, deixando uma longa sombra superior. 🧊
🔴 Short $AIN
🚪 Entrada 0.03747
💰 Alvos 0.02528, 0.02103
Stop 0.04450
Você está shortando o rompimento? 👀
{future}(AINUSDT)
O pavio de 0.04426 foi rejeitado com força. Um pico pesado de volume, mas os compradores desapareceram, deixando uma longa sombra superior. 🧊
🔴 Short $AIN
🚪 Entrada 0.03747
💰 Alvos 0.02528, 0.02103
Stop 0.04450
Você está shortando o rompimento? 👀
🔴 Short $AIN
🚪 Entrada 0.03747
💰 Alvos 0.02528, 0.02103
Stop 0.04450
Você está shortando o rompimento? 👀
170
·
--
Em Alta
O novo listamento do Binance Alpha acabou de dar a este token o volume de que ele precisava, enquanto os outros dois ainda procuram uma narrativa real. 📉
🐂 Long $龙虾
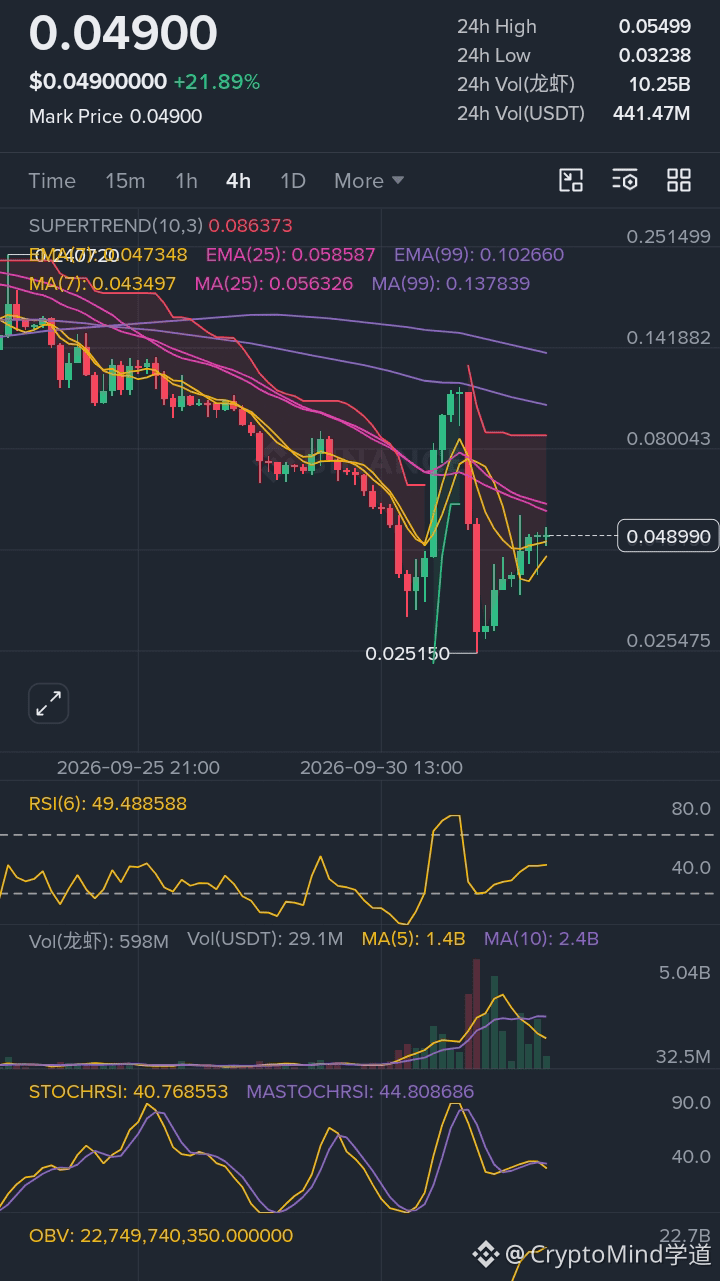
🚪 Entrada 0.04900
💰 Alvos 0.05400, 0.06000
🛑 Stop 0.04300
Negocie aqui 👇🏽
{future}(龙虾USDT)
Por que 龙虾 é o Melhor Trade 🚀
A configuração aqui é a mais limpa das três. O principal catalisador é o listamento do Binance Alpha, que trouxe volume de varejo e acesso direto via Binance Wallet Perpetuals com 0% de taxas para maker. O gráfico mostra um repique a partir de 0.02515 e agora está consolidando em torno de 0.04900. A funding está em 0%, ou seja, não há prêmio para pagar — uma entrada limpa. O RSI está em 49, bem na zona segura, sem estar sobrecomprado nem sobrevendido. O open interest está em US$ 86,92M, mostrando que há alavancagem suficiente no mercado para um short squeeze se o preço romper para cima.
Por que VELVET e ONE não valem o risco
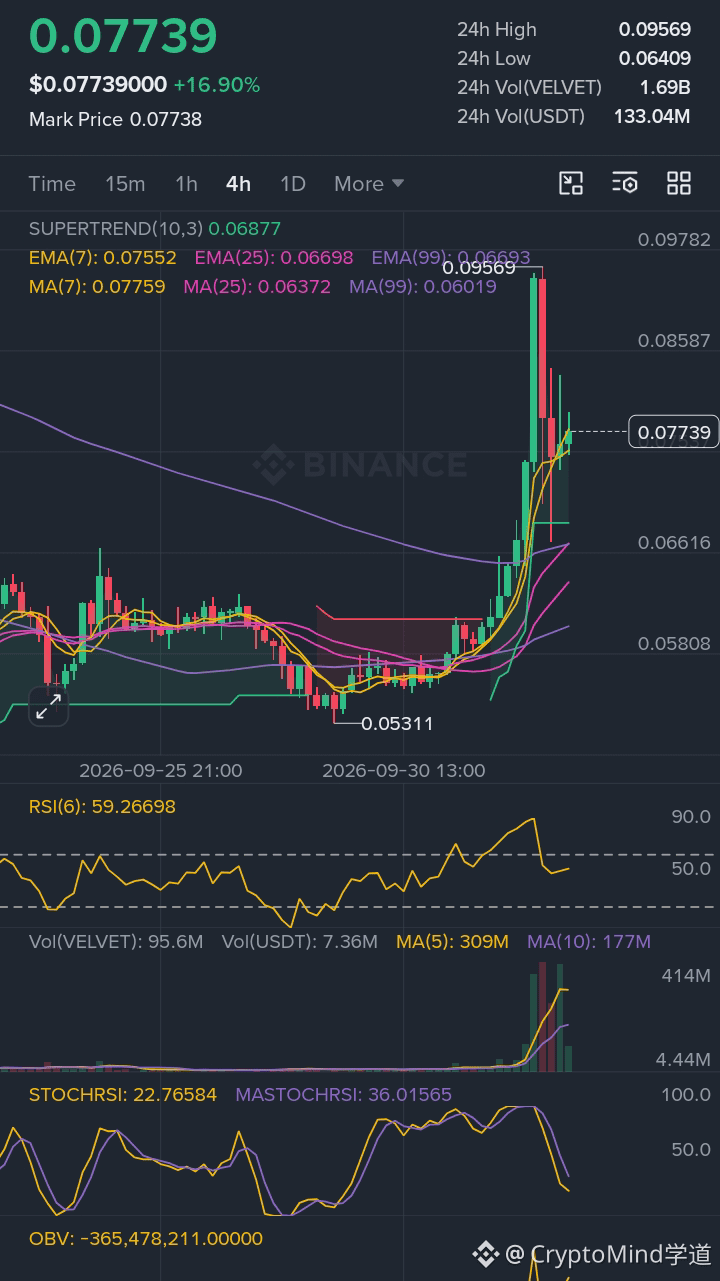
· $VELVET (0.07739): O RSI está em 59, mas a taxa de funding é positiva e subindo, o que significa que os longs já estão pagando pesado. O open interest está em US$ 9,35M, o que cria um risco enorme de long-squeeze se o preço cair — uma configuração em que os longs atrasados ficam presos.
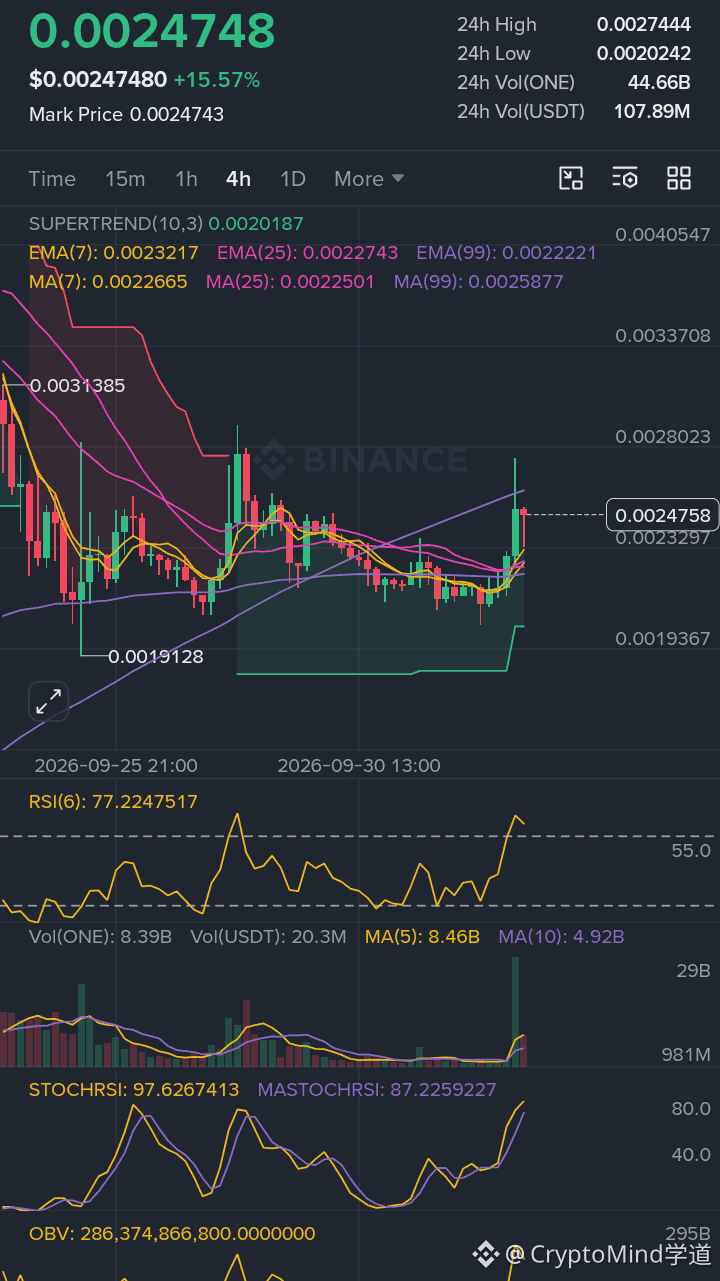
· $ONE (0.0024748): O RSI está em 77 (sobrecomprado) e a funding é negativa em -0.1134%, indicando sentimento misto. O problema maior é que a Harmony propôs um desligamento completo do mainnet e a migração do token ONE para o Ethereum, com usuários orientados a sair de todos os contratos inteligentes até 10 de setembro de 2026. Isso é um pump por narrativa, sem utilidade real restante — negociar isso é apostar em notícias.
Você está shortando a quebra?
{future}(VELVETUSDT)
{future}(ONEUSDT)
O novo listamento do Binance Alpha acabou de dar a este token o volume de que ele precisava, enquanto os outros dois ainda procuram uma narrativa real. 📉
🐂 Long $龙虾
🚪 Entrada 0.04900
💰 Alvos 0.05400, 0.06000
🛑 Stop 0.04300
Negocie aqui 👇🏽
Por que 龙虾 é o Melhor Trade 🚀
A configuração aqui é a mais limpa das três. O principal catalisador é o listamento do Binance Alpha, que trouxe volume de varejo e acesso direto via Binance Wallet Perpetuals com 0% de taxas para maker. O gráfico mostra um repique a partir de 0.02515 e agora está consolidando em torno de 0.04900. A funding está em 0%, ou seja, não há prêmio para pagar — uma entrada limpa. O RSI está em 49, bem na zona segura, sem estar sobrecomprado nem sobrevendido. O open interest está em US$ 86,92M, mostrando que há alavancagem suficiente no mercado para um short squeeze se o preço romper para cima.
Por que VELVET e ONE não valem o risco
· $VELVET (0.07739): O RSI está em 59, mas a taxa de funding é positiva e subindo, o que significa que os longs já estão pagando pesado. O open interest está em US$ 9,35M, o que cria um risco enorme de long-squeeze se o preço cair — uma configuração em que os longs atrasados ficam presos.
· $ONE (0.0024748): O RSI está em 77 (sobrecomprado) e a funding é negativa em -0.1134%, indicando sentimento misto. O problema maior é que a Harmony propôs um desligamento completo do mainnet e a migração do token ONE para o Ethereum, com usuários orientados a sair de todos os contratos inteligentes até 10 de setembro de 2026. Isso é um pump por narrativa, sem utilidade real restante — negociar isso é apostar em notícias.
Você está shortando a quebra?
🐂 Long $龙虾
🚪 Entrada 0.04900
💰 Alvos 0.05400, 0.06000
🛑 Stop 0.04300
Negocie aqui 👇🏽
Por que 龙虾 é o Melhor Trade 🚀
A configuração aqui é a mais limpa das três. O principal catalisador é o listamento do Binance Alpha, que trouxe volume de varejo e acesso direto via Binance Wallet Perpetuals com 0% de taxas para maker. O gráfico mostra um repique a partir de 0.02515 e agora está consolidando em torno de 0.04900. A funding está em 0%, ou seja, não há prêmio para pagar — uma entrada limpa. O RSI está em 49, bem na zona segura, sem estar sobrecomprado nem sobrevendido. O open interest está em US$ 86,92M, mostrando que há alavancagem suficiente no mercado para um short squeeze se o preço romper para cima.
Por que VELVET e ONE não valem o risco
· $VELVET (0.07739): O RSI está em 59, mas a taxa de funding é positiva e subindo, o que significa que os longs já estão pagando pesado. O open interest está em US$ 9,35M, o que cria um risco enorme de long-squeeze se o preço cair — uma configuração em que os longs atrasados ficam presos.
· $ONE (0.0024748): O RSI está em 77 (sobrecomprado) e a funding é negativa em -0.1134%, indicando sentimento misto. O problema maior é que a Harmony propôs um desligamento completo do mainnet e a migração do token ONE para o Ethereum, com usuários orientados a sair de todos os contratos inteligentes até 10 de setembro de 2026. Isso é um pump por narrativa, sem utilidade real restante — negociar isso é apostar em notícias.
Você está shortando a quebra?
128
·
--
Artigo
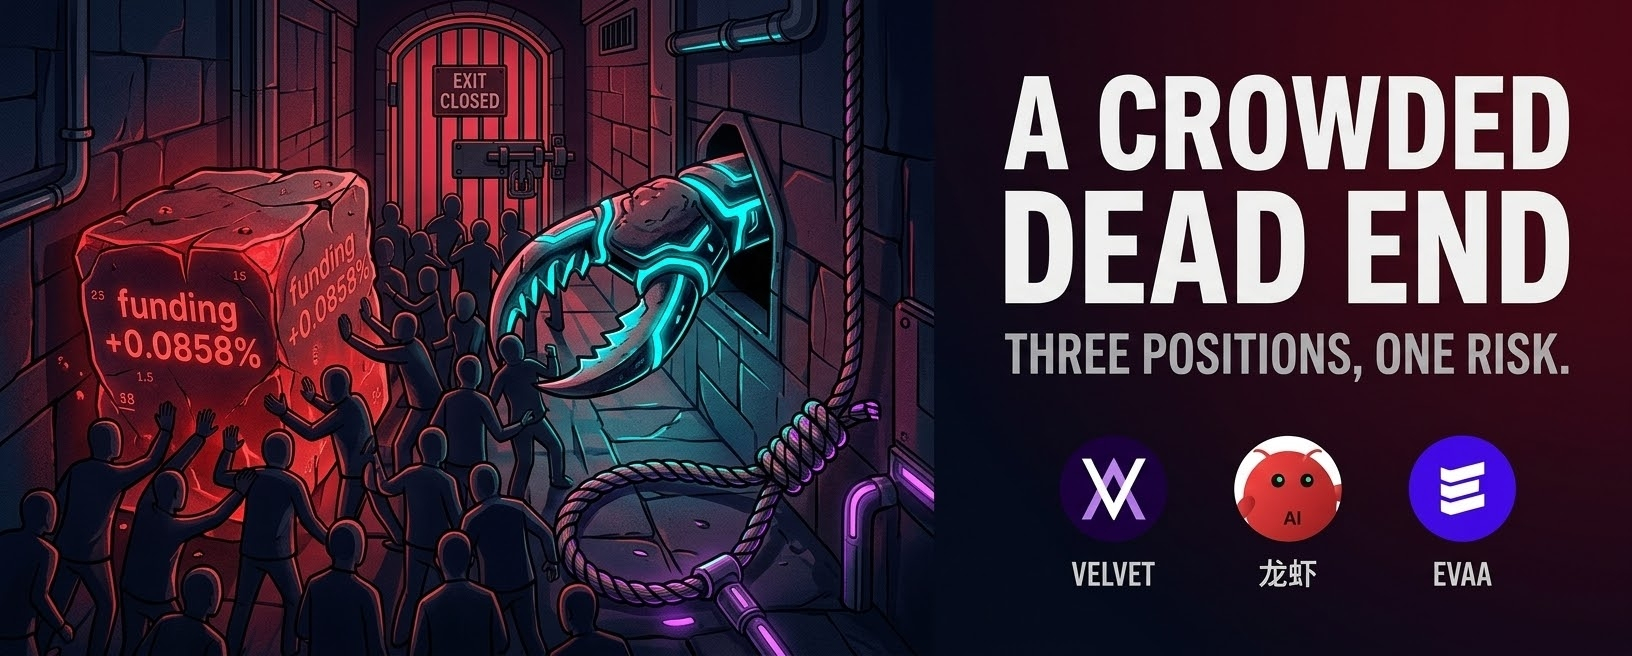
Bro, o ÚNICO Gráfico Que Importa é o Que Você Consegue Deixar...👀A primeira coisa que eu vi foi a taxa de funding. +0,0858% em uma dessas. Isso não é um mercado. É uma sala lotada com uma única saída
Eu já passei por ciclos suficientes para saber esse número. É o número que te diz que todo mundo está no mesmo lado do barco. E quando todo mundo está no mesmo lado, o barco inclina
$VELVET é o primeiro. Ele foi de 0,048 até 0,0956 em uma única sessão e depois devolveu metade disso. Isso não é uma ruptura. Isso é uma cascata de liquidações nos dois sentidos
O destaque é o prazo do airdrop em 10 de outubro. Mais de US$ 1M por epoch, e o próximo snapshot está a sete dias. O trading de perp te dá o dobro das “gems” e recompensas consecutivas de participação podem chegar a 150%. Isso é um incentivo financeiro direto para negociar e travar tokens antes do prazo. É real. E também é uma armadilha
Bro, o ÚNICO Gráfico Que Importa é o Que Você Consegue Deixar...👀
A primeira coisa que eu vi foi a taxa de funding. +0,0858% em uma dessas. Isso não é um mercado. É uma sala lotada com uma única saída
Eu já passei por ciclos suficientes para saber esse número. É o número que te diz que todo mundo está no mesmo lado do barco. E quando todo mundo está no mesmo lado, o barco inclina
$VELVET é o primeiro. Ele foi de 0,048 até 0,0956 em uma única sessão e depois devolveu metade disso. Isso não é uma ruptura. Isso é uma cascata de liquidações nos dois sentidos
O destaque é o prazo do airdrop em 10 de outubro. Mais de US$ 1M por epoch, e o próximo snapshot está a sete dias. O trading de perp te dá o dobro das “gems” e recompensas consecutivas de participação podem chegar a 150%. Isso é um incentivo financeiro direto para negociar e travar tokens antes do prazo. É real. E também é uma armadilha
Eu já passei por ciclos suficientes para saber esse número. É o número que te diz que todo mundo está no mesmo lado do barco. E quando todo mundo está no mesmo lado, o barco inclina
$VELVET é o primeiro. Ele foi de 0,048 até 0,0956 em uma única sessão e depois devolveu metade disso. Isso não é uma ruptura. Isso é uma cascata de liquidações nos dois sentidos
O destaque é o prazo do airdrop em 10 de outubro. Mais de US$ 1M por epoch, e o próximo snapshot está a sete dias. O trading de perp te dá o dobro das “gems” e recompensas consecutivas de participação podem chegar a 150%. Isso é um incentivo financeiro direto para negociar e travar tokens antes do prazo. É real. E também é uma armadilha
229
·
--
Rapazes, este gráfico mudou a estrutura na semana passada
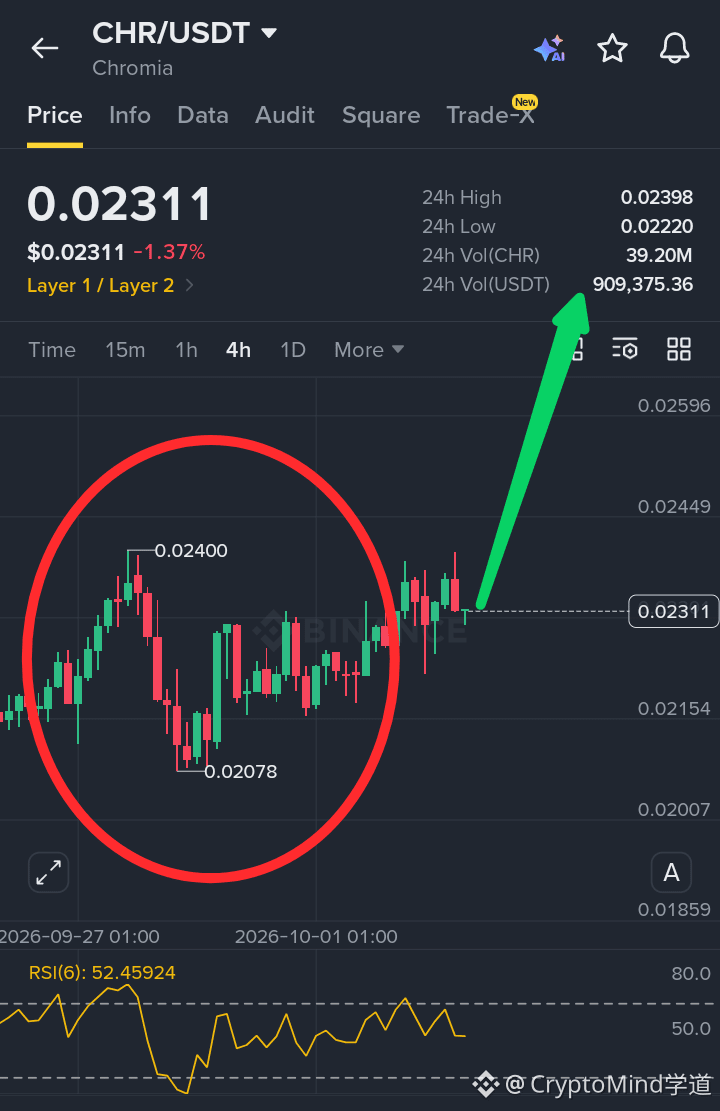
$CHR reagiu forte para fora de 0.02078 e está, silenciosamente, construindo uma base. Eu já comprei este padrão exato antes, mas fui cortado quando o volume secou.
Zona de Compra: 0.02200 a 0.02250
TP1: 0.02400
TP2: 0.02596
Invalidação: 0.02070
Se $CHR não vier para a minha zona, eu não forço
Você está adicionando aos seus $CHR aqui? 🤔
Siga para setups de alta qualidade.
{spot}(CHRUSDT)
#CHRUSDT
Rapazes, este gráfico mudou a estrutura na semana passada
$CHR reagiu forte para fora de 0.02078 e está, silenciosamente, construindo uma base. Eu já comprei este padrão exato antes, mas fui cortado quando o volume secou.
Zona de Compra: 0.02200 a 0.02250
TP1: 0.02400
TP2: 0.02596
Invalidação: 0.02070
Se $CHR não vier para a minha zona, eu não forço
Você está adicionando aos seus $CHR aqui? 🤔
Siga para setups de alta qualidade.
#CHRUSDT
$CHR reagiu forte para fora de 0.02078 e está, silenciosamente, construindo uma base. Eu já comprei este padrão exato antes, mas fui cortado quando o volume secou.
Zona de Compra: 0.02200 a 0.02250
TP1: 0.02400
TP2: 0.02596
Invalidação: 0.02070
Se $CHR não vier para a minha zona, eu não forço
Você está adicionando aos seus $CHR aqui? 🤔
Siga para setups de alta qualidade.
#CHRUSDT
48
·
--
Em Alta
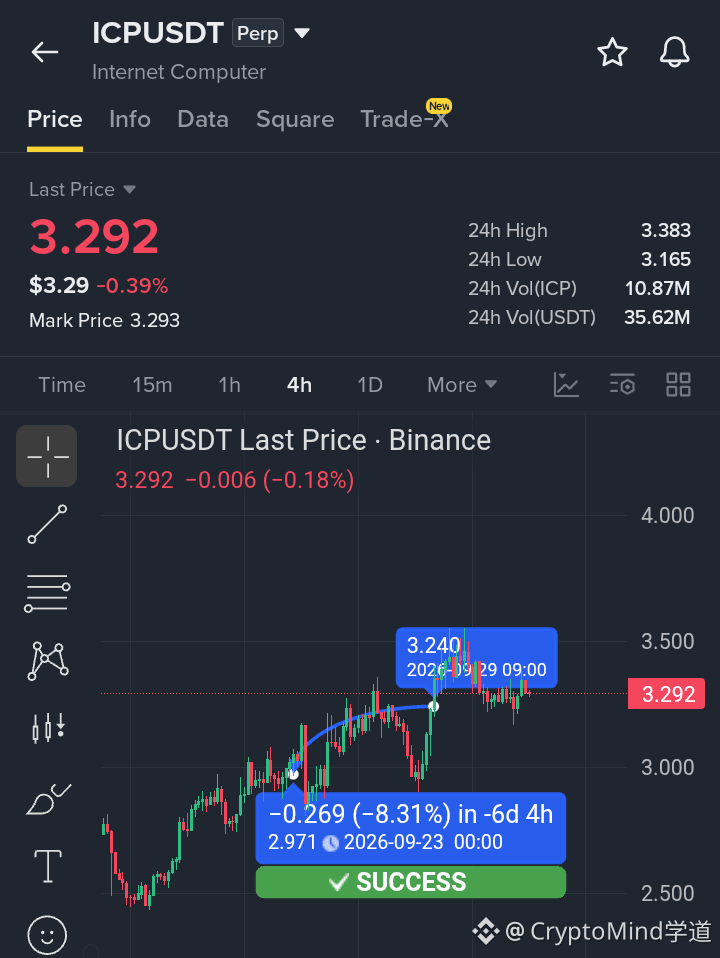
Rebaixado 8%. Compradores de volta. 🧊
🟢 Long $ICP
🚪 Entrada 3.292
💰 Alvos 3.383, 3.500
🛑 Stop 3.165
Recuperei 3.29 após o flush. Estou dentro. Fundo mais alto imprimindo, volume voltando aos poucos. Stop bem justo abaixo de 3.165. Romper 3.383 e ele anda rápido. 🛡️
Acredito que a recuperação vai segurar? 🤨
{future}(ICPUSDT)
#icp #ICPUSDT #Crypto
Rebaixado 8%. Compradores de volta. 🧊
🟢 Long $ICP
🚪 Entrada 3.292
💰 Alvos 3.383, 3.500
🛑 Stop 3.165
Recuperei 3.29 após o flush. Estou dentro. Fundo mais alto imprimindo, volume voltando aos poucos. Stop bem justo abaixo de 3.165. Romper 3.383 e ele anda rápido. 🛡️
Acredito que a recuperação vai segurar? 🤨
#icp #ICPUSDT #Crypto
🟢 Long $ICP
🚪 Entrada 3.292
💰 Alvos 3.383, 3.500
🛑 Stop 3.165
Recuperei 3.29 após o flush. Estou dentro. Fundo mais alto imprimindo, volume voltando aos poucos. Stop bem justo abaixo de 3.165. Romper 3.383 e ele anda rápido. 🛡️
Acredito que a recuperação vai segurar? 🤨
#icp #ICPUSDT #Crypto
52
·
--
Artigo
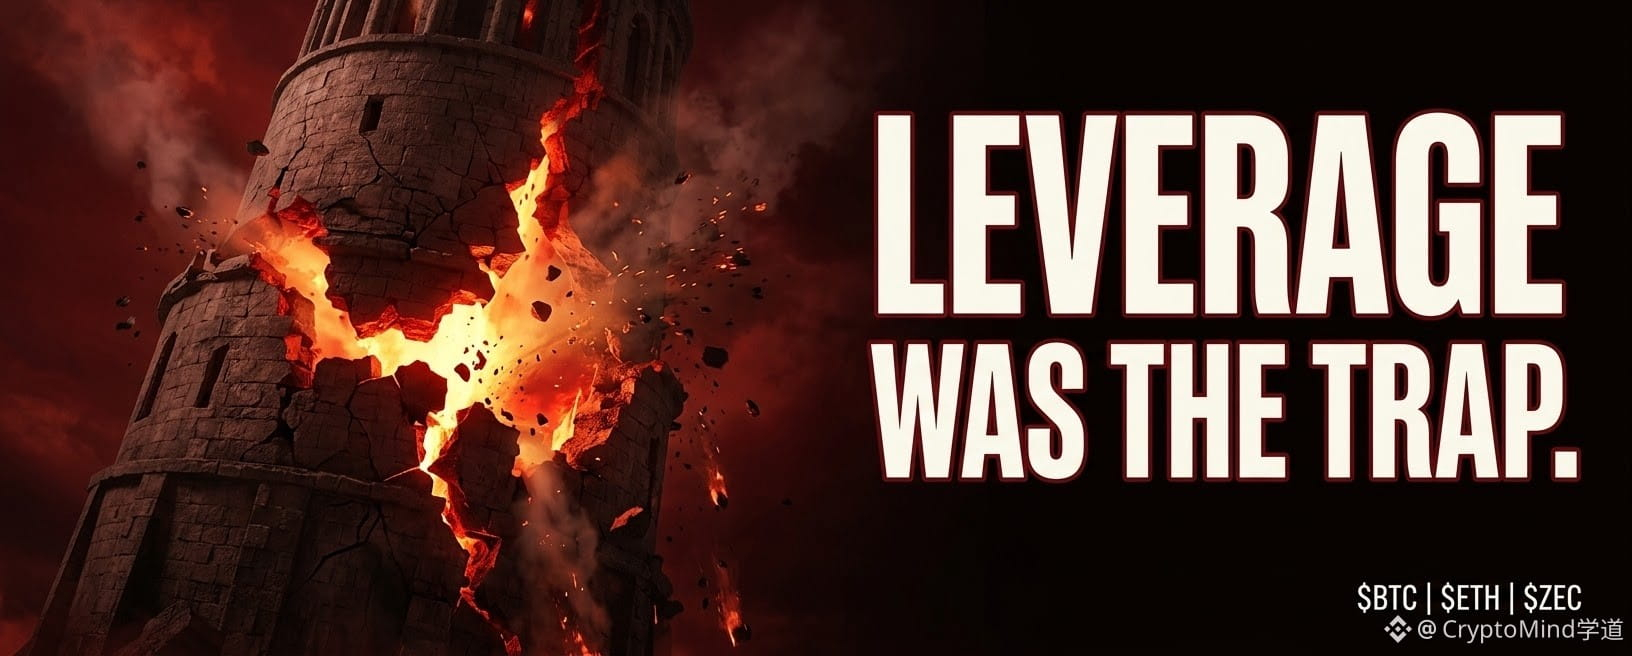
Eu Vi US$ 570 Milhões Sumirem em Uma HoraEu estava prestes a fechar meu notebook na quinta à noite quando o alerta apareceu. O Bitcoin tinha acabado de tocar US$ 87.200. Dez minutos depois, estava abaixo de US$ 85.000. Eu sentei de novo.
Um amigo me ligou às 23h. A voz dele era diferente. Ele estava comprado desde US$ 82K, alavancado, se sentindo esperto. Ele não estava mais se sentindo esperto.
Mais de US$ 570 milhões em posições de cripto foram liquidados nas 24 horas encerradas em 2 de outubro. Em uma única hora, US$ 186 milhões foram apagados. Noventa e nove por cento dessas liquidações forçadas foram de longs (comprados). Pessoas que apostaram em preços mais altos — destruídas em minutos.
Eu Vi US$ 570 Milhões Sumirem em Uma Hora
Eu estava prestes a fechar meu notebook na quinta à noite quando o alerta apareceu. O Bitcoin tinha acabado de tocar US$ 87.200. Dez minutos depois, estava abaixo de US$ 85.000. Eu sentei de novo.
Um amigo me ligou às 23h. A voz dele era diferente. Ele estava comprado desde US$ 82K, alavancado, se sentindo esperto. Ele não estava mais se sentindo esperto.
Mais de US$ 570 milhões em posições de cripto foram liquidados nas 24 horas encerradas em 2 de outubro. Em uma única hora, US$ 186 milhões foram apagados. Noventa e nove por cento dessas liquidações forçadas foram de longs (comprados). Pessoas que apostaram em preços mais altos — destruídas em minutos.
Um amigo me ligou às 23h. A voz dele era diferente. Ele estava comprado desde US$ 82K, alavancado, se sentindo esperto. Ele não estava mais se sentindo esperto.
Mais de US$ 570 milhões em posições de cripto foram liquidados nas 24 horas encerradas em 2 de outubro. Em uma única hora, US$ 186 milhões foram apagados. Noventa e nove por cento dessas liquidações forçadas foram de longs (comprados). Pessoas que apostaram em preços mais altos — destruídas em minutos.
223
·
--
🌄 BOM DIA, TODOS!
Agora consigo ver o gráfico com clareza. Vou pesquisar os fundamentos da ZEC e a narrativa atual antes de escrever o post.
Aviso: correr atrás de $ZEC aqui significa comprar a queda pós-ATH, não o rompimento
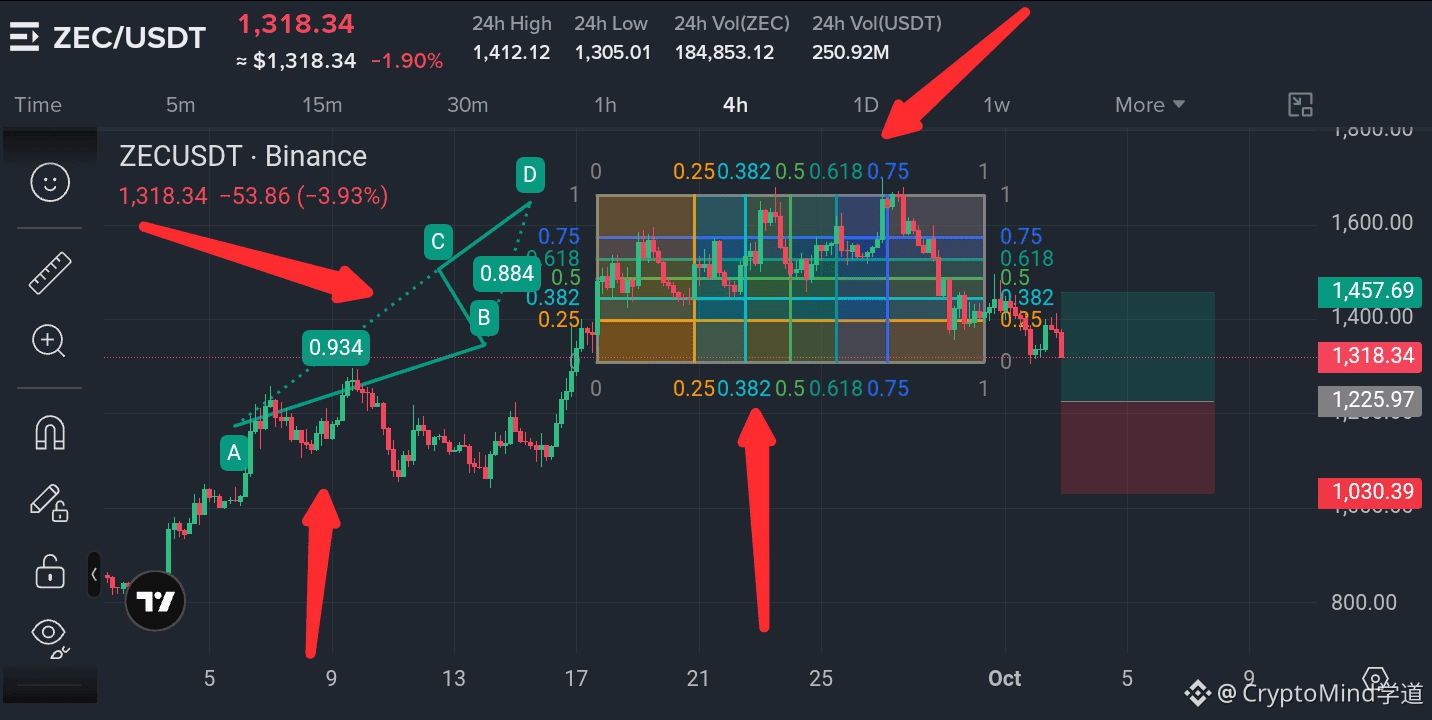
Estou zerado (flat). Ela subiu 170% em três meses e o RSI ficou acima de 70 por semanas — esse calor precisa ser “desmontado”. Estou fazendo lances de $ZEC em US$ 1.200–1.260, onde a retração de 0,5 fib encontra a antiga prateleira do rompimento
Alvos na retomada: US$ 1.457 e depois US$ 1.680 na NU7. Invalidado abaixo de US$ 1.030
Um contraponto: saídas de ETF e chamadas de “o topo está dentro” é o que costuma parecer em correções no meio do ciclo. A NU7 chega em cinco semanas. Todo mundo está pessimista aqui — esse é o sinal ou a armadilha?
{spot}(ZECUSDT)
#ZcashFalls21%FromSeptemberPeak
🌄 BOM DIA, TODOS!
Agora consigo ver o gráfico com clareza. Vou pesquisar os fundamentos da ZEC e a narrativa atual antes de escrever o post.
Aviso: correr atrás de $ZEC aqui significa comprar a queda pós-ATH, não o rompimento
Estou zerado (flat). Ela subiu 170% em três meses e o RSI ficou acima de 70 por semanas — esse calor precisa ser “desmontado”. Estou fazendo lances de $ZEC em US$ 1.200–1.260, onde a retração de 0,5 fib encontra a antiga prateleira do rompimento
Alvos na retomada: US$ 1.457 e depois US$ 1.680 na NU7. Invalidado abaixo de US$ 1.030
Um contraponto: saídas de ETF e chamadas de “o topo está dentro” é o que costuma parecer em correções no meio do ciclo. A NU7 chega em cinco semanas. Todo mundo está pessimista aqui — esse é o sinal ou a armadilha?
#ZcashFalls21%FromSeptemberPeak
Agora consigo ver o gráfico com clareza. Vou pesquisar os fundamentos da ZEC e a narrativa atual antes de escrever o post.
Aviso: correr atrás de $ZEC aqui significa comprar a queda pós-ATH, não o rompimento
Estou zerado (flat). Ela subiu 170% em três meses e o RSI ficou acima de 70 por semanas — esse calor precisa ser “desmontado”. Estou fazendo lances de $ZEC em US$ 1.200–1.260, onde a retração de 0,5 fib encontra a antiga prateleira do rompimento
Alvos na retomada: US$ 1.457 e depois US$ 1.680 na NU7. Invalidado abaixo de US$ 1.030
Um contraponto: saídas de ETF e chamadas de “o topo está dentro” é o que costuma parecer em correções no meio do ciclo. A NU7 chega em cinco semanas. Todo mundo está pessimista aqui — esse é o sinal ou a armadilha?
#ZcashFalls21%FromSeptemberPeak
90
·
--
OS LONGS SERÃO OS PRÓXIMOS 🥇
Dez minutos. Foi só isso para apagar US$ 110M de apostas baixistas ontem. As saídas forçadas totais chegaram a US$ 360M, a maior parte de pessoas apostando na queda
Então a multidão fez exatamente o que ela sempre faz — virou otimista no topo do movimento. A taxa para manter uma aposta comprada (long) triplicou para 10% ao ano. As apostas abertas saltaram US$ 2B em um dia. Tudo isso, horas antes do número mensal de empregos cair. Um token de empréstimo subiu 10%, outro caiu 15%. A casa está dividida e todo mundo alavancado em uma moeda ao ar
Sua jogada antes dos empregos?
$SAND $FIL $ZEC
Vote como se ninguém estivesse olhando
OS LONGS SERÃO OS PRÓXIMOS 🥇
Dez minutos. Foi só isso para apagar US$ 110M de apostas baixistas ontem. As saídas forçadas totais chegaram a US$ 360M, a maior parte de pessoas apostando na queda
Então a multidão fez exatamente o que ela sempre faz — virou otimista no topo do movimento. A taxa para manter uma aposta comprada (long) triplicou para 10% ao ano. As apostas abertas saltaram US$ 2B em um dia. Tudo isso, horas antes do número mensal de empregos cair. Um token de empréstimo subiu 10%, outro caiu 15%. A casa está dividida e todo mundo alavancado em uma moeda ao ar
Sua jogada antes dos empregos?
$SAND $FIL $ZEC
Vote como se ninguém estivesse olhando
Dez minutos. Foi só isso para apagar US$ 110M de apostas baixistas ontem. As saídas forçadas totais chegaram a US$ 360M, a maior parte de pessoas apostando na queda
Então a multidão fez exatamente o que ela sempre faz — virou otimista no topo do movimento. A taxa para manter uma aposta comprada (long) triplicou para 10% ao ano. As apostas abertas saltaram US$ 2B em um dia. Tudo isso, horas antes do número mensal de empregos cair. Um token de empréstimo subiu 10%, outro caiu 15%. A casa está dividida e todo mundo alavancado em uma moeda ao ar
Sua jogada antes dos empregos?
$SAND $FIL $ZEC
Vote como se ninguém estivesse olhando
😬 Bought rip, super nervous.
17%
🚀 Chased rally, fearless now.
50%
😌 Sold before data, relieved.
17%
😅 Bet against it, sweating...
16%
6 Votos • Votação encerrada
1
1.2k
·
--

Artigo
Ver tradução
Everyone Saw This Unlock Coming. They Bought AnywayI opened the chart on October 2nd with my coffee and just laughed
Not because it was funny. Because I'd seen this exact movie before, and I already knew the ending
Six days earlier, a small-cap DePIN coin pumped 28% — straight into the largest token unlock of its life. A cliff release of roughly 1.66 billion tokens. About 47.7% of its entire circulating supply, hitting the market in one block at 00:00 UTC
Read that again. People were buying. Into that
The run started around September 26th. Price ripped from around 0.057 to a high near 0.080 in about a day. The timeline was full of the same cope you always hear before an unlock: "it's priced in," "the team won't sell," "real infrastructure, real partners."
I've said those words myself. In 2021 I held a bag through a scheduled unlock telling myself the same thing — watched it bleed 70% over the next month while I called every red candle a healthy retest. I don't get to judge anyone here
Here's what the tape actually showed while the crowd was chanting
Futures volume hit 304 million in 24 hours. Spot volume was 64 million. Open interest sat near 25 million — on a coin with a market cap under 250 million at the time. That's not investors accumulating. That's leverage stacking up for a knife fight
Everyone was staring at the unlock date like it was the whole story. It wasn't. The real tell was that perps were trading five times the spot volume. Nobody was buying the network. They were renting exposure for the event
Then the event came. At midnight UTC on October 2nd, circulating supply jumped from 3.47 billion to 5.12 billion tokens. Overnight. The recipients weren't random holders, either — the biggest slices belong to Jump Crypto, Malbec Labs, institutions, and the team
Price slid to the 0.053–0.059 zone within a day. Down 8–9% on the 24-hour, roughly 30% off that pre-unlock high. Market cap now sits around 300 million even after the supply jump — do that math and you see how much value quietly left the room
The part nobody's saying out loud: the 28% pump into the unlock wasn't strength. It was the exit. Late shorts got squeezed, early wallets got liquidity, and the crowd provided both
And the sick detail? This coin launched exactly one year before the unlock — October 2nd, 2025 — and dropped 65% on day one. It's still down over 90% from its all-time high. Anniversary candles, I guess
Now the other side, because there is one
Unlocks aren't automatic death sentences Sometimes the supply gets absorbed, the overhang clears, and the chart breathes for the first time in months. A coin with real fiber infrastructure and real exchange listings isn't a meme — there's an actual network under this ticker
But absorption needs real buyers. Spot buyers. Not 300 million in perp volume from people holding positions for hours, not months
So here's the level that matters now
The all-time low lives down around 0.045–0.054, depending on which feed you trust. Price is sitting right on top of it. If that zone holds through the weekend, it means the new supply found hands and the worst is behind it. Failed unlocks — the ones that don't dump — are weirdly one of the strongest signals in small caps
If it breaks below, there's nothing under it. No history, no bids, just air and price discovery. And 6.5 billion more tokens still locked, waiting on future dates
This is how small caps work now. The event everyone fears either becomes the bottom or the trapdoor — and you only find out which one after the crowd has already picked a side
I'm not calling the bottom. I'm watching who shows up to buy when the timeline goes quiet. That's always the tell
$2Z
The market handed out free information for a week: the date, the size, the recipients. Nobody can say they didn't know
So be honest — did you fade the unlock, or were you the liquidity it needed?
#altcoins #cryptotrading #TokenUnlock
Everyone Saw This Unlock Coming. They Bought Anyway
I opened the chart on October 2nd with my coffee and just laughed
Not because it was funny. Because I'd seen this exact movie before, and I already knew the ending
Six days earlier, a small-cap DePIN coin pumped 28% — straight into the largest token unlock of its life. A cliff release of roughly 1.66 billion tokens. About 47.7% of its entire circulating supply, hitting the market in one block at 00:00 UTC
Read that again. People were buying. Into that
The run started around September 26th. Price ripped from around 0.057 to a high near 0.080 in about a day. The timeline was full of the same cope you always hear before an unlock: "it's priced in," "the team won't sell," "real infrastructure, real partners."
I've said those words myself. In 2021 I held a bag through a scheduled unlock telling myself the same thing — watched it bleed 70% over the next month while I called every red candle a healthy retest. I don't get to judge anyone here
Here's what the tape actually showed while the crowd was chanting
Futures volume hit 304 million in 24 hours. Spot volume was 64 million. Open interest sat near 25 million — on a coin with a market cap under 250 million at the time. That's not investors accumulating. That's leverage stacking up for a knife fight
Everyone was staring at the unlock date like it was the whole story. It wasn't. The real tell was that perps were trading five times the spot volume. Nobody was buying the network. They were renting exposure for the event
Then the event came. At midnight UTC on October 2nd, circulating supply jumped from 3.47 billion to 5.12 billion tokens. Overnight. The recipients weren't random holders, either — the biggest slices belong to Jump Crypto, Malbec Labs, institutions, and the team
Price slid to the 0.053–0.059 zone within a day. Down 8–9% on the 24-hour, roughly 30% off that pre-unlock high. Market cap now sits around 300 million even after the supply jump — do that math and you see how much value quietly left the room
The part nobody's saying out loud: the 28% pump into the unlock wasn't strength. It was the exit. Late shorts got squeezed, early wallets got liquidity, and the crowd provided both
And the sick detail? This coin launched exactly one year before the unlock — October 2nd, 2025 — and dropped 65% on day one. It's still down over 90% from its all-time high. Anniversary candles, I guess
Now the other side, because there is one
Unlocks aren't automatic death sentences Sometimes the supply gets absorbed, the overhang clears, and the chart breathes for the first time in months. A coin with real fiber infrastructure and real exchange listings isn't a meme — there's an actual network under this ticker
But absorption needs real buyers. Spot buyers. Not 300 million in perp volume from people holding positions for hours, not months
So here's the level that matters now
The all-time low lives down around 0.045–0.054, depending on which feed you trust. Price is sitting right on top of it. If that zone holds through the weekend, it means the new supply found hands and the worst is behind it. Failed unlocks — the ones that don't dump — are weirdly one of the strongest signals in small caps
If it breaks below, there's nothing under it. No history, no bids, just air and price discovery. And 6.5 billion more tokens still locked, waiting on future dates
This is how small caps work now. The event everyone fears either becomes the bottom or the trapdoor — and you only find out which one after the crowd has already picked a side
I'm not calling the bottom. I'm watching who shows up to buy when the timeline goes quiet. That's always the tell
$2Z
The market handed out free information for a week: the date, the size, the recipients. Nobody can say they didn't know
So be honest — did you fade the unlock, or were you the liquidity it needed?
#altcoins #cryptotrading #TokenUnlock
Not because it was funny. Because I'd seen this exact movie before, and I already knew the ending
Six days earlier, a small-cap DePIN coin pumped 28% — straight into the largest token unlock of its life. A cliff release of roughly 1.66 billion tokens. About 47.7% of its entire circulating supply, hitting the market in one block at 00:00 UTC
Read that again. People were buying. Into that
The run started around September 26th. Price ripped from around 0.057 to a high near 0.080 in about a day. The timeline was full of the same cope you always hear before an unlock: "it's priced in," "the team won't sell," "real infrastructure, real partners."
I've said those words myself. In 2021 I held a bag through a scheduled unlock telling myself the same thing — watched it bleed 70% over the next month while I called every red candle a healthy retest. I don't get to judge anyone here
Here's what the tape actually showed while the crowd was chanting
Futures volume hit 304 million in 24 hours. Spot volume was 64 million. Open interest sat near 25 million — on a coin with a market cap under 250 million at the time. That's not investors accumulating. That's leverage stacking up for a knife fight
Everyone was staring at the unlock date like it was the whole story. It wasn't. The real tell was that perps were trading five times the spot volume. Nobody was buying the network. They were renting exposure for the event
Then the event came. At midnight UTC on October 2nd, circulating supply jumped from 3.47 billion to 5.12 billion tokens. Overnight. The recipients weren't random holders, either — the biggest slices belong to Jump Crypto, Malbec Labs, institutions, and the team
Price slid to the 0.053–0.059 zone within a day. Down 8–9% on the 24-hour, roughly 30% off that pre-unlock high. Market cap now sits around 300 million even after the supply jump — do that math and you see how much value quietly left the room
The part nobody's saying out loud: the 28% pump into the unlock wasn't strength. It was the exit. Late shorts got squeezed, early wallets got liquidity, and the crowd provided both
And the sick detail? This coin launched exactly one year before the unlock — October 2nd, 2025 — and dropped 65% on day one. It's still down over 90% from its all-time high. Anniversary candles, I guess
Now the other side, because there is one
Unlocks aren't automatic death sentences Sometimes the supply gets absorbed, the overhang clears, and the chart breathes for the first time in months. A coin with real fiber infrastructure and real exchange listings isn't a meme — there's an actual network under this ticker
But absorption needs real buyers. Spot buyers. Not 300 million in perp volume from people holding positions for hours, not months
So here's the level that matters now
The all-time low lives down around 0.045–0.054, depending on which feed you trust. Price is sitting right on top of it. If that zone holds through the weekend, it means the new supply found hands and the worst is behind it. Failed unlocks — the ones that don't dump — are weirdly one of the strongest signals in small caps
If it breaks below, there's nothing under it. No history, no bids, just air and price discovery. And 6.5 billion more tokens still locked, waiting on future dates
This is how small caps work now. The event everyone fears either becomes the bottom or the trapdoor — and you only find out which one after the crowd has already picked a side
I'm not calling the bottom. I'm watching who shows up to buy when the timeline goes quiet. That's always the tell
$2Z
The market handed out free information for a week: the date, the size, the recipients. Nobody can say they didn't know
So be honest — did you fade the unlock, or were you the liquidity it needed?
#altcoins #cryptotrading #TokenUnlock
26
Inicia sessão para explorar mais conteúdos
Junta-te a utilizadores de criptomoedas de todo o mundo na Binance Square
⚡️ Obtém informações úteis e recentes sobre criptomoedas.
💬 Com a confiança da maior exchange de criptomoedas do mundo.
👍 Descobre perspetivas reais de criadores verificados.
E-mail/Número de telefone
Tópicos em Tendência
BNBSurpasses$790
8,548 visualizações
73 a discutir
$BNB plano estratégico de longo prazo -> FOQUE AGORA
O BNB criou 2 fortes mínimas após romper a liquidez interna
Estou esperando um movimento em direção à máxima da swing em US$ 815–US$ 830 e procuro uma compra (long) em uma retest da caixa verde
#BNBSurpasses$790 #bnb
Ghost Writer
·4 gostos
·4k visualizações
ZamaRises15.99%ToIntradayHigh$0.09
2,462 visualizações
64 a discutir
BitcoinSpotETFsDraw$6.34BInflowsInQ3
3,128 visualizações
52 a discutir