

With buyers absent, BNB is struggling to hold above $200.
Key Support levels: $206, $180
Key Resistance levels: $220, $230
1. Indecision Continues
Binance Coin has not managed to move away from its key support just above $200. This is not ideal, as any new sell pressure could quickly test or even break this level. The price action also shows that sellers are having the upper hand right now.
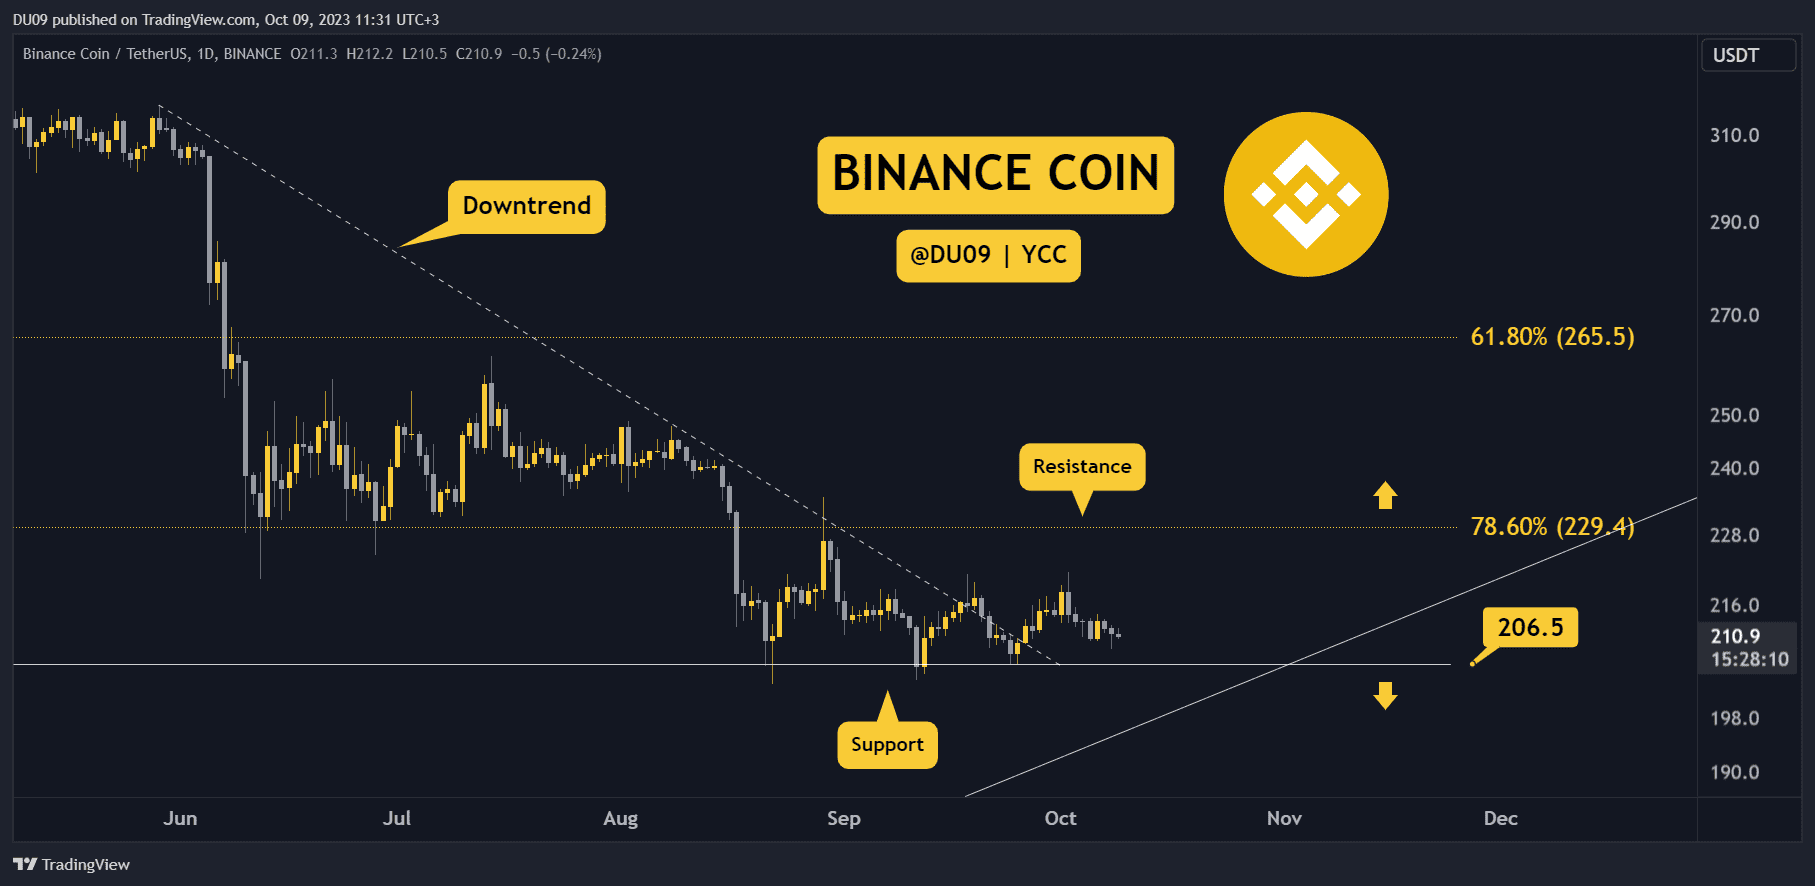 Chart by TradingView. 2. Indicators Lean Bearish
The volume and momentum indicators show weakness and are bearish on the daily timeframe. Generally speaking, volume was always higher on the sell side and this is reflected both on the RSI and OBV which remain low.
 Chart by TradingView. 3. MACD Bearish Cross
The daily MACD just did a bearish cross, further confirming that sellers appear to dominate at this time. If buyers don’t return, then the key support at $206 is in danger.
 Chart by TradingView. Bias
The bias for BNB is bearish.
Short-Term Prediction for BNB Price
Prepare for another test of the key support at $206. If that breaks, then BNB’s price will likely move towards $180 next.
The post BNB Crashes 5% Weekly but How Low Can it Go? Three Things to Watch this Week (Binance Coin Price Analysis) appeared first on CryptoPotato.