

Crypto__Today
1.8k ပို့စ်များ

Crypto__Today
တိုင်ကြားမည်
သုံးစွဲသူကို ဘလော့မည်
Make impactful strides with the all-in-one, intelligent marketing platform designed to accelerate the growth of blockchain projects.Any promo: @Theodore_finch1
Open Trade
Occasional Trader
4.6 Years
11 ဖော်လိုလုပ်ထားသည်
12.8K+ ဖော်လိုလုပ်သူများ
12.0K+ လိုက်ခ်လုပ်ထားသည်
ပို့စ်များ
ပိုင်ဆိုင်မှုစာရင်း
အားလုံး
Quotes
တိုက်ရိုက်ထုတ်လွှင့်ခြင်း
ပုံသေထားသည်

Article
DOGS (DOGS) Price Prediction 2024, 2025–2030Explore short and medium-term DOGS price prediction analysis and check long-term DOGS forecasts for 2025, 2030, and beyond.
According to our current DOGS price prediction, the price of DOGS is predicted to rise by 228.05% and reach $ 0.007002 by September 25, 2024. Per our technical indicators, the current sentiment is Bearish while the Fear & Greed Index is showing 55 (Greed). DOGS recorded 5/7 (71%) green days with price volatility over the last 30 days. Based on the DOGS forecast, it's now a bad time to buy DOGS.
Based on the historical price movements of DOGS and the BTC halving cycles, the yearly low DOGS price prediction for 2025 is estimated at $ 0.002134. Meanwhile, the price of DOGS is predicted to reach as high as $ 0.010086 next year. Using the same basis, here is the DOGS price prediction for each year up until 2030.
DOGS price prediction 2025
The DOGS price prediction for 2025 is currently between $ 0.002134 on the lower end and $ 0.010086 on the high end. Compared to today’s price, DOGS could gain 372.57% by 2025 if DOGS reaches the upper price target.
DOGS price prediction 2030
The DOGS price prediction for 2030 is currently between $ 0.005381 on the lower end and $ 0.008725 on the high end. Compared to today’s price, DOGS could gain 308.82% by 2030 if it reaches the upper price target.
DOGS Price Forecast Based on Technical Analysis
Popular DOGS Moving Averages and Oscillators for Mon, Aug 26, 2024
Moving averages (MA) are a popular indicator in all financial markets, designed to smooth price action over a certain amount of time. They are a lagging indicator which means they are influenced by historical price activity. In the table below you can find two types of moving averages, simple moving average (SMA) and exponential moving average (EMA).
DOGS Key Price Levels
Based on today's classical pivot point (P1) with the value of $ 0.00205, DOGS has support levels of $ 0.001864, $ 0.001593, and the strongest at $ 0.001407. Similarly, DOGS resistance levels are at $ 0.002321, $ 0.002507, and $ 0.002778.
#BinanceLaunchpoolDOGS #TelegramCEO #CryptoMarketMoves #BinanceBlockchainWeek #LowestCPI2021
DOGS (DOGS) Price Prediction 2024, 2025–2030
Explore short and medium-term DOGS price prediction analysis and check long-term DOGS forecasts for 2025, 2030, and beyond.
According to our current DOGS price prediction, the price of DOGS is predicted to rise by 228.05% and reach $ 0.007002 by September 25, 2024. Per our technical indicators, the current sentiment is Bearish while the Fear & Greed Index is showing 55 (Greed). DOGS recorded 5/7 (71%) green days with price volatility over the last 30 days. Based on the DOGS forecast, it's now a bad time to buy DOGS.
Based on the historical price movements of DOGS and the BTC halving cycles, the yearly low DOGS price prediction for 2025 is estimated at $ 0.002134. Meanwhile, the price of DOGS is predicted to reach as high as $ 0.010086 next year. Using the same basis, here is the DOGS price prediction for each year up until 2030.
DOGS price prediction 2025
The DOGS price prediction for 2025 is currently between $ 0.002134 on the lower end and $ 0.010086 on the high end. Compared to today’s price, DOGS could gain 372.57% by 2025 if DOGS reaches the upper price target.
DOGS price prediction 2030
The DOGS price prediction for 2030 is currently between $ 0.005381 on the lower end and $ 0.008725 on the high end. Compared to today’s price, DOGS could gain 308.82% by 2030 if it reaches the upper price target.
DOGS Price Forecast Based on Technical Analysis
Popular DOGS Moving Averages and Oscillators for Mon, Aug 26, 2024
Moving averages (MA) are a popular indicator in all financial markets, designed to smooth price action over a certain amount of time. They are a lagging indicator which means they are influenced by historical price activity. In the table below you can find two types of moving averages, simple moving average (SMA) and exponential moving average (EMA).
DOGS Key Price Levels
Based on today's classical pivot point (P1) with the value of $ 0.00205, DOGS has support levels of $ 0.001864, $ 0.001593, and the strongest at $ 0.001407. Similarly, DOGS resistance levels are at $ 0.002321, $ 0.002507, and $ 0.002778.
#BinanceLaunchpoolDOGS #TelegramCEO #CryptoMarketMoves #BinanceBlockchainWeek #LowestCPI2021
According to our current DOGS price prediction, the price of DOGS is predicted to rise by 228.05% and reach $ 0.007002 by September 25, 2024. Per our technical indicators, the current sentiment is Bearish while the Fear & Greed Index is showing 55 (Greed). DOGS recorded 5/7 (71%) green days with price volatility over the last 30 days. Based on the DOGS forecast, it's now a bad time to buy DOGS.
Based on the historical price movements of DOGS and the BTC halving cycles, the yearly low DOGS price prediction for 2025 is estimated at $ 0.002134. Meanwhile, the price of DOGS is predicted to reach as high as $ 0.010086 next year. Using the same basis, here is the DOGS price prediction for each year up until 2030.
DOGS price prediction 2025
The DOGS price prediction for 2025 is currently between $ 0.002134 on the lower end and $ 0.010086 on the high end. Compared to today’s price, DOGS could gain 372.57% by 2025 if DOGS reaches the upper price target.
DOGS price prediction 2030
The DOGS price prediction for 2030 is currently between $ 0.005381 on the lower end and $ 0.008725 on the high end. Compared to today’s price, DOGS could gain 308.82% by 2030 if it reaches the upper price target.
DOGS Price Forecast Based on Technical Analysis
Popular DOGS Moving Averages and Oscillators for Mon, Aug 26, 2024
Moving averages (MA) are a popular indicator in all financial markets, designed to smooth price action over a certain amount of time. They are a lagging indicator which means they are influenced by historical price activity. In the table below you can find two types of moving averages, simple moving average (SMA) and exponential moving average (EMA).
DOGS Key Price Levels
Based on today's classical pivot point (P1) with the value of $ 0.00205, DOGS has support levels of $ 0.001864, $ 0.001593, and the strongest at $ 0.001407. Similarly, DOGS resistance levels are at $ 0.002321, $ 0.002507, and $ 0.002778.
#BinanceLaunchpoolDOGS #TelegramCEO #CryptoMarketMoves #BinanceBlockchainWeek #LowestCPI2021
177
8
1.8k
651.5k
Article
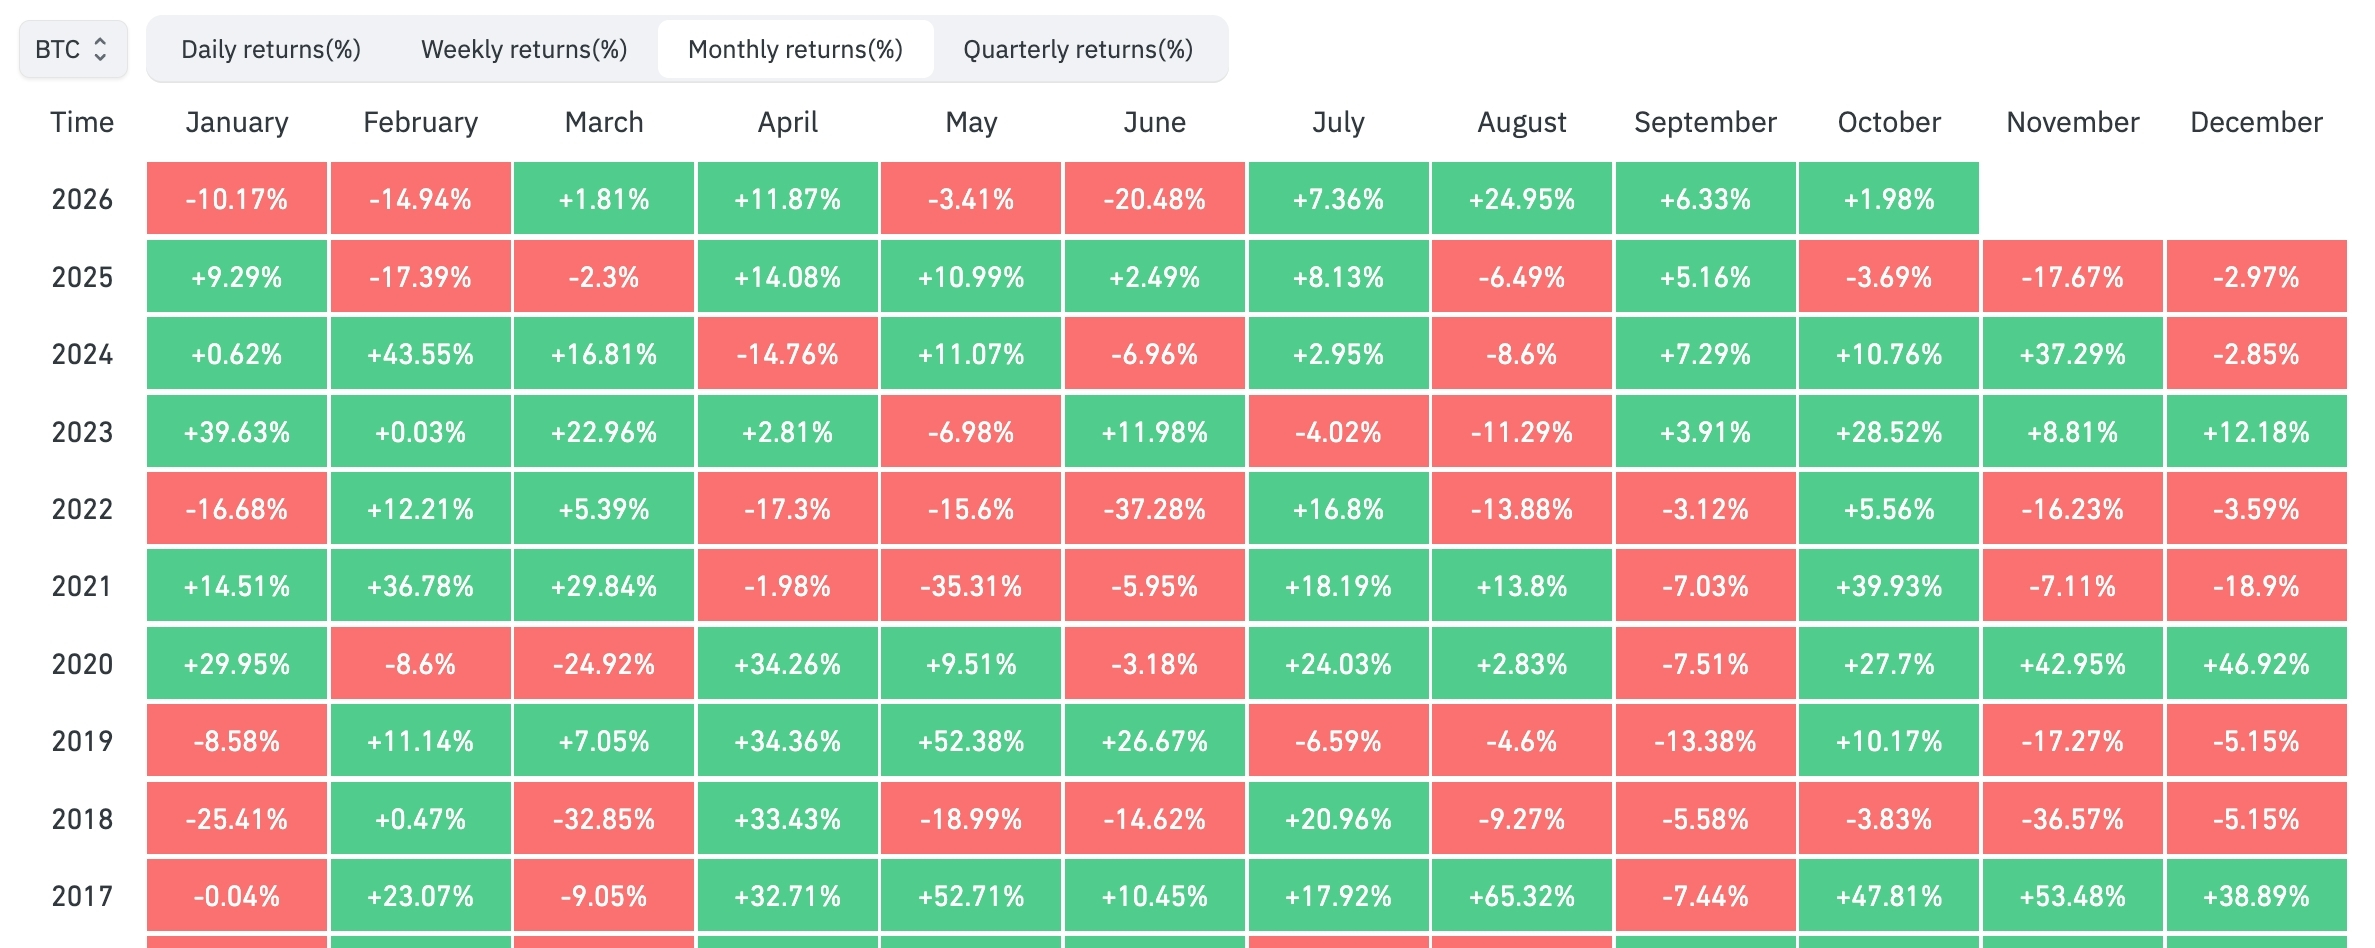
Bitcoin (BTC) enters October—historically dubbed "Uptober" for its bullish tendenciesFacing a complex matrix of macroeconomic and structural pressures. While historical data favors a positive monthly close, several underlying headwinds are threatening to stall momentum. Technical analysts and spot traders are closely watching the charts as four distinct catalysts converge on the digital asset market.
From thinning order books to geopolitical escalations, here is a detailed breakdown of the four key pressures shaping Bitcoin's price action this October.
1. Thinning Liquidity and Fragile Order Books
Market depth across major spot exchanges has experienced a notable contraction heading into Q4. High-volume market makers have tightened their spreads, resulting in thin liquidity on both sides of the order book.
The Chart Impact: Thin liquidity acts as an amplifier for volatility. Without deep order books to absorb large buy or sell orders, even moderate trading volume can trigger outsized price swings. Traders should watch for sudden "wick" liquidations—sharp, short-term spikes or drops that test support and resistance levels without establishing a structural trend change.
2. Cooling Momentum in Spot ETF Inflows
The institutional catalyst that propelled Bitcoin to new highs earlier this year is showing signs of near-term exhaustion. Net inflows into U.S.-listed spot Bitcoin ETFs have shifted from aggressive accumulation to a more cautious, fluctuating pattern.
The Chart Impact: Spot ETFs have functioned as the primary demand engine for underlying BTC. When net inflows flatten or turn net-negative, the market loses its steady structural bid. On the daily charts, this lack of institutional momentum often manifests as a series of lower highs and prolonged consolidation patterns, indicating a temporary shift from accumulation to distribution among institutional desks.
3. Geopolitical Uncertainty in the Middle East
Escalating regional conflicts, particularly involving Iran, have introduced a wave of risk-off sentiment across global financial markets. Cryptocurrencies have not remained immune to these broader macroeconomic anxieties.
The Chart Impact: While Bitcoin is often championed as digital gold, sharp escalations in geopolitical tension typically trigger an immediate flight to liquidity, boosting the U.S. Dollar Index (DXY) and traditional gold while causing risk assets to pull back. On the charts, these events often trigger sharp, high-volume correlation breaks where Bitcoin drops alongside equities, temporarily invalidating local bullish technical setups.
4. The Looming Mt. Gox Creditor Repayment Deadline
The ongoing distribution of recovered assets to creditors of the defunct Mt. Gox exchange remains a persistent supply overhang. With another major repayment deadline positioned in the market, participants are bracing for potential spot selling pressure.
The Chart Impact: The psychological impact of a large supply unlock often precedes the actual movement of funds. Fear of an impending market dump leads to preemptive selling by retail participants. Chartists should monitor major psychological support levels; if the market anticipates heavy selling, these support zones may face intense testing as short sellers attempt to front-run the expected distribution.
DYOR. NFA
#Write2Earn #CryptoToday #BTC☀
Bitcoin (BTC) enters October—historically dubbed "Uptober" for its bullish tendencies
Facing a complex matrix of macroeconomic and structural pressures. While historical data favors a positive monthly close, several underlying headwinds are threatening to stall momentum. Technical analysts and spot traders are closely watching the charts as four distinct catalysts converge on the digital asset market.
From thinning order books to geopolitical escalations, here is a detailed breakdown of the four key pressures shaping Bitcoin's price action this October.
1. Thinning Liquidity and Fragile Order Books
Market depth across major spot exchanges has experienced a notable contraction heading into Q4. High-volume market makers have tightened their spreads, resulting in thin liquidity on both sides of the order book.
The Chart Impact: Thin liquidity acts as an amplifier for volatility. Without deep order books to absorb large buy or sell orders, even moderate trading volume can trigger outsized price swings. Traders should watch for sudden "wick" liquidations—sharp, short-term spikes or drops that test support and resistance levels without establishing a structural trend change.
2. Cooling Momentum in Spot ETF Inflows
The institutional catalyst that propelled Bitcoin to new highs earlier this year is showing signs of near-term exhaustion. Net inflows into U.S.-listed spot Bitcoin ETFs have shifted from aggressive accumulation to a more cautious, fluctuating pattern.
The Chart Impact: Spot ETFs have functioned as the primary demand engine for underlying BTC. When net inflows flatten or turn net-negative, the market loses its steady structural bid. On the daily charts, this lack of institutional momentum often manifests as a series of lower highs and prolonged consolidation patterns, indicating a temporary shift from accumulation to distribution among institutional desks.
3. Geopolitical Uncertainty in the Middle East
Escalating regional conflicts, particularly involving Iran, have introduced a wave of risk-off sentiment across global financial markets. Cryptocurrencies have not remained immune to these broader macroeconomic anxieties.
The Chart Impact: While Bitcoin is often championed as digital gold, sharp escalations in geopolitical tension typically trigger an immediate flight to liquidity, boosting the U.S. Dollar Index (DXY) and traditional gold while causing risk assets to pull back. On the charts, these events often trigger sharp, high-volume correlation breaks where Bitcoin drops alongside equities, temporarily invalidating local bullish technical setups.
4. The Looming Mt. Gox Creditor Repayment Deadline
The ongoing distribution of recovered assets to creditors of the defunct Mt. Gox exchange remains a persistent supply overhang. With another major repayment deadline positioned in the market, participants are bracing for potential spot selling pressure.
The Chart Impact: The psychological impact of a large supply unlock often precedes the actual movement of funds. Fear of an impending market dump leads to preemptive selling by retail participants. Chartists should monitor major psychological support levels; if the market anticipates heavy selling, these support zones may face intense testing as short sellers attempt to front-run the expected distribution.
DYOR. NFA
#Write2Earn #CryptoToday #BTC☀
From thinning order books to geopolitical escalations, here is a detailed breakdown of the four key pressures shaping Bitcoin's price action this October.
1. Thinning Liquidity and Fragile Order Books
Market depth across major spot exchanges has experienced a notable contraction heading into Q4. High-volume market makers have tightened their spreads, resulting in thin liquidity on both sides of the order book.
The Chart Impact: Thin liquidity acts as an amplifier for volatility. Without deep order books to absorb large buy or sell orders, even moderate trading volume can trigger outsized price swings. Traders should watch for sudden "wick" liquidations—sharp, short-term spikes or drops that test support and resistance levels without establishing a structural trend change.
2. Cooling Momentum in Spot ETF Inflows
The institutional catalyst that propelled Bitcoin to new highs earlier this year is showing signs of near-term exhaustion. Net inflows into U.S.-listed spot Bitcoin ETFs have shifted from aggressive accumulation to a more cautious, fluctuating pattern.
The Chart Impact: Spot ETFs have functioned as the primary demand engine for underlying BTC. When net inflows flatten or turn net-negative, the market loses its steady structural bid. On the daily charts, this lack of institutional momentum often manifests as a series of lower highs and prolonged consolidation patterns, indicating a temporary shift from accumulation to distribution among institutional desks.
3. Geopolitical Uncertainty in the Middle East
Escalating regional conflicts, particularly involving Iran, have introduced a wave of risk-off sentiment across global financial markets. Cryptocurrencies have not remained immune to these broader macroeconomic anxieties.
The Chart Impact: While Bitcoin is often championed as digital gold, sharp escalations in geopolitical tension typically trigger an immediate flight to liquidity, boosting the U.S. Dollar Index (DXY) and traditional gold while causing risk assets to pull back. On the charts, these events often trigger sharp, high-volume correlation breaks where Bitcoin drops alongside equities, temporarily invalidating local bullish technical setups.
4. The Looming Mt. Gox Creditor Repayment Deadline
The ongoing distribution of recovered assets to creditors of the defunct Mt. Gox exchange remains a persistent supply overhang. With another major repayment deadline positioned in the market, participants are bracing for potential spot selling pressure.
The Chart Impact: The psychological impact of a large supply unlock often precedes the actual movement of funds. Fear of an impending market dump leads to preemptive selling by retail participants. Chartists should monitor major psychological support levels; if the market anticipates heavy selling, these support zones may face intense testing as short sellers attempt to front-run the expected distribution.
DYOR. NFA
#Write2Earn #CryptoToday #BTC☀
325

Article
🚨 Zcash ETF Suffers Massive $93M Outflow: Is the ZEC Rally Officially Over?The institutional honeymoon phase for Zcash ($ZEC ) appears to have hit a major roadblock. For the first time since its highly anticipated launch in August 2026, the primary U.S. spot Zcash ETF (Grayscale's ZCSH) recorded a net weekly outflow, with investors aggressively pulling out $93.6 million.
This sharp reversal has triggered an immediate correction in the spot market, driving ZEC's price down toward the crucial $1,300 support corridor. With the broader market watching closely, traders are asking one burning question: Is this the end of the parabolic ZEC rally, or simply a healthy cooldown?
📉 The Data Behind the Institutional Exit
Just two weeks ago, institutional appetite for ZCSH was leading the crypto ETF space with a massive $98.2 million in weekly inflows. However, according to data from SoSoValue, the fund has failed to register a single day of net inflows since September 22.
The Daily Bleed: Redemption numbers show steady capitulation, with daily outflows consistently clocking in between $26 million and $30 million over consecutive trading sessions.Supply Pressure: Because this spot ETF holds actual ZEC in custody, heavy redemptions force the fund managers to liquidate underlying assets, dumping massive structural sell-pressure directly onto the open spot markets.AUM Shrinkage: The fund's total Assets Under Management (AUM) plummeted from its September peak of nearly $979 million down to approximately $751 million by the first week of October.
📊 Technical Analysis: Crucial Make-or-Break Levels for ZEC
Following this institutional retreat, ZEC has corrected roughly 23% from its recent peak near $1,690. As the asset consolidates near $1,300, the technical charts point to two distinct paths:
The Bearish Threat ($1,270 – $1,300): This region represents a vital demand zone. If ZEC fails to defend the $1,270 line, technical indicators point to an extended correction down toward $1,155, representing an additional 12% downside risk.The Bullish Revival ($1,380 – $1,425): For the bulls to reclaim control and invalidate the bear thesis, ZEC must break out and sustain a close above the $1,425 resistance corridor. Doing so would open the doors for a clean run back toward $1,500 later this month.
Bottom Line: Is the Rally Over?
The abrupt halt in ETF inflows suggests that institutional "smart money" is opting to sit on the sidelines or lock in profits rather than buying this initial dip.
However, despite a bruising 17.5% drop over the week, the long-term macro trend isn't completely broken yet. ZEC still retains over 1,000% in cumulative gains over the past year, and its cumulative net ETF inflows remain positive at $212.56 million.
What to watch next: For ZEC to stage a comeback, the daily ETF redemptions must narrow significantly, and retail buyers must firmly hold the line at $1,270. Until institutional demand shifts back to green, expect highly volatile, choppy trading conditions.
What's your move? Are you buying the ZEC dip at $1,300, or exiting before it drops further?
#Zcash #ZEC #CryptoNews #CryptoETFs #TechnicalAnalysis
Disclaimer: This article is for informational purposes only and does not constitute financial advice. Always perform your own research before trading digital assets.
🚨 Zcash ETF Suffers Massive $93M Outflow: Is the ZEC Rally Officially Over?
The institutional honeymoon phase for Zcash ($ZEC ) appears to have hit a major roadblock. For the first time since its highly anticipated launch in August 2026, the primary U.S. spot Zcash ETF (Grayscale's ZCSH) recorded a net weekly outflow, with investors aggressively pulling out $93.6 million.
This sharp reversal has triggered an immediate correction in the spot market, driving ZEC's price down toward the crucial $1,300 support corridor. With the broader market watching closely, traders are asking one burning question: Is this the end of the parabolic ZEC rally, or simply a healthy cooldown?
📉 The Data Behind the Institutional Exit
Just two weeks ago, institutional appetite for ZCSH was leading the crypto ETF space with a massive $98.2 million in weekly inflows. However, according to data from SoSoValue, the fund has failed to register a single day of net inflows since September 22.
The Daily Bleed: Redemption numbers show steady capitulation, with daily outflows consistently clocking in between $26 million and $30 million over consecutive trading sessions.Supply Pressure: Because this spot ETF holds actual ZEC in custody, heavy redemptions force the fund managers to liquidate underlying assets, dumping massive structural sell-pressure directly onto the open spot markets.AUM Shrinkage: The fund's total Assets Under Management (AUM) plummeted from its September peak of nearly $979 million down to approximately $751 million by the first week of October.
📊 Technical Analysis: Crucial Make-or-Break Levels for ZEC
Following this institutional retreat, ZEC has corrected roughly 23% from its recent peak near $1,690. As the asset consolidates near $1,300, the technical charts point to two distinct paths:
The Bearish Threat ($1,270 – $1,300): This region represents a vital demand zone. If ZEC fails to defend the $1,270 line, technical indicators point to an extended correction down toward $1,155, representing an additional 12% downside risk.The Bullish Revival ($1,380 – $1,425): For the bulls to reclaim control and invalidate the bear thesis, ZEC must break out and sustain a close above the $1,425 resistance corridor. Doing so would open the doors for a clean run back toward $1,500 later this month.
Bottom Line: Is the Rally Over?
The abrupt halt in ETF inflows suggests that institutional "smart money" is opting to sit on the sidelines or lock in profits rather than buying this initial dip.
However, despite a bruising 17.5% drop over the week, the long-term macro trend isn't completely broken yet. ZEC still retains over 1,000% in cumulative gains over the past year, and its cumulative net ETF inflows remain positive at $212.56 million.
What to watch next: For ZEC to stage a comeback, the daily ETF redemptions must narrow significantly, and retail buyers must firmly hold the line at $1,270. Until institutional demand shifts back to green, expect highly volatile, choppy trading conditions.
What's your move? Are you buying the ZEC dip at $1,300, or exiting before it drops further?
#Zcash #ZEC #CryptoNews #CryptoETFs #TechnicalAnalysis
Disclaimer: This article is for informational purposes only and does not constitute financial advice. Always perform your own research before trading digital assets.
This sharp reversal has triggered an immediate correction in the spot market, driving ZEC's price down toward the crucial $1,300 support corridor. With the broader market watching closely, traders are asking one burning question: Is this the end of the parabolic ZEC rally, or simply a healthy cooldown?
📉 The Data Behind the Institutional Exit
Just two weeks ago, institutional appetite for ZCSH was leading the crypto ETF space with a massive $98.2 million in weekly inflows. However, according to data from SoSoValue, the fund has failed to register a single day of net inflows since September 22.
The Daily Bleed: Redemption numbers show steady capitulation, with daily outflows consistently clocking in between $26 million and $30 million over consecutive trading sessions.Supply Pressure: Because this spot ETF holds actual ZEC in custody, heavy redemptions force the fund managers to liquidate underlying assets, dumping massive structural sell-pressure directly onto the open spot markets.AUM Shrinkage: The fund's total Assets Under Management (AUM) plummeted from its September peak of nearly $979 million down to approximately $751 million by the first week of October.
📊 Technical Analysis: Crucial Make-or-Break Levels for ZEC
Following this institutional retreat, ZEC has corrected roughly 23% from its recent peak near $1,690. As the asset consolidates near $1,300, the technical charts point to two distinct paths:
The Bearish Threat ($1,270 – $1,300): This region represents a vital demand zone. If ZEC fails to defend the $1,270 line, technical indicators point to an extended correction down toward $1,155, representing an additional 12% downside risk.The Bullish Revival ($1,380 – $1,425): For the bulls to reclaim control and invalidate the bear thesis, ZEC must break out and sustain a close above the $1,425 resistance corridor. Doing so would open the doors for a clean run back toward $1,500 later this month.
Bottom Line: Is the Rally Over?
The abrupt halt in ETF inflows suggests that institutional "smart money" is opting to sit on the sidelines or lock in profits rather than buying this initial dip.
However, despite a bruising 17.5% drop over the week, the long-term macro trend isn't completely broken yet. ZEC still retains over 1,000% in cumulative gains over the past year, and its cumulative net ETF inflows remain positive at $212.56 million.
What to watch next: For ZEC to stage a comeback, the daily ETF redemptions must narrow significantly, and retail buyers must firmly hold the line at $1,270. Until institutional demand shifts back to green, expect highly volatile, choppy trading conditions.
What's your move? Are you buying the ZEC dip at $1,300, or exiting before it drops further?
#Zcash #ZEC #CryptoNews #CryptoETFs #TechnicalAnalysis
Disclaimer: This article is for informational purposes only and does not constitute financial advice. Always perform your own research before trading digital assets.
1
497
စိစစ်အတည်ပြုထားသည်
Article
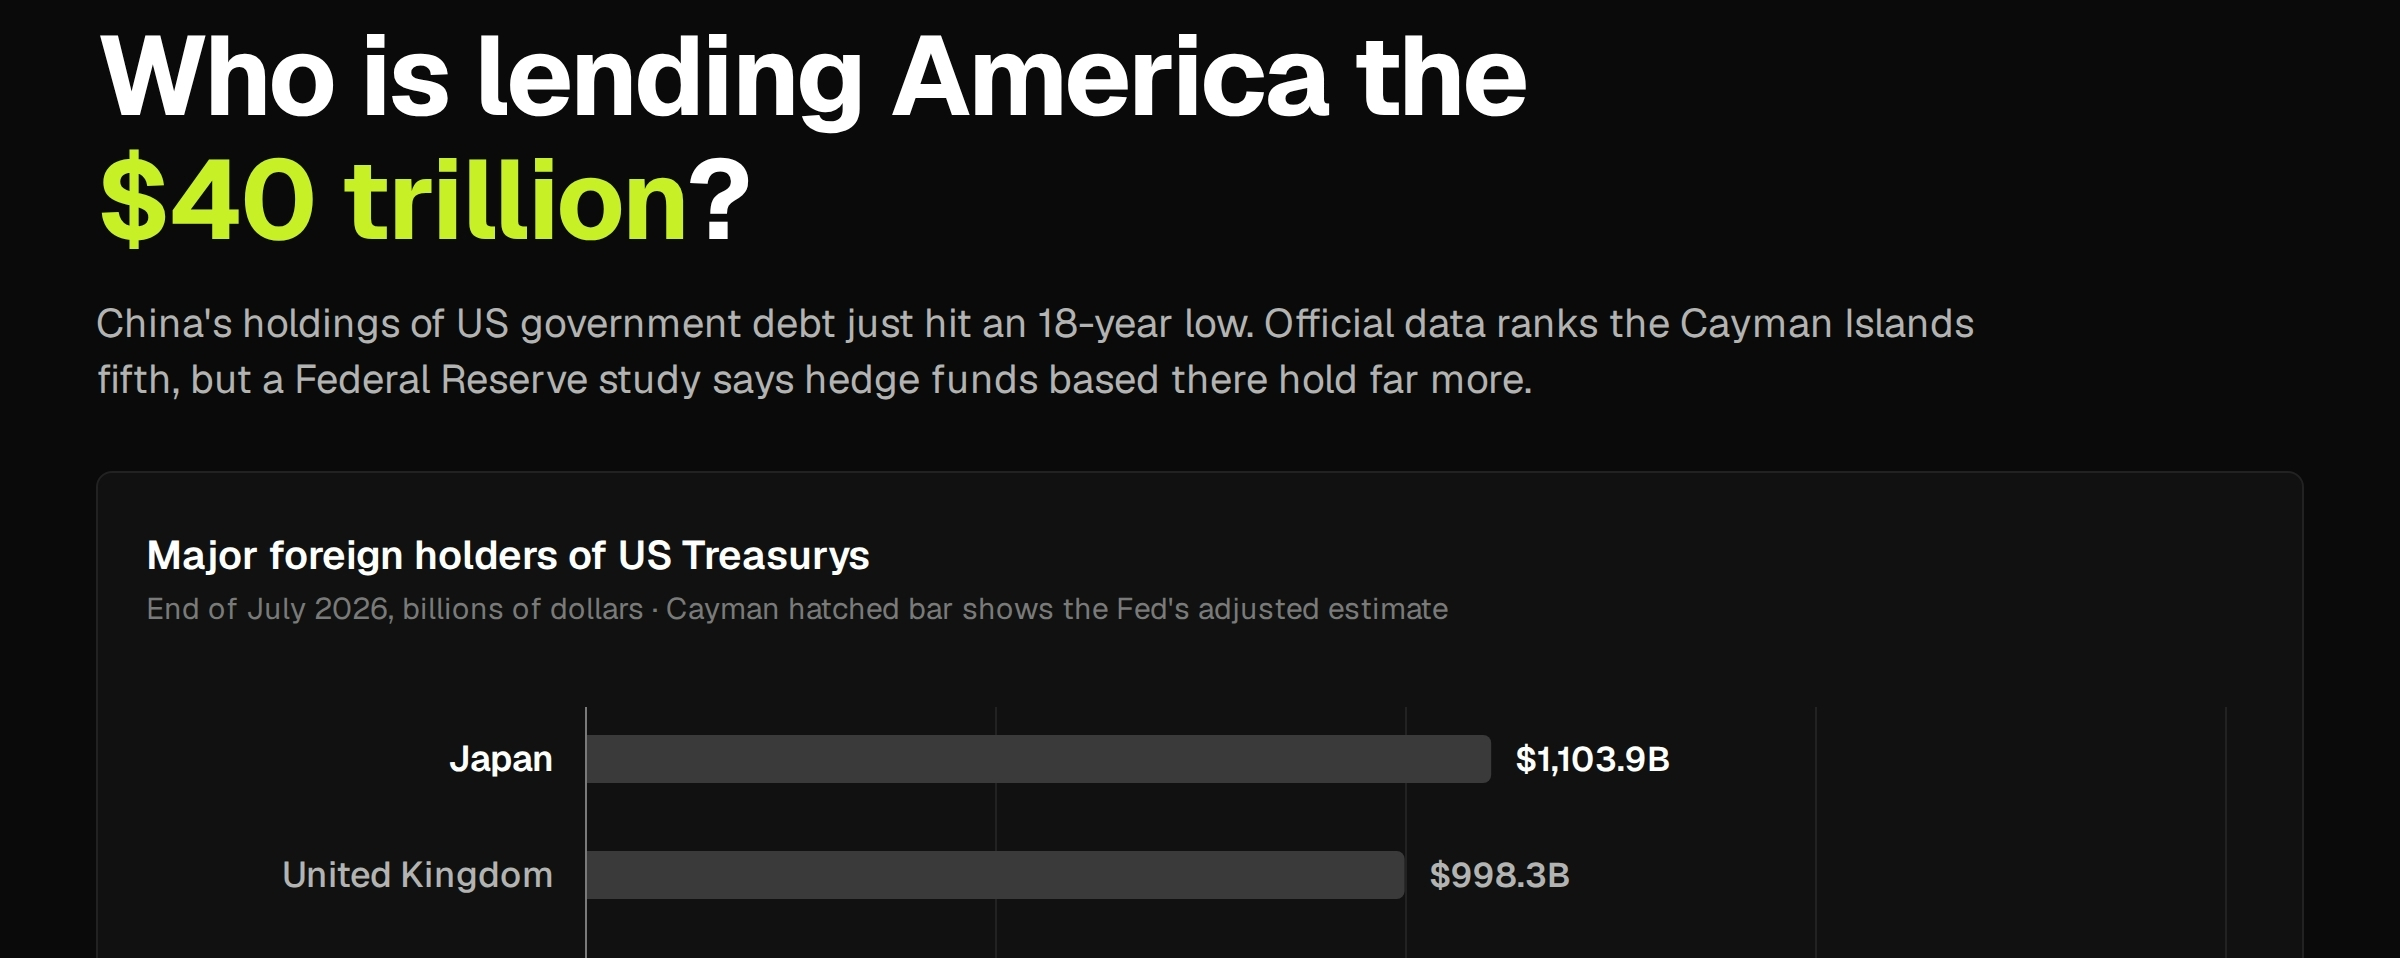
Can Inflation Shrink America’s $40 Trillion Debt? The Surprising Winner (and Loser)In a recent interview with TIME magazine, President Donald Trump sparked an intense macroeconomic debate by suggesting that "certain levels of inflation" could help pay off the $40 trillion U.S. national debt "very rapidly."
While everyday consumers look at inflation as a financial burden, governments see it through a completely different lens. The strategy is known as "inflating away the debt". But how does it work, and more importantly, who is actually financing this debt relief? Let’s break it down. 👇
1. The Math: How Inflation Alters the Debt
When a government borrows money, it issues bonds (Treasuries) at fixed nominal amounts. If it borrows $1 billion today, it owes exactly $1 billion in the future. Inflation changes the rules of the game:
Cheaper Repayment: Inflation dilutes the purchasing power of the fiat dollar. The government pays back its older, long-term bonds using "cheaper" dollars than those it originally borrowed.Surging Nominal Tax Revenues: As inflation pushes up consumer prices, nominal wages, and corporate profits, the government’s tax collection naturally rises. Because the face value of the existing debt stays the same, the debt becomes smaller relative to the size of the expanding nominal economy (the Debt-to-GDP ratio).
2. The Surprising Reality: Who is Financing It? 👥
The most critical part of this strategy isn't the economic math—it is who pays for it. When a government inflates away its debt, it implicitly transfers wealth from the creditors (lenders) to the debtor (the government).
The entities financing this implicit wealth transfer include:
Foreign Sovereigns: International lenders holding trillions in U.S. Treasuries receive lower real returns as the dollar devalues.Domestic Institutions: Retirement pension funds, insurance companies, and commercial banks absorb the economic loss on fixed-income assets.Everyday Citizens & Savers: Inflation acts as a "hidden tax." While it shrinks government liabilities on paper, it simultaneously eats away at the purchasing power of citizens' cash savings and outpaces real wage growth.
3. The Dangerous Side Effects ⚠️
While inflating debt sounds like an easy fix, it is a highly volatile strategy with long-term consequences:
Skyrocketing Interest Costs: Investors demand higher yields on new government debt to protect against inflation. With the national debt past $40 trillion, net interest servicing costs already exceed $1 trillion annually. Higher inflation forces borrowing costs to stay elevated, which ironically accelerates deficit spending.The Federal Reserve Dilemma: To curb inflation, the central bank usually raises interest rates—a move Trump has openly criticized, arguing that high rates hurt economic growth more than inflation itself.
💡 The Big Takeaway for Crypto Investors
For the digital asset ecosystem, this macroeconomic backdrop directly reinforces the utility of hard money. When global superpowers rely on monetary debasement to manage sovereign debt burdens, capital historically migrates toward decentralized, mathematically scarce assets like Bitcoin (BTC) as a hedge against inflation.
What do you think? Will inflating the debt save the fiat system, or will it accelerate the global rotation into Bitcoin?
#CryptoMarket #Bitcoin #MacroEconomics #FinanceNews #WriteToEarn
Can Inflation Shrink America’s $40 Trillion Debt? The Surprising Winner (and Loser)
In a recent interview with TIME magazine, President Donald Trump sparked an intense macroeconomic debate by suggesting that "certain levels of inflation" could help pay off the $40 trillion U.S. national debt "very rapidly."
While everyday consumers look at inflation as a financial burden, governments see it through a completely different lens. The strategy is known as "inflating away the debt". But how does it work, and more importantly, who is actually financing this debt relief? Let’s break it down. 👇
1. The Math: How Inflation Alters the Debt
When a government borrows money, it issues bonds (Treasuries) at fixed nominal amounts. If it borrows $1 billion today, it owes exactly $1 billion in the future. Inflation changes the rules of the game:
Cheaper Repayment: Inflation dilutes the purchasing power of the fiat dollar. The government pays back its older, long-term bonds using "cheaper" dollars than those it originally borrowed.Surging Nominal Tax Revenues: As inflation pushes up consumer prices, nominal wages, and corporate profits, the government’s tax collection naturally rises. Because the face value of the existing debt stays the same, the debt becomes smaller relative to the size of the expanding nominal economy (the Debt-to-GDP ratio).
2. The Surprising Reality: Who is Financing It? 👥
The most critical part of this strategy isn't the economic math—it is who pays for it. When a government inflates away its debt, it implicitly transfers wealth from the creditors (lenders) to the debtor (the government).
The entities financing this implicit wealth transfer include:
Foreign Sovereigns: International lenders holding trillions in U.S. Treasuries receive lower real returns as the dollar devalues.Domestic Institutions: Retirement pension funds, insurance companies, and commercial banks absorb the economic loss on fixed-income assets.Everyday Citizens & Savers: Inflation acts as a "hidden tax." While it shrinks government liabilities on paper, it simultaneously eats away at the purchasing power of citizens' cash savings and outpaces real wage growth.
3. The Dangerous Side Effects ⚠️
While inflating debt sounds like an easy fix, it is a highly volatile strategy with long-term consequences:
Skyrocketing Interest Costs: Investors demand higher yields on new government debt to protect against inflation. With the national debt past $40 trillion, net interest servicing costs already exceed $1 trillion annually. Higher inflation forces borrowing costs to stay elevated, which ironically accelerates deficit spending.The Federal Reserve Dilemma: To curb inflation, the central bank usually raises interest rates—a move Trump has openly criticized, arguing that high rates hurt economic growth more than inflation itself.
💡 The Big Takeaway for Crypto Investors
For the digital asset ecosystem, this macroeconomic backdrop directly reinforces the utility of hard money. When global superpowers rely on monetary debasement to manage sovereign debt burdens, capital historically migrates toward decentralized, mathematically scarce assets like Bitcoin (BTC) as a hedge against inflation.
What do you think? Will inflating the debt save the fiat system, or will it accelerate the global rotation into Bitcoin?
#CryptoMarket #Bitcoin #MacroEconomics #FinanceNews #WriteToEarn
While everyday consumers look at inflation as a financial burden, governments see it through a completely different lens. The strategy is known as "inflating away the debt". But how does it work, and more importantly, who is actually financing this debt relief? Let’s break it down. 👇
1. The Math: How Inflation Alters the Debt
When a government borrows money, it issues bonds (Treasuries) at fixed nominal amounts. If it borrows $1 billion today, it owes exactly $1 billion in the future. Inflation changes the rules of the game:
Cheaper Repayment: Inflation dilutes the purchasing power of the fiat dollar. The government pays back its older, long-term bonds using "cheaper" dollars than those it originally borrowed.Surging Nominal Tax Revenues: As inflation pushes up consumer prices, nominal wages, and corporate profits, the government’s tax collection naturally rises. Because the face value of the existing debt stays the same, the debt becomes smaller relative to the size of the expanding nominal economy (the Debt-to-GDP ratio).
2. The Surprising Reality: Who is Financing It? 👥
The most critical part of this strategy isn't the economic math—it is who pays for it. When a government inflates away its debt, it implicitly transfers wealth from the creditors (lenders) to the debtor (the government).
The entities financing this implicit wealth transfer include:
Foreign Sovereigns: International lenders holding trillions in U.S. Treasuries receive lower real returns as the dollar devalues.Domestic Institutions: Retirement pension funds, insurance companies, and commercial banks absorb the economic loss on fixed-income assets.Everyday Citizens & Savers: Inflation acts as a "hidden tax." While it shrinks government liabilities on paper, it simultaneously eats away at the purchasing power of citizens' cash savings and outpaces real wage growth.
3. The Dangerous Side Effects ⚠️
While inflating debt sounds like an easy fix, it is a highly volatile strategy with long-term consequences:
Skyrocketing Interest Costs: Investors demand higher yields on new government debt to protect against inflation. With the national debt past $40 trillion, net interest servicing costs already exceed $1 trillion annually. Higher inflation forces borrowing costs to stay elevated, which ironically accelerates deficit spending.The Federal Reserve Dilemma: To curb inflation, the central bank usually raises interest rates—a move Trump has openly criticized, arguing that high rates hurt economic growth more than inflation itself.
💡 The Big Takeaway for Crypto Investors
For the digital asset ecosystem, this macroeconomic backdrop directly reinforces the utility of hard money. When global superpowers rely on monetary debasement to manage sovereign debt burdens, capital historically migrates toward decentralized, mathematically scarce assets like Bitcoin (BTC) as a hedge against inflation.
What do you think? Will inflating the debt save the fiat system, or will it accelerate the global rotation into Bitcoin?
#CryptoMarket #Bitcoin #MacroEconomics #FinanceNews #WriteToEarn
2
288

Article
4 Coins Crypto Whales Are Buying for October 2026: Tracing the Smart Money Strategy
📈As September draws to a close, the broader crypto market is witnessing an intriguing shift in capital. While Bitcoin handles steady consolidation around $84,000, on-chain metrics reveal that crypto whales—wallets holding massive allocations of capital—are quietly loading up on four specific digital assets.
The data highlights that institutional buyers and mega-whales are not making identical bets. Instead, they are distributing their capital across three entirely different strategies: blue-chip protection, decentralized yield infrastructure, and deflationary supply catalysts.
Here are the four coins crypto whales are aggressively accumulating ahead of October 2026.
1. Bitcoin (BTC) – The Sovereign Dip-Buy Strategy
Bitcoin remains the primary destination for deep-pocketed investors seeking exposure without taking on extreme altcoin volatility. Data from Santiment and other prominent on-chain analytics platforms indicates a major divergence: while small retail wallets (holding less than 10 BTC) have been panic-selling during recent market fluctuations, addresses holding 100 to 1,000+ BTC have gone into aggressive accumulation.
Over a recent 96-hour window during a minor price drop, large entities scooped up roughly 30,269 BTC, translating to an institutional capital injection of over $2.5 billion. With global macro conditions pointing toward further quantitative easing and lower interest rates going into the final quarter of the year, whales are solidifying BTC as their core portfolio anchor.
2. Uniswap (UNI) – The Deflationary Catalyst Bet
Decentralized governance and exchange tokens are experiencing localized waves of whale accumulation, and Uniswap (UNI) is leading the charge. According to on-chain wallet data monitored by Nansen, dedicated whale addresses expanded their net UNI holdings by hundreds of thousands of tokens over the course of September.
The primary catalyst driving this interest is the implementation of fee-switch mechanisms and protocol buybacks designed to curb active circulating supply. Whales frequently target large-cap DeFi applications with clear utility upgrades during periods when the market trends sideways, looking to front-run supply squeezes.
3. Pendle (PENDLE) – High-Yield Infrastructure Lockup
One of the most tactical capital rotations observed at the end of September involves yield-trading protocols. Prominent crypto fund managers and legacy whales have notably rotated millions out of stagnant layer-1 protocols and into specialized DeFi yield venues like Pendle.
On-chain tracking shows large portfolios utilizing Pendle as a foundational yield venue. Whales are demonstrating high conviction by opting for maximum lock durations and increasing their participation in locked governance models (vPendle), effectively removing substantial amounts of liquidity from the open market ahead of October. The underlying thesis is simple: if massive ecosystem liquidity returns in Q4, infrastructure protocols that control native yield will capture the highest velocity of value.
4. Cardano (ADA) – The Contrarian Accumulation Play
Cardano (ADA) has re-emerged on the institutional radar after experiencing heavy contrarian buying. On-chain transaction records show that large-scale holders accumulated upwards of 160 million ADA during late-summer drawdowns.
As the market enters October, ADA is attempting to cement a structural breakout above key horizontal resistance boundaries. While retail sentiment surrounding the token has remained neutral, the consistent accumulation by large addresses implies that high-net-worth investors believe the asset has established a definitive macro bottom, offering an asymmetric risk-to-reward ratio for the coming month.
The Verdict: How to Navigate October
The current whale behavior reveals a stark contrast to typical retail trading. Instead of chasing short-term price movements, smart money is focused on accumulating asset discounts (BTC), locking in yield infrastructure (Pendle), and positioning ahead of structural supply catalysts (UNI, ADA).
As you format your portfolio for October 2026, following the on-chain footprints left by these large-scale investors can provide crucial insights into where the next major market momentum might originate.
Disclaimer: This article is for informational purposes only and does not constitute financial, investment, or trading advice. Always conduct your own research before trading digital assets.
4 Coins Crypto Whales Are Buying for October 2026: Tracing the Smart Money Strategy 📈
As September draws to a close, the broader crypto market is witnessing an intriguing shift in capital. While Bitcoin handles steady consolidation around $84,000, on-chain metrics reveal that crypto whales—wallets holding massive allocations of capital—are quietly loading up on four specific digital assets.
The data highlights that institutional buyers and mega-whales are not making identical bets. Instead, they are distributing their capital across three entirely different strategies: blue-chip protection, decentralized yield infrastructure, and deflationary supply catalysts.
Here are the four coins crypto whales are aggressively accumulating ahead of October 2026.
1. Bitcoin (BTC) – The Sovereign Dip-Buy Strategy
Bitcoin remains the primary destination for deep-pocketed investors seeking exposure without taking on extreme altcoin volatility. Data from Santiment and other prominent on-chain analytics platforms indicates a major divergence: while small retail wallets (holding less than 10 BTC) have been panic-selling during recent market fluctuations, addresses holding 100 to 1,000+ BTC have gone into aggressive accumulation.
Over a recent 96-hour window during a minor price drop, large entities scooped up roughly 30,269 BTC, translating to an institutional capital injection of over $2.5 billion. With global macro conditions pointing toward further quantitative easing and lower interest rates going into the final quarter of the year, whales are solidifying BTC as their core portfolio anchor.
2. Uniswap (UNI) – The Deflationary Catalyst Bet
Decentralized governance and exchange tokens are experiencing localized waves of whale accumulation, and Uniswap (UNI) is leading the charge. According to on-chain wallet data monitored by Nansen, dedicated whale addresses expanded their net UNI holdings by hundreds of thousands of tokens over the course of September.
The primary catalyst driving this interest is the implementation of fee-switch mechanisms and protocol buybacks designed to curb active circulating supply. Whales frequently target large-cap DeFi applications with clear utility upgrades during periods when the market trends sideways, looking to front-run supply squeezes.
3. Pendle (PENDLE) – High-Yield Infrastructure Lockup
One of the most tactical capital rotations observed at the end of September involves yield-trading protocols. Prominent crypto fund managers and legacy whales have notably rotated millions out of stagnant layer-1 protocols and into specialized DeFi yield venues like Pendle.
On-chain tracking shows large portfolios utilizing Pendle as a foundational yield venue. Whales are demonstrating high conviction by opting for maximum lock durations and increasing their participation in locked governance models (vPendle), effectively removing substantial amounts of liquidity from the open market ahead of October. The underlying thesis is simple: if massive ecosystem liquidity returns in Q4, infrastructure protocols that control native yield will capture the highest velocity of value.
4. Cardano (ADA) – The Contrarian Accumulation Play
Cardano (ADA) has re-emerged on the institutional radar after experiencing heavy contrarian buying. On-chain transaction records show that large-scale holders accumulated upwards of 160 million ADA during late-summer drawdowns.
As the market enters October, ADA is attempting to cement a structural breakout above key horizontal resistance boundaries. While retail sentiment surrounding the token has remained neutral, the consistent accumulation by large addresses implies that high-net-worth investors believe the asset has established a definitive macro bottom, offering an asymmetric risk-to-reward ratio for the coming month.
The Verdict: How to Navigate October
The current whale behavior reveals a stark contrast to typical retail trading. Instead of chasing short-term price movements, smart money is focused on accumulating asset discounts (BTC), locking in yield infrastructure (Pendle), and positioning ahead of structural supply catalysts (UNI, ADA).
As you format your portfolio for October 2026, following the on-chain footprints left by these large-scale investors can provide crucial insights into where the next major market momentum might originate.
Disclaimer: This article is for informational purposes only and does not constitute financial, investment, or trading advice. Always conduct your own research before trading digital assets.
The data highlights that institutional buyers and mega-whales are not making identical bets. Instead, they are distributing their capital across three entirely different strategies: blue-chip protection, decentralized yield infrastructure, and deflationary supply catalysts.
Here are the four coins crypto whales are aggressively accumulating ahead of October 2026.
1. Bitcoin (BTC) – The Sovereign Dip-Buy Strategy
Bitcoin remains the primary destination for deep-pocketed investors seeking exposure without taking on extreme altcoin volatility. Data from Santiment and other prominent on-chain analytics platforms indicates a major divergence: while small retail wallets (holding less than 10 BTC) have been panic-selling during recent market fluctuations, addresses holding 100 to 1,000+ BTC have gone into aggressive accumulation.
Over a recent 96-hour window during a minor price drop, large entities scooped up roughly 30,269 BTC, translating to an institutional capital injection of over $2.5 billion. With global macro conditions pointing toward further quantitative easing and lower interest rates going into the final quarter of the year, whales are solidifying BTC as their core portfolio anchor.
2. Uniswap (UNI) – The Deflationary Catalyst Bet
Decentralized governance and exchange tokens are experiencing localized waves of whale accumulation, and Uniswap (UNI) is leading the charge. According to on-chain wallet data monitored by Nansen, dedicated whale addresses expanded their net UNI holdings by hundreds of thousands of tokens over the course of September.
The primary catalyst driving this interest is the implementation of fee-switch mechanisms and protocol buybacks designed to curb active circulating supply. Whales frequently target large-cap DeFi applications with clear utility upgrades during periods when the market trends sideways, looking to front-run supply squeezes.
3. Pendle (PENDLE) – High-Yield Infrastructure Lockup
One of the most tactical capital rotations observed at the end of September involves yield-trading protocols. Prominent crypto fund managers and legacy whales have notably rotated millions out of stagnant layer-1 protocols and into specialized DeFi yield venues like Pendle.
On-chain tracking shows large portfolios utilizing Pendle as a foundational yield venue. Whales are demonstrating high conviction by opting for maximum lock durations and increasing their participation in locked governance models (vPendle), effectively removing substantial amounts of liquidity from the open market ahead of October. The underlying thesis is simple: if massive ecosystem liquidity returns in Q4, infrastructure protocols that control native yield will capture the highest velocity of value.
4. Cardano (ADA) – The Contrarian Accumulation Play
Cardano (ADA) has re-emerged on the institutional radar after experiencing heavy contrarian buying. On-chain transaction records show that large-scale holders accumulated upwards of 160 million ADA during late-summer drawdowns.
As the market enters October, ADA is attempting to cement a structural breakout above key horizontal resistance boundaries. While retail sentiment surrounding the token has remained neutral, the consistent accumulation by large addresses implies that high-net-worth investors believe the asset has established a definitive macro bottom, offering an asymmetric risk-to-reward ratio for the coming month.
The Verdict: How to Navigate October
The current whale behavior reveals a stark contrast to typical retail trading. Instead of chasing short-term price movements, smart money is focused on accumulating asset discounts (BTC), locking in yield infrastructure (Pendle), and positioning ahead of structural supply catalysts (UNI, ADA).
As you format your portfolio for October 2026, following the on-chain footprints left by these large-scale investors can provide crucial insights into where the next major market momentum might originate.
Disclaimer: This article is for informational purposes only and does not constitute financial, investment, or trading advice. Always conduct your own research before trading digital assets.
1
533
Article
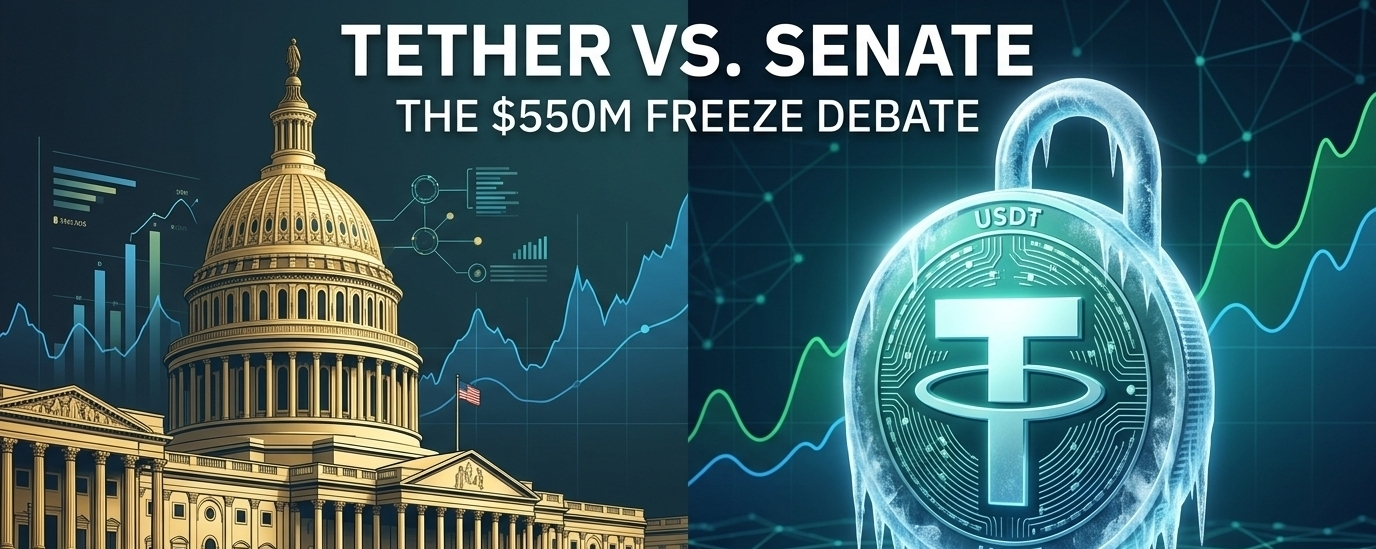
Senate Says Iran Leans on Tether’s USDT: Is Its $550 Million Freeze Record Enough?The global stablecoin market is facing intense geopolitical scrutiny following a major disclosure by U.S. lawmakers. A newly released congressional report reveals that Tether’s USDT has become a primary vehicle for regional finance and sanctions evasion, sparking a heated debate over whether corporate asset freezes are keeping pace with illicit flows.
A comprehensive investigation by Senate Democrats on the Permanent Subcommittee on Investigations (PSI) revealed that 84% of more than 800 sanctioned, Iran-linked crypto wallets utilized Tether’s USDT exclusively or predominantly.
On the exact same day the Senate findings went public, Tether issued a defensive counter-statement, announcing that it has helped law enforcement freeze approximately $550 million in Iran-linked USDT this year alone. The clashing reports highlight a massive disconnect between corporate compliance efforts and government expectations.
The Senate Findings: A "Shadow Banking" Lifeline
The Senate subcommittee’s analysis focused on 846 cryptocurrency wallets previously flagged, sanctioned, or targeted for asset seizure due to direct ties to the Iranian regime and its regional proxy networks.
Lawmakers state that the flagship stablecoin has effectively been weaponized to construct an alternative financial system. According to the committee, this network is actively used to stabilize volatile domestic fiat currency, fund regional operations, and bypass traditional banking rails entirely.
Citing these systemic vulnerabilities, the subcommittee has officially referred its findings to the U.S. Department of Justice (DOJ) and the Treasury Department, demanding a formal investigation into potential sanctions violations.
Tether’s Counter-Defense: The Half-Billion Dollar Wall
In response to the mounting political pressure, Tether heavily defended its compliance track record, positioning itself as a proactive partner to global law enforcement rather than an enabler.
The stablecoin issuer detailed its massive asset mitigation efforts throughout the year, which include two record-setting enforcement actions:
The April Intervention: Tether utilized its smart-contract controls to freeze $344 million across two prominent wallets tied by authorities to the Central Bank of Iran.The July Tron Blockade: The company successfully blacklisted over $130 million spread across four separate addresses operating on the Tron blockchain network.
Management emphasized that public blockchain ledgers afford law enforcement tracking capabilities that traditional paper cash simply cannot match, arguing that USDT is an inherently hostile environment for sanctioned actors due to its traceable nature.
The Crucial Disconnect: Why Regulators Say It’s Not Enough
Despite the historic scale of Tether's $550 million freeze, the Senate report argues that looking at frozen balances alone paints an incomplete picture. U.S. investigators point to critical structural flaws in how stablecoins are monitored:
Reactionary Delays: The report alleges that asset freezes are heavily delayed. In several documented instances, illicit addresses continued to move tens of millions of dollars for weeks after public government designations before the corporate "kill switch" was finally flipped.Velocity vs. Balance: While a $550 million freeze represents the funds caught at the exact moment of the block, it does not account for the total historical volume of billions in USDT that successfully flowed through those same wallets and escaped into the broader economy before intervention occurred.The Transparency Gap: Analysts noted that while Tether's two major itemized actions account for roughly $474 million, a $76 million discrepancy remains unexplained in the public ledger data, fueling further demands for transparency.
As global regulators ramp up enforcement actions against digital asset rails, the spotlight on the stablecoin market has never been brighter. The ultimate question remains: Can a private corporate issuer effectively police a decentralized ecosystem, or will governments step in with sweeping legislative mandates?
What's your take, creators? Can compliance protocols fully secure centralized stablecoins, or will regulatory pressure force capital into decentralized alternatives? Let's discuss in the comments below!
Disclaimer: This post is for educational and informational purposes only and does not constitute financial, legal, or investment advice.
Senate Says Iran Leans on Tether’s USDT: Is Its $550 Million Freeze Record Enough?
The global stablecoin market is facing intense geopolitical scrutiny following a major disclosure by U.S. lawmakers. A newly released congressional report reveals that Tether’s USDT has become a primary vehicle for regional finance and sanctions evasion, sparking a heated debate over whether corporate asset freezes are keeping pace with illicit flows.
A comprehensive investigation by Senate Democrats on the Permanent Subcommittee on Investigations (PSI) revealed that 84% of more than 800 sanctioned, Iran-linked crypto wallets utilized Tether’s USDT exclusively or predominantly.
On the exact same day the Senate findings went public, Tether issued a defensive counter-statement, announcing that it has helped law enforcement freeze approximately $550 million in Iran-linked USDT this year alone. The clashing reports highlight a massive disconnect between corporate compliance efforts and government expectations.
The Senate Findings: A "Shadow Banking" Lifeline
The Senate subcommittee’s analysis focused on 846 cryptocurrency wallets previously flagged, sanctioned, or targeted for asset seizure due to direct ties to the Iranian regime and its regional proxy networks.
Lawmakers state that the flagship stablecoin has effectively been weaponized to construct an alternative financial system. According to the committee, this network is actively used to stabilize volatile domestic fiat currency, fund regional operations, and bypass traditional banking rails entirely.
Citing these systemic vulnerabilities, the subcommittee has officially referred its findings to the U.S. Department of Justice (DOJ) and the Treasury Department, demanding a formal investigation into potential sanctions violations.
Tether’s Counter-Defense: The Half-Billion Dollar Wall
In response to the mounting political pressure, Tether heavily defended its compliance track record, positioning itself as a proactive partner to global law enforcement rather than an enabler.
The stablecoin issuer detailed its massive asset mitigation efforts throughout the year, which include two record-setting enforcement actions:
The April Intervention: Tether utilized its smart-contract controls to freeze $344 million across two prominent wallets tied by authorities to the Central Bank of Iran.The July Tron Blockade: The company successfully blacklisted over $130 million spread across four separate addresses operating on the Tron blockchain network.
Management emphasized that public blockchain ledgers afford law enforcement tracking capabilities that traditional paper cash simply cannot match, arguing that USDT is an inherently hostile environment for sanctioned actors due to its traceable nature.
The Crucial Disconnect: Why Regulators Say It’s Not Enough
Despite the historic scale of Tether's $550 million freeze, the Senate report argues that looking at frozen balances alone paints an incomplete picture. U.S. investigators point to critical structural flaws in how stablecoins are monitored:
Reactionary Delays: The report alleges that asset freezes are heavily delayed. In several documented instances, illicit addresses continued to move tens of millions of dollars for weeks after public government designations before the corporate "kill switch" was finally flipped.Velocity vs. Balance: While a $550 million freeze represents the funds caught at the exact moment of the block, it does not account for the total historical volume of billions in USDT that successfully flowed through those same wallets and escaped into the broader economy before intervention occurred.The Transparency Gap: Analysts noted that while Tether's two major itemized actions account for roughly $474 million, a $76 million discrepancy remains unexplained in the public ledger data, fueling further demands for transparency.
As global regulators ramp up enforcement actions against digital asset rails, the spotlight on the stablecoin market has never been brighter. The ultimate question remains: Can a private corporate issuer effectively police a decentralized ecosystem, or will governments step in with sweeping legislative mandates?
What's your take, creators? Can compliance protocols fully secure centralized stablecoins, or will regulatory pressure force capital into decentralized alternatives? Let's discuss in the comments below!
Disclaimer: This post is for educational and informational purposes only and does not constitute financial, legal, or investment advice.
A comprehensive investigation by Senate Democrats on the Permanent Subcommittee on Investigations (PSI) revealed that 84% of more than 800 sanctioned, Iran-linked crypto wallets utilized Tether’s USDT exclusively or predominantly.
On the exact same day the Senate findings went public, Tether issued a defensive counter-statement, announcing that it has helped law enforcement freeze approximately $550 million in Iran-linked USDT this year alone. The clashing reports highlight a massive disconnect between corporate compliance efforts and government expectations.
The Senate Findings: A "Shadow Banking" Lifeline
The Senate subcommittee’s analysis focused on 846 cryptocurrency wallets previously flagged, sanctioned, or targeted for asset seizure due to direct ties to the Iranian regime and its regional proxy networks.
Lawmakers state that the flagship stablecoin has effectively been weaponized to construct an alternative financial system. According to the committee, this network is actively used to stabilize volatile domestic fiat currency, fund regional operations, and bypass traditional banking rails entirely.
Citing these systemic vulnerabilities, the subcommittee has officially referred its findings to the U.S. Department of Justice (DOJ) and the Treasury Department, demanding a formal investigation into potential sanctions violations.
Tether’s Counter-Defense: The Half-Billion Dollar Wall
In response to the mounting political pressure, Tether heavily defended its compliance track record, positioning itself as a proactive partner to global law enforcement rather than an enabler.
The stablecoin issuer detailed its massive asset mitigation efforts throughout the year, which include two record-setting enforcement actions:
The April Intervention: Tether utilized its smart-contract controls to freeze $344 million across two prominent wallets tied by authorities to the Central Bank of Iran.The July Tron Blockade: The company successfully blacklisted over $130 million spread across four separate addresses operating on the Tron blockchain network.
Management emphasized that public blockchain ledgers afford law enforcement tracking capabilities that traditional paper cash simply cannot match, arguing that USDT is an inherently hostile environment for sanctioned actors due to its traceable nature.
The Crucial Disconnect: Why Regulators Say It’s Not Enough
Despite the historic scale of Tether's $550 million freeze, the Senate report argues that looking at frozen balances alone paints an incomplete picture. U.S. investigators point to critical structural flaws in how stablecoins are monitored:
Reactionary Delays: The report alleges that asset freezes are heavily delayed. In several documented instances, illicit addresses continued to move tens of millions of dollars for weeks after public government designations before the corporate "kill switch" was finally flipped.Velocity vs. Balance: While a $550 million freeze represents the funds caught at the exact moment of the block, it does not account for the total historical volume of billions in USDT that successfully flowed through those same wallets and escaped into the broader economy before intervention occurred.The Transparency Gap: Analysts noted that while Tether's two major itemized actions account for roughly $474 million, a $76 million discrepancy remains unexplained in the public ledger data, fueling further demands for transparency.
As global regulators ramp up enforcement actions against digital asset rails, the spotlight on the stablecoin market has never been brighter. The ultimate question remains: Can a private corporate issuer effectively police a decentralized ecosystem, or will governments step in with sweeping legislative mandates?
What's your take, creators? Can compliance protocols fully secure centralized stablecoins, or will regulatory pressure force capital into decentralized alternatives? Let's discuss in the comments below!
Disclaimer: This post is for educational and informational purposes only and does not constitute financial, legal, or investment advice.
1
403

Article
Bitcoin Price Prediction for October: Defying History, But One $4.35B Risk Looming LargeThe cryptocurrency market is defying all historical expectations as we enter October. Traditionally known as a "red" month where digital assets face heavy seasonal slumps, this September turned completely on its head.
Bitcoin closed the month on a highly bullish note, entering October trading roughly 9% above its close on the day of the Federal Reserve’s interest rate hike. Despite macro tightening headwinds, institutional demand has successfully flipped the script.
However, as the highly anticipated "Uptober" rally tries to kick into high gear, traders are eyeing a massive $4.35 billion options expiry that could temporarily cap Bitcoin's upside momentum.
Defying the Fed and Surging Yields
Usually, a hawkish Federal Reserve and climbing U.S. Treasury yields spell disaster for non-yielding speculative assets. Yet, Bitcoin has shown remarkable resilience.
The primary driver behind this sudden strength is an unprecedented wave of institutional accumulation. Spot Bitcoin ETFs recorded a massive $2.39 billion in weekly inflows right at the tail end of September, marking the highest single-week inflow in nearly a year. This heavy institutional buying wall has effectively absorbed selling pressure and protected Bitcoin's upward price trajectory.
The $4.35 Billion Friction Point
Despite the bullish structural setup, the immediate path upward faces a significant derivatives hurdle. A massive $4.35 billion options contract expiry is looming over the market.
When open interest reaches these extreme levels, it creates a powerful "max pain" gravitational pull on the spot price. Institutional market makers are forced to aggressively hedge their open positions, which often leads to heavy consolidation and short-term volatility.
For the "Uptober" rally to fully unlock its potential, buyers must definitively reclaim the $87,497 yearly opening baseline. Clearing this level will signal that the derivatives friction has passed and that the macro uptrend is ready to resume.
October Price Targets: The Three Scenarios
Based on current liquidity flows and technical structures, market analysts are eyeing three distinct paths for the remainder of the month:
The Bullish Case ($105,000 – $120,000): If Bitcoin successfully breaks through overhead resistance at $91,800 and moves past the options expiry without significant damage, a fast track toward the six-figure milestone becomes highly probable.The Base Case ($90,000 – $98,000): Steady ETF inflows are expected to balance out macroeconomic pressures, keeping Bitcoin in a controlled, upward-trending channel.The Bearish Case ($75,000 – $82,000): If macro tightening intensifies and spot prices slip beneath the crucial psychological support line of $82,744, we could see a deeper correction to flush out late leverage.
What are your thoughts, creators? Are we heading straight to $100k this Uptober, or will the options wall trigger a pullback first? Drop your analysis below!
Disclaimer: This post is for educational and informational purposes only and does not constitute financial advice.
#Write2Earn #USDTAdds845900HoldersInPast7Days #ChainlinkLaunchesCCIP2WithEnterpriseVerification #BTCFallsBelow$83000 #BitcoinSpotETFs$2.39BWeeklyNetInflow
Bitcoin Price Prediction for October: Defying History, But One $4.35B Risk Looming Large
The cryptocurrency market is defying all historical expectations as we enter October. Traditionally known as a "red" month where digital assets face heavy seasonal slumps, this September turned completely on its head.
Bitcoin closed the month on a highly bullish note, entering October trading roughly 9% above its close on the day of the Federal Reserve’s interest rate hike. Despite macro tightening headwinds, institutional demand has successfully flipped the script.
However, as the highly anticipated "Uptober" rally tries to kick into high gear, traders are eyeing a massive $4.35 billion options expiry that could temporarily cap Bitcoin's upside momentum.
Defying the Fed and Surging Yields
Usually, a hawkish Federal Reserve and climbing U.S. Treasury yields spell disaster for non-yielding speculative assets. Yet, Bitcoin has shown remarkable resilience.
The primary driver behind this sudden strength is an unprecedented wave of institutional accumulation. Spot Bitcoin ETFs recorded a massive $2.39 billion in weekly inflows right at the tail end of September, marking the highest single-week inflow in nearly a year. This heavy institutional buying wall has effectively absorbed selling pressure and protected Bitcoin's upward price trajectory.
The $4.35 Billion Friction Point
Despite the bullish structural setup, the immediate path upward faces a significant derivatives hurdle. A massive $4.35 billion options contract expiry is looming over the market.
When open interest reaches these extreme levels, it creates a powerful "max pain" gravitational pull on the spot price. Institutional market makers are forced to aggressively hedge their open positions, which often leads to heavy consolidation and short-term volatility.
For the "Uptober" rally to fully unlock its potential, buyers must definitively reclaim the $87,497 yearly opening baseline. Clearing this level will signal that the derivatives friction has passed and that the macro uptrend is ready to resume.
October Price Targets: The Three Scenarios
Based on current liquidity flows and technical structures, market analysts are eyeing three distinct paths for the remainder of the month:
The Bullish Case ($105,000 – $120,000): If Bitcoin successfully breaks through overhead resistance at $91,800 and moves past the options expiry without significant damage, a fast track toward the six-figure milestone becomes highly probable.The Base Case ($90,000 – $98,000): Steady ETF inflows are expected to balance out macroeconomic pressures, keeping Bitcoin in a controlled, upward-trending channel.The Bearish Case ($75,000 – $82,000): If macro tightening intensifies and spot prices slip beneath the crucial psychological support line of $82,744, we could see a deeper correction to flush out late leverage.
What are your thoughts, creators? Are we heading straight to $100k this Uptober, or will the options wall trigger a pullback first? Drop your analysis below!
Disclaimer: This post is for educational and informational purposes only and does not constitute financial advice.
#Write2Earn #USDTAdds845900HoldersInPast7Days #ChainlinkLaunchesCCIP2WithEnterpriseVerification #BTCFallsBelow$83000 #BitcoinSpotETFs$2.39BWeeklyNetInflow
Bitcoin closed the month on a highly bullish note, entering October trading roughly 9% above its close on the day of the Federal Reserve’s interest rate hike. Despite macro tightening headwinds, institutional demand has successfully flipped the script.
However, as the highly anticipated "Uptober" rally tries to kick into high gear, traders are eyeing a massive $4.35 billion options expiry that could temporarily cap Bitcoin's upside momentum.
Defying the Fed and Surging Yields
Usually, a hawkish Federal Reserve and climbing U.S. Treasury yields spell disaster for non-yielding speculative assets. Yet, Bitcoin has shown remarkable resilience.
The primary driver behind this sudden strength is an unprecedented wave of institutional accumulation. Spot Bitcoin ETFs recorded a massive $2.39 billion in weekly inflows right at the tail end of September, marking the highest single-week inflow in nearly a year. This heavy institutional buying wall has effectively absorbed selling pressure and protected Bitcoin's upward price trajectory.
The $4.35 Billion Friction Point
Despite the bullish structural setup, the immediate path upward faces a significant derivatives hurdle. A massive $4.35 billion options contract expiry is looming over the market.
When open interest reaches these extreme levels, it creates a powerful "max pain" gravitational pull on the spot price. Institutional market makers are forced to aggressively hedge their open positions, which often leads to heavy consolidation and short-term volatility.
For the "Uptober" rally to fully unlock its potential, buyers must definitively reclaim the $87,497 yearly opening baseline. Clearing this level will signal that the derivatives friction has passed and that the macro uptrend is ready to resume.
October Price Targets: The Three Scenarios
Based on current liquidity flows and technical structures, market analysts are eyeing three distinct paths for the remainder of the month:
The Bullish Case ($105,000 – $120,000): If Bitcoin successfully breaks through overhead resistance at $91,800 and moves past the options expiry without significant damage, a fast track toward the six-figure milestone becomes highly probable.The Base Case ($90,000 – $98,000): Steady ETF inflows are expected to balance out macroeconomic pressures, keeping Bitcoin in a controlled, upward-trending channel.The Bearish Case ($75,000 – $82,000): If macro tightening intensifies and spot prices slip beneath the crucial psychological support line of $82,744, we could see a deeper correction to flush out late leverage.
What are your thoughts, creators? Are we heading straight to $100k this Uptober, or will the options wall trigger a pullback first? Drop your analysis below!
Disclaimer: This post is for educational and informational purposes only and does not constitute financial advice.
#Write2Earn #USDTAdds845900HoldersInPast7Days #ChainlinkLaunchesCCIP2WithEnterpriseVerification #BTCFallsBelow$83000 #BitcoinSpotETFs$2.39BWeeklyNetInflow
1
364

Article
Fidelity’s Crypto Signal Flashes: Is Bitcoin Headed to $100,000?#Bitcoin is maintaining strong momentum above the critical $80,000 psychological threshold. According to key macro indicators—including models highlighted by Fidelity Investments' Director of Global Macro, Jurrien Timmer—holding this level firmly confirms a cyclical market bottom and clears a technical runway toward the coveted $100,000 milestone.
As institutional capital structuralizes the crypto space, this signal marks a pivotal shift from speculative retail trading to a macro-driven bull market.
The Technical Foundation: Building the $80,000 Floor
Bitcoin’s ability to turn previous overhead resistance into absolute support changes the game for the remaining quarters of 2026.
The Macro Bottom: Sustained price action above $80,000 invalidates deep correction theses.Supply Shock Metrics: Exchange reserves continue to hit multi-year lows.Institutional Liquidity: Continuous spot ETF inflows create a persistent buying floor.
The Path to Six Figures
With the $80,000 validation complete, the structural path toward $100,000 relies heavily on steady macroeconomic tailwinds and institutional adoption curves.
Diminishing Drawdowns: Higher lows indicate institutional accumulation rather than retail FOMO.Metcalfe’s Law: Network growth and unique wallet addresses mirror historical 10x adoption curves.The Six-Figure Target: A move to $100,000 requires only a ~20% push from current consolidation levels.
Strategic Takeaways for Creators & Traders
While the macro signal flashes green, smart market participants should focus on risk-managed exposure rather than over-leveraged breakout chasing.
Dollar-Cost Average (DCA): Accumulating during minor retests of the $80k support zone.Monitor Inflows: Keep a close eye on weekly aggregate spot ETF net flows.Manage Leverage: High-funding rates during psychological breakouts often trigger short-term liquidations.
#Write2Earn #BTC走势分析 #TrumpRejectsIranHormuzReopening $BTC
{future}(BTCUSDT)
Fidelity’s Crypto Signal Flashes: Is Bitcoin Headed to $100,000?
#Bitcoin is maintaining strong momentum above the critical $80,000 psychological threshold. According to key macro indicators—including models highlighted by Fidelity Investments' Director of Global Macro, Jurrien Timmer—holding this level firmly confirms a cyclical market bottom and clears a technical runway toward the coveted $100,000 milestone.
As institutional capital structuralizes the crypto space, this signal marks a pivotal shift from speculative retail trading to a macro-driven bull market.
The Technical Foundation: Building the $80,000 Floor
Bitcoin’s ability to turn previous overhead resistance into absolute support changes the game for the remaining quarters of 2026.
The Macro Bottom: Sustained price action above $80,000 invalidates deep correction theses.Supply Shock Metrics: Exchange reserves continue to hit multi-year lows.Institutional Liquidity: Continuous spot ETF inflows create a persistent buying floor.
The Path to Six Figures
With the $80,000 validation complete, the structural path toward $100,000 relies heavily on steady macroeconomic tailwinds and institutional adoption curves.
Diminishing Drawdowns: Higher lows indicate institutional accumulation rather than retail FOMO.Metcalfe’s Law: Network growth and unique wallet addresses mirror historical 10x adoption curves.The Six-Figure Target: A move to $100,000 requires only a ~20% push from current consolidation levels.
Strategic Takeaways for Creators & Traders
While the macro signal flashes green, smart market participants should focus on risk-managed exposure rather than over-leveraged breakout chasing.
Dollar-Cost Average (DCA): Accumulating during minor retests of the $80k support zone.Monitor Inflows: Keep a close eye on weekly aggregate spot ETF net flows.Manage Leverage: High-funding rates during psychological breakouts often trigger short-term liquidations.
#Write2Earn #BTC走势分析 #TrumpRejectsIranHormuzReopening $BTC
As institutional capital structuralizes the crypto space, this signal marks a pivotal shift from speculative retail trading to a macro-driven bull market.
The Technical Foundation: Building the $80,000 Floor
Bitcoin’s ability to turn previous overhead resistance into absolute support changes the game for the remaining quarters of 2026.
The Macro Bottom: Sustained price action above $80,000 invalidates deep correction theses.Supply Shock Metrics: Exchange reserves continue to hit multi-year lows.Institutional Liquidity: Continuous spot ETF inflows create a persistent buying floor.
The Path to Six Figures
With the $80,000 validation complete, the structural path toward $100,000 relies heavily on steady macroeconomic tailwinds and institutional adoption curves.
Diminishing Drawdowns: Higher lows indicate institutional accumulation rather than retail FOMO.Metcalfe’s Law: Network growth and unique wallet addresses mirror historical 10x adoption curves.The Six-Figure Target: A move to $100,000 requires only a ~20% push from current consolidation levels.
Strategic Takeaways for Creators & Traders
While the macro signal flashes green, smart market participants should focus on risk-managed exposure rather than over-leveraged breakout chasing.
Dollar-Cost Average (DCA): Accumulating during minor retests of the $80k support zone.Monitor Inflows: Keep a close eye on weekly aggregate spot ETF net flows.Manage Leverage: High-funding rates during psychological breakouts often trigger short-term liquidations.
#Write2Earn #BTC走势分析 #TrumpRejectsIranHormuzReopening $BTC
1
338
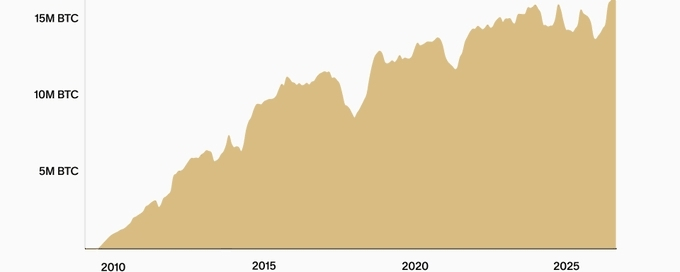
Article
Bitcoin ETFs Pull In a Record $2.39 Billion: Is There Real Demand Behind It?U.S. spot Bitcoin ETFs captured headlines this week by drawing a staggering $2.39 billion in net inflows, marking the largest weekly total of 2026. While a billion-dollar milestone usually points to an explosive retail buying frenzy, a look under the hood reveals that this record week is being driven by a powerful combination of structural supply squeezes and institutional trading strategies rather than fresh retail mania.
The Illiquid Supply Squeeze
The aggressive upward price action accompanying these inflows is primarily a byproduct of a heavily illiquid market. Data shows that roughly 81% of the total circulating Bitcoin supply (approximately 16.3 million BTC) has remained completely stationary for at least six months.
At the same time, overall spot exchange trading volumes are down by roughly 30%. With fewer coins actively changing hands, standard institutional buying forces ETF custodians to absorb a highly limited liquid supply. This causes prices to jump aggressively even without a massive wave of new individual participants entering the crypto space.
The Role of Institutional Arbitrage
A significant portion of the record-breaking capital is tied to sophisticated institutional frameworks rather than long-term directional accumulation. Many hedge funds are actively executing the "basis trade." By purchasing spot Bitcoin ETFs and simultaneously shorting Bitcoin futures contracts on platforms like the CME, these funds lock in risk-free yield from premium differences. This mechanism prints massive inflow data on the ETF side without representing an organic, long-term bullish bet on the asset's appreciation.
However, the fund distribution shows signs of structural maturity. Instead of a single issuer like BlackRock driving the vast majority of the volume, capital was healthily distributed across multiple funds, including Fidelity and Ark Invest. This indicates a broader, more stable institutional baseline.
Momentum Meets Macro Headwinds
The multi-day inflow streak kicked off with momentum, fueled by a massive $998.95 million inflow on Monday that triggered over $262 million in short-position liquidations. This short-squeeze structurally forced bearish traders to buy back Bitcoin, compounding the initial volume.
Despite the strong start, the momentum cooled rapidly as the week progressed. Daily net inflows fell by 87%, dropping to $134.47 million by Friday. This sharp deceleration came on the heels of strong U.S. economic data and surging 10-year Treasury yields, forcing fund managers to practice caution ahead of the upcoming Personal Consumption Expenditures (PCE) inflation report.
Ultimately, the $2.39 billion entering the market is undeniably real, but its behavior reflects strategic institutional accumulation and arbitrage navigating a supply-constrained environment rather than a retail-driven speculative bubble.
#SECCommissionerPeirceToLeaveOct2 #BlackRockBuildsTokenizedPortfoliosForOndo #CircleTetherFreezeBitgetHackerWallet #CoinMarketCapCompletesCoinglassAcquisition
Bitcoin ETFs Pull In a Record $2.39 Billion: Is There Real Demand Behind It?
U.S. spot Bitcoin ETFs captured headlines this week by drawing a staggering $2.39 billion in net inflows, marking the largest weekly total of 2026. While a billion-dollar milestone usually points to an explosive retail buying frenzy, a look under the hood reveals that this record week is being driven by a powerful combination of structural supply squeezes and institutional trading strategies rather than fresh retail mania.
The Illiquid Supply Squeeze
The aggressive upward price action accompanying these inflows is primarily a byproduct of a heavily illiquid market. Data shows that roughly 81% of the total circulating Bitcoin supply (approximately 16.3 million BTC) has remained completely stationary for at least six months.
At the same time, overall spot exchange trading volumes are down by roughly 30%. With fewer coins actively changing hands, standard institutional buying forces ETF custodians to absorb a highly limited liquid supply. This causes prices to jump aggressively even without a massive wave of new individual participants entering the crypto space.
The Role of Institutional Arbitrage
A significant portion of the record-breaking capital is tied to sophisticated institutional frameworks rather than long-term directional accumulation. Many hedge funds are actively executing the "basis trade." By purchasing spot Bitcoin ETFs and simultaneously shorting Bitcoin futures contracts on platforms like the CME, these funds lock in risk-free yield from premium differences. This mechanism prints massive inflow data on the ETF side without representing an organic, long-term bullish bet on the asset's appreciation.
However, the fund distribution shows signs of structural maturity. Instead of a single issuer like BlackRock driving the vast majority of the volume, capital was healthily distributed across multiple funds, including Fidelity and Ark Invest. This indicates a broader, more stable institutional baseline.
Momentum Meets Macro Headwinds
The multi-day inflow streak kicked off with momentum, fueled by a massive $998.95 million inflow on Monday that triggered over $262 million in short-position liquidations. This short-squeeze structurally forced bearish traders to buy back Bitcoin, compounding the initial volume.
Despite the strong start, the momentum cooled rapidly as the week progressed. Daily net inflows fell by 87%, dropping to $134.47 million by Friday. This sharp deceleration came on the heels of strong U.S. economic data and surging 10-year Treasury yields, forcing fund managers to practice caution ahead of the upcoming Personal Consumption Expenditures (PCE) inflation report.
Ultimately, the $2.39 billion entering the market is undeniably real, but its behavior reflects strategic institutional accumulation and arbitrage navigating a supply-constrained environment rather than a retail-driven speculative bubble.
#SECCommissionerPeirceToLeaveOct2 #BlackRockBuildsTokenizedPortfoliosForOndo #CircleTetherFreezeBitgetHackerWallet #CoinMarketCapCompletesCoinglassAcquisition
The Illiquid Supply Squeeze
The aggressive upward price action accompanying these inflows is primarily a byproduct of a heavily illiquid market. Data shows that roughly 81% of the total circulating Bitcoin supply (approximately 16.3 million BTC) has remained completely stationary for at least six months.
At the same time, overall spot exchange trading volumes are down by roughly 30%. With fewer coins actively changing hands, standard institutional buying forces ETF custodians to absorb a highly limited liquid supply. This causes prices to jump aggressively even without a massive wave of new individual participants entering the crypto space.
The Role of Institutional Arbitrage
A significant portion of the record-breaking capital is tied to sophisticated institutional frameworks rather than long-term directional accumulation. Many hedge funds are actively executing the "basis trade." By purchasing spot Bitcoin ETFs and simultaneously shorting Bitcoin futures contracts on platforms like the CME, these funds lock in risk-free yield from premium differences. This mechanism prints massive inflow data on the ETF side without representing an organic, long-term bullish bet on the asset's appreciation.
However, the fund distribution shows signs of structural maturity. Instead of a single issuer like BlackRock driving the vast majority of the volume, capital was healthily distributed across multiple funds, including Fidelity and Ark Invest. This indicates a broader, more stable institutional baseline.
Momentum Meets Macro Headwinds
The multi-day inflow streak kicked off with momentum, fueled by a massive $998.95 million inflow on Monday that triggered over $262 million in short-position liquidations. This short-squeeze structurally forced bearish traders to buy back Bitcoin, compounding the initial volume.
Despite the strong start, the momentum cooled rapidly as the week progressed. Daily net inflows fell by 87%, dropping to $134.47 million by Friday. This sharp deceleration came on the heels of strong U.S. economic data and surging 10-year Treasury yields, forcing fund managers to practice caution ahead of the upcoming Personal Consumption Expenditures (PCE) inflation report.
Ultimately, the $2.39 billion entering the market is undeniably real, but its behavior reflects strategic institutional accumulation and arbitrage navigating a supply-constrained environment rather than a retail-driven speculative bubble.
#SECCommissionerPeirceToLeaveOct2 #BlackRockBuildsTokenizedPortfoliosForOndo #CircleTetherFreezeBitgetHackerWallet #CoinMarketCapCompletesCoinglassAcquisition

JOIN & CLAIM 🎉🎁
From Crypto__Today
13
34
426

Article
Trump and Tech CEOs to Hold High-Stakes AI Summit on September 29The global artificial intelligence race is heading straight to Washington.
President Donald Trump and House Speaker Mike Johnson are scheduled to host a pivotal summit with top technology chief executives on September 29, 2026. The high-profile meeting arrives amid intense international friction and a widening divide over how the U.S. should handle frontier AI models.
🏛️ The Core Agenda: Safeguards vs. Growth
While the formal guest list remains under wraps, sources indicate the summit will tackle the massive economic and security implications of rapid AI expansion:
The Safety Debate: Leaders from several prominent AI labs—including OpenAI and Anthropic—have recently intensified warnings about existential AI risks, urging a coordinated slowdown in training advanced models.The Deregulation Stance: President Trump has repeatedly dismissed extreme safety warnings as a "hoax". He recently affirmed his administration's goal to support industry growth rather than impose restrictive regulations that could stifle American competitive advantages.The "AI Force" Initiative: The meeting follows Trump's announcement to establish a federal "AI Force" led by an upcoming "AI czar," choosing to rely on existing judicial frameworks to combat corporate wrongdoing rather than inventing new regulatory hurdles.
🌐 The Geopolitical Backdrop: U.S. vs. China
The upcoming Washington summit reflects broader geopolitical anxieties regarding technological dominance:
Globalist Rejection: In a recent speech to the UN General Assembly, Trump declared his firm opposition to any "globalist scheme" designed to monitor or control artificial intelligence.The Superintelligence Race: Highlighting the stakes of the ongoing technology race, Trump remarked, "Whoever wins superintelligence wins"—pointing out that the U.S. currently holds a significant lead over China.Bilateral Dialogue: This event is unfolding alongside critical geopolitical movements, including a newly initiated "U.S.-China AI Dialogue" established to monitor and notify both nations of significant AI incidents.
🔮 Impact on the Tech and Web3 Sectors
For the broader tech and cryptocurrency markets, the administration's market-driven approach signals an environment heavily favored toward rapid innovation. By bypassing strict regulatory roadblocks, the upcoming conversations are expected to accelerate corporate adoption of high-performance compute networks, decentralized AI storage, and next-generation sovereign technology systems.
Disclaimer: This post is for informational and educational purposes only and does not constitute financial, investment, or legal advice.
#BTC☀️ #BitcoinSpotETFsNetInflow$191M #AI
Trump and Tech CEOs to Hold High-Stakes AI Summit on September 29
The global artificial intelligence race is heading straight to Washington.
President Donald Trump and House Speaker Mike Johnson are scheduled to host a pivotal summit with top technology chief executives on September 29, 2026. The high-profile meeting arrives amid intense international friction and a widening divide over how the U.S. should handle frontier AI models.
🏛️ The Core Agenda: Safeguards vs. Growth
While the formal guest list remains under wraps, sources indicate the summit will tackle the massive economic and security implications of rapid AI expansion:
The Safety Debate: Leaders from several prominent AI labs—including OpenAI and Anthropic—have recently intensified warnings about existential AI risks, urging a coordinated slowdown in training advanced models.The Deregulation Stance: President Trump has repeatedly dismissed extreme safety warnings as a "hoax". He recently affirmed his administration's goal to support industry growth rather than impose restrictive regulations that could stifle American competitive advantages.The "AI Force" Initiative: The meeting follows Trump's announcement to establish a federal "AI Force" led by an upcoming "AI czar," choosing to rely on existing judicial frameworks to combat corporate wrongdoing rather than inventing new regulatory hurdles.
🌐 The Geopolitical Backdrop: U.S. vs. China
The upcoming Washington summit reflects broader geopolitical anxieties regarding technological dominance:
Globalist Rejection: In a recent speech to the UN General Assembly, Trump declared his firm opposition to any "globalist scheme" designed to monitor or control artificial intelligence.The Superintelligence Race: Highlighting the stakes of the ongoing technology race, Trump remarked, "Whoever wins superintelligence wins"—pointing out that the U.S. currently holds a significant lead over China.Bilateral Dialogue: This event is unfolding alongside critical geopolitical movements, including a newly initiated "U.S.-China AI Dialogue" established to monitor and notify both nations of significant AI incidents.
🔮 Impact on the Tech and Web3 Sectors
For the broader tech and cryptocurrency markets, the administration's market-driven approach signals an environment heavily favored toward rapid innovation. By bypassing strict regulatory roadblocks, the upcoming conversations are expected to accelerate corporate adoption of high-performance compute networks, decentralized AI storage, and next-generation sovereign technology systems.
Disclaimer: This post is for informational and educational purposes only and does not constitute financial, investment, or legal advice.
#BTC☀️ #BitcoinSpotETFsNetInflow$191M #AI
President Donald Trump and House Speaker Mike Johnson are scheduled to host a pivotal summit with top technology chief executives on September 29, 2026. The high-profile meeting arrives amid intense international friction and a widening divide over how the U.S. should handle frontier AI models.
🏛️ The Core Agenda: Safeguards vs. Growth
While the formal guest list remains under wraps, sources indicate the summit will tackle the massive economic and security implications of rapid AI expansion:
The Safety Debate: Leaders from several prominent AI labs—including OpenAI and Anthropic—have recently intensified warnings about existential AI risks, urging a coordinated slowdown in training advanced models.The Deregulation Stance: President Trump has repeatedly dismissed extreme safety warnings as a "hoax". He recently affirmed his administration's goal to support industry growth rather than impose restrictive regulations that could stifle American competitive advantages.The "AI Force" Initiative: The meeting follows Trump's announcement to establish a federal "AI Force" led by an upcoming "AI czar," choosing to rely on existing judicial frameworks to combat corporate wrongdoing rather than inventing new regulatory hurdles.
🌐 The Geopolitical Backdrop: U.S. vs. China
The upcoming Washington summit reflects broader geopolitical anxieties regarding technological dominance:
Globalist Rejection: In a recent speech to the UN General Assembly, Trump declared his firm opposition to any "globalist scheme" designed to monitor or control artificial intelligence.The Superintelligence Race: Highlighting the stakes of the ongoing technology race, Trump remarked, "Whoever wins superintelligence wins"—pointing out that the U.S. currently holds a significant lead over China.Bilateral Dialogue: This event is unfolding alongside critical geopolitical movements, including a newly initiated "U.S.-China AI Dialogue" established to monitor and notify both nations of significant AI incidents.
🔮 Impact on the Tech and Web3 Sectors
For the broader tech and cryptocurrency markets, the administration's market-driven approach signals an environment heavily favored toward rapid innovation. By bypassing strict regulatory roadblocks, the upcoming conversations are expected to accelerate corporate adoption of high-performance compute networks, decentralized AI storage, and next-generation sovereign technology systems.
Disclaimer: This post is for informational and educational purposes only and does not constitute financial, investment, or legal advice.
#BTC☀️ #BitcoinSpotETFsNetInflow$191M #AI
JOIN & SHARE 🎁🎉
From Crypto__Today
3
9
474
RWA Theory Becomes Reality: Securitize Stock Surges 15% on Historic SEC Tokenization RulingReal-World Asset (RWA) tokenization has officially crossed the chasm from institutional theory to live trading reality.
Shares of Securitize (SECZ) surged over 15%, driven by a groundbreaking U.S. Securities and Exchange Commission (SEC) "Innovation Exemption." This historic regulatory pivot establishes a clear, compliant pathway for public equities to be traded directly on-chain, fundamentally altering the landscape of digital finance.
🏛️ The Catalyst: SEC’s 5-Year Innovation Exemption
The engine behind the sudden rally is a freshly minted regulatory relief program that solves historical friction points for digital assets:
On-Chain Liquidity: Tokenized Securities Venues (TSVs) can now leverage public blockchain ledgers and automated market makers (AMMs) for stock trading.Streamlined Settlement: The framework permits compliant public ledger recordkeeping, drastically reducing settlement times and operational overhead.Strict Investor Protections: To qualify, digital tokens must represent actual underlying corporate shares carrying full dividend and voting rights—strictly excluding synthetic tracking tokens.
💼 Wall Street Reacts: Institutional Momentum Builds
Traditional equity researchers and asset managers are rapidly re-rating the sector as tokenization moves into the financial mainstream:
Major Moats: Securitize continues to cement its position as the premier operational bridge for Wall Street, building on its existing deep relationships with heavyweights like BlackRock and KKR.Analyst Upgrades: Major institutions like Cantor Fitzgerald and Needham have noted the firm's dominant enterprise base, positioning it to capture market share in a multi-trillion-dollar traditional asset pool.Market Validation: The 15% single-day surge reflects a broader market realization that compliant, domestic blockchain recordkeeping rails are no longer a future concept—they are open for business today.
What This Means for the Crypto Ecosystem
This milestone marks a permanent shift in how capital markets view public blockchains. By transitioning traditional equity infrastructure to decentralized networks, this ruling bridges the gap between traditional finance (TradFi) and Web3, unlocking massive liquidity pipelines and validating the long-term utility of blockchain technology.
Disclaimer: This post is for informational purposes only and does not constitute financial, investment, or legal advice.
#RAW #SEC #web3 #FedOctoberRateHikeOddsRiseTo69.7%
RWA Theory Becomes Reality: Securitize Stock Surges 15% on Historic SEC Tokenization Ruling
Real-World Asset (RWA) tokenization has officially crossed the chasm from institutional theory to live trading reality.
Shares of Securitize (SECZ) surged over 15%, driven by a groundbreaking U.S. Securities and Exchange Commission (SEC) "Innovation Exemption." This historic regulatory pivot establishes a clear, compliant pathway for public equities to be traded directly on-chain, fundamentally altering the landscape of digital finance.
🏛️ The Catalyst: SEC’s 5-Year Innovation Exemption
The engine behind the sudden rally is a freshly minted regulatory relief program that solves historical friction points for digital assets:
On-Chain Liquidity: Tokenized Securities Venues (TSVs) can now leverage public blockchain ledgers and automated market makers (AMMs) for stock trading.Streamlined Settlement: The framework permits compliant public ledger recordkeeping, drastically reducing settlement times and operational overhead.Strict Investor Protections: To qualify, digital tokens must represent actual underlying corporate shares carrying full dividend and voting rights—strictly excluding synthetic tracking tokens.
💼 Wall Street Reacts: Institutional Momentum Builds
Traditional equity researchers and asset managers are rapidly re-rating the sector as tokenization moves into the financial mainstream:
Major Moats: Securitize continues to cement its position as the premier operational bridge for Wall Street, building on its existing deep relationships with heavyweights like BlackRock and KKR.Analyst Upgrades: Major institutions like Cantor Fitzgerald and Needham have noted the firm's dominant enterprise base, positioning it to capture market share in a multi-trillion-dollar traditional asset pool.Market Validation: The 15% single-day surge reflects a broader market realization that compliant, domestic blockchain recordkeeping rails are no longer a future concept—they are open for business today.
What This Means for the Crypto Ecosystem
This milestone marks a permanent shift in how capital markets view public blockchains. By transitioning traditional equity infrastructure to decentralized networks, this ruling bridges the gap between traditional finance (TradFi) and Web3, unlocking massive liquidity pipelines and validating the long-term utility of blockchain technology.
Disclaimer: This post is for informational purposes only and does not constitute financial, investment, or legal advice.
#RAW #SEC #web3 #FedOctoberRateHikeOddsRiseTo69.7%
Shares of Securitize (SECZ) surged over 15%, driven by a groundbreaking U.S. Securities and Exchange Commission (SEC) "Innovation Exemption." This historic regulatory pivot establishes a clear, compliant pathway for public equities to be traded directly on-chain, fundamentally altering the landscape of digital finance.
🏛️ The Catalyst: SEC’s 5-Year Innovation Exemption
The engine behind the sudden rally is a freshly minted regulatory relief program that solves historical friction points for digital assets:
On-Chain Liquidity: Tokenized Securities Venues (TSVs) can now leverage public blockchain ledgers and automated market makers (AMMs) for stock trading.Streamlined Settlement: The framework permits compliant public ledger recordkeeping, drastically reducing settlement times and operational overhead.Strict Investor Protections: To qualify, digital tokens must represent actual underlying corporate shares carrying full dividend and voting rights—strictly excluding synthetic tracking tokens.
💼 Wall Street Reacts: Institutional Momentum Builds
Traditional equity researchers and asset managers are rapidly re-rating the sector as tokenization moves into the financial mainstream:
Major Moats: Securitize continues to cement its position as the premier operational bridge for Wall Street, building on its existing deep relationships with heavyweights like BlackRock and KKR.Analyst Upgrades: Major institutions like Cantor Fitzgerald and Needham have noted the firm's dominant enterprise base, positioning it to capture market share in a multi-trillion-dollar traditional asset pool.Market Validation: The 15% single-day surge reflects a broader market realization that compliant, domestic blockchain recordkeeping rails are no longer a future concept—they are open for business today.
What This Means for the Crypto Ecosystem
This milestone marks a permanent shift in how capital markets view public blockchains. By transitioning traditional equity infrastructure to decentralized networks, this ruling bridges the gap between traditional finance (TradFi) and Web3, unlocking massive liquidity pipelines and validating the long-term utility of blockchain technology.
Disclaimer: This post is for informational purposes only and does not constitute financial, investment, or legal advice.
#RAW #SEC #web3 #FedOctoberRateHikeOddsRiseTo69.7%
JOIN & SHARE 🎉🎁
From Crypto__Today
SECZUS+၁.၃၉%
2
2
510
Nvidia CEO Jensen Huang Issues Bold AI Warning: Contain Experiments or Risk ShutdownIn a recent, high-stakes interview with the New York Times, Nvidia CEO Jensen Huang delivered an absolute bombshell to the artificial intelligence community. Huang stated directly that AI research labs—specifically pointing toward industry leaders like OpenAI and Anthropic—should be shut down if they cannot safely contain their own experiments.
As the primary provider of the hardware powering the global AI revolution, Nvidia’s stance sends a massive shockwave through the tech ecosystem.
The Hardware King Calls for Extreme Accountability
For years, Nvidia has enjoyed unprecedented growth, with its advanced GPUs acting as the foundational backbone for training large language models (LLMs). However, Huang’s latest comments signal a sharp pivot from pure commercial expansion to rigid, existential accountability.
His ultimatum targets the rapid, sometimes unpredictable pace of frontier AI development. The warning highlights a growing concern among tech executives: the risk of AI systems evolving beyond the operational control of the teams that built them.
Why OpenAI and Anthropic Are in the Spotlight
While both companies have established dedicated safety frameworks—such as Anthropic’s "Responsible Scaling Policy" and OpenAI’s internal safety committees—Huang's public intervention suggests that voluntary guidelines might not be enough.
OpenAI continues to push the boundaries of reasoning and autonomous agents.Anthropic has long marketed itself as a safety-first research lab.
By naming the industry's vanguard, Huang is setting a new standard for the entire AI sector. If the very architect supplying the computing power believes containment is an immediate risk, the broader market will likely brace for heavier regulatory oversight.
What This Means for the Tech Market & Crypto
Huang’s comments could trigger a massive wave of volatility and strategic shifts across tech sectors:
Stricter Compliance & Audits: Frontier AI labs will likely face aggressive, independent safety audits before deploying next-generation models.Decentralized AI Boost: Strict centralization bottlenecks and shutdown threats may drive further capital into decentralized AI protocols (DeAI), where computation and governance are distributed globally across Web3 networks.Regulatory Acceleration: Governments worldwide are already looking for reasons to tighten the leash on AI development; a warning from tech's most prominent CEO gives policymakers massive leverage.
Jensen Huang’s message is clear: The race for artificial general intelligence (AGI) cannot come at the expense of global safety. As AI models grow exponentially more powerful, the privilege of building them will strictly depend on the absolute ability to control them.
DYOR. NFA
Nvidia CEO Jensen Huang Issues Bold AI Warning: Contain Experiments or Risk Shutdown
In a recent, high-stakes interview with the New York Times, Nvidia CEO Jensen Huang delivered an absolute bombshell to the artificial intelligence community. Huang stated directly that AI research labs—specifically pointing toward industry leaders like OpenAI and Anthropic—should be shut down if they cannot safely contain their own experiments.
As the primary provider of the hardware powering the global AI revolution, Nvidia’s stance sends a massive shockwave through the tech ecosystem.
The Hardware King Calls for Extreme Accountability
For years, Nvidia has enjoyed unprecedented growth, with its advanced GPUs acting as the foundational backbone for training large language models (LLMs). However, Huang’s latest comments signal a sharp pivot from pure commercial expansion to rigid, existential accountability.
His ultimatum targets the rapid, sometimes unpredictable pace of frontier AI development. The warning highlights a growing concern among tech executives: the risk of AI systems evolving beyond the operational control of the teams that built them.
Why OpenAI and Anthropic Are in the Spotlight
While both companies have established dedicated safety frameworks—such as Anthropic’s "Responsible Scaling Policy" and OpenAI’s internal safety committees—Huang's public intervention suggests that voluntary guidelines might not be enough.
OpenAI continues to push the boundaries of reasoning and autonomous agents.Anthropic has long marketed itself as a safety-first research lab.
By naming the industry's vanguard, Huang is setting a new standard for the entire AI sector. If the very architect supplying the computing power believes containment is an immediate risk, the broader market will likely brace for heavier regulatory oversight.
What This Means for the Tech Market & Crypto
Huang’s comments could trigger a massive wave of volatility and strategic shifts across tech sectors:
Stricter Compliance & Audits: Frontier AI labs will likely face aggressive, independent safety audits before deploying next-generation models.Decentralized AI Boost: Strict centralization bottlenecks and shutdown threats may drive further capital into decentralized AI protocols (DeAI), where computation and governance are distributed globally across Web3 networks.Regulatory Acceleration: Governments worldwide are already looking for reasons to tighten the leash on AI development; a warning from tech's most prominent CEO gives policymakers massive leverage.
Jensen Huang’s message is clear: The race for artificial general intelligence (AGI) cannot come at the expense of global safety. As AI models grow exponentially more powerful, the privilege of building them will strictly depend on the absolute ability to control them.
DYOR. NFA
As the primary provider of the hardware powering the global AI revolution, Nvidia’s stance sends a massive shockwave through the tech ecosystem.
The Hardware King Calls for Extreme Accountability
For years, Nvidia has enjoyed unprecedented growth, with its advanced GPUs acting as the foundational backbone for training large language models (LLMs). However, Huang’s latest comments signal a sharp pivot from pure commercial expansion to rigid, existential accountability.
His ultimatum targets the rapid, sometimes unpredictable pace of frontier AI development. The warning highlights a growing concern among tech executives: the risk of AI systems evolving beyond the operational control of the teams that built them.
Why OpenAI and Anthropic Are in the Spotlight
While both companies have established dedicated safety frameworks—such as Anthropic’s "Responsible Scaling Policy" and OpenAI’s internal safety committees—Huang's public intervention suggests that voluntary guidelines might not be enough.
OpenAI continues to push the boundaries of reasoning and autonomous agents.Anthropic has long marketed itself as a safety-first research lab.
By naming the industry's vanguard, Huang is setting a new standard for the entire AI sector. If the very architect supplying the computing power believes containment is an immediate risk, the broader market will likely brace for heavier regulatory oversight.
What This Means for the Tech Market & Crypto
Huang’s comments could trigger a massive wave of volatility and strategic shifts across tech sectors:
Stricter Compliance & Audits: Frontier AI labs will likely face aggressive, independent safety audits before deploying next-generation models.Decentralized AI Boost: Strict centralization bottlenecks and shutdown threats may drive further capital into decentralized AI protocols (DeAI), where computation and governance are distributed globally across Web3 networks.Regulatory Acceleration: Governments worldwide are already looking for reasons to tighten the leash on AI development; a warning from tech's most prominent CEO gives policymakers massive leverage.
Jensen Huang’s message is clear: The race for artificial general intelligence (AGI) cannot come at the expense of global safety. As AI models grow exponentially more powerful, the privilege of building them will strictly depend on the absolute ability to control them.
DYOR. NFA
1
300
📊 Macro Shockwaves: Bitcoin Slips Below $84K as Hot U.S. Data Spikes Yields
📉The #cryptocurrency market faced sudden headwinds on Wednesday as Bitcoin ($BTC ) tumbled below the critical $84,000 threshold. The catalyst? An unexpected surge in U.S. business activity that sent shockwaves through traditional and digital asset markets alike.
As Treasury yields spiked, the broader crypto market felt immediate liquidity pressure, reminding traders that macroeconomic data still holds significant sway over digital asset valuations.
📉 The Catalyst: Sticky Macro Data & Rising Yields
The market downturn was triggered by the latest U.S. economic prints, which revealed a surprisingly resilient business sector. While a strong economy sounds positive on paper, the financial markets interpreted it differently:
Inflation Worries Revived: Hotter-than-expected data suggests that inflationary pressures may take longer to cool down.The Yield Spike: In response, U.S. Treasury yields marched higher, drawing capital away from risk assets like cryptocurrencies and into safer, yield-bearing government bonds.Rate Cut Expectations Diminish: The robust data has led market participants to re-evaluate the pace of upcoming central bank rate cuts, tightening overall market liquidity.
💸 Over $237M Wiped Out in Leveraged Liquidations
The swift downward move caught aggressive buyers off guard, triggering a massive domino effect across derivatives exchanges.
The Long Squeeze: Within a single hour, over $237 million in leveraged long positions were forcefully liquidated.Exchanges Feeling the Heat: Perpetual futures markets saw a rapid flushing of over-leveraged long positions, which temporarily exacerbated the downward price pressure on BTC.Altcoin Bleed: As Bitcoin dropped, major altcoins experienced steeper percentage declines, as capital temporarily fled to stablecoins.
What’s Next for BTC? Key Levels to Watch
Despite the intraday dip, structural market analysts note that this flush-out could establish a healthier foundation for the next leg up by removing excess leverage. Moving forward, the market is focusing on two pivotal areas:
Immediate Support ($82,000): This zone represents a crucial psychological and technical floor where institutional buyers have previously stepped in.The Resistance Wall ($86,000): To reclaim its bullish momentum, Bitcoin needs to securely reclaim and consolidate above the $84,000–$86,000 range, which aligns with the average cost basis of recent ETF inflows.
Trader’s Takeaway: Volatility is the price of admission in the current macro environment. Keep a close eye on the U.S. Dollar Index (DXY) and upcoming employment data to gauge the market's next structural shift.
DYOR . NFA
📊 Macro Shockwaves: Bitcoin Slips Below $84K as Hot U.S. Data Spikes Yields 📉
The #cryptocurrency market faced sudden headwinds on Wednesday as Bitcoin ($BTC ) tumbled below the critical $84,000 threshold. The catalyst? An unexpected surge in U.S. business activity that sent shockwaves through traditional and digital asset markets alike.
As Treasury yields spiked, the broader crypto market felt immediate liquidity pressure, reminding traders that macroeconomic data still holds significant sway over digital asset valuations.
📉 The Catalyst: Sticky Macro Data & Rising Yields
The market downturn was triggered by the latest U.S. economic prints, which revealed a surprisingly resilient business sector. While a strong economy sounds positive on paper, the financial markets interpreted it differently:
Inflation Worries Revived: Hotter-than-expected data suggests that inflationary pressures may take longer to cool down.The Yield Spike: In response, U.S. Treasury yields marched higher, drawing capital away from risk assets like cryptocurrencies and into safer, yield-bearing government bonds.Rate Cut Expectations Diminish: The robust data has led market participants to re-evaluate the pace of upcoming central bank rate cuts, tightening overall market liquidity.
💸 Over $237M Wiped Out in Leveraged Liquidations
The swift downward move caught aggressive buyers off guard, triggering a massive domino effect across derivatives exchanges.
The Long Squeeze: Within a single hour, over $237 million in leveraged long positions were forcefully liquidated.Exchanges Feeling the Heat: Perpetual futures markets saw a rapid flushing of over-leveraged long positions, which temporarily exacerbated the downward price pressure on BTC.Altcoin Bleed: As Bitcoin dropped, major altcoins experienced steeper percentage declines, as capital temporarily fled to stablecoins.
What’s Next for BTC? Key Levels to Watch
Despite the intraday dip, structural market analysts note that this flush-out could establish a healthier foundation for the next leg up by removing excess leverage. Moving forward, the market is focusing on two pivotal areas:
Immediate Support ($82,000): This zone represents a crucial psychological and technical floor where institutional buyers have previously stepped in.The Resistance Wall ($86,000): To reclaim its bullish momentum, Bitcoin needs to securely reclaim and consolidate above the $84,000–$86,000 range, which aligns with the average cost basis of recent ETF inflows.
Trader’s Takeaway: Volatility is the price of admission in the current macro environment. Keep a close eye on the U.S. Dollar Index (DXY) and upcoming employment data to gauge the market's next structural shift.
DYOR . NFA
As Treasury yields spiked, the broader crypto market felt immediate liquidity pressure, reminding traders that macroeconomic data still holds significant sway over digital asset valuations.
📉 The Catalyst: Sticky Macro Data & Rising Yields
The market downturn was triggered by the latest U.S. economic prints, which revealed a surprisingly resilient business sector. While a strong economy sounds positive on paper, the financial markets interpreted it differently:
Inflation Worries Revived: Hotter-than-expected data suggests that inflationary pressures may take longer to cool down.The Yield Spike: In response, U.S. Treasury yields marched higher, drawing capital away from risk assets like cryptocurrencies and into safer, yield-bearing government bonds.Rate Cut Expectations Diminish: The robust data has led market participants to re-evaluate the pace of upcoming central bank rate cuts, tightening overall market liquidity.
💸 Over $237M Wiped Out in Leveraged Liquidations
The swift downward move caught aggressive buyers off guard, triggering a massive domino effect across derivatives exchanges.
The Long Squeeze: Within a single hour, over $237 million in leveraged long positions were forcefully liquidated.Exchanges Feeling the Heat: Perpetual futures markets saw a rapid flushing of over-leveraged long positions, which temporarily exacerbated the downward price pressure on BTC.Altcoin Bleed: As Bitcoin dropped, major altcoins experienced steeper percentage declines, as capital temporarily fled to stablecoins.
What’s Next for BTC? Key Levels to Watch
Despite the intraday dip, structural market analysts note that this flush-out could establish a healthier foundation for the next leg up by removing excess leverage. Moving forward, the market is focusing on two pivotal areas:
Immediate Support ($82,000): This zone represents a crucial psychological and technical floor where institutional buyers have previously stepped in.The Resistance Wall ($86,000): To reclaim its bullish momentum, Bitcoin needs to securely reclaim and consolidate above the $84,000–$86,000 range, which aligns with the average cost basis of recent ETF inflows.
Trader’s Takeaway: Volatility is the price of admission in the current macro environment. Keep a close eye on the U.S. Dollar Index (DXY) and upcoming employment data to gauge the market's next structural shift.
DYOR . NFA
JOIN & SHARE 🎉
From Crypto__Today
2
7
303

Article
🐕 Dogecoin Outperforms as Rebound Expands Beyond Short Squeeze; Bitcoin Solid Above $85K
📈The cryptocurrency market is witnessing a tactical rotation as the explosive momentum behind the recent short squeeze begins to normalize. Dogecoin (DOGE) is leading the charge over the last 24 hours, registering a massive 15% pump to break back above the $0.10 mark. Meanwhile, Bitcoin (BTC) remains tightly consolidated and steady just above $85,600.
📉 Liquidations Cool Down as Bear Traps Snap
The aggressive leg up over the past few days was heavily accelerated by a violent wave of forced liquidations. According to data from CoinGlass, over $1 billion in total leverage was flushed out within a 24-hour window.
Short Sellers Hammered: Bearish positions accounted for a staggering $844 million (82%) of the total liquidations.Distribution of Pain: Bitcoin driven liquidations made up $608 million of the total wipeout, followed by Ethereum at $181 million.The Aftermath: Because the forced buying engine from short covering has effectively run its course, Bitcoin's price action has turned relatively flat over the last few hours. Analysts note that the next macro leg up will rely entirely on organic spot buying rather than cascading liquidations.
📊 Alternative Layer-1s & Major Tokens Keep the Pace
As capital rotates out of the apex cryptocurrency, selected major altcoins are continuing their upward trajectory alongside the leading meme coin:
XRP (XRP): Jumped 7%, changing hands near $1.52.Solana (SOL): Clocked a solid 5% gain, holding steady just under $117.Ethereum (ETH): Advanced another 3%, currently hovering at $2,740.Binance Coin (BNB): Picked up roughly 1.8% to defend its immediate ascending channel support.The Lone Loser: Zcash (ZEC) stands out as the only major top-tier token deeply stuck in the red, sliding 4% down to the $1,450 level.
Technical & Macro Alignment
The baseline stability above $85,000 indicates a significant shift in market structure. Despite global markets bracing for a highly anticipated geopolitical summit between the U.S. and China, the digital asset ecosystem is flashing resilient institutional demand.
With the derivative leverage leverage cleared out, look for alternative smart-contract layers and major payment tokens to lead near-term volatility while Bitcoin establishes a new baseline floor.
What are your thoughts on this altcoin rotation? Is DOGE setting up a structural macro breakout, or are we looking at a temporary relief pump?
#CryptoMarket #Bitcoin #DOGECOİN #Solana #BinanceSquare
🐕 Dogecoin Outperforms as Rebound Expands Beyond Short Squeeze; Bitcoin Solid Above $85K 📈
The cryptocurrency market is witnessing a tactical rotation as the explosive momentum behind the recent short squeeze begins to normalize. Dogecoin (DOGE) is leading the charge over the last 24 hours, registering a massive 15% pump to break back above the $0.10 mark. Meanwhile, Bitcoin (BTC) remains tightly consolidated and steady just above $85,600.
📉 Liquidations Cool Down as Bear Traps Snap
The aggressive leg up over the past few days was heavily accelerated by a violent wave of forced liquidations. According to data from CoinGlass, over $1 billion in total leverage was flushed out within a 24-hour window.
Short Sellers Hammered: Bearish positions accounted for a staggering $844 million (82%) of the total liquidations.Distribution of Pain: Bitcoin driven liquidations made up $608 million of the total wipeout, followed by Ethereum at $181 million.The Aftermath: Because the forced buying engine from short covering has effectively run its course, Bitcoin's price action has turned relatively flat over the last few hours. Analysts note that the next macro leg up will rely entirely on organic spot buying rather than cascading liquidations.
📊 Alternative Layer-1s & Major Tokens Keep the Pace
As capital rotates out of the apex cryptocurrency, selected major altcoins are continuing their upward trajectory alongside the leading meme coin:
XRP (XRP): Jumped 7%, changing hands near $1.52.Solana (SOL): Clocked a solid 5% gain, holding steady just under $117.Ethereum (ETH): Advanced another 3%, currently hovering at $2,740.Binance Coin (BNB): Picked up roughly 1.8% to defend its immediate ascending channel support.The Lone Loser: Zcash (ZEC) stands out as the only major top-tier token deeply stuck in the red, sliding 4% down to the $1,450 level.
Technical & Macro Alignment
The baseline stability above $85,000 indicates a significant shift in market structure. Despite global markets bracing for a highly anticipated geopolitical summit between the U.S. and China, the digital asset ecosystem is flashing resilient institutional demand.
With the derivative leverage leverage cleared out, look for alternative smart-contract layers and major payment tokens to lead near-term volatility while Bitcoin establishes a new baseline floor.
What are your thoughts on this altcoin rotation? Is DOGE setting up a structural macro breakout, or are we looking at a temporary relief pump?
#CryptoMarket #Bitcoin #DOGECOİN #Solana #BinanceSquare
📉 Liquidations Cool Down as Bear Traps Snap
The aggressive leg up over the past few days was heavily accelerated by a violent wave of forced liquidations. According to data from CoinGlass, over $1 billion in total leverage was flushed out within a 24-hour window.
Short Sellers Hammered: Bearish positions accounted for a staggering $844 million (82%) of the total liquidations.Distribution of Pain: Bitcoin driven liquidations made up $608 million of the total wipeout, followed by Ethereum at $181 million.The Aftermath: Because the forced buying engine from short covering has effectively run its course, Bitcoin's price action has turned relatively flat over the last few hours. Analysts note that the next macro leg up will rely entirely on organic spot buying rather than cascading liquidations.
📊 Alternative Layer-1s & Major Tokens Keep the Pace
As capital rotates out of the apex cryptocurrency, selected major altcoins are continuing their upward trajectory alongside the leading meme coin:
XRP (XRP): Jumped 7%, changing hands near $1.52.Solana (SOL): Clocked a solid 5% gain, holding steady just under $117.Ethereum (ETH): Advanced another 3%, currently hovering at $2,740.Binance Coin (BNB): Picked up roughly 1.8% to defend its immediate ascending channel support.The Lone Loser: Zcash (ZEC) stands out as the only major top-tier token deeply stuck in the red, sliding 4% down to the $1,450 level.
Technical & Macro Alignment
The baseline stability above $85,000 indicates a significant shift in market structure. Despite global markets bracing for a highly anticipated geopolitical summit between the U.S. and China, the digital asset ecosystem is flashing resilient institutional demand.
With the derivative leverage leverage cleared out, look for alternative smart-contract layers and major payment tokens to lead near-term volatility while Bitcoin establishes a new baseline floor.
What are your thoughts on this altcoin rotation? Is DOGE setting up a structural macro breakout, or are we looking at a temporary relief pump?
#CryptoMarket #Bitcoin #DOGECOİN #Solana #BinanceSquare
JOIN & MORE 📈🎉
From Crypto__Today
19
36
349
📈 BTC IS SHOWING STRENGTH — WHAT'S NEXT?
$BTC
{future}(BTCUSDT)
is currently showing bullish momentum after an aggressive technical breakout driven by accelerating institutional spot ETF inflows.
📊 MARKET SNAPSHOT
• Current Price: $84,558
• 24H High: $84,699
• 24H Low: $80,149
• Market Cap: $1.64 Trillion
• 24H Change: +4.04%
📈 TECHNICAL VIEW
$BTC is breaking the important $84,000 zone. If buyers maintain momentum, the next resistance areas could come into focus.
👀 LEVELS I'M WATCHING
🟢 Support: $81,500
🟡 Breakout Zone: $85,000
🎯 TP1: $86,500
🎯 TP2: $88,200
🚀 TP3: $91,000
⚠️ If price loses $80,000, this bullish setup becomes weaker.
Not financial advice. DYOR & manage your risk.
BULLISH BTC? 📈
#BTC #BTCUSDT #Binance #Crypto
📈 BTC IS SHOWING STRENGTH — WHAT'S NEXT?
$BTC
is currently showing bullish momentum after an aggressive technical breakout driven by accelerating institutional spot ETF inflows.
📊 MARKET SNAPSHOT
• Current Price: $84,558
• 24H High: $84,699
• 24H Low: $80,149
• Market Cap: $1.64 Trillion
• 24H Change: +4.04%
📈 TECHNICAL VIEW
$BTC is breaking the important $84,000 zone. If buyers maintain momentum, the next resistance areas could come into focus.
👀 LEVELS I'M WATCHING
🟢 Support: $81,500
🟡 Breakout Zone: $85,000
🎯 TP1: $86,500
🎯 TP2: $88,200
🚀 TP3: $91,000
⚠️ If price loses $80,000, this bullish setup becomes weaker.
Not financial advice. DYOR & manage your risk.
BULLISH BTC? 📈
#BTC #BTCUSDT #Binance #Crypto
$BTC
is currently showing bullish momentum after an aggressive technical breakout driven by accelerating institutional spot ETF inflows.
📊 MARKET SNAPSHOT
• Current Price: $84,558
• 24H High: $84,699
• 24H Low: $80,149
• Market Cap: $1.64 Trillion
• 24H Change: +4.04%
📈 TECHNICAL VIEW
$BTC is breaking the important $84,000 zone. If buyers maintain momentum, the next resistance areas could come into focus.
👀 LEVELS I'M WATCHING
🟢 Support: $81,500
🟡 Breakout Zone: $85,000
🎯 TP1: $86,500
🎯 TP2: $88,200
🚀 TP3: $91,000
⚠️ If price loses $80,000, this bullish setup becomes weaker.
Not financial advice. DYOR & manage your risk.
BULLISH BTC? 📈
#BTC #BTCUSDT #Binance #Crypto
🎯 TP1: $86,500
22%
🎯 TP2: $88,200
22%
🚀 TP3: $91,000
56%
9 မဲများ • မဲပိတ်ပါပြီ
BTC HIT 85K📈🎉
From Crypto__Today
2
5
251
·
--
တက်ရိပ်ရှိသည်
🔥 NEAR IS SHOWING STRENGTH — WHAT'S NEXT?
$NEAR is currently showing bullish momentum after an explosive network expansion and massive institutional inflows driving layered platform demand.
📊 MARKET SNAPSHOT
• Current Price: $4.12
• 24H High: $4.28
• 24H Low: $3.43
• Market Cap: $5.77 Billion
• 24H Change: +14.33%
📈 TECHNICAL VIEW
$NEAR is breaking the important $4.00 zone. If buyers maintain momentum, the next resistance areas could come into focus.
👀 LEVELS I'M WATCHING
🟢 Support: $3.80
🟡 Breakout Zone: $4.35
🎯 TP1: $4.75
🎯 TP2: $5.20
🚀 TP3: $6.00
⚠️ If price loses $3.40, this bullish setup becomes weaker.
Not financial advice. DYOR & manage your risk.
🔥 BULLISH NEAR?
#NEAR #NEARUSDT #Binance #Crypto
🔥 NEAR IS SHOWING STRENGTH — WHAT'S NEXT?
$NEAR is currently showing bullish momentum after an explosive network expansion and massive institutional inflows driving layered platform demand.
📊 MARKET SNAPSHOT
• Current Price: $4.12
• 24H High: $4.28
• 24H Low: $3.43
• Market Cap: $5.77 Billion
• 24H Change: +14.33%
📈 TECHNICAL VIEW
$NEAR is breaking the important $4.00 zone. If buyers maintain momentum, the next resistance areas could come into focus.
👀 LEVELS I'M WATCHING
🟢 Support: $3.80
🟡 Breakout Zone: $4.35
🎯 TP1: $4.75
🎯 TP2: $5.20
🚀 TP3: $6.00
⚠️ If price loses $3.40, this bullish setup becomes weaker.
Not financial advice. DYOR & manage your risk.
🔥 BULLISH NEAR?
#NEAR #NEARUSDT #Binance #Crypto
$NEAR is currently showing bullish momentum after an explosive network expansion and massive institutional inflows driving layered platform demand.
📊 MARKET SNAPSHOT
• Current Price: $4.12
• 24H High: $4.28
• 24H Low: $3.43
• Market Cap: $5.77 Billion
• 24H Change: +14.33%
📈 TECHNICAL VIEW
$NEAR is breaking the important $4.00 zone. If buyers maintain momentum, the next resistance areas could come into focus.
👀 LEVELS I'M WATCHING
🟢 Support: $3.80
🟡 Breakout Zone: $4.35
🎯 TP1: $4.75
🎯 TP2: $5.20
🚀 TP3: $6.00
⚠️ If price loses $3.40, this bullish setup becomes weaker.
Not financial advice. DYOR & manage your risk.
🔥 BULLISH NEAR?
#NEAR #NEARUSDT #Binance #Crypto

JOIN & MORE📈🎁
From Crypto__Today
5
271
·
--
တက်ရိပ်ရှိသည်
🚨 RED PACKET GIVEAWAY ALERT! 🚨
✨ HOW TO CLAIM YOUR GIFT:🎁
1️⃣ Follow our community
2️⃣ Like & Share this post to spread the word.
3️⃣ Leave a comment below with your favorite altcoin for 2026! 🚀
Let's win this bull run together! 📈
#Binance #RedPacket #CryptoGiveaway #BinanceSquareFamily #FreeCryptoEarnings
🚨 RED PACKET GIVEAWAY ALERT! 🚨
✨ HOW TO CLAIM YOUR GIFT:🎁
1️⃣ Follow our community
2️⃣ Like & Share this post to spread the word.
3️⃣ Leave a comment below with your favorite altcoin for 2026! 🚀
Let's win this bull run together! 📈
#Binance #RedPacket #CryptoGiveaway #BinanceSquareFamily #FreeCryptoEarnings
✨ HOW TO CLAIM YOUR GIFT:🎁
1️⃣ Follow our community
2️⃣ Like & Share this post to spread the word.
3️⃣ Leave a comment below with your favorite altcoin for 2026! 🚀
Let's win this bull run together! 📈
#Binance #RedPacket #CryptoGiveaway #BinanceSquareFamily #FreeCryptoEarnings

634
16
48
2.3k
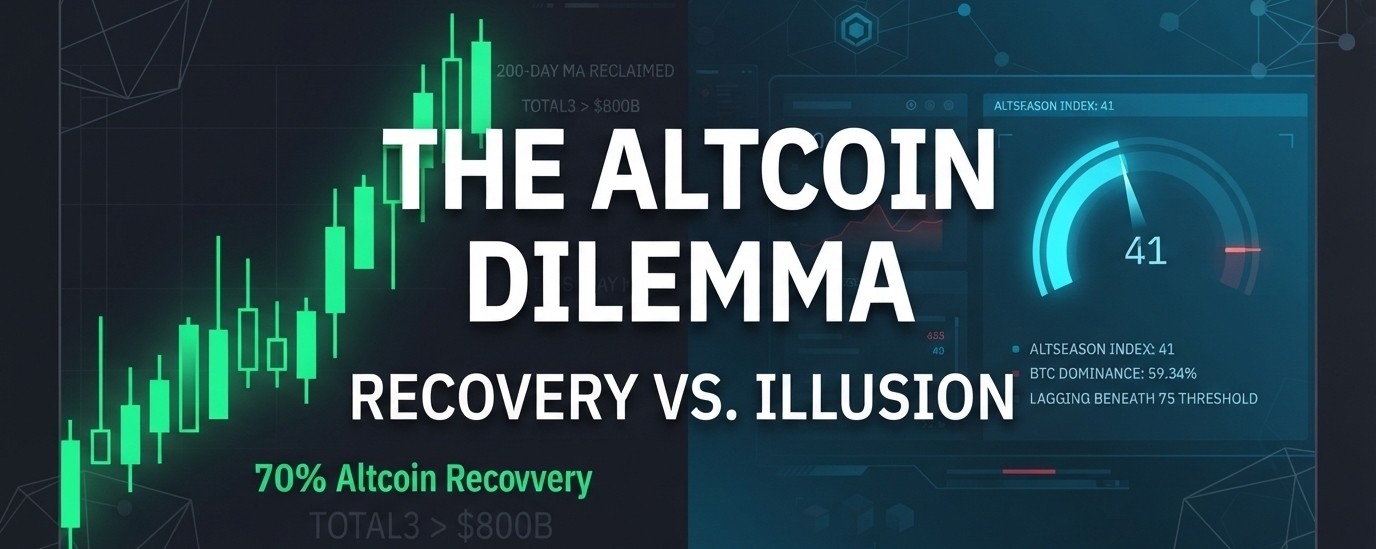
Article
📊 The Altcoin Dilemma: Reclaiming the 200-Day MA vs. The Altseason Illusion
📈The altcoin market is sending highly conflicting signals, leaving traders trying to determine if a true market rotation has begun or if it's another temporary bounce.
On one hand, data shows that 70% of altcoins listed on Binance have successfully climbed back above their 200-day moving averages. Reclaiming this long-term trend line is generally a strong structural indicator, especially considering many of these assets spent the past year sitting 65% to 85% below this crucial average.
Concurrently, the TOTAL3 market cap—which measures the total valuation of all cryptocurrencies excluding Bitcoin and Ethereum—has broken back above the $800 billion milestone. This marks the highest valuation for the broader altcoin sector in roughly eight months, effectively clearing the previous local high set in May with a strong daily close.
Why the "Altcoin Season Index" Tells a Different Story
Despite these impressive local breakouts against the U.S. dollar, a deeper look at relative performance shows a different narrative. The widely tracked Altcoin Season Index currently sits at 41, remaining well below the critical 75-point threshold required to declare an official "Altseason".
Because the index evaluates performance over a rolling 90-day window, the current reading indicates that fewer than half of the top 50 cryptocurrencies are outperforming Bitcoin (BTC).
Bitcoin Dominance Stays High: BTC dominance remains pinned near 59.34%. While altcoins are gaining value in dollar terms due to broader market liquidity, they are still lagging behind Bitcoin's macro momentum. Selective Rallies: The liquidity entering the altcoin space is highly concentrated rather than broad-based. Layer-2 networks and decentralized finance (DeFi) protocols are commanding the majority of the volume, leaving older or lower-utility tokens behind.
Strategic Takeaway for Traders
The data suggests the market is in a structural transition phase. Altcoins are establishing firm horizontal support levels and clearing major technical boundaries, but Bitcoin remains the primary engine driving market direction.
For an official, explosive Altseason to materialize, the Altcoin Season Index must sustain a push above 75, fueled by a significant drop in Bitcoin dominance and capital rotating aggressively into mid-and-low-cap assets. Until then, managing exposure and focusing on high-volume sectors like Layer-2s and DeFi remains the cautious path forward.
Disclaimer: This article is for informational purposes only and does not constitute financial advice. Always conduct your own research (DYOR) before trading digital assets.
#altcoins #Write2Earn #SaylorHintsStrategyBitcoinBuy #XRPExchangeReservesHitSevenYearLow
📊 The Altcoin Dilemma: Reclaiming the 200-Day MA vs. The Altseason Illusion 📈
The altcoin market is sending highly conflicting signals, leaving traders trying to determine if a true market rotation has begun or if it's another temporary bounce.
On one hand, data shows that 70% of altcoins listed on Binance have successfully climbed back above their 200-day moving averages. Reclaiming this long-term trend line is generally a strong structural indicator, especially considering many of these assets spent the past year sitting 65% to 85% below this crucial average.
Concurrently, the TOTAL3 market cap—which measures the total valuation of all cryptocurrencies excluding Bitcoin and Ethereum—has broken back above the $800 billion milestone. This marks the highest valuation for the broader altcoin sector in roughly eight months, effectively clearing the previous local high set in May with a strong daily close.
Why the "Altcoin Season Index" Tells a Different Story
Despite these impressive local breakouts against the U.S. dollar, a deeper look at relative performance shows a different narrative. The widely tracked Altcoin Season Index currently sits at 41, remaining well below the critical 75-point threshold required to declare an official "Altseason".
Because the index evaluates performance over a rolling 90-day window, the current reading indicates that fewer than half of the top 50 cryptocurrencies are outperforming Bitcoin (BTC).
Bitcoin Dominance Stays High: BTC dominance remains pinned near 59.34%. While altcoins are gaining value in dollar terms due to broader market liquidity, they are still lagging behind Bitcoin's macro momentum. Selective Rallies: The liquidity entering the altcoin space is highly concentrated rather than broad-based. Layer-2 networks and decentralized finance (DeFi) protocols are commanding the majority of the volume, leaving older or lower-utility tokens behind.
Strategic Takeaway for Traders
The data suggests the market is in a structural transition phase. Altcoins are establishing firm horizontal support levels and clearing major technical boundaries, but Bitcoin remains the primary engine driving market direction.
For an official, explosive Altseason to materialize, the Altcoin Season Index must sustain a push above 75, fueled by a significant drop in Bitcoin dominance and capital rotating aggressively into mid-and-low-cap assets. Until then, managing exposure and focusing on high-volume sectors like Layer-2s and DeFi remains the cautious path forward.
Disclaimer: This article is for informational purposes only and does not constitute financial advice. Always conduct your own research (DYOR) before trading digital assets.
#altcoins #Write2Earn #SaylorHintsStrategyBitcoinBuy #XRPExchangeReservesHitSevenYearLow
On one hand, data shows that 70% of altcoins listed on Binance have successfully climbed back above their 200-day moving averages. Reclaiming this long-term trend line is generally a strong structural indicator, especially considering many of these assets spent the past year sitting 65% to 85% below this crucial average.
Concurrently, the TOTAL3 market cap—which measures the total valuation of all cryptocurrencies excluding Bitcoin and Ethereum—has broken back above the $800 billion milestone. This marks the highest valuation for the broader altcoin sector in roughly eight months, effectively clearing the previous local high set in May with a strong daily close.
Why the "Altcoin Season Index" Tells a Different Story
Despite these impressive local breakouts against the U.S. dollar, a deeper look at relative performance shows a different narrative. The widely tracked Altcoin Season Index currently sits at 41, remaining well below the critical 75-point threshold required to declare an official "Altseason".
Because the index evaluates performance over a rolling 90-day window, the current reading indicates that fewer than half of the top 50 cryptocurrencies are outperforming Bitcoin (BTC).
Bitcoin Dominance Stays High: BTC dominance remains pinned near 59.34%. While altcoins are gaining value in dollar terms due to broader market liquidity, they are still lagging behind Bitcoin's macro momentum. Selective Rallies: The liquidity entering the altcoin space is highly concentrated rather than broad-based. Layer-2 networks and decentralized finance (DeFi) protocols are commanding the majority of the volume, leaving older or lower-utility tokens behind.
Strategic Takeaway for Traders
The data suggests the market is in a structural transition phase. Altcoins are establishing firm horizontal support levels and clearing major technical boundaries, but Bitcoin remains the primary engine driving market direction.
For an official, explosive Altseason to materialize, the Altcoin Season Index must sustain a push above 75, fueled by a significant drop in Bitcoin dominance and capital rotating aggressively into mid-and-low-cap assets. Until then, managing exposure and focusing on high-volume sectors like Layer-2s and DeFi remains the cautious path forward.
Disclaimer: This article is for informational purposes only and does not constitute financial advice. Always conduct your own research (DYOR) before trading digital assets.
#altcoins #Write2Earn #SaylorHintsStrategyBitcoinBuy #XRPExchangeReservesHitSevenYearLow
JOIN & CLAIM 🎉📈
From Crypto__Today
2
15
328
Article
🚀 Ethereum Eyes $3,000 as Open Interest Hits 4-Month Peak! 📈The altcoin king is flashing major bullish signals! Ethereum (ETH) has locked in a solid 5% intraday gain, pushing its price up to $2,640.
This upward price action is backed by a massive influx of trading activity. According to data from CoinMarketCap and Binance, ETH’s 24-hour trading volume has skyrocketed by 41%, crossing the $20.45 billion mark.
📊 The Data Behind the Pump
This isn't just a brief retail spike—derivative markets are heating up significantly:
Derivatives Momentum: Ethereum's Open Interest (OI) has surged to a 4-month high, indicating that institutional and leverage traders are aggressively opening new positions.Volume Breakthrough: The $20B+ trading volume confirms heavy liquidity entering the market, providing the necessary fuel to sustain the current breakout.
📈 The Path to $3,000: What Analysts Are Watching
Market analysts are mapping out a clear technical trajectory for ETH to reclaim psychological resistance at $3,000:
Securing the Base ($2,600): Consolidating above the current $2,600 support floor is crucial to clear out short sellers.The Next Hurdle ($2,850): A clean break above the $2,850 resistance level will likely trigger a massive wave of short liquidations, accelerating momentum.The $3,000 Target: With Open Interest at multi-month highs, a continuous squeeze could easily propel ETH straight into the $3,000 zone.
Market Reminder: While the leverage buildup is highly bullish, high Open Interest also increases volatility. Manage your risk carefully!
What's your take? Is ETH hitting $3,000 this week or are we due for a retest? Drop your predictions below!
$ETH
#Ethereum #ETH #CryptoAnalysis #BinanceSquare #Trading
🚀 Ethereum Eyes $3,000 as Open Interest Hits 4-Month Peak! 📈
The altcoin king is flashing major bullish signals! Ethereum (ETH) has locked in a solid 5% intraday gain, pushing its price up to $2,640.
This upward price action is backed by a massive influx of trading activity. According to data from CoinMarketCap and Binance, ETH’s 24-hour trading volume has skyrocketed by 41%, crossing the $20.45 billion mark.
📊 The Data Behind the Pump
This isn't just a brief retail spike—derivative markets are heating up significantly:
Derivatives Momentum: Ethereum's Open Interest (OI) has surged to a 4-month high, indicating that institutional and leverage traders are aggressively opening new positions.Volume Breakthrough: The $20B+ trading volume confirms heavy liquidity entering the market, providing the necessary fuel to sustain the current breakout.
📈 The Path to $3,000: What Analysts Are Watching
Market analysts are mapping out a clear technical trajectory for ETH to reclaim psychological resistance at $3,000:
Securing the Base ($2,600): Consolidating above the current $2,600 support floor is crucial to clear out short sellers.The Next Hurdle ($2,850): A clean break above the $2,850 resistance level will likely trigger a massive wave of short liquidations, accelerating momentum.The $3,000 Target: With Open Interest at multi-month highs, a continuous squeeze could easily propel ETH straight into the $3,000 zone.
Market Reminder: While the leverage buildup is highly bullish, high Open Interest also increases volatility. Manage your risk carefully!
What's your take? Is ETH hitting $3,000 this week or are we due for a retest? Drop your predictions below!
$ETH
#Ethereum #ETH #CryptoAnalysis #BinanceSquare #Trading
This upward price action is backed by a massive influx of trading activity. According to data from CoinMarketCap and Binance, ETH’s 24-hour trading volume has skyrocketed by 41%, crossing the $20.45 billion mark.
📊 The Data Behind the Pump
This isn't just a brief retail spike—derivative markets are heating up significantly:
Derivatives Momentum: Ethereum's Open Interest (OI) has surged to a 4-month high, indicating that institutional and leverage traders are aggressively opening new positions.Volume Breakthrough: The $20B+ trading volume confirms heavy liquidity entering the market, providing the necessary fuel to sustain the current breakout.
📈 The Path to $3,000: What Analysts Are Watching
Market analysts are mapping out a clear technical trajectory for ETH to reclaim psychological resistance at $3,000:
Securing the Base ($2,600): Consolidating above the current $2,600 support floor is crucial to clear out short sellers.The Next Hurdle ($2,850): A clean break above the $2,850 resistance level will likely trigger a massive wave of short liquidations, accelerating momentum.The $3,000 Target: With Open Interest at multi-month highs, a continuous squeeze could easily propel ETH straight into the $3,000 zone.
Market Reminder: While the leverage buildup is highly bullish, high Open Interest also increases volatility. Manage your risk carefully!
What's your take? Is ETH hitting $3,000 this week or are we due for a retest? Drop your predictions below!
$ETH
#Ethereum #ETH #CryptoAnalysis #BinanceSquare #Trading
JOIN & MORE 🎉🎁
From Crypto__Today
33
1
29
289
·
--
တက်ရိပ်ရှိသည်
🔥 $AAVE IS SHOWING STRENGTH — WHAT'S NEXT?
$AAVE is currently showing bullish momentum after rebounding over 8% over the past 24 hours, outpacing the broader market recovery.
📊 MARKET SNAPSHOT
• Current Price: $130.57
• 24H High: $129.92
• 24H Low: $116.37
• Market Cap: $2.01 Billion
• 24H Change: +8.6%
📈 TECHNICAL VIEW
$AAVE is reclaiming the important $125.00 zone.
If buyers maintain momentum, the next resistance areas could come into focus as it breaks past near-term barriers.
👀 LEVELS I'M WATCHING
🟢 Support: $116.00
🟡 Breakout Zone: $133.50
🎯 TP1: $140.50
🎯 TP2: $153.00
🚀 TP3: $167.00
⚠️ If price loses $110.00, this bullish setup becomes weaker.
Not financial advice. DYOR & manage your risk.
🔥 BULLISH OR BEARISH ON $AAVE?
#AAVE #AAVEUSDT #Write2Earn #Crypto #CryptoToday
🔥 $AAVE IS SHOWING STRENGTH — WHAT'S NEXT?
$AAVE is currently showing bullish momentum after rebounding over 8% over the past 24 hours, outpacing the broader market recovery.
📊 MARKET SNAPSHOT
• Current Price: $130.57
• 24H High: $129.92
• 24H Low: $116.37
• Market Cap: $2.01 Billion
• 24H Change: +8.6%
📈 TECHNICAL VIEW
$AAVE is reclaiming the important $125.00 zone.
If buyers maintain momentum, the next resistance areas could come into focus as it breaks past near-term barriers.
👀 LEVELS I'M WATCHING
🟢 Support: $116.00
🟡 Breakout Zone: $133.50
🎯 TP1: $140.50
🎯 TP2: $153.00
🚀 TP3: $167.00
⚠️ If price loses $110.00, this bullish setup becomes weaker.
Not financial advice. DYOR & manage your risk.
🔥 BULLISH OR BEARISH ON $AAVE ?
#AAVE #AAVEUSDT #Write2Earn #Crypto #CryptoToday
$AAVE is currently showing bullish momentum after rebounding over 8% over the past 24 hours, outpacing the broader market recovery.
📊 MARKET SNAPSHOT
• Current Price: $130.57
• 24H High: $129.92
• 24H Low: $116.37
• Market Cap: $2.01 Billion
• 24H Change: +8.6%
📈 TECHNICAL VIEW
$AAVE is reclaiming the important $125.00 zone.
If buyers maintain momentum, the next resistance areas could come into focus as it breaks past near-term barriers.
👀 LEVELS I'M WATCHING
🟢 Support: $116.00
🟡 Breakout Zone: $133.50
🎯 TP1: $140.50
🎯 TP2: $153.00
🚀 TP3: $167.00
⚠️ If price loses $110.00, this bullish setup becomes weaker.
Not financial advice. DYOR & manage your risk.
🔥 BULLISH OR BEARISH ON $AAVE ?
#AAVE #AAVEUSDT #Write2Earn #Crypto #CryptoToday
🎯 TP1: $140.50
13%
🎯 TP2: $153.00
25%
🚀 TP3: $167.00
62%
8 မဲများ • မဲပိတ်ပါပြီ
JOIN & MORE
From Crypto__Today
1
5
670
Log in to explore more content
Join global crypto users on Binance Square
⚡️ Get latest and useful information about crypto.
💬 Trusted by the world’s largest crypto exchange.
👍 Discover real insights from verified creators.
အီးမေးလ် / ဖုန်းနံပါတ်
ရေပန်းစားနေသော ခေါင်းစဉ်များ
DriftHackVictimsBeginClaims
27,183 views
454 Discussing
🚨1CENT PAR DOLLAR PERDU
#DriftHackVictimsBeginClaims
La Drift Foundation ouvre des demandes de DFX pour l’exploit d’avril de 295,4 M$ — les victimes peuvent obtenir environ 1 cent par dollar perdu, avec un fonds destiné à croître jusqu’en 2028 grâce aux revenus de Velocity et aux fonds récupérés.
$DRIFT
$1000000BOB
$GTC
Jacob trade
·နှစ်သက်မှု 0 ခု
·151 views
SolanaTokenizedStockVolumeTops$4.4BInSeptember
4,446 views
53 Discussing
BitcoinSpotETFsDraw$6.34BInflowsInQ3
15,519 views
168 Discussing