

highly skilled
17 ပို့စ်များ

highly skilled
တိုင်ကြားမည်
သုံးစွဲသူကို ဘလော့မည်
baby
Open Trade
29 Days
0 ဖော်လိုလုပ်ထားသည်
0 ဖော်လိုလုပ်သူများ
1 လိုက်ခ်လုပ်ထားသည်
ပို့စ်များ
ပိုင်ဆိုင်မှုစာရင်း
$TRUMP
If you mean Official Trump ($TRUMP), the Solana-based meme coin, here is the current picture for September 27, 2026.
📊 Current market data
Price: about $2.10–$2.14
24h range: approximately $2.08–$2.18
Market cap: about $594M
24h volume: about $313M
Circulating supply: ~281.9M TRUMP
Max supply: ~1B TRUMP
ATH: $75.35 on Jan. 19, 2025
Current price is roughly 97% below its ATH.
📈 Short-term technical levels
LevelZone🔴 Resistance 2$2.30–$2.40🔴 Resistance 1$2.18–$2.25🟡 Current$2.10–$2.14🟢 Support 1$2.00–$2.05🟢 Support 2$1.88–$1.95🔵 Major support$1.75–$1.85
Recent data shows TRUMP moved from about $1.95 on Sept. 17 to $2.14 on Sept. 27, although it also experienced a sharp move around Sept. 23.
🟢 Bullish setup
A clean move above $2.18–$2.25 with strong volume would be important technically.
Potential next areas to monitor:
$2.30 → $2.40 → $2.60
The key confirmation is volume + price holding above resistance, rather than a brief spike.
🔴 Bearish setup
If TRUMP loses $2.00, the next areas I'd monitor are:
$1.95 → $1.88 → $1.75–$1.85
Because TRUMP is a meme coin, downside can accelerate quickly when momentum disappears.
P1/TP2/TP3 based on the current chart. $TRUMP
{spot}(TRUMPUSDT)
$TRUMP
If you mean Official Trump ($TRUMP ), the Solana-based meme coin, here is the current picture for September 27, 2026.
📊 Current market data
Price: about $2.10–$2.14
24h range: approximately $2.08–$2.18
Market cap: about $594M
24h volume: about $313M
Circulating supply: ~281.9M TRUMP
Max supply: ~1B TRUMP
ATH: $75.35 on Jan. 19, 2025
Current price is roughly 97% below its ATH.
📈 Short-term technical levels
LevelZone🔴 Resistance 2$2.30–$2.40🔴 Resistance 1$2.18–$2.25🟡 Current$2.10–$2.14🟢 Support 1$2.00–$2.05🟢 Support 2$1.88–$1.95🔵 Major support$1.75–$1.85
Recent data shows TRUMP moved from about $1.95 on Sept. 17 to $2.14 on Sept. 27, although it also experienced a sharp move around Sept. 23.
🟢 Bullish setup
A clean move above $2.18–$2.25 with strong volume would be important technically.
Potential next areas to monitor:
$2.30 → $2.40 → $2.60
The key confirmation is volume + price holding above resistance, rather than a brief spike.
🔴 Bearish setup
If TRUMP loses $2.00, the next areas I'd monitor are:
$1.95 → $1.88 → $1.75–$1.85
Because TRUMP is a meme coin, downside can accelerate quickly when momentum disappears.
P1/TP2/TP3 based on the current chart. $TRUMP
If you mean Official Trump ($TRUMP ), the Solana-based meme coin, here is the current picture for September 27, 2026.
📊 Current market data
Price: about $2.10–$2.14
24h range: approximately $2.08–$2.18
Market cap: about $594M
24h volume: about $313M
Circulating supply: ~281.9M TRUMP
Max supply: ~1B TRUMP
ATH: $75.35 on Jan. 19, 2025
Current price is roughly 97% below its ATH.
📈 Short-term technical levels
LevelZone🔴 Resistance 2$2.30–$2.40🔴 Resistance 1$2.18–$2.25🟡 Current$2.10–$2.14🟢 Support 1$2.00–$2.05🟢 Support 2$1.88–$1.95🔵 Major support$1.75–$1.85
Recent data shows TRUMP moved from about $1.95 on Sept. 17 to $2.14 on Sept. 27, although it also experienced a sharp move around Sept. 23.
🟢 Bullish setup
A clean move above $2.18–$2.25 with strong volume would be important technically.
Potential next areas to monitor:
$2.30 → $2.40 → $2.60
The key confirmation is volume + price holding above resistance, rather than a brief spike.
🔴 Bearish setup
If TRUMP loses $2.00, the next areas I'd monitor are:
$1.95 → $1.88 → $1.75–$1.85
Because TRUMP is a meme coin, downside can accelerate quickly when momentum disappears.
P1/TP2/TP3 based on the current chart. $TRUMP
228
$KORUB
I’m assuming you mean Koru (KORU), the Solana token at korusolana.com, not the similarly named KORU leveraged ETF. Current data shows KORU around $0.00003106, with only about $11.34K market cap and roughly $4.85 24h volume.
📊 Current technical picture
LevelApprox. priceImportanceResistance 2$0.000034–0.000036Breakout zoneResistance 1$0.00003125–0.000032Immediate resistanceCurrent$0.00003106Current areaSupport 1$0.0000295–0.000030Short-term supportSupport 2$0.000025–0.000026Stronger supportMajor support$0.000021–0.000022Previous lower zone
KORU has recovered from the September low area: CoinGecko's historical data shows approximately $0.0000255 on Sept. 11 and $0.00003104 on Sept. 25, while the Sept. 26 intraday range was roughly $0.00002953–$0.00003125.
🟢 Bullish scenario
If KORU can break and hold above $0.00003125–$0.000032, the next area to watch would be around $0.000034–$0.000036.
A sustained breakout with substantially higher volume would make the move more credible.
🔴 Bearish scenario
If price loses $0.0000295, the chart could retest approximately $0.000026–$0.000025.
Below that, $0.000021–$0.000022 becomes an important area.
KORU currently looks like a very-high-risk micro-cap/speculative token. The short-term structure has improved from the September lows, but the extremely low liquidity makes risk management much more important than the apparent percentage upside.
If you give me your KORU entry price (for example, 0.000028), I can calculate your support, resistance, stop-loss and 3 take-profit levels specifically for your position.$KORUB
{spot}(KORUBUSDT)
$KORUB
I’m assuming you mean Koru (KORU), the Solana token at korusolana.com, not the similarly named KORU leveraged ETF. Current data shows KORU around $0.00003106, with only about $11.34K market cap and roughly $4.85 24h volume.
📊 Current technical picture
LevelApprox. priceImportanceResistance 2$0.000034–0.000036Breakout zoneResistance 1$0.00003125–0.000032Immediate resistanceCurrent$0.00003106Current areaSupport 1$0.0000295–0.000030Short-term supportSupport 2$0.000025–0.000026Stronger supportMajor support$0.000021–0.000022Previous lower zone
KORU has recovered from the September low area: CoinGecko's historical data shows approximately $0.0000255 on Sept. 11 and $0.00003104 on Sept. 25, while the Sept. 26 intraday range was roughly $0.00002953–$0.00003125.
🟢 Bullish scenario
If KORU can break and hold above $0.00003125–$0.000032, the next area to watch would be around $0.000034–$0.000036.
A sustained breakout with substantially higher volume would make the move more credible.
🔴 Bearish scenario
If price loses $0.0000295, the chart could retest approximately $0.000026–$0.000025.
Below that, $0.000021–$0.000022 becomes an important area.
KORU currently looks like a very-high-risk micro-cap/speculative token. The short-term structure has improved from the September lows, but the extremely low liquidity makes risk management much more important than the apparent percentage upside.
If you give me your KORU entry price (for example, 0.000028), I can calculate your support, resistance, stop-loss and 3 take-profit levels specifically for your position.$KORUB
I’m assuming you mean Koru (KORU), the Solana token at korusolana.com, not the similarly named KORU leveraged ETF. Current data shows KORU around $0.00003106, with only about $11.34K market cap and roughly $4.85 24h volume.
📊 Current technical picture
LevelApprox. priceImportanceResistance 2$0.000034–0.000036Breakout zoneResistance 1$0.00003125–0.000032Immediate resistanceCurrent$0.00003106Current areaSupport 1$0.0000295–0.000030Short-term supportSupport 2$0.000025–0.000026Stronger supportMajor support$0.000021–0.000022Previous lower zone
KORU has recovered from the September low area: CoinGecko's historical data shows approximately $0.0000255 on Sept. 11 and $0.00003104 on Sept. 25, while the Sept. 26 intraday range was roughly $0.00002953–$0.00003125.
🟢 Bullish scenario
If KORU can break and hold above $0.00003125–$0.000032, the next area to watch would be around $0.000034–$0.000036.
A sustained breakout with substantially higher volume would make the move more credible.
🔴 Bearish scenario
If price loses $0.0000295, the chart could retest approximately $0.000026–$0.000025.
Below that, $0.000021–$0.000022 becomes an important area.
KORU currently looks like a very-high-risk micro-cap/speculative token. The short-term structure has improved from the September lows, but the extremely low liquidity makes risk management much more important than the apparent percentage upside.
If you give me your KORU entry price (for example, 0.000028), I can calculate your support, resistance, stop-loss and 3 take-profit levels specifically for your position.$KORUB
71
SAGA/USDT — Professional Technical Analysis
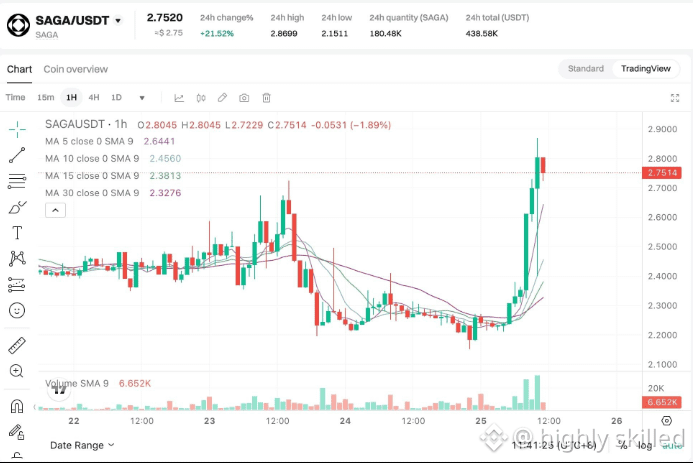
As of 26 September 2026, SAGA is around $0.0341–$0.0348. The important point is that the token has entered an extremely volatile phase: it moved from about $0.025 on Sep. 20 to $0.0753 on Sep. 24, then fell sharply to ~$0.035.
📊 Current structure
LevelSAGA/USDTCurrent area$0.034–0.035Immediate support$0.0315–0.0320Major support$0.027–0.028Resistance 1$0.040–0.041Resistance 2$0.045–0.048Major resistance$0.052–0.055Recent spike high$0.0753
Today's Binance historical data shows a range of $0.0319–$0.0456, with very large volume, confirming substantial intraday volatility.
🔎 My technical read
1. Trend:
Short-term trend is high-risk / corrective after the huge Sep. 24–25 spike. The rejection from ~$0.075 is significant.
2. Bullish confirmation:
A sustained move back above $0.040–$0.041, preferably with strong volume, would improve the short-term structure. A break above $0.048 would be a stronger confirmation.
3. Bearish warning:
If $0.0315–$0.0320 breaks decisively, the next important area is approximately $0.027–$0.028.
4. Fundamental risk:
Bitget officially delisted SAGA/USDT on September 24, including its spot trading pair. SagaEVM also entered a 60-day sunset period on September 24, with shutdown scheduled for November 23, although this applies to the EVM chainlet rather than the main Saga network. Support: ~$0.0320–$0.0340 Resistance: ~$0.0400–$0.0450 Stronger resistance: ~$0.047–$0.050 24h volatility is very high: CoinMarketCap reports a 24h range of about $0.0279–$0.0734
🎯 Trading scenarios
Bullish scenario:
$0.040 → $0.045 → $0.048 → $0.052
Bearish scenario:
$0.032 → $0.028 → $0.024
High-risk zone: $0.032–$0.040 — price can move very quickly in either direction. $SAGA
{spot}(SAGAUSDT)
SAGA/USDT — Professional Technical Analysis
As of 26 September 2026, SAGA is around $0.0341–$0.0348. The important point is that the token has entered an extremely volatile phase: it moved from about $0.025 on Sep. 20 to $0.0753 on Sep. 24, then fell sharply to ~$0.035.
📊 Current structure
LevelSAGA/USDTCurrent area$0.034–0.035Immediate support$0.0315–0.0320Major support$0.027–0.028Resistance 1$0.040–0.041Resistance 2$0.045–0.048Major resistance$0.052–0.055Recent spike high$0.0753
Today's Binance historical data shows a range of $0.0319–$0.0456, with very large volume, confirming substantial intraday volatility.
🔎 My technical read
1. Trend:
Short-term trend is high-risk / corrective after the huge Sep. 24–25 spike. The rejection from ~$0.075 is significant.
2. Bullish confirmation:
A sustained move back above $0.040–$0.041, preferably with strong volume, would improve the short-term structure. A break above $0.048 would be a stronger confirmation.
3. Bearish warning:
If $0.0315–$0.0320 breaks decisively, the next important area is approximately $0.027–$0.028.
4. Fundamental risk:
Bitget officially delisted SAGA/USDT on September 24, including its spot trading pair. SagaEVM also entered a 60-day sunset period on September 24, with shutdown scheduled for November 23, although this applies to the EVM chainlet rather than the main Saga network. Support: ~$0.0320–$0.0340 Resistance: ~$0.0400–$0.0450 Stronger resistance: ~$0.047–$0.050 24h volatility is very high: CoinMarketCap reports a 24h range of about $0.0279–$0.0734
🎯 Trading scenarios
Bullish scenario:
$0.040 → $0.045 → $0.048 → $0.052
Bearish scenario:
$0.032 → $0.028 → $0.024
High-risk zone: $0.032–$0.040 — price can move very quickly in either direction. $SAGA
As of 26 September 2026, SAGA is around $0.0341–$0.0348. The important point is that the token has entered an extremely volatile phase: it moved from about $0.025 on Sep. 20 to $0.0753 on Sep. 24, then fell sharply to ~$0.035.
📊 Current structure
LevelSAGA/USDTCurrent area$0.034–0.035Immediate support$0.0315–0.0320Major support$0.027–0.028Resistance 1$0.040–0.041Resistance 2$0.045–0.048Major resistance$0.052–0.055Recent spike high$0.0753
Today's Binance historical data shows a range of $0.0319–$0.0456, with very large volume, confirming substantial intraday volatility.
🔎 My technical read
1. Trend:
Short-term trend is high-risk / corrective after the huge Sep. 24–25 spike. The rejection from ~$0.075 is significant.
2. Bullish confirmation:
A sustained move back above $0.040–$0.041, preferably with strong volume, would improve the short-term structure. A break above $0.048 would be a stronger confirmation.
3. Bearish warning:
If $0.0315–$0.0320 breaks decisively, the next important area is approximately $0.027–$0.028.
4. Fundamental risk:
Bitget officially delisted SAGA/USDT on September 24, including its spot trading pair. SagaEVM also entered a 60-day sunset period on September 24, with shutdown scheduled for November 23, although this applies to the EVM chainlet rather than the main Saga network. Support: ~$0.0320–$0.0340 Resistance: ~$0.0400–$0.0450 Stronger resistance: ~$0.047–$0.050 24h volatility is very high: CoinMarketCap reports a 24h range of about $0.0279–$0.0734
🎯 Trading scenarios
Bullish scenario:
$0.040 → $0.045 → $0.048 → $0.052
Bearish scenario:
$0.032 → $0.028 → $0.024
High-risk zone: $0.032–$0.040 — price can move very quickly in either direction. $SAGA
343
🟣$ETH
{spot}(ETHUSDT)
Current price: about $2,686. ETH is up roughly 1.1% over 24h and 7.8% over 7 days.
Technical picture:
🟢 Trend: Bullish overall
🟢 Support: $2,630, then $2,560
🔴 Resistance: $2,715–$2,800
🚀 A strong daily close above $2,800 would strengthen the breakout setup.
🎯 A technical target around $3,050 has been identified if the breakout continues.
⚠️ Below $2,560, the bullish structure becomes weaker; below $2,350–$2,360 would be a more significant warning level.
Professional read: ETH is currently in a bullish structure but facing strong resistance around $2.8K. RSI is around 63, so momentum is positive without yet being deeply overbought.
These are technical levels, not a guaranteed price prediction or financial advice.🟣 ETH — Today’s update
Current price: about $2,686. ETH is up roughly 1.1% over 24h and 7.8% over 7 days.
Technical picture:
🟢 Trend: Bullish overall
🟢 Support: $2,630, then $2,560
🔴 Resistance: $2,715–$2,800
🚀 A strong daily close above $2,800 would strengthen the breakout setup.
🟣$ETH
Current price: about $2,686. ETH is up roughly 1.1% over 24h and 7.8% over 7 days.
Technical picture:
🟢 Trend: Bullish overall
🟢 Support: $2,630, then $2,560
🔴 Resistance: $2,715–$2,800
🚀 A strong daily close above $2,800 would strengthen the breakout setup.
🎯 A technical target around $3,050 has been identified if the breakout continues.
⚠️ Below $2,560, the bullish structure becomes weaker; below $2,350–$2,360 would be a more significant warning level.
Professional read: ETH is currently in a bullish structure but facing strong resistance around $2.8K. RSI is around 63, so momentum is positive without yet being deeply overbought.
These are technical levels, not a guaranteed price prediction or financial advice.🟣 ETH — Today’s update
Current price: about $2,686. ETH is up roughly 1.1% over 24h and 7.8% over 7 days.
Technical picture:
🟢 Trend: Bullish overall
🟢 Support: $2,630, then $2,560
🔴 Resistance: $2,715–$2,800
🚀 A strong daily close above $2,800 would strengthen the breakout setup.
Current price: about $2,686. ETH is up roughly 1.1% over 24h and 7.8% over 7 days.
Technical picture:
🟢 Trend: Bullish overall
🟢 Support: $2,630, then $2,560
🔴 Resistance: $2,715–$2,800
🚀 A strong daily close above $2,800 would strengthen the breakout setup.
🎯 A technical target around $3,050 has been identified if the breakout continues.
⚠️ Below $2,560, the bullish structure becomes weaker; below $2,350–$2,360 would be a more significant warning level.
Professional read: ETH is currently in a bullish structure but facing strong resistance around $2.8K. RSI is around 63, so momentum is positive without yet being deeply overbought.
These are technical levels, not a guaranteed price prediction or financial advice.🟣 ETH — Today’s update
Current price: about $2,686. ETH is up roughly 1.1% over 24h and 7.8% over 7 days.
Technical picture:
🟢 Trend: Bullish overall
🟢 Support: $2,630, then $2,560
🔴 Resistance: $2,715–$2,800
🚀 A strong daily close above $2,800 would strengthen the breakout setup.
2
$BTC —
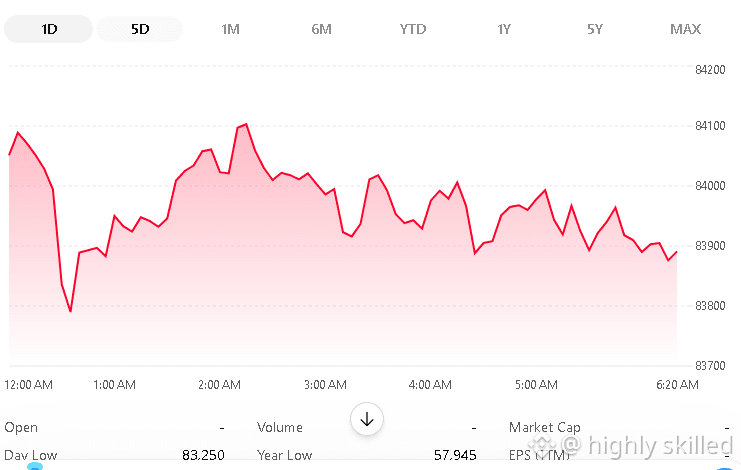
Current zone: ~$84K
Market structure: Bullish on the higher timeframe, but consolidating short-term.
BTC recently rejected around $87K, which is the major near-term resistance.
Daily technical indicators remain broadly positive: BTC is above its 50- and 200-period EMAs, while RSI is around 65, showing strong momentum but approaching an area where a pullback can occur.
U.S. spot BTC ETFs have recently seen strong inflows, supporting demand, although macro pressure from high Treasury yields remains a risk.
Key levels
LevelImportance$87,000🔴 Major resistance$85,000–86,000Resistance / breakout zone$83,000–84,000🟡 Current consolidation$82,600🟢 Important short-term support$79,500–81,000🟢 Stronger support zone
A technical forecast published yesterday identified $82,666 as an important control/support level and $85,044 as the key short-term resistance.
My technical reading
Above $87K: a confirmed breakout would materially improve the short-term structure.
Between $82.6K–$87K: likely range/consolidation; avoid assuming that every move is a breakout.
Below $82.6K: downside pressure increases, with the next areas around $81K and $79.5K becoming important.
So right now, I would describe BTC as bullish overall but not yet confirmed for another breakout. The $87K level is particularly important. $BTC
$BTC —
Current zone: ~$84K
Market structure: Bullish on the higher timeframe, but consolidating short-term.
BTC recently rejected around $87K, which is the major near-term resistance.
Daily technical indicators remain broadly positive: BTC is above its 50- and 200-period EMAs, while RSI is around 65, showing strong momentum but approaching an area where a pullback can occur.
U.S. spot BTC ETFs have recently seen strong inflows, supporting demand, although macro pressure from high Treasury yields remains a risk.
Key levels
LevelImportance$87,000🔴 Major resistance$85,000–86,000Resistance / breakout zone$83,000–84,000🟡 Current consolidation$82,600🟢 Important short-term support$79,500–81,000🟢 Stronger support zone
A technical forecast published yesterday identified $82,666 as an important control/support level and $85,044 as the key short-term resistance.
My technical reading
Above $87K: a confirmed breakout would materially improve the short-term structure.
Between $82.6K–$87K: likely range/consolidation; avoid assuming that every move is a breakout.
Below $82.6K: downside pressure increases, with the next areas around $81K and $79.5K becoming important.
So right now, I would describe BTC as bullish overall but not yet confirmed for another breakout. The $87K level is particularly important. $BTC
Current zone: ~$84K
Market structure: Bullish on the higher timeframe, but consolidating short-term.
BTC recently rejected around $87K, which is the major near-term resistance.
Daily technical indicators remain broadly positive: BTC is above its 50- and 200-period EMAs, while RSI is around 65, showing strong momentum but approaching an area where a pullback can occur.
U.S. spot BTC ETFs have recently seen strong inflows, supporting demand, although macro pressure from high Treasury yields remains a risk.
Key levels
LevelImportance$87,000🔴 Major resistance$85,000–86,000Resistance / breakout zone$83,000–84,000🟡 Current consolidation$82,600🟢 Important short-term support$79,500–81,000🟢 Stronger support zone
A technical forecast published yesterday identified $82,666 as an important control/support level and $85,044 as the key short-term resistance.
My technical reading
Above $87K: a confirmed breakout would materially improve the short-term structure.
Between $82.6K–$87K: likely range/consolidation; avoid assuming that every move is a breakout.
Below $82.6K: downside pressure increases, with the next areas around $81K and $79.5K becoming important.
So right now, I would describe BTC as bullish overall but not yet confirmed for another breakout. The $87K level is particularly important. $BTC
8
Dogecoin (DOGE)
about $0.098. DOGE remains a highly speculative, sentiment-driven cryptocurrency.
Main strength: huge brand recognition, large community, high liquidity, and long market history.
Supply: DOGE has no fixed maximum supply; new coins continue to enter circulation.
Recent activity: large addresses accumulated roughly 240 million DOGE in one reported five-day period, although wallet movements don't necessarily prove bullish intent.
ETF demand: U.S. DOGE ETFs have seen relatively limited net inflows; CoinDesk reported just over $12 million cumulative inflows across three tracked funds over nearly 10 months, and Bitwise announced plans to close its BWOW fund.
Key risk: DOGE's valuation is strongly influenced by market sentiment and speculative demand, while ongoing issuance creates additional supply.
Key levels to watch: recent technical analysis has identified roughly $0.093–$0.094 as support and $0.10 as an important resistance area.
In one line: DOGE can move very quickly when crypto/meme-coin sentiment becomes strong, but its fundamentals and token supply make it substantially more speculative than assets such as BTC or SOL. $DOGE
{spot}(DOGEUSDT)
Dogecoin (DOGE)
about $0.098. DOGE remains a highly speculative, sentiment-driven cryptocurrency.
Main strength: huge brand recognition, large community, high liquidity, and long market history.
Supply: DOGE has no fixed maximum supply; new coins continue to enter circulation.
Recent activity: large addresses accumulated roughly 240 million DOGE in one reported five-day period, although wallet movements don't necessarily prove bullish intent.
ETF demand: U.S. DOGE ETFs have seen relatively limited net inflows; CoinDesk reported just over $12 million cumulative inflows across three tracked funds over nearly 10 months, and Bitwise announced plans to close its BWOW fund.
Key risk: DOGE's valuation is strongly influenced by market sentiment and speculative demand, while ongoing issuance creates additional supply.
Key levels to watch: recent technical analysis has identified roughly $0.093–$0.094 as support and $0.10 as an important resistance area.
In one line: DOGE can move very quickly when crypto/meme-coin sentiment becomes strong, but its fundamentals and token supply make it substantially more speculative than assets such as BTC or SOL. $DOGE
about $0.098. DOGE remains a highly speculative, sentiment-driven cryptocurrency.
Main strength: huge brand recognition, large community, high liquidity, and long market history.
Supply: DOGE has no fixed maximum supply; new coins continue to enter circulation.
Recent activity: large addresses accumulated roughly 240 million DOGE in one reported five-day period, although wallet movements don't necessarily prove bullish intent.
ETF demand: U.S. DOGE ETFs have seen relatively limited net inflows; CoinDesk reported just over $12 million cumulative inflows across three tracked funds over nearly 10 months, and Bitwise announced plans to close its BWOW fund.
Key risk: DOGE's valuation is strongly influenced by market sentiment and speculative demand, while ongoing issuance creates additional supply.
Key levels to watch: recent technical analysis has identified roughly $0.093–$0.094 as support and $0.10 as an important resistance area.
In one line: DOGE can move very quickly when crypto/meme-coin sentiment becomes strong, but its fundamentals and token supply make it substantially more speculative than assets such as BTC or SOL. $DOGE
16
TRON (TRX) — short analysis
Current price: about $0.338.
Main strength: TRON has become a major USDT/stablecoin settlement network. It currently carries more than $94B of USDT, and cumulative network transaction volume recently passed $30T.
Adoption: TRON has more than 405M accounts and over 15B transactions, showing substantial network usage.
Institutional catalyst: The Canary Staked TRX ETF (TRXS) launched in the U.S. in September 2026, providing regulated market exposure to TRX.
Risk: TRX's value is heavily connected to stablecoin activity on TRON, while governance is relatively concentrated. Competition from Ethereum, Solana and other payment/stablecoin networks is another risk.
Tokenomics: TRX has a burn mechanism, but recent TRONSCAN data shows net supply increases on several recent days, so it's better not to assume TRX is automatically deflationary.
In one sentence: TRX has a strong real-world use case around USDT transfers and stablecoin payments, but its price still depends on broader crypto demand and continued network adoption.
If you're comparing TRX vs SOL vs XRP, I can give you a concise fundamental comparison. $TRX
{spot}(TRXUSDT)
TRON (TRX) — short analysis
Current price: about $0.338.
Main strength: TRON has become a major USDT/stablecoin settlement network. It currently carries more than $94B of USDT, and cumulative network transaction volume recently passed $30T.
Adoption: TRON has more than 405M accounts and over 15B transactions, showing substantial network usage.
Institutional catalyst: The Canary Staked TRX ETF (TRXS) launched in the U.S. in September 2026, providing regulated market exposure to TRX.
Risk: TRX's value is heavily connected to stablecoin activity on TRON, while governance is relatively concentrated. Competition from Ethereum, Solana and other payment/stablecoin networks is another risk.
Tokenomics: TRX has a burn mechanism, but recent TRONSCAN data shows net supply increases on several recent days, so it's better not to assume TRX is automatically deflationary.
In one sentence: TRX has a strong real-world use case around USDT transfers and stablecoin payments, but its price still depends on broader crypto demand and continued network adoption.
If you're comparing TRX vs SOL vs XRP, I can give you a concise fundamental comparison. $TRX
Current price: about $0.338.
Main strength: TRON has become a major USDT/stablecoin settlement network. It currently carries more than $94B of USDT, and cumulative network transaction volume recently passed $30T.
Adoption: TRON has more than 405M accounts and over 15B transactions, showing substantial network usage.
Institutional catalyst: The Canary Staked TRX ETF (TRXS) launched in the U.S. in September 2026, providing regulated market exposure to TRX.
Risk: TRX's value is heavily connected to stablecoin activity on TRON, while governance is relatively concentrated. Competition from Ethereum, Solana and other payment/stablecoin networks is another risk.
Tokenomics: TRX has a burn mechanism, but recent TRONSCAN data shows net supply increases on several recent days, so it's better not to assume TRX is automatically deflationary.
In one sentence: TRX has a strong real-world use case around USDT transfers and stablecoin payments, but its price still depends on broader crypto demand and continued network adoption.
If you're comparing TRX vs SOL vs XRP, I can give you a concise fundamental comparison. $TRX
7
Solana (SOL) —
SOL is a high-beta Layer-1 crypto asset: unlike USDT/USDC, its value depends heavily on Solana network adoption, activity, and overall crypto-market demand.
Current price: around $117 on Sept. 25–26, 2026.
Network activity: Solana recently surpassed 5 billion monthly on-chain transactions, indicating strong usage.
Technology: Solana recently reduced target slot time from 300ms to 250ms, improving update/finality speed, although this change doesn't increase transaction capacity.
Catalyst: The ecosystem is pushing further into payments, stablecoins, tokenized assets and institutional adoption.
Risk: SOL is considerably more volatile than stablecoins, and its price can fall sharply when broader crypto sentiment weakens.
Short-term technical picture: Around $100–$106 is an important support/resistance area cited by recent technical analysis; holding above it would keep the recent recovery structure intact, while losing ~$100 would weaken that setup.
Bottom line: SOL has strong network activity and an expanding ecosystem, but it remains a high-risk/high-volatility asset. It is fundamentally very different from USDT/USDC: you're buying exposure to the growth and economics of the Solana network, not a dollar substitute.
$SOL
{spot}(SOLUSDT)
Solana (SOL) —
SOL is a high-beta Layer-1 crypto asset: unlike USDT/USDC, its value depends heavily on Solana network adoption, activity, and overall crypto-market demand.
Current price: around $117 on Sept. 25–26, 2026.
Network activity: Solana recently surpassed 5 billion monthly on-chain transactions, indicating strong usage.
Technology: Solana recently reduced target slot time from 300ms to 250ms, improving update/finality speed, although this change doesn't increase transaction capacity.
Catalyst: The ecosystem is pushing further into payments, stablecoins, tokenized assets and institutional adoption.
Risk: SOL is considerably more volatile than stablecoins, and its price can fall sharply when broader crypto sentiment weakens.
Short-term technical picture: Around $100–$106 is an important support/resistance area cited by recent technical analysis; holding above it would keep the recent recovery structure intact, while losing ~$100 would weaken that setup.
Bottom line: SOL has strong network activity and an expanding ecosystem, but it remains a high-risk/high-volatility asset. It is fundamentally very different from USDT/USDC: you're buying exposure to the growth and economics of the Solana network, not a dollar substitute.
$SOL
SOL is a high-beta Layer-1 crypto asset: unlike USDT/USDC, its value depends heavily on Solana network adoption, activity, and overall crypto-market demand.
Current price: around $117 on Sept. 25–26, 2026.
Network activity: Solana recently surpassed 5 billion monthly on-chain transactions, indicating strong usage.
Technology: Solana recently reduced target slot time from 300ms to 250ms, improving update/finality speed, although this change doesn't increase transaction capacity.
Catalyst: The ecosystem is pushing further into payments, stablecoins, tokenized assets and institutional adoption.
Risk: SOL is considerably more volatile than stablecoins, and its price can fall sharply when broader crypto sentiment weakens.
Short-term technical picture: Around $100–$106 is an important support/resistance area cited by recent technical analysis; holding above it would keep the recent recovery structure intact, while losing ~$100 would weaken that setup.
Bottom line: SOL has strong network activity and an expanding ecosystem, but it remains a high-risk/high-volatility asset. It is fundamentally very different from USDT/USDC: you're buying exposure to the growth and economics of the Solana network, not a dollar substitute.
$SOL
1
USDC (USD Coin ) USDC is a U.S.-dollar-backed stablecoin issued by Circle Internet Group. Like USDT, its goal is to remain around $1, so you generally shouldn't buy USDC expecting price appreciation.
As of September 21, 2026, Circle reported about $74.6 billion USDC in circulation.
Why USDC is interesting
1. Reserve structure
Circle says USDC is backed 100% by highly liquid cash and cash-equivalent assets. The majority of reserves are held through the Circle Reserve Fund, a government money-market fund that can hold short-term U.S. Treasuries, overnight Treasury repos and cash.
2. Transparency
Circle says it provides weekly reserve disclosures and receives monthly third-party assurance from a Big Four accounting firm. That's an important part of evaluating stablecoin risk.
3. Growing adoption
Circle reported that USDC circulation reached $73.3 billion at the end of Q2 2026, up 19% year-over-year, while Q2 on-chain transaction volume reached $14.8 trillion, up 151% year-over-year.
4. Regulatory position
The U.S. GENIUS Act has established a federal framework for stablecoins. Circle says USDC is designed to meet that framework and emphasizes its regulated issuance and reserve structure.
USDC vs USDT
USDCUSDTTarget$1$1IssuerCircleTetherMain useDollar liquidity/paymentsDollar liquidity/tradingReserve transparencyHighHigh, but different structureU.S. regulatory positioningStrongMore complicatedEcosystem sizeVery largeGenerally largerPrice-growth potentialEssentially noneEssentially noneMain riskCircle/regulatory/banking riskTether/reserve/regulatory risk
The important point
$USDC
{spot}(USDCUSDT)
USDC (USD Coin ) USDC is a U.S.-dollar-backed stablecoin issued by Circle Internet Group. Like USDT, its goal is to remain around $1, so you generally shouldn't buy USDC expecting price appreciation.
As of September 21, 2026, Circle reported about $74.6 billion USDC in circulation.
Why USDC is interesting
1. Reserve structure
Circle says USDC is backed 100% by highly liquid cash and cash-equivalent assets. The majority of reserves are held through the Circle Reserve Fund, a government money-market fund that can hold short-term U.S. Treasuries, overnight Treasury repos and cash.
2. Transparency
Circle says it provides weekly reserve disclosures and receives monthly third-party assurance from a Big Four accounting firm. That's an important part of evaluating stablecoin risk.
3. Growing adoption
Circle reported that USDC circulation reached $73.3 billion at the end of Q2 2026, up 19% year-over-year, while Q2 on-chain transaction volume reached $14.8 trillion, up 151% year-over-year.
4. Regulatory position
The U.S. GENIUS Act has established a federal framework for stablecoins. Circle says USDC is designed to meet that framework and emphasizes its regulated issuance and reserve structure.
USDC vs USDT
USDCUSDTTarget$1$1IssuerCircleTetherMain useDollar liquidity/paymentsDollar liquidity/tradingReserve transparencyHighHigh, but different structureU.S. regulatory positioningStrongMore complicatedEcosystem sizeVery largeGenerally largerPrice-growth potentialEssentially noneEssentially noneMain riskCircle/regulatory/banking riskTether/reserve/regulatory risk
The important point
$USDC
As of September 21, 2026, Circle reported about $74.6 billion USDC in circulation.
Why USDC is interesting
1. Reserve structure
Circle says USDC is backed 100% by highly liquid cash and cash-equivalent assets. The majority of reserves are held through the Circle Reserve Fund, a government money-market fund that can hold short-term U.S. Treasuries, overnight Treasury repos and cash.
2. Transparency
Circle says it provides weekly reserve disclosures and receives monthly third-party assurance from a Big Four accounting firm. That's an important part of evaluating stablecoin risk.
3. Growing adoption
Circle reported that USDC circulation reached $73.3 billion at the end of Q2 2026, up 19% year-over-year, while Q2 on-chain transaction volume reached $14.8 trillion, up 151% year-over-year.
4. Regulatory position
The U.S. GENIUS Act has established a federal framework for stablecoins. Circle says USDC is designed to meet that framework and emphasizes its regulated issuance and reserve structure.
USDC vs USDT
USDCUSDTTarget$1$1IssuerCircleTetherMain useDollar liquidity/paymentsDollar liquidity/tradingReserve transparencyHighHigh, but different structureU.S. regulatory positioningStrongMore complicatedEcosystem sizeVery largeGenerally largerPrice-growth potentialEssentially noneEssentially noneMain riskCircle/regulatory/banking riskTether/reserve/regulatory risk
The important point
$USDC
XRP analysis — September 26, 2026
XRP is currently around $1.55–$1.60. Recent trading has been stronger, with XRP testing the $1.60 resistance after recovering from the ~$1.00 area earlier in the year. FXStreet+1
Key levels
$1.50–$1.53: near-term support
$1.60: major immediate resistance
$1.65–$1.70: next resistance / recent high area
$2.00: major psychological resistance
$1.40: important downside level
$1.30–$1.35: deeper support area
A current technical report says XRP remains constructive above roughly $1.53, while another identifies $1.60 as a significant supply/resistance area. CryptoRank+1
What could move XRP
Positive factors
U.S.-listed spot XRP ETFs have recently recorded several consecutive days of inflows; one report put cumulative inflows at about $53M through Sept. 24. FXStreet
XRP's recovery from ~$1 toward $1.60 has restored bullish momentum.
XRP Ledger development and institutional adoption remain important longer-term factors. CoinDesk
Risks
Failure to break $1.60–$1.70 could result in another consolidation/pullback.
Crypto-wide volatility remains high.
There is an important debate about how much Ripple's business growth translates into actual XRP demand; Ripple CEO Brad Garlinghouse recently said stablecoins can be preferable for some payment use cases. 24/7 Wall St.
Simple chart view
Bullish scenario:
$1.53 → $1.60 → $1.70 → $2.00
Bearish scenario:
$1.53 ❌ → $1.40 → $1.30
The most important thing I'd watch right now is whether XRP can establish a daily close above $1.60 and then challenge $1.70. A rejection around $1.60 would make the $1.50/$1.40 levels more important.
If you want, I can also make you a visual XRP chart showing entry/support/resistance + bullish/bearish zones, similar to the picture you asked about earlier. $XRP
{spot}(XRPUSDT)
XRP analysis — September 26, 2026
XRP is currently around $1.55–$1.60. Recent trading has been stronger, with XRP testing the $1.60 resistance after recovering from the ~$1.00 area earlier in the year. FXStreet+1
Key levels
$1.50–$1.53: near-term support
$1.60: major immediate resistance
$1.65–$1.70: next resistance / recent high area
$2.00: major psychological resistance
$1.40: important downside level
$1.30–$1.35: deeper support area
A current technical report says XRP remains constructive above roughly $1.53, while another identifies $1.60 as a significant supply/resistance area. CryptoRank+1
What could move XRP
Positive factors
U.S.-listed spot XRP ETFs have recently recorded several consecutive days of inflows; one report put cumulative inflows at about $53M through Sept. 24. FXStreet
XRP's recovery from ~$1 toward $1.60 has restored bullish momentum.
XRP Ledger development and institutional adoption remain important longer-term factors. CoinDesk
Risks
Failure to break $1.60–$1.70 could result in another consolidation/pullback.
Crypto-wide volatility remains high.
There is an important debate about how much Ripple's business growth translates into actual XRP demand; Ripple CEO Brad Garlinghouse recently said stablecoins can be preferable for some payment use cases. 24/7 Wall St.
Simple chart view
Bullish scenario:
$1.53 → $1.60 → $1.70 → $2.00
Bearish scenario:
$1.53 ❌ → $1.40 → $1.30
The most important thing I'd watch right now is whether XRP can establish a daily close above $1.60 and then challenge $1.70. A rejection around $1.60 would make the $1.50/$1.40 levels more important.
If you want, I can also make you a visual XRP chart showing entry/support/resistance + bullish/bearish zones, similar to the picture you asked about earlier. $XRP
XRP is currently around $1.55–$1.60. Recent trading has been stronger, with XRP testing the $1.60 resistance after recovering from the ~$1.00 area earlier in the year. FXStreet+1
Key levels
$1.50–$1.53: near-term support
$1.60: major immediate resistance
$1.65–$1.70: next resistance / recent high area
$2.00: major psychological resistance
$1.40: important downside level
$1.30–$1.35: deeper support area
A current technical report says XRP remains constructive above roughly $1.53, while another identifies $1.60 as a significant supply/resistance area. CryptoRank+1
What could move XRP
Positive factors
U.S.-listed spot XRP ETFs have recently recorded several consecutive days of inflows; one report put cumulative inflows at about $53M through Sept. 24. FXStreet
XRP's recovery from ~$1 toward $1.60 has restored bullish momentum.
XRP Ledger development and institutional adoption remain important longer-term factors. CoinDesk
Risks
Failure to break $1.60–$1.70 could result in another consolidation/pullback.
Crypto-wide volatility remains high.
There is an important debate about how much Ripple's business growth translates into actual XRP demand; Ripple CEO Brad Garlinghouse recently said stablecoins can be preferable for some payment use cases. 24/7 Wall St.
Simple chart view
Bullish scenario:
$1.53 → $1.60 → $1.70 → $2.00
Bearish scenario:
$1.53 ❌ → $1.40 → $1.30
The most important thing I'd watch right now is whether XRP can establish a daily close above $1.60 and then challenge $1.70. A rejection around $1.60 would make the $1.50/$1.40 levels more important.
If you want, I can also make you a visual XRP chart showing entry/support/resistance + bullish/bearish zones, similar to the picture you asked about earlier. $XRP
2
If you mean Official Trump (TRUMP), the Solana-based meme coin:
Current price: about $2.12
24h: about +0.9%
7 days: about +3.2%
30 days: about −18.9%
1 year: about −71.6%
ATH: $82 on Jan. 19, 2025 — so it remains roughly 97.4% below ATH. OKX
Technical picture
At ~$2.12, TRUMP is still a very high-volatility meme asset. The recent 7-day recovery is relatively modest compared with the much larger longer-term decline. I would watch:
$2.00: important psychological support
$2.60–$2.70: near-term resistance zone
$3.00: major psychological level
Above $3, momentum would need to be accompanied by substantially stronger volume to make the move more convincing.
Biggest issue: token unlocks
This is particularly important for TRUMP. The token has a 1 billion maximum supply, with tokens released over time. A scheduled unlock on Oct. 18, 2026 is expected to release about 28.7 million TRUMP, around 2.9% of total supply and approximately 3.8% of current market cap. Tokenomics.com+1
That creates potential supply pressure, although an unlock does not automatically mean the price will fall.
My scenario framework
ScenarioWhat I'd watch BullishHold ~$2 and break $2.60–$2.70 with strong volume NeutralRange between ~$2 and ~$2.60 BearishLose ~$2 and fail to recover it
TRUMP is fundamentally different from BTC/ETH: its valuation is heavily tied to brand, political attention, community sentiment and speculation, rather than network utility. CoinDesk also notes that 80% of the total supply was allocated to Trump-affiliated entities subject to the unlocking schedule. CoinDesk
If you want, I can also do a TRUMP vs BTC vs ETH vs BNB analysis with the current price, market cap, support/resistance and possible 2026 scenarios side-by-side. $TRUMP
{spot}(TRUMPUSDT)
If you mean Official Trump (TRUMP), the Solana-based meme coin:
Current price: about $2.12
24h: about +0.9%
7 days: about +3.2%
30 days: about −18.9%
1 year: about −71.6%
ATH: $82 on Jan. 19, 2025 — so it remains roughly 97.4% below ATH. OKX
Technical picture
At ~$2.12, TRUMP is still a very high-volatility meme asset. The recent 7-day recovery is relatively modest compared with the much larger longer-term decline. I would watch:
$2.00: important psychological support
$2.60–$2.70: near-term resistance zone
$3.00: major psychological level
Above $3, momentum would need to be accompanied by substantially stronger volume to make the move more convincing.
Biggest issue: token unlocks
This is particularly important for TRUMP. The token has a 1 billion maximum supply, with tokens released over time. A scheduled unlock on Oct. 18, 2026 is expected to release about 28.7 million TRUMP, around 2.9% of total supply and approximately 3.8% of current market cap. Tokenomics.com+1
That creates potential supply pressure, although an unlock does not automatically mean the price will fall.
My scenario framework
ScenarioWhat I'd watch BullishHold ~$2 and break $2.60–$2.70 with strong volume NeutralRange between ~$2 and ~$2.60 BearishLose ~$2 and fail to recover it
TRUMP is fundamentally different from BTC/ETH: its valuation is heavily tied to brand, political attention, community sentiment and speculation, rather than network utility. CoinDesk also notes that 80% of the total supply was allocated to Trump-affiliated entities subject to the unlocking schedule. CoinDesk
If you want, I can also do a TRUMP vs BTC vs ETH vs BNB analysis with the current price, market cap, support/resistance and possible 2026 scenarios side-by-side. $TRUMP
Current price: about $2.12
24h: about +0.9%
7 days: about +3.2%
30 days: about −18.9%
1 year: about −71.6%
ATH: $82 on Jan. 19, 2025 — so it remains roughly 97.4% below ATH. OKX
Technical picture
At ~$2.12, TRUMP is still a very high-volatility meme asset. The recent 7-day recovery is relatively modest compared with the much larger longer-term decline. I would watch:
$2.00: important psychological support
$2.60–$2.70: near-term resistance zone
$3.00: major psychological level
Above $3, momentum would need to be accompanied by substantially stronger volume to make the move more convincing.
Biggest issue: token unlocks
This is particularly important for TRUMP. The token has a 1 billion maximum supply, with tokens released over time. A scheduled unlock on Oct. 18, 2026 is expected to release about 28.7 million TRUMP, around 2.9% of total supply and approximately 3.8% of current market cap. Tokenomics.com+1
That creates potential supply pressure, although an unlock does not automatically mean the price will fall.
My scenario framework
ScenarioWhat I'd watch BullishHold ~$2 and break $2.60–$2.70 with strong volume NeutralRange between ~$2 and ~$2.60 BearishLose ~$2 and fail to recover it
TRUMP is fundamentally different from BTC/ETH: its valuation is heavily tied to brand, political attention, community sentiment and speculation, rather than network utility. CoinDesk also notes that 80% of the total supply was allocated to Trump-affiliated entities subject to the unlocking schedule. CoinDesk
If you want, I can also do a TRUMP vs BTC vs ETH vs BNB analysis with the current price, market cap, support/resistance and possible 2026 scenarios side-by-side. $TRUMP
290
BTC, ETH, and BNB as of Sept. 26, 2026. Prices vary slightly by exchange; CoinMarketCap currently shows BTC ~$83,988, ETH ~$2,690, and BNB ~$774.5. CoinMarketCap
Current prices: BTC, ETH and BNB
Approximate USD prices from CoinMarketCap on Sept. 26, 2026.
BTCETHBNB
Price
BTC — Bitcoin
Price: ~$83,988
7-day: +3.47% CoinMarketCap
BTC remains the main market driver. Bitcoin dominance is around 58.6%, meaning a large share of crypto capital is still concentrated in BTC. CoinMarketCap
The recent move above $80K has been constructive, but BTC is also approaching an area where previous selling can appear.
Important zones to watch: roughly $80K as psychological/support territory and $85K–$86K as the immediate upside area.
A sustained move above the recent highs would strengthen the upside structure; losing $80K would make the short-term chart more vulnerable.
ETH — Ethereum
Price: ~$2,690
7-day: +2.53% CoinMarketCap
ETH has a particularly interesting setup.
Reuters reported that ETH broke above a technical resistance around $2,661.52 after a major late-August rally. Their technical analysis identified approximately $2,775–$2,825 as an intermediate area and $3,050 as a potential technical target, while noting that falling below roughly $2,560–$2,565 would weaken the setup. Reuters
So I'd watch:
$2,560–2,565: important downside level
$2,775–2,825: next major resistance area
~$3,050: larger technical objective if momentum continues
ETH also recently participated strongly in the broader crypto rally; it gained about 7.3% in the Sept. 18 move. CoinDesk
BNB — BNB
Price: ~$774.5
7-day: +1.76% CoinMarketCap
BNB is behaving somewhat differently from ETH/BTC:
It is still above $700 and has held relatively well.
Its 7-day gain is smaller than BTC and ETH, suggesting somewhat less short-term momentum.
$750–$760 is an area I'd watch for support.
$800 is an obvious psychological resistance level. $BNB
{spot}(BNBUSDT)
$BTC
{spot}(BTCUSDT)
$ETH
{spot}(ETHUSDT)
BTC, ETH, and BNB as of Sept. 26, 2026. Prices vary slightly by exchange; CoinMarketCap currently shows BTC ~$83,988, ETH ~$2,690, and BNB ~$774.5. CoinMarketCap
Current prices: BTC, ETH and BNB
Approximate USD prices from CoinMarketCap on Sept. 26, 2026.
BTCETHBNB
Price
BTC — Bitcoin
Price: ~$83,988
7-day: +3.47% CoinMarketCap
BTC remains the main market driver. Bitcoin dominance is around 58.6%, meaning a large share of crypto capital is still concentrated in BTC. CoinMarketCap
The recent move above $80K has been constructive, but BTC is also approaching an area where previous selling can appear.
Important zones to watch: roughly $80K as psychological/support territory and $85K–$86K as the immediate upside area.
A sustained move above the recent highs would strengthen the upside structure; losing $80K would make the short-term chart more vulnerable.
ETH — Ethereum
Price: ~$2,690
7-day: +2.53% CoinMarketCap
ETH has a particularly interesting setup.
Reuters reported that ETH broke above a technical resistance around $2,661.52 after a major late-August rally. Their technical analysis identified approximately $2,775–$2,825 as an intermediate area and $3,050 as a potential technical target, while noting that falling below roughly $2,560–$2,565 would weaken the setup. Reuters
So I'd watch:
$2,560–2,565: important downside level
$2,775–2,825: next major resistance area
~$3,050: larger technical objective if momentum continues
ETH also recently participated strongly in the broader crypto rally; it gained about 7.3% in the Sept. 18 move. CoinDesk
BNB — BNB
Price: ~$774.5
7-day: +1.76% CoinMarketCap
BNB is behaving somewhat differently from ETH/BTC:
It is still above $700 and has held relatively well.
Its 7-day gain is smaller than BTC and ETH, suggesting somewhat less short-term momentum.
$750–$760 is an area I'd watch for support.
$800 is an obvious psychological resistance level. $BNB
$BTC
$ETH
Current prices: BTC, ETH and BNB
Approximate USD prices from CoinMarketCap on Sept. 26, 2026.
BTCETHBNB
Price
BTC — Bitcoin
Price: ~$83,988
7-day: +3.47% CoinMarketCap
BTC remains the main market driver. Bitcoin dominance is around 58.6%, meaning a large share of crypto capital is still concentrated in BTC. CoinMarketCap
The recent move above $80K has been constructive, but BTC is also approaching an area where previous selling can appear.
Important zones to watch: roughly $80K as psychological/support territory and $85K–$86K as the immediate upside area.
A sustained move above the recent highs would strengthen the upside structure; losing $80K would make the short-term chart more vulnerable.
ETH — Ethereum
Price: ~$2,690
7-day: +2.53% CoinMarketCap
ETH has a particularly interesting setup.
Reuters reported that ETH broke above a technical resistance around $2,661.52 after a major late-August rally. Their technical analysis identified approximately $2,775–$2,825 as an intermediate area and $3,050 as a potential technical target, while noting that falling below roughly $2,560–$2,565 would weaken the setup. Reuters
So I'd watch:
$2,560–2,565: important downside level
$2,775–2,825: next major resistance area
~$3,050: larger technical objective if momentum continues
ETH also recently participated strongly in the broader crypto rally; it gained about 7.3% in the Sept. 18 move. CoinDesk
BNB — BNB
Price: ~$774.5
7-day: +1.76% CoinMarketCap
BNB is behaving somewhat differently from ETH/BTC:
It is still above $700 and has held relatively well.
Its 7-day gain is smaller than BTC and ETH, suggesting somewhat less short-term momentum.
$750–$760 is an area I'd watch for support.
$800 is an obvious psychological resistance level. $BNB
$BTC
$ETH
40
$370,000,000,000 wiped out from the US stock market in just 9 minutes.
Rising bond yields are now putting pressure on the market.
$TSLAB $METAB $AMZNB
{spot}(AMZNBUSDT)
{spot}(METABUSDT)
{spot}(TSLABUSDT)
$370,000,000,000 wiped out from the US stock market in just 9 minutes.
Rising bond yields are now putting pressure on the market.
$TSLAB $METAB $AMZNB
Rising bond yields are now putting pressure on the market.
$TSLAB $METAB $AMZNB
38
$BTC mid-autumn festival go to my girlfriend's house, can I enter the door???
See original
Trade Sharing Leaderboard · No. 1
B
BTCUSDT
Perp
10X
Closed
Realized PNL (USDT)
+3,088,671.39
+169.40%
#PolymarketBankFailureBetsDrawFDICConcern #BlackRockBuildsTokenizedPortfoliosForOndo #BitwiseFilesToListNEARETFOnNYSEArca
$BTC mid-autumn festival go to my girlfriend's house, can I enter the door???
See original
Trade Sharing Leaderboard · No. 1
B
BTCUSDT
Perp
10X
Closed
Realized PNL (USDT)
+3,088,671.39
+169.40%
#PolymarketBankFailureBetsDrawFDICConcern #BlackRockBuildsTokenizedPortfoliosForOndo #BitwiseFilesToListNEARETFOnNYSEArca
See original
Trade Sharing Leaderboard · No. 1
B
BTCUSDT
Perp
10X
Closed
Realized PNL (USDT)
+3,088,671.39
+169.40%
#PolymarketBankFailureBetsDrawFDICConcern #BlackRockBuildsTokenizedPortfoliosForOndo #BitwiseFilesToListNEARETFOnNYSEArca
1
1
253
$BNB
BNB is trading around $772–$776, after pulling back from the September high near $807. Recent data shows BNB rose strongly from roughly $683 at the start of September, but momentum has cooled over the last few sessions. OKX+1
Resistance: $800–$807
Near support: $760–$770
Stronger support: around $735–$740
Market structure: still above early-September levels, but short-term momentum has weakened.
Key catalyst: Binance's ecosystem activity remains relevant; Binance also announced a $100 million investment in Circle on Sept. 22. Reuters
Risk: Regulatory scrutiny remains a factor, with Reuters reporting a U.S. investigation concerning possible sanctions violations by Binance. Binance said it has a zero-tolerance approach to sanctions violations. Reuters
Bottom line: BNB is currently in a pullback/consolidation phase. Holding the $760 area would keep the recent structure intact, while a sustained move above $807 would mark a significant technical development. This is market analysis, not financial advice.
#BNB金铲子挖矿 #QNTRises39%
#BNBToken
$BNB
BNB is trading around $772–$776, after pulling back from the September high near $807. Recent data shows BNB rose strongly from roughly $683 at the start of September, but momentum has cooled over the last few sessions. OKX+1
Resistance: $800–$807
Near support: $760–$770
Stronger support: around $735–$740
Market structure: still above early-September levels, but short-term momentum has weakened.
Key catalyst: Binance's ecosystem activity remains relevant; Binance also announced a $100 million investment in Circle on Sept. 22. Reuters
Risk: Regulatory scrutiny remains a factor, with Reuters reporting a U.S. investigation concerning possible sanctions violations by Binance. Binance said it has a zero-tolerance approach to sanctions violations. Reuters
Bottom line: BNB is currently in a pullback/consolidation phase. Holding the $760 area would keep the recent structure intact, while a sustained move above $807 would mark a significant technical development. This is market analysis, not financial advice.
#BNB金铲子挖矿 #QNTRises39%
#BNBToken
BNB is trading around $772–$776, after pulling back from the September high near $807. Recent data shows BNB rose strongly from roughly $683 at the start of September, but momentum has cooled over the last few sessions. OKX+1
Resistance: $800–$807
Near support: $760–$770
Stronger support: around $735–$740
Market structure: still above early-September levels, but short-term momentum has weakened.
Key catalyst: Binance's ecosystem activity remains relevant; Binance also announced a $100 million investment in Circle on Sept. 22. Reuters
Risk: Regulatory scrutiny remains a factor, with Reuters reporting a U.S. investigation concerning possible sanctions violations by Binance. Binance said it has a zero-tolerance approach to sanctions violations. Reuters
Bottom line: BNB is currently in a pullback/consolidation phase. Holding the $760 area would keep the recent structure intact, while a sustained move above $807 would mark a significant technical development. This is market analysis, not financial advice.
#BNB金铲子挖矿 #QNTRises39%
#BNBToken
1
253
$ETH
$ETH is trading around $2,690, up roughly 0.3% over 24h, with ~$14.8B in daily volume. CoinMarketCap
Trend: Short-term momentum is constructive. Reuters reported ETH broke above the $2,661 resistance area, with technical targets around $3,050 and potentially $3,395–$3,445 if momentum continues. Reuters
Key support: Around $2,626, followed by roughly $2,545. A sustained move below these levels would weaken the current setup. CoinMarketCap
Resistance: $2,775–$2,825 is the next important zone; above that, $3,050 becomes a m
{spot}(ETHUSDT)
ajor technical target.
Institutional demand: U.S. spot ETH ETFs recorded strong inflows recently, including $270M on Sept. 21 and $162.2M on Sept. 22. farside.co.uk+1
Bottom line:'s chart currently has a constructive structure, but $2,775–$2,825 is an important test. Holding above ~$2,626 keeps the recent bullish setup intact; losing that level would increase downside risk.
This is market analysis, not a prediction or investment recommendation.
$ETH #CoinMarketCapCompletesCoinglassAcquisition #SECSaysBuybacksUpgradesDontMakeTokenSecurity #CircleTetherFreezeBitgetHackerWallet
$ETH
$ETH is trading around $2,690, up roughly 0.3% over 24h, with ~$14.8B in daily volume. CoinMarketCap
Trend: Short-term momentum is constructive. Reuters reported ETH broke above the $2,661 resistance area, with technical targets around $3,050 and potentially $3,395–$3,445 if momentum continues. Reuters
Key support: Around $2,626, followed by roughly $2,545. A sustained move below these levels would weaken the current setup. CoinMarketCap
Resistance: $2,775–$2,825 is the next important zone; above that, $3,050 becomes a m
ajor technical target.
Institutional demand: U.S. spot ETH ETFs recorded strong inflows recently, including $270M on Sept. 21 and $162.2M on Sept. 22. farside.co.uk+1
Bottom line:'s chart currently has a constructive structure, but $2,775–$2,825 is an important test. Holding above ~$2,626 keeps the recent bullish setup intact; losing that level would increase downside risk.
This is market analysis, not a prediction or investment recommendation.
$ETH #CoinMarketCapCompletesCoinglassAcquisition #SECSaysBuybacksUpgradesDontMakeTokenSecurity #CircleTetherFreezeBitgetHackerWallet
$ETH is trading around $2,690, up roughly 0.3% over 24h, with ~$14.8B in daily volume. CoinMarketCap
Trend: Short-term momentum is constructive. Reuters reported ETH broke above the $2,661 resistance area, with technical targets around $3,050 and potentially $3,395–$3,445 if momentum continues. Reuters
Key support: Around $2,626, followed by roughly $2,545. A sustained move below these levels would weaken the current setup. CoinMarketCap
Resistance: $2,775–$2,825 is the next important zone; above that, $3,050 becomes a m
ajor technical target.
Institutional demand: U.S. spot ETH ETFs recorded strong inflows recently, including $270M on Sept. 21 and $162.2M on Sept. 22. farside.co.uk+1
Bottom line:'s chart currently has a constructive structure, but $2,775–$2,825 is an important test. Holding above ~$2,626 keeps the recent bullish setup intact; losing that level would increase downside risk.
This is market analysis, not a prediction or investment recommendation.
$ETH #CoinMarketCapCompletesCoinglassAcquisition #SECSaysBuybacksUpgradesDontMakeTokenSecurity #CircleTetherFreezeBitgetHackerWallet
1
260
Log in to explore more content
Join global crypto users on Binance Square
⚡️ Get latest and useful information about crypto.
💬 Trusted by the world’s largest crypto exchange.
👍 Discover real insights from verified creators.
အီးမေးလ် / ဖုန်းနံပါတ်
ရေပန်းစားနေသော ခေါင်းစဉ်များ
BitwiseFilesFinalNEARSpotETFProspectus
10 views
35 Discussing
The #BitwiseFilesFinalNEARSpotETFProspectus discussion has caught my attention.
I’m not jumping to any conclusion yet — I’m simply watching how the market reacts and whether this creates stronger interest around $NEAR
.
For me, the important things to watch are:
📊 Price action
📈 Trading volume
🟢 Key support
🔴 Key resistance
👀 Market reaction
What do you think about the $NEAR setup?
Are you watching it closely, or staying on the sidelines?
👇 Share your view in the comments.
★Follow me for simple crypto chart analysis, market setups & daily watchlists. 📈
#NEAR #Crypto #BinanceSquare #CryptoAnalysis #Altcoins#BitwiseFilesFinalNEARSpotETFProspectus
Aisha nooruddin
·နှစ်သက်မှု 0 ခု
·16 views
BitgetHackerMoves$83MStolenXRP
7,164 views
69 Discussing
SOLSpotETFWeeklyInflow$188M
3,039 views
59 Discussing