

Aisha nooruddin
244 ပို့စ်များ

Aisha nooruddin
တိုင်ကြားမည်
သုံးစွဲသူကို ဘလော့မည်
Pro Crypto Analyst | Technical Analysis, Decision Zones & Market Setups | Empowering Traders with Data-Driven Alpha
အမှန်တကယ်ရောင်းဝယ်နေ
Frequent Trader
2.2 Months
42 ဖော်လိုလုပ်ထားသည်
26 ဖော်လိုလုပ်သူများ
192 လိုက်ခ်လုပ်ထားသည်
ပို့စ်များ
ပိုင်ဆိုင်မှုစာရင်း
ဘာသာပြန်ဆိုချက် ကြည့်မည်
$POWR
{spot}(POWRUSDT)
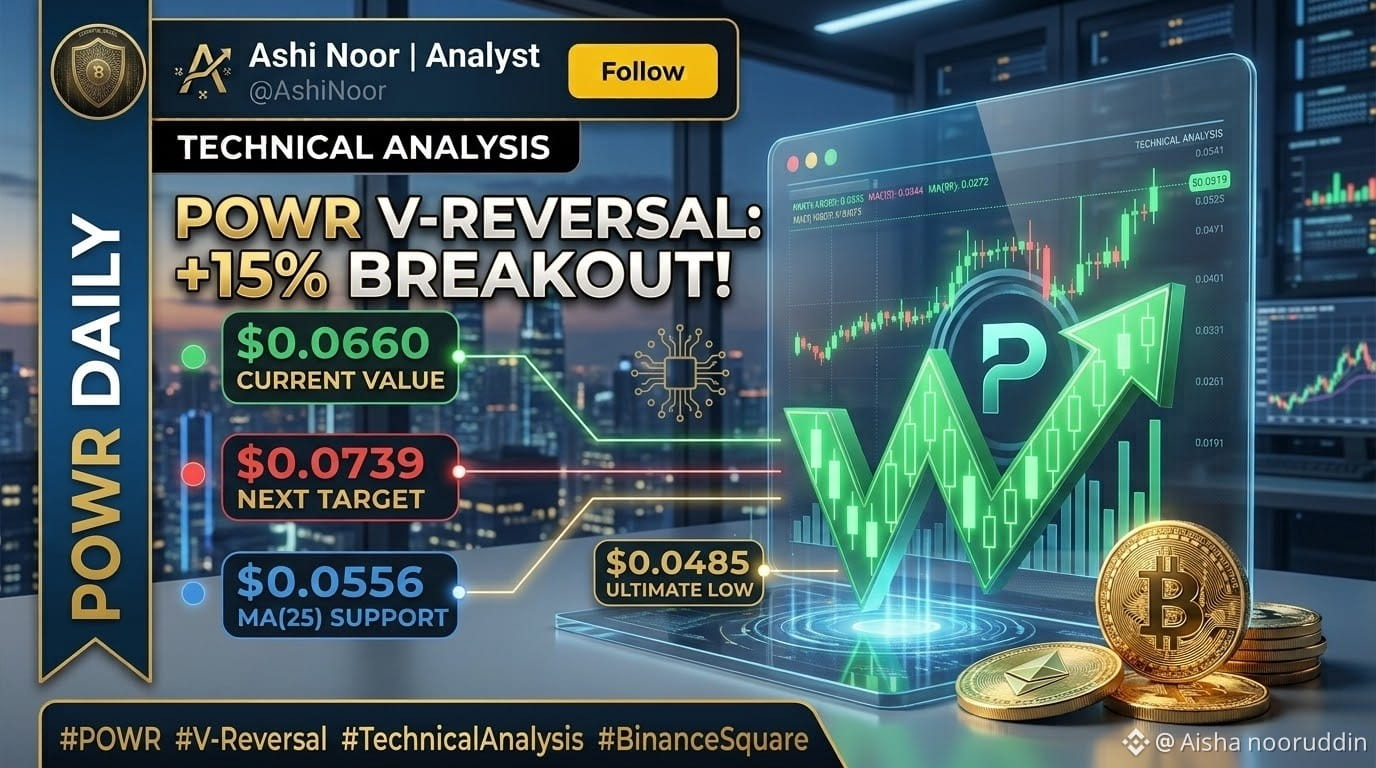
V-Reversal Surge: +15% Vertical Breakout!
The $POWR /USDT pair (Powerledger) has executed a powerful V-shaped recovery, surging +14.98% to trade at $0.0660 backed by a massive volume spike!
📊 Key Technical Levels:
* Current Price: $0.0660 (24h High: $0.0730 | 24h Low: $0.0556)
* Immediate Target / Swing High: $0.0739
* Dynamic Support (MA25): $0.0556
* Ultimate Support Floor: $0.0485
💡 Trade Scenarios:
* Bullish Continuation: A sustained daily close above current levels clears the path for a retest of the $0.0739 swing high and continuation into higher resistance zones.
* Pullback / Retest: Due to the steep vertical impulse candle, watch for a potential healthy retest near the $0.0556 (MA25) support region to form a solid higher low.
⚠️ V-reversals can experience sharp volatility—manage your risk tightly and use proper stop-losses!
👇 Community Discussion:
Are you riding the $POWR wave to a retest of $0.074, or waiting for a dip to accumulate? Drop your strategy below! 👇
📌 Follow @Ashi Noor | Analyst for daily high-probability technical setups!
#Write2Earn #BinanceSquare #POWR #Powerledger #VReversal #TechnicalAnalysis $[POWR]
$POWR
V-Reversal Surge: +15% Vertical Breakout!
The $POWR /USDT pair (Powerledger) has executed a powerful V-shaped recovery, surging +14.98% to trade at $0.0660 backed by a massive volume spike!
📊 Key Technical Levels:
* Current Price: $0.0660 (24h High: $0.0730 | 24h Low: $0.0556)
* Immediate Target / Swing High: $0.0739
* Dynamic Support (MA25): $0.0556
* Ultimate Support Floor: $0.0485
💡 Trade Scenarios:
* Bullish Continuation: A sustained daily close above current levels clears the path for a retest of the $0.0739 swing high and continuation into higher resistance zones.
* Pullback / Retest: Due to the steep vertical impulse candle, watch for a potential healthy retest near the $0.0556 (MA25) support region to form a solid higher low.
⚠️ V-reversals can experience sharp volatility—manage your risk tightly and use proper stop-losses!
👇 Community Discussion:
Are you riding the $POWR wave to a retest of $0.074, or waiting for a dip to accumulate? Drop your strategy below! 👇
📌 Follow @Ashi Noor | Analyst for daily high-probability technical setups!
#Write2Earn #BinanceSquare #POWR #Powerledger #VReversal #TechnicalAnalysis $[POWR]
203
·
--
ကျရိပ်ရှိသည်
ဘာသာပြန်ဆိုချက် ကြည့်မည်
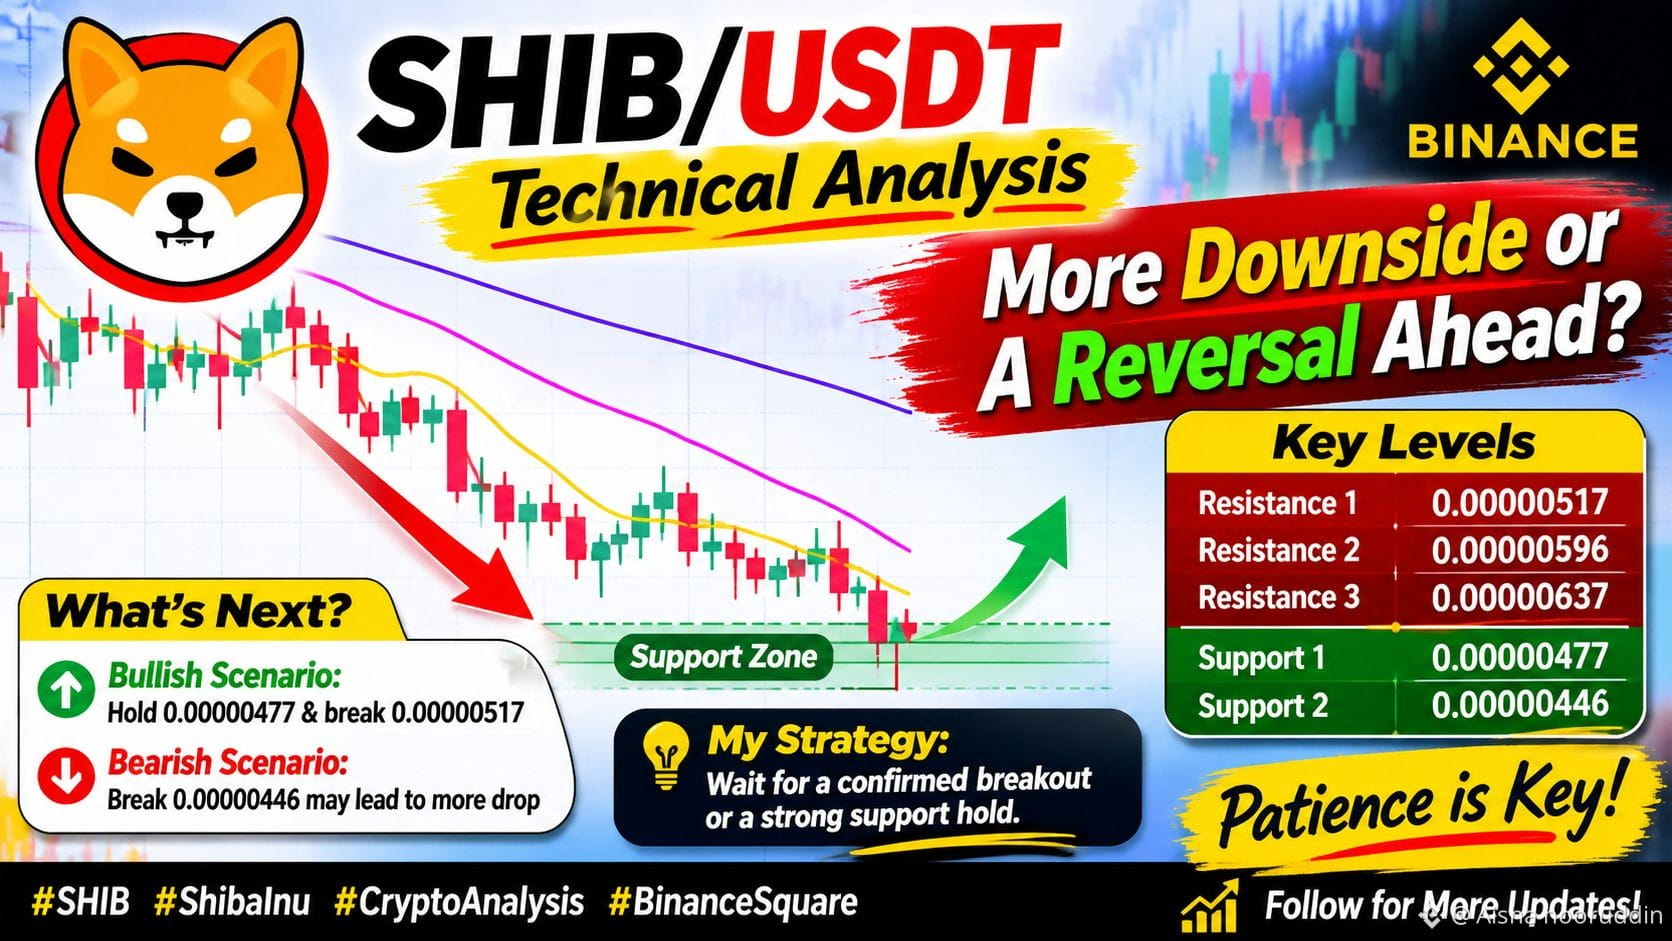
Shiba Inu ($SHIB ) is showing signs of continued selling pressure on the daily chart, but buyers are attempting to defend the recent support zone.
According to the provided Binance screenshot, SHIB is trading around 0.00000468 USDT, down approximately 2.50% over 24 hours.
The market is approaching an important area where the next move could determine its short-term direction.
# Key Technical Levels
Level | Price (USDT)
Current price | 0.00000468 |
Immediate support | 0.00000467 |
Major support | 0.00000446 |
Lower support | 0.00000436 |
Immediate resistance | 0.00000477 |
Strong resistance | 0.00000482 |
Next resistance | 0.00000507 |
Major resistance | 0.00000516 |
# Moving Average Analysis
* MA(7): 0.00000482
* MA(25): 0.00000507
* MA(99): 0.00000516
$SHIB is trading below all three moving averages, suggesting that the broader daily trend remains bearish.
# Bullish Scenario
If buyers defend the 0.00000446 support area and price moves above 0.00000477 with stronger volume, a recovery toward 0.00000482 and 0.00000507 could become possible.
# Bearish Scenario
If $SHIB loses 0.00000446, further downside toward 0.00000436 may be possible. A sustained break below support would weaken the recovery outlook.
# My Market View
I would avoid chasing a quick bounce. Waiting for stronger buying volume and a confirmed breakout would be a more cautious approach.
SHIB needs to reclaim its short-term moving averages before a meaningful bullish reversal becomes convincing.
What do you think? Can SHIB recover from this support zone, or will sellers push the price lower?
#SHIB #ShibaInu #SHIBUSDT #CryptoAnalysis #TechnicalAnalysis
{spot}(SHIBUSDT)
#BinanceSquare
Shiba Inu ($SHIB ) is showing signs of continued selling pressure on the daily chart, but buyers are attempting to defend the recent support zone.
According to the provided Binance screenshot, SHIB is trading around 0.00000468 USDT, down approximately 2.50% over 24 hours.
The market is approaching an important area where the next move could determine its short-term direction.
# Key Technical Levels
Level | Price (USDT)
Current price | 0.00000468 |
Immediate support | 0.00000467 |
Major support | 0.00000446 |
Lower support | 0.00000436 |
Immediate resistance | 0.00000477 |
Strong resistance | 0.00000482 |
Next resistance | 0.00000507 |
Major resistance | 0.00000516 |
# Moving Average Analysis
* MA(7): 0.00000482
* MA(25): 0.00000507
* MA(99): 0.00000516
$SHIB is trading below all three moving averages, suggesting that the broader daily trend remains bearish.
# Bullish Scenario
If buyers defend the 0.00000446 support area and price moves above 0.00000477 with stronger volume, a recovery toward 0.00000482 and 0.00000507 could become possible.
# Bearish Scenario
If $SHIB loses 0.00000446, further downside toward 0.00000436 may be possible. A sustained break below support would weaken the recovery outlook.
# My Market View
I would avoid chasing a quick bounce. Waiting for stronger buying volume and a confirmed breakout would be a more cautious approach.
SHIB needs to reclaim its short-term moving averages before a meaningful bullish reversal becomes convincing.
What do you think? Can SHIB recover from this support zone, or will sellers push the price lower?
#SHIB #ShibaInu #SHIBUSDT #CryptoAnalysis #TechnicalAnalysis
#BinanceSquare
130
·
--
ကျရိပ်ရှိသည်
ဘာသာပြန်ဆိုချက် ကြည့်မည်
$SOPH
{spot}(SOPHUSDT)
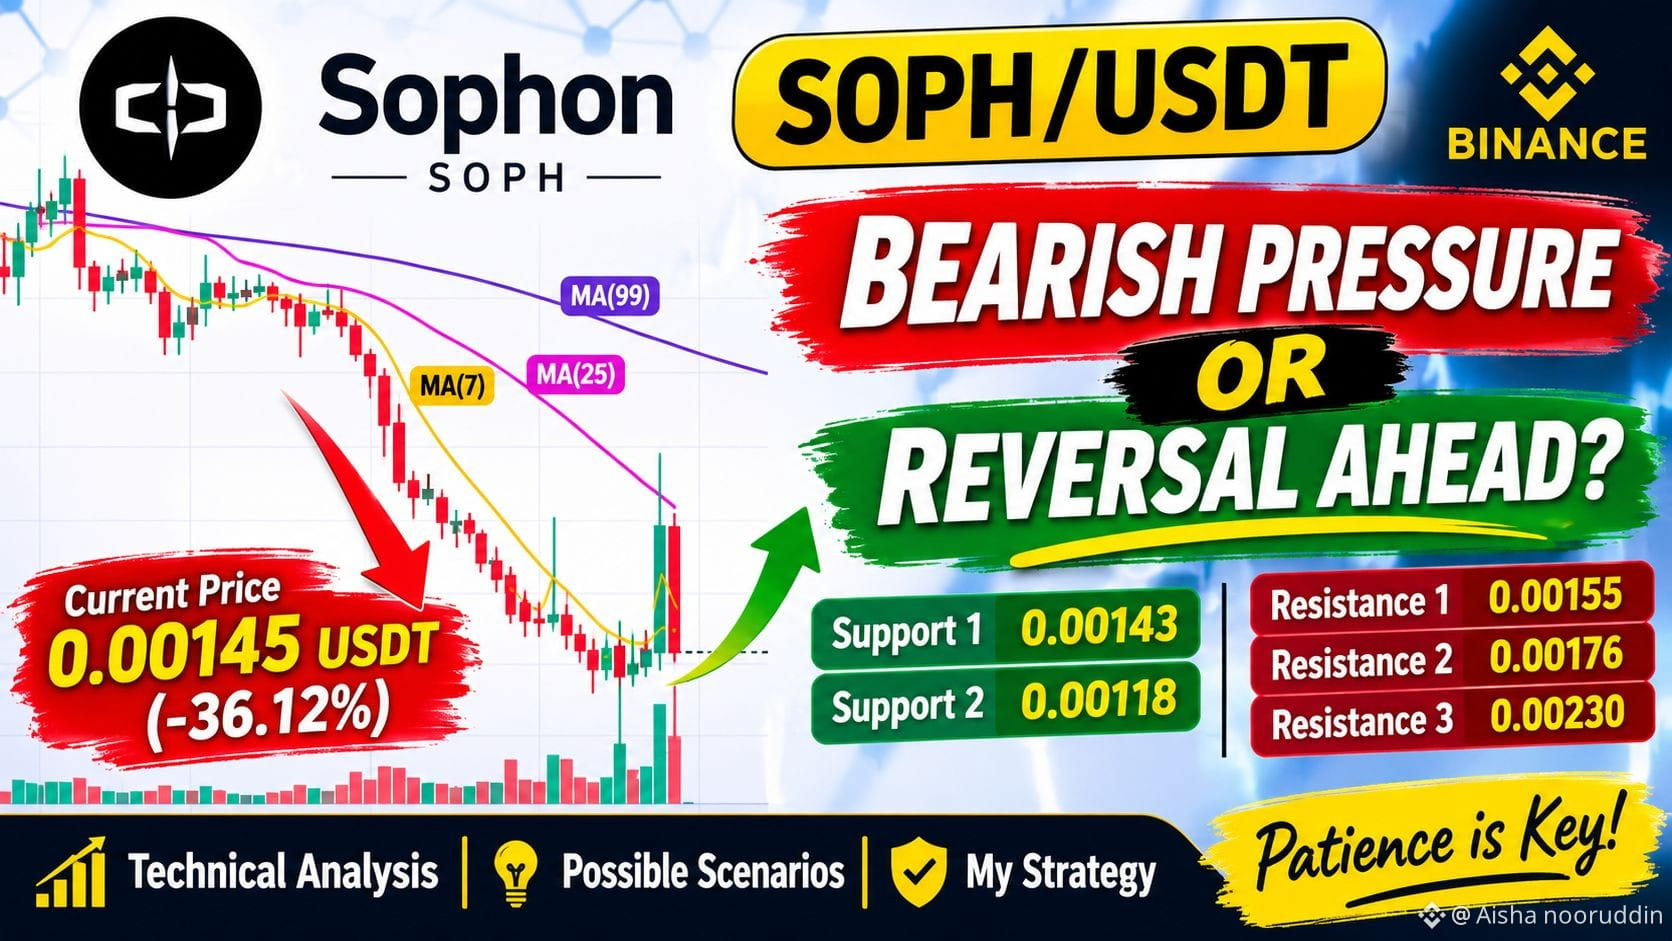
/USDT is showing significant bearish pressure on the daily timeframe. After an extended decline, the token is trading near 0.00145 USDT, with sellers still dominating the market.
The recent price action shows increased volatility and a sharp rise in trading volume. Although a short-term recovery is possible, the chart has not yet confirmed a bullish reversal.
# Key Technical Levels
| Level | Price (USDT) |
| Immediate support | 0.00143 |
| Major support | 0.00118 |
| Immediate resistance | 0.00155 |
| Next resistance | 0.00176 |
| Strong resistance | 0.00230 |
# Moving Average Analysis
* MA(7): 0.00155
* MA(25): 0.00230
* MA(99): 0.00354
The current price is below all three moving averages, confirming that the broader trend remains bearish.
# What Could Happen Next?
Bullish scenario: If SOPH holds above 0.00143 and reclaims 0.00155 with strong buying volume, a recovery toward 0.00176 could become possible.
Bearish scenario: If the price loses 0.00143, sellers could push it toward the previous low of 0.00118.
# My Strategy
I would avoid rushing into a buy during such heavy selling pressure. Waiting for a confirmed support hold, stronger volume, and a clear reversal candle may offer a better opportunity.
The key question is whether buyers can defend the 0.00118–0.00143 support area.
Final Thoughts
$SOPH is currently in a high-risk technical position. A strong recovery needs confirmation rather than speculation. Patience and proper risk management are important in these market conditions.
What do you think? Can $SOPH recover from this level, or will sellers push it lower?
#SOPH #Sophon #CryptoAnalysis #TechnicalAnalysis #BinanceSquare
$SOPH
/USDT is showing significant bearish pressure on the daily timeframe. After an extended decline, the token is trading near 0.00145 USDT, with sellers still dominating the market.
The recent price action shows increased volatility and a sharp rise in trading volume. Although a short-term recovery is possible, the chart has not yet confirmed a bullish reversal.
# Key Technical Levels
| Level | Price (USDT) |
| Immediate support | 0.00143 |
| Major support | 0.00118 |
| Immediate resistance | 0.00155 |
| Next resistance | 0.00176 |
| Strong resistance | 0.00230 |
# Moving Average Analysis
* MA(7): 0.00155
* MA(25): 0.00230
* MA(99): 0.00354
The current price is below all three moving averages, confirming that the broader trend remains bearish.
# What Could Happen Next?
Bullish scenario: If SOPH holds above 0.00143 and reclaims 0.00155 with strong buying volume, a recovery toward 0.00176 could become possible.
Bearish scenario: If the price loses 0.00143, sellers could push it toward the previous low of 0.00118.
# My Strategy
I would avoid rushing into a buy during such heavy selling pressure. Waiting for a confirmed support hold, stronger volume, and a clear reversal candle may offer a better opportunity.
The key question is whether buyers can defend the 0.00118–0.00143 support area.
Final Thoughts
$SOPH is currently in a high-risk technical position. A strong recovery needs confirmation rather than speculation. Patience and proper risk management are important in these market conditions.
What do you think? Can $SOPH recover from this level, or will sellers push it lower?
#SOPH #Sophon #CryptoAnalysis #TechnicalAnalysis #BinanceSquare
637
·
--
ကျရိပ်ရှိသည်
တစ်စိတ်တစ်ပိုင်း မှန်ကန်
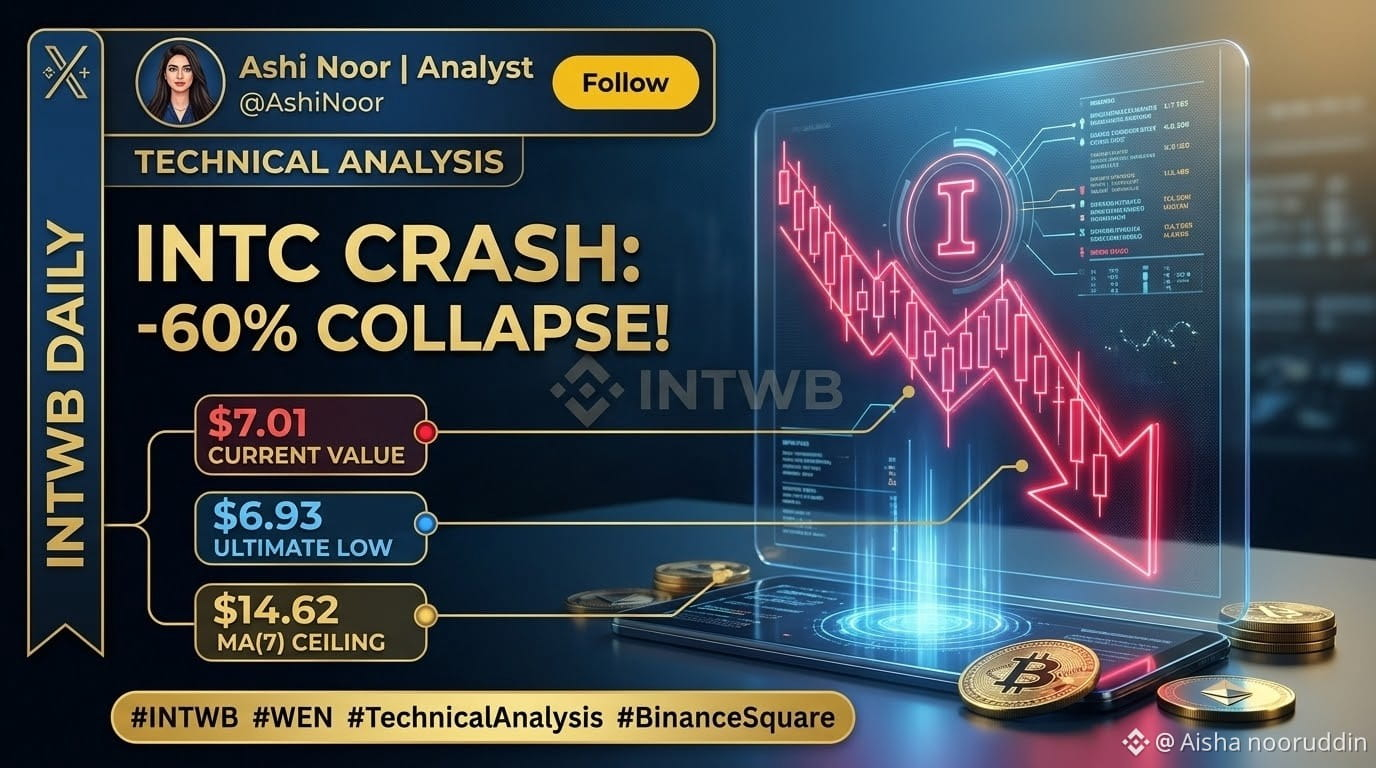
INTC ပြိုလဲမှု: -60% ကျဆင်း! ⚠️ GraniteShares 2X Long ETF ($INTWB
{spot}(INTWBUSDT)
) $7.01 အောက်ခြေသို့ အရှုံးပေးရောက်ရှိ!
Intel ၏ 2X Long အဆ leverage ETF ($INTWB) သည် နည်းပညာဆိုင်ရာ ထောက်ပံ့မှု လုံးဝပြိုကွဲသွားပြီး ပိုင်ဆိုင်မှုတန်ဖိုး -60% အထိ ဒေါင်လိုက်နီးပါး ကျဆင်းနေသဖြင့် လုံးဝပျက်စီးဆုံးရှုံးမှု ဆက်လက်ဖြစ်ပေါ်နေသည်!
အမြင့်ဆုံး $37.00 ကျော်အထိ တက်ခဲ့ရာမှ $INTWB သည် ရက်စက်ကြမ်းကြုတ်သော ကျဆင်းမှုကို မရပ်မနားကြုံတွေ့ခဲ့ရပြီး ယခုအခါ အရေးပါသည့် $7.01 အောက်ခြေတွင် အရောင်းအဝယ်ဖြစ်နေကာ နည်းပညာဆိုင်ရာ အနိမ့်ဆုံးတန်ဖိုးမှာ $6.93 ဖြစ်ကြောင်း အတည်ပြုထားသည်။ ဤအရှုံးပေးမှုတွင် ရောင်းအားဖိအား အလွန်ပြင်းထန်ပြီး ဒေါ်လာသန်းပေါင်းများစွာတန်သည့် နေရာကွက်ကွက်ကွင်းကွင်း ကုန်သွယ်မှုပမာဏ မြင့်တက်မှုက အတည်ပြုပေးထားသည်။ ယင်းသည် ဖွဲ့စည်းပုံဆိုင်ရာ အပြောင်းအလဲနှင့် ယုံကြည်ချက်ပြင်းထန်သော အဖွဲ့အစည်းဆိုင်ရာ ရောင်းချဖျက်သိမ်းမှုကို ညွှန်ပြနေသည်။
📊 နည်းပညာဆိုင်ရာ အညွှန်းကိန်းများ: အားလုံး အနီရောင်ဖြင့် သွေးထွက်နေ
1D ဇယား၏ နည်းပညာပိုင်း ခွဲခြမ်းစိတ်ဖြာမှုမှာ ကပ်ဘေးဆန်သည်:
* လက်ရှိတန်ဖိုး: $7.01 (အလွန်အကျွံ ရောင်းချထားသည့် အခြေအနေ)
* ရေရှည်တန်ဖိုး ပျမ်းမျှများ (MA25 နှင့် MA99): 25 ရက် MA ($18.91) နှင့် 99 ရက် MA ($22.50) တို့သည် လုံးဝပျောက်ကွယ်နေသည်။ ယင်းတို့ကို အလွန်ပြင်းထန်စွာ ချိုးဖောက်ကျော်လွန်ခဲ့သဖြင့် ဤသီးခြားဇယားမြင်ကွင်းတွင် ပုံမှန်နည်းပညာဆိုင်ရာ သွေဖည်မှုကို မမြင်နိုင်တော့ဘဲ မက်ခရိုအဆင့်တွင် ပြင်းထန်စွာ ပြိုလဲနေကြောင်း ပြသနေသည်။
⚠️ အရေးပေါ် သတိပြုရမည့် အခြေအနေများ:
* ချက်ချင်း ခုခံတန်ဖိုးကို ပြန်လည်စမ်းသပ်ခြင်း: နေရာကွက်ကွက်ကွင်းကွင်း ပြန်လည်သက်သာမှု တစ်စုံတစ်ရာ ဖြစ်ပေါ်ပါက နည်းပညာပိုင်းအရ ခိုင်မာမှုရှိကြောင်း သတ်မှတ်နိုင်ရန် ပထမဦးစားပေး ရည်မှန်းချက်မှာ $14.62 (MA7) ခုခံတန်ဖိုးကို ပြန်လည်စမ်းသပ်ရန်ဖြစ်သည်။ ဤအဆင့်ကို ပြန်လည်ရယူရန် မအောင်မြင်ပါက ထပ်မံကျဆင်းနိုင်သည်ဟု သတ်မှတ်နိုင်သည်။
* ထောက်ပံ့မှု ပြိုကွဲခြင်း: $6.93 အနိမ့်ဆုံးတန်ဖိုးအောက်သို့ ကျော်လွန်သွားပါက နည်းပညာပိုင်းအရ ဆိုးရွားသော ပြိုကွဲမှုကို အတည်ပြုမည်ဖြစ်ပြီး၊ ဈေးနှုန်းရှာဖွေမှုကာလ ရှည်ကြာလာကာ ခန့်မှန်းမရနိုင်သည့် အောက်ခြေတန်ဖိုးများ ဖြစ်ပေါ်နိုင်သည်။
Intel ၏ ဖွဲ့စည်းပုံဆိုင်ရာ အားနည်းချက်နှင့် 2X leverage ပေါင်းစပ်မှုကြောင့် အချိုးမညီသော စွန့်စားမှုအခြေအနေ ဖြစ်ပေါ်လာပြီး ယခုအခါ နည်းပညာပိုင်းဆိုင်ရာ ထိခိုက်မှု ပြင်းထန်စွာ ဖြစ်ပေါ်နေသည်။ ဈေးနှုန်းအတက်အကျ အလွန်ပြင်းထန်နေသဖြင့် စွန့်စားမှုစီမံခန့်ခွဲမှုသည် အရေးအကြီးဆုံးဖြစ်သည်။
👇 ဒီ -60% ကျဆင်းနေတဲ့ ဓားကို သင်ဖမ်းဝယ်နေသလား၊ ဒါမှမဟုတ် အတည်ပြုပြီးသား အမြင့်ပိုင်း အောက်ခြေဖွဲ့စည်းပုံကို စောင့်နေသလား။ သင့်ရည်မှန်းဈေးနှုန်းများကို အောက်တွင် မျှဝေပါ! 👇
📌 နေ့စဉ် အရေးပါသော နည်းပညာဆိုင်ရာ အရောင်းအဝယ်အခွင့်အလမ်းများအတွက် @Ashi Noor | Analyst ကို Follow လုပ်ပါ!
#INTWB #INTC #ETF #BinanceSquare #TechnicalAnalysis #Crash #Write2Earn $[INTWB]
INTC ပြိုလဲမှု: -60% ကျဆင်း! ⚠️ GraniteShares 2X Long ETF ($INTWB
) $7.01 အောက်ခြေသို့ အရှုံးပေးရောက်ရှိ!
Intel ၏ 2X Long အဆ leverage ETF ($INTWB ) သည် နည်းပညာဆိုင်ရာ ထောက်ပံ့မှု လုံးဝပြိုကွဲသွားပြီး ပိုင်ဆိုင်မှုတန်ဖိုး -60% အထိ ဒေါင်လိုက်နီးပါး ကျဆင်းနေသဖြင့် လုံးဝပျက်စီးဆုံးရှုံးမှု ဆက်လက်ဖြစ်ပေါ်နေသည်!
အမြင့်ဆုံး $37.00 ကျော်အထိ တက်ခဲ့ရာမှ $INTWB သည် ရက်စက်ကြမ်းကြုတ်သော ကျဆင်းမှုကို မရပ်မနားကြုံတွေ့ခဲ့ရပြီး ယခုအခါ အရေးပါသည့် $7.01 အောက်ခြေတွင် အရောင်းအဝယ်ဖြစ်နေကာ နည်းပညာဆိုင်ရာ အနိမ့်ဆုံးတန်ဖိုးမှာ $6.93 ဖြစ်ကြောင်း အတည်ပြုထားသည်။ ဤအရှုံးပေးမှုတွင် ရောင်းအားဖိအား အလွန်ပြင်းထန်ပြီး ဒေါ်လာသန်းပေါင်းများစွာတန်သည့် နေရာကွက်ကွက်ကွင်းကွင်း ကုန်သွယ်မှုပမာဏ မြင့်တက်မှုက အတည်ပြုပေးထားသည်။ ယင်းသည် ဖွဲ့စည်းပုံဆိုင်ရာ အပြောင်းအလဲနှင့် ယုံကြည်ချက်ပြင်းထန်သော အဖွဲ့အစည်းဆိုင်ရာ ရောင်းချဖျက်သိမ်းမှုကို ညွှန်ပြနေသည်။
📊 နည်းပညာဆိုင်ရာ အညွှန်းကိန်းများ: အားလုံး အနီရောင်ဖြင့် သွေးထွက်နေ
1D ဇယား၏ နည်းပညာပိုင်း ခွဲခြမ်းစိတ်ဖြာမှုမှာ ကပ်ဘေးဆန်သည်:
* လက်ရှိတန်ဖိုး: $7.01 (အလွန်အကျွံ ရောင်းချထားသည့် အခြေအနေ)
* ရေရှည်တန်ဖိုး ပျမ်းမျှများ (MA25 နှင့် MA99): 25 ရက် MA ($18.91) နှင့် 99 ရက် MA ($22.50) တို့သည် လုံးဝပျောက်ကွယ်နေသည်။ ယင်းတို့ကို အလွန်ပြင်းထန်စွာ ချိုးဖောက်ကျော်လွန်ခဲ့သဖြင့် ဤသီးခြားဇယားမြင်ကွင်းတွင် ပုံမှန်နည်းပညာဆိုင်ရာ သွေဖည်မှုကို မမြင်နိုင်တော့ဘဲ မက်ခရိုအဆင့်တွင် ပြင်းထန်စွာ ပြိုလဲနေကြောင်း ပြသနေသည်။
⚠️ အရေးပေါ် သတိပြုရမည့် အခြေအနေများ:
* ချက်ချင်း ခုခံတန်ဖိုးကို ပြန်လည်စမ်းသပ်ခြင်း: နေရာကွက်ကွက်ကွင်းကွင်း ပြန်လည်သက်သာမှု တစ်စုံတစ်ရာ ဖြစ်ပေါ်ပါက နည်းပညာပိုင်းအရ ခိုင်မာမှုရှိကြောင်း သတ်မှတ်နိုင်ရန် ပထမဦးစားပေး ရည်မှန်းချက်မှာ $14.62 (MA7) ခုခံတန်ဖိုးကို ပြန်လည်စမ်းသပ်ရန်ဖြစ်သည်။ ဤအဆင့်ကို ပြန်လည်ရယူရန် မအောင်မြင်ပါက ထပ်မံကျဆင်းနိုင်သည်ဟု သတ်မှတ်နိုင်သည်။
* ထောက်ပံ့မှု ပြိုကွဲခြင်း: $6.93 အနိမ့်ဆုံးတန်ဖိုးအောက်သို့ ကျော်လွန်သွားပါက နည်းပညာပိုင်းအရ ဆိုးရွားသော ပြိုကွဲမှုကို အတည်ပြုမည်ဖြစ်ပြီး၊ ဈေးနှုန်းရှာဖွေမှုကာလ ရှည်ကြာလာကာ ခန့်မှန်းမရနိုင်သည့် အောက်ခြေတန်ဖိုးများ ဖြစ်ပေါ်နိုင်သည်။
Intel ၏ ဖွဲ့စည်းပုံဆိုင်ရာ အားနည်းချက်နှင့် 2X leverage ပေါင်းစပ်မှုကြောင့် အချိုးမညီသော စွန့်စားမှုအခြေအနေ ဖြစ်ပေါ်လာပြီး ယခုအခါ နည်းပညာပိုင်းဆိုင်ရာ ထိခိုက်မှု ပြင်းထန်စွာ ဖြစ်ပေါ်နေသည်။ ဈေးနှုန်းအတက်အကျ အလွန်ပြင်းထန်နေသဖြင့် စွန့်စားမှုစီမံခန့်ခွဲမှုသည် အရေးအကြီးဆုံးဖြစ်သည်။
👇 ဒီ -60% ကျဆင်းနေတဲ့ ဓားကို သင်ဖမ်းဝယ်နေသလား၊ ဒါမှမဟုတ် အတည်ပြုပြီးသား အမြင့်ပိုင်း အောက်ခြေဖွဲ့စည်းပုံကို စောင့်နေသလား။ သင့်ရည်မှန်းဈေးနှုန်းများကို အောက်တွင် မျှဝေပါ! 👇
📌 နေ့စဉ် အရေးပါသော နည်းပညာဆိုင်ရာ အရောင်းအဝယ်အခွင့်အလမ်းများအတွက် @Ashi Noor | Analyst ကို Follow လုပ်ပါ!
#INTWB #INTC #ETF #BinanceSquare #TechnicalAnalysis #Crash #Write2Earn $[INTWB]
3
800
ဘာသာပြန်ဆိုချက် ကြည့်မည်
### $1.5 Billion in Leveraged Crypto Bets Liquidated: A Major Wake-Up Call for Traders
The crypto market has once again highlighted the risks of leveraged trading, with approximately $1.5 billion in leveraged crypto positions reportedly liquidated.
This massive liquidation event shows how quickly market conditions can change, especially for traders using high leverage.
### Why Are Liquidations Happening?
Leveraged trading allows traders to control larger positions with relatively small amounts of capital. However, it also increases risk.
When prices move sharply against leveraged positions, exchanges may automatically close those positions to prevent further losses.
Several factors can contribute to large liquidation events:
* Sudden market volatility.
* Excessive leverage and overconfidence.
* Unexpected price movements.
* Weak risk management.
* Crowded long or short positions.
### What Does This Mean for the Crypto Market?
Large-scale liquidations can create additional buying or selling pressure, potentially increasing volatility.
However, liquidations do not automatically mean the market will move in one direction. Traders should watch Bitcoin's price action, trading volume, market structure, and important support and resistance levels before making decisions.
### My Market Perspective
I believe this event is an important reminder that protecting capital should always come before chasing profits.
High leverage may increase potential returns, but it can also wipe out trading capital very quickly. Spot trading and disciplined risk management can be more suitable for those who prefer to avoid liquidation risk.
Final Thought:
In crypto, surviving the market is more important than making quick profits. Patience, education, and risk management are essential for long-term growth.
What do you think? Is excessive leverage one of the biggest reasons traders lose money in crypto?
Share your thoughts below!
#CryptoMarket #Bitcoin #CryptoLiquidations #TradingRisk #CryptoTrading #$1.5BInLeveragedCryptoBetsLiquidated
{spot}(BTCUSDT)
### $1.5 Billion in Leveraged Crypto Bets Liquidated: A Major Wake-Up Call for Traders
The crypto market has once again highlighted the risks of leveraged trading, with approximately $1.5 billion in leveraged crypto positions reportedly liquidated.
This massive liquidation event shows how quickly market conditions can change, especially for traders using high leverage.
### Why Are Liquidations Happening?
Leveraged trading allows traders to control larger positions with relatively small amounts of capital. However, it also increases risk.
When prices move sharply against leveraged positions, exchanges may automatically close those positions to prevent further losses.
Several factors can contribute to large liquidation events:
* Sudden market volatility.
* Excessive leverage and overconfidence.
* Unexpected price movements.
* Weak risk management.
* Crowded long or short positions.
### What Does This Mean for the Crypto Market?
Large-scale liquidations can create additional buying or selling pressure, potentially increasing volatility.
However, liquidations do not automatically mean the market will move in one direction. Traders should watch Bitcoin's price action, trading volume, market structure, and important support and resistance levels before making decisions.
### My Market Perspective
I believe this event is an important reminder that protecting capital should always come before chasing profits.
High leverage may increase potential returns, but it can also wipe out trading capital very quickly. Spot trading and disciplined risk management can be more suitable for those who prefer to avoid liquidation risk.
Final Thought:
In crypto, surviving the market is more important than making quick profits. Patience, education, and risk management are essential for long-term growth.
What do you think? Is excessive leverage one of the biggest reasons traders lose money in crypto?
Share your thoughts below!
#CryptoMarket #Bitcoin #CryptoLiquidations #TradingRisk #CryptoTrading #$1.5BInLeveragedCryptoBetsLiquidated

61
·
--
တက်ရိပ်ရှိသည်
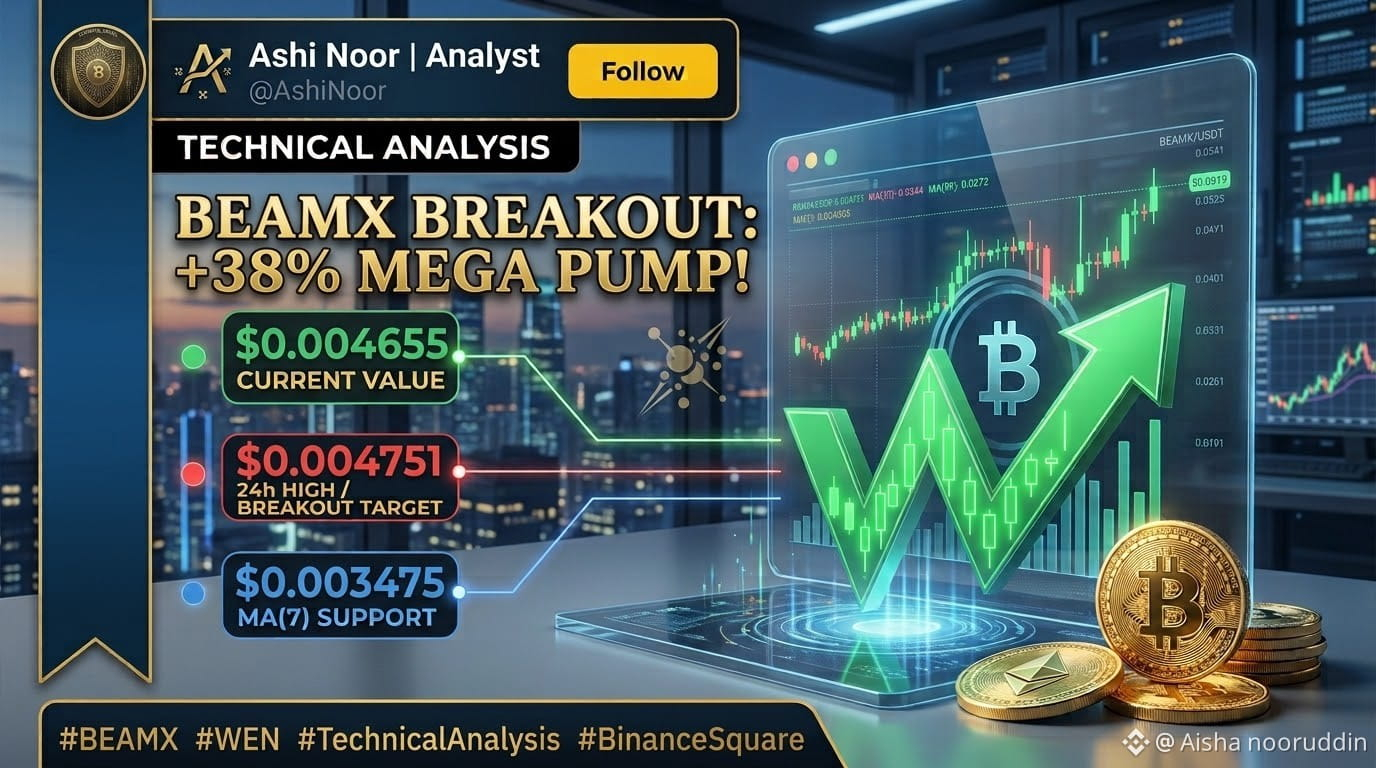
$BEAMX 38% ကျော် ပေါက်ကွဲတက်လာပြီ—Gaming ကဏ္ဍတွင် ကြီးမားသော Parabolic Breakout!
$BEAMX
{spot}(BEAMXUSDT)
/USDT အတွဲ (Beam၊ ယခင် Merit Circle) သည် ယနေ့ crypto gaming ကဏ္ဍကို ဦးဆောင်နေပြီး၊ နေ့စဉ် ကုန်သွယ်မှုပမာဏ မကြုံစဖူး မြင့်တက်လာပြီးနောက် 38.21% တက်ကာ $0.004655 သို့ ရောက်ရှိလာသည်!
📊 အရေးကြီးသော နည်းပညာဆိုင်ရာ ဈေးနှုန်းအဆင့်များ:
* လက်ရှိဈေးနှုန်း: $0.004655 (24h အမြင့်ဆုံး: $0.004751 | 24h အနိမ့်ဆုံး: $0.003224)
* အနီးဆုံး ခုခံမှု / အမြင့်ဆုံး: $0.004751
* ကာလတို အခြေခံအဆင့် (MA7): $0.003475
* ကာလလတ် ပံ့ပိုးမှုအဆင့် (MA25): $0.003051
* ကာလရှည် အောက်ခြေအဆင့် (MA99): $0.001992
💡 အရောင်းအဝယ် ဖြစ်နိုင်ခြေများ:
* အတက်ဘက်သို့ ဆက်လက်မြင့်တက်ခြင်း: နေ့စဉ်ပိတ်ဈေးသည် $0.004751 အနီးတွင် ခိုင်မာစွာ ရှိနေပါက ဈေးနှုန်းရှာဖွေမှု ဆက်လက်ဖြစ်ပေါ်ကြောင်း အတည်ပြုပြီး၊ $0.0050+ ရှိ စိတ်ပိုင်းဆိုင်ရာ ခုခံမှုအဆင့်သို့ ဦးတည်သည့် ရေရှည်လမ်းကြောင်းကို ဖွင့်ပေးနိုင်သည်။
* ဈေးပြန်ကျခြင်း / ပြန်လည်စမ်းသပ်ခြင်း: 7 ရက် ရွေ့လျားပျမ်းမျှတန်ဖိုးနှင့် နှိုင်းယှဉ်ပါက ဈေးနှုန်းသည် အလွန်အမင်း မြန်ဆန်စွာ တက်ထားသောကြောင့်၊ ရေရှည်တည်တံ့သည့် ပိုမြင့်သော အနိမ့်ဈေးအဆင့်တစ်ခု တည်ဆောက်ရန် $0.003475 ရှိ ရွေ့လျားနေသော အောက်ခြေအဆင့်သို့ ပြန်ကျပြီး အမြတ်ယူမှုများ ဖြစ်ပေါ်နိုင်ခြေကို စောင့်ကြည့်ပါ။
⚠️ Gaming တိုကင်များ၏ ဈေးနှုန်းသည် လျင်မြန်စွာ ပြောင်းလဲတတ်သည်—သင့်ရင်းနှီးငွေကို တင်းကျပ်သော stop-loss များဖြင့် အမြဲကာကွယ်ပါ!
👇 အသိုင်းအဝိုင်း ဆွေးနွေးမှု:
ဒီ 38% တက်လာမှုမှာ အမြတ်ယူမလား၊ ဒါမှမဟုတ် $0.0050 အထက်သို့ တက်မယ်လို့ မျှော်လင့်ပြီး $BEAMX ကို ဆက်ကိုင်ထားမလား? အောက်မှာ ပြောပြပါ! 👇
📌 နေ့စဉ် အရှိန်အဟုန်မြင့် နည်းပညာဆိုင်ရာ သုံးသပ်ချက်များအတွက် @Ashi Noor | Analyst ကို Follow လုပ်ပါ!
#Write2Earn #BinanceSquare #BEAMX #GamingCrypto #Altcoins #နည်းပညာဆိုင်ရာသုံးသပ်ချက် $[BEAMX]
$BEAMX 38% ကျော် ပေါက်ကွဲတက်လာပြီ—Gaming ကဏ္ဍတွင် ကြီးမားသော Parabolic Breakout!
$BEAMX
/USDT အတွဲ (Beam၊ ယခင် Merit Circle) သည် ယနေ့ crypto gaming ကဏ္ဍကို ဦးဆောင်နေပြီး၊ နေ့စဉ် ကုန်သွယ်မှုပမာဏ မကြုံစဖူး မြင့်တက်လာပြီးနောက် 38.21% တက်ကာ $0.004655 သို့ ရောက်ရှိလာသည်!
📊 အရေးကြီးသော နည်းပညာဆိုင်ရာ ဈေးနှုန်းအဆင့်များ:
* လက်ရှိဈေးနှုန်း: $0.004655 (24h အမြင့်ဆုံး: $0.004751 | 24h အနိမ့်ဆုံး: $0.003224)
* အနီးဆုံး ခုခံမှု / အမြင့်ဆုံး: $0.004751
* ကာလတို အခြေခံအဆင့် (MA7): $0.003475
* ကာလလတ် ပံ့ပိုးမှုအဆင့် (MA25): $0.003051
* ကာလရှည် အောက်ခြေအဆင့် (MA99): $0.001992
💡 အရောင်းအဝယ် ဖြစ်နိုင်ခြေများ:
* အတက်ဘက်သို့ ဆက်လက်မြင့်တက်ခြင်း: နေ့စဉ်ပိတ်ဈေးသည် $0.004751 အနီးတွင် ခိုင်မာစွာ ရှိနေပါက ဈေးနှုန်းရှာဖွေမှု ဆက်လက်ဖြစ်ပေါ်ကြောင်း အတည်ပြုပြီး၊ $0.0050+ ရှိ စိတ်ပိုင်းဆိုင်ရာ ခုခံမှုအဆင့်သို့ ဦးတည်သည့် ရေရှည်လမ်းကြောင်းကို ဖွင့်ပေးနိုင်သည်။
* ဈေးပြန်ကျခြင်း / ပြန်လည်စမ်းသပ်ခြင်း: 7 ရက် ရွေ့လျားပျမ်းမျှတန်ဖိုးနှင့် နှိုင်းယှဉ်ပါက ဈေးနှုန်းသည် အလွန်အမင်း မြန်ဆန်စွာ တက်ထားသောကြောင့်၊ ရေရှည်တည်တံ့သည့် ပိုမြင့်သော အနိမ့်ဈေးအဆင့်တစ်ခု တည်ဆောက်ရန် $0.003475 ရှိ ရွေ့လျားနေသော အောက်ခြေအဆင့်သို့ ပြန်ကျပြီး အမြတ်ယူမှုများ ဖြစ်ပေါ်နိုင်ခြေကို စောင့်ကြည့်ပါ။
⚠️ Gaming တိုကင်များ၏ ဈေးနှုန်းသည် လျင်မြန်စွာ ပြောင်းလဲတတ်သည်—သင့်ရင်းနှီးငွေကို တင်းကျပ်သော stop-loss များဖြင့် အမြဲကာကွယ်ပါ!
👇 အသိုင်းအဝိုင်း ဆွေးနွေးမှု:
ဒီ 38% တက်လာမှုမှာ အမြတ်ယူမလား၊ ဒါမှမဟုတ် $0.0050 အထက်သို့ တက်မယ်လို့ မျှော်လင့်ပြီး $BEAMX ကို ဆက်ကိုင်ထားမလား? အောက်မှာ ပြောပြပါ! 👇
📌 နေ့စဉ် အရှိန်အဟုန်မြင့် နည်းပညာဆိုင်ရာ သုံးသပ်ချက်များအတွက် @Ashi Noor | Analyst ကို Follow လုပ်ပါ!
#Write2Earn #BinanceSquare #BEAMX #GamingCrypto #Altcoins #နည်းပညာဆိုင်ရာသုံးသပ်ချက် $[BEAMX]
250
·
--
ကျရိပ်ရှိသည်
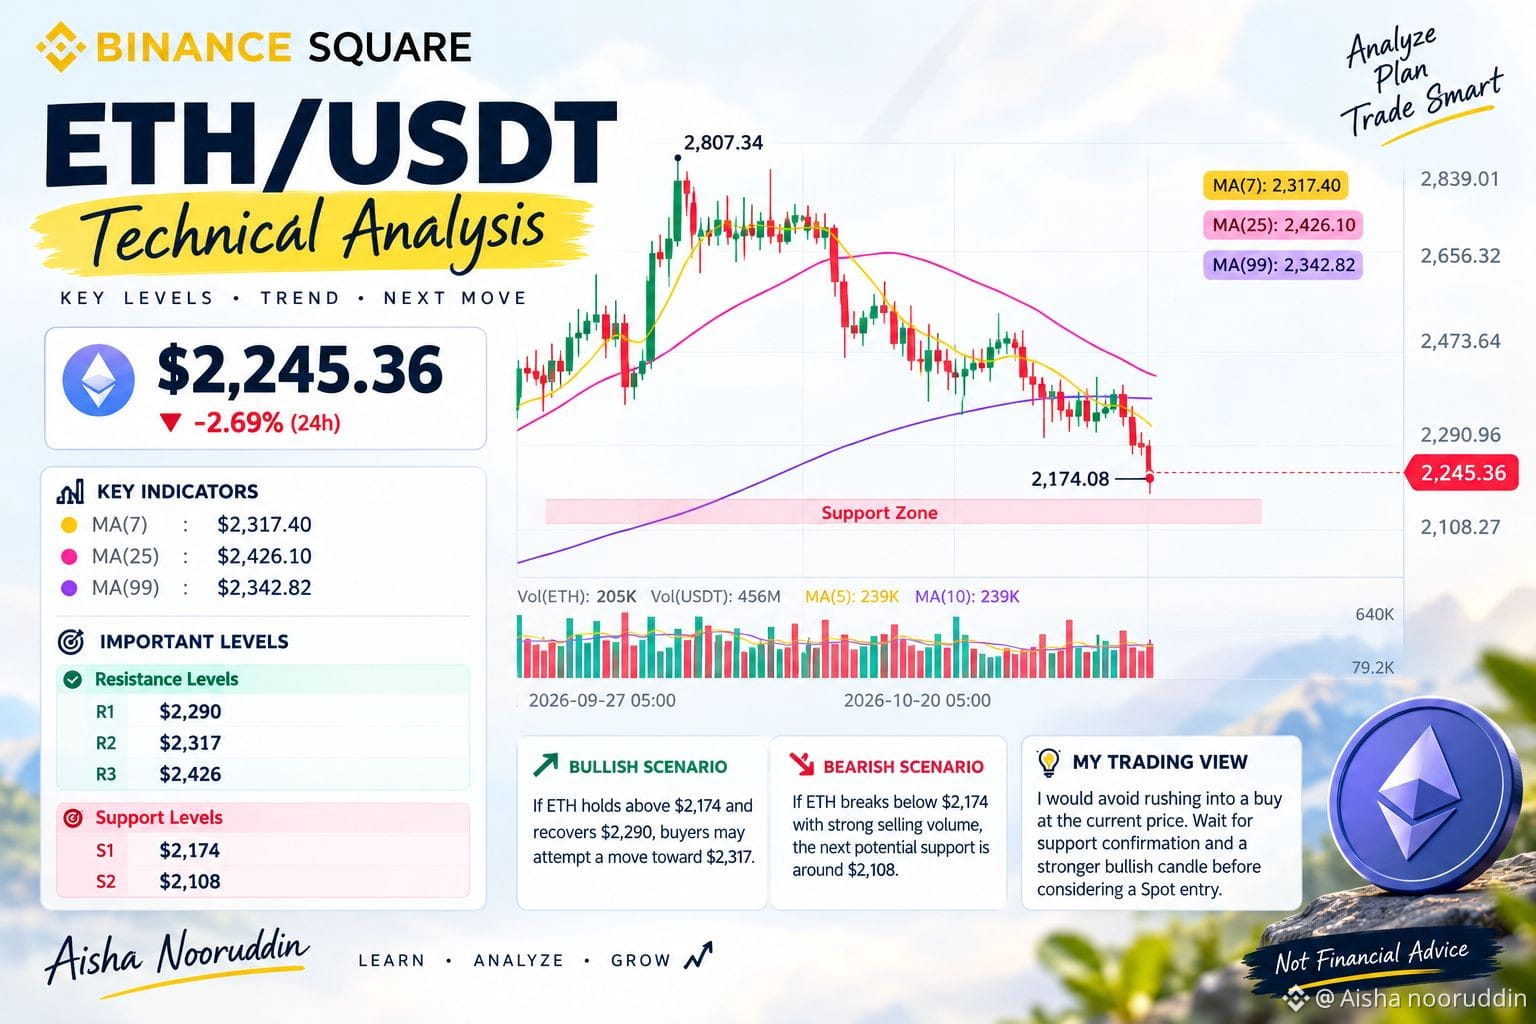
Ethereum ($ETH ) သည် ဆက်လက်အားနည်းနေပြီး screenshot ရိုက်ချိန်တွင် $2,245.36 ဝန်းကျင်၌ အရောင်းအဝယ်ဖြစ်နေသည်။ မကြာသေးမီက ဈေးနှုန်းလှုပ်ရှားမှုများအရ ရောင်းသူများက ဈေးကွက်ကို ဆက်လက်ထိန်းချုပ်ထားပြီး ဝယ်သူများမှာ ဝင်ရောက်မဝယ်ယူမီ ပိုမိုခိုင်မာသော အတည်ပြုချက်ကို စောင့်နေကြသည်။
အဓိက နည်းပညာပိုင်းဆိုင်ရာ လေ့လာချက်များ
$ETH
{spot}(ETHUSDT)
သည် လက်ရှိတွင် 7 ရက်၊ 25 ရက်နှင့် 99 ရက် ရွေ့လျားပျမ်းမျှတန်ဖိုးများအောက်၌ အရောင်းအဝယ်ဖြစ်နေသည်။ ယင်းက ကာလတိုနှင့် ကာလလတ် ဈေးနှုန်းအရှိန်အဟုန်များမှာ ဖိအားအောက်တွင် ရှိနေဆဲဖြစ်ကြောင်း ဖော်ပြသည်။
အရေးကြီးသော ဈေးနှုန်းအဆင့်များ:
* ပံ့ပိုးမှု 1: $2,174
* ပံ့ပိုးမှု 2: $2,108
* ခုခံမှု 1: $2,290
* ခုခံမှု 2: $2,317
* အဓိက ခုခံမှု: $2,426
### ကုန်သည်များ ဘာကို စောင့်ကြည့်သင့်သလဲ။
ဈေးတက်နိုင်သည့် အခြေအနေ: ETH သည် $2,174 ပံ့ပိုးမှုဇုန်ကို ထိန်းထားနိုင်ပြီး ဝယ်သူများက ဈေးနှုန်းကို $2,290 အထက်သို့ ပြန်တင်နိုင်ပါက $2,317 သို့ ပြန်လည်ဦးတည်နိုင်ခြေ ရှိလာနိုင်သည်။
ဈေးကျနိုင်သည့် အခြေအနေ: နေ့စဉ်ပိတ်ဈေးသည် $2,174 အောက်တွင် ရှိကြောင်း အတည်ပြုနိုင်ပါက ရောင်းအားဖိအား ပိုမိုများပြားလာနိုင်ပြီး $2,108 ပံ့ပိုးမှုဧရိယာကို အာရုံစိုက်ရနိုင်သည်။
### ကျွန်ုပ်၏ ကိုယ်ပိုင်ဈေးကွက်အမြင်
အလျင်စလို ဝင်ရောက်မည့်အစား ETH ကို သေချာစောင့်ကြည့်နေသည်။ လက်ရှိဈေးနှုန်းပုံစံမှာ ကျဆင်းဘက်သို့ ဦးတည်နေဆဲဖြစ်သောကြောင့် Spot position တစ်ခု စဉ်းစားမည့်အရင် ပြတ်သားသော ပြောင်းပြန်လှည့်မှုအချက်ပြမှု၊ တိုးတက်လာသော အရောင်းအဝယ်ပမာဏနှင့် ပံ့ပိုးမှုအတည်ပြုချက်တို့ကို မြင်လိုသည်။
မသေချာသော ဈေးကွက်အခြေအနေများတွင် စိတ်ရှည်ခြင်းသည် အရေးကြီးသည်။ အရင်းအနှီးကို ကာကွယ်ခြင်းသည် ဈေးနှုန်းလှုပ်ရှားမှုတိုင်းနောက် လိုက်ခြင်းထက် ပိုအရေးကြီးသည်။
သင်ဘယ်လိုထင်ပါသလဲ။ $ETH သည် $2,174 မှ ပြန်တက်လာမလား၊ ဒါမှမဟုတ် ရောင်းသူများက ၎င်းကို ပိုမိုနိမ့်ကျအောင် တွန်းချနိုင်မလား။
#ETH #Ethereum #ETHUSDT #CryptoAnalysis #BinanceSquare #SpotTrading
Ethereum ($ETH ) သည် ဆက်လက်အားနည်းနေပြီး screenshot ရိုက်ချိန်တွင် $2,245.36 ဝန်းကျင်၌ အရောင်းအဝယ်ဖြစ်နေသည်။ မကြာသေးမီက ဈေးနှုန်းလှုပ်ရှားမှုများအရ ရောင်းသူများက ဈေးကွက်ကို ဆက်လက်ထိန်းချုပ်ထားပြီး ဝယ်သူများမှာ ဝင်ရောက်မဝယ်ယူမီ ပိုမိုခိုင်မာသော အတည်ပြုချက်ကို စောင့်နေကြသည်။
အဓိက နည်းပညာပိုင်းဆိုင်ရာ လေ့လာချက်များ
$ETH
သည် လက်ရှိတွင် 7 ရက်၊ 25 ရက်နှင့် 99 ရက် ရွေ့လျားပျမ်းမျှတန်ဖိုးများအောက်၌ အရောင်းအဝယ်ဖြစ်နေသည်။ ယင်းက ကာလတိုနှင့် ကာလလတ် ဈေးနှုန်းအရှိန်အဟုန်များမှာ ဖိအားအောက်တွင် ရှိနေဆဲဖြစ်ကြောင်း ဖော်ပြသည်။
အရေးကြီးသော ဈေးနှုန်းအဆင့်များ:
* ပံ့ပိုးမှု 1: $2,174
* ပံ့ပိုးမှု 2: $2,108
* ခုခံမှု 1: $2,290
* ခုခံမှု 2: $2,317
* အဓိက ခုခံမှု: $2,426
### ကုန်သည်များ ဘာကို စောင့်ကြည့်သင့်သလဲ။
ဈေးတက်နိုင်သည့် အခြေအနေ: ETH သည် $2,174 ပံ့ပိုးမှုဇုန်ကို ထိန်းထားနိုင်ပြီး ဝယ်သူများက ဈေးနှုန်းကို $2,290 အထက်သို့ ပြန်တင်နိုင်ပါက $2,317 သို့ ပြန်လည်ဦးတည်နိုင်ခြေ ရှိလာနိုင်သည်။
ဈေးကျနိုင်သည့် အခြေအနေ: နေ့စဉ်ပိတ်ဈေးသည် $2,174 အောက်တွင် ရှိကြောင်း အတည်ပြုနိုင်ပါက ရောင်းအားဖိအား ပိုမိုများပြားလာနိုင်ပြီး $2,108 ပံ့ပိုးမှုဧရိယာကို အာရုံစိုက်ရနိုင်သည်။
### ကျွန်ုပ်၏ ကိုယ်ပိုင်ဈေးကွက်အမြင်
အလျင်စလို ဝင်ရောက်မည့်အစား ETH ကို သေချာစောင့်ကြည့်နေသည်။ လက်ရှိဈေးနှုန်းပုံစံမှာ ကျဆင်းဘက်သို့ ဦးတည်နေဆဲဖြစ်သောကြောင့် Spot position တစ်ခု စဉ်းစားမည့်အရင် ပြတ်သားသော ပြောင်းပြန်လှည့်မှုအချက်ပြမှု၊ တိုးတက်လာသော အရောင်းအဝယ်ပမာဏနှင့် ပံ့ပိုးမှုအတည်ပြုချက်တို့ကို မြင်လိုသည်။
မသေချာသော ဈေးကွက်အခြေအနေများတွင် စိတ်ရှည်ခြင်းသည် အရေးကြီးသည်။ အရင်းအနှီးကို ကာကွယ်ခြင်းသည် ဈေးနှုန်းလှုပ်ရှားမှုတိုင်းနောက် လိုက်ခြင်းထက် ပိုအရေးကြီးသည်။
သင်ဘယ်လိုထင်ပါသလဲ။ $ETH သည် $2,174 မှ ပြန်တက်လာမလား၊ ဒါမှမဟုတ် ရောင်းသူများက ၎င်းကို ပိုမိုနိမ့်ကျအောင် တွန်းချနိုင်မလား။
#ETH #Ethereum #ETHUSDT #CryptoAnalysis #BinanceSquare #SpotTrading
1
279
·
--
ကျရိပ်ရှိသည်
ဘာသာပြန်ဆိုချက် ကြည့်မည်
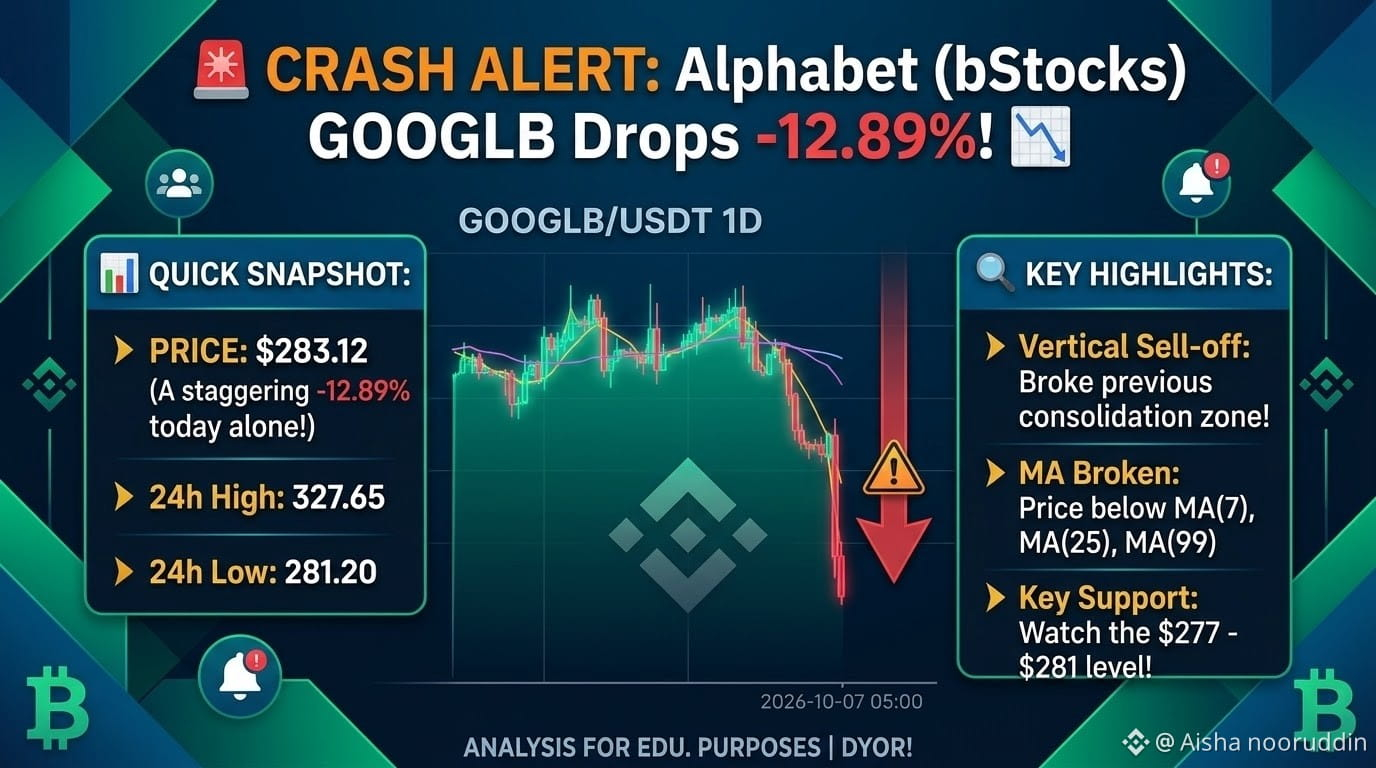
🚨 CRASH ALERT: Alphabet (bStocks) $GOOGLB Drops -12.89%! 📉
The $GOOGLB
{spot}(GOOGLBUSDT)
/USDT pair on Binance bStocks is taking a heavy hit today, plunging vertically past major support levels! 🩸
📊 Quick Snapshot:
* Current Price: $283.12
* 24h Change: -12.89%
* 24h High / Low: $327.65 / $281.20
* 24h Volume: $91.71M USDT
🔍 Key Technical Highlights:
* Vertical Sell-off: A sudden wave of intense selling broke straight down through the previous $330+ consolidation zone.
* Moving Averages Broken: Price has fallen sharply below the MA(7), MA(25), and MA(99), signaling extreme bearish momentum.
* Key Support to Watch: All eyes are on the $277 - $281 level to see if buyers step in to form a local floor.
⚠️ Trader Note: Catching a falling knife in a vertical drop is risky. Wait for volume to calm down and clear consolidation before considering entries!
💬 Is this a major discount or a trap? Drop your thoughts below! 👇
#GOOGLB #bStocks #CryptoAlert #Trading #BinanceSquare #TechnicalAnalysis
🚨 CRASH ALERT: Alphabet (bStocks) $GOOGLB Drops -12.89%! 📉
The $GOOGLB
/USDT pair on Binance bStocks is taking a heavy hit today, plunging vertically past major support levels! 🩸
📊 Quick Snapshot:
* Current Price: $283.12
* 24h Change: -12.89%
* 24h High / Low: $327.65 / $281.20
* 24h Volume: $91.71M USDT
🔍 Key Technical Highlights:
* Vertical Sell-off: A sudden wave of intense selling broke straight down through the previous $330+ consolidation zone.
* Moving Averages Broken: Price has fallen sharply below the MA(7), MA(25), and MA(99), signaling extreme bearish momentum.
* Key Support to Watch: All eyes are on the $277 - $281 level to see if buyers step in to form a local floor.
⚠️ Trader Note: Catching a falling knife in a vertical drop is risky. Wait for volume to calm down and clear consolidation before considering entries!
💬 Is this a major discount or a trap? Drop your thoughts below! 👇
#GOOGLB #bStocks #CryptoAlert #Trading #BinanceSquare #TechnicalAnalysis
1
100
·
--
တက်ရိပ်ရှိသည်
ဘာသာပြန်ဆိုချက် ကြည့်မည်
The charts are heating up, and altcoin traders are turning their eyes toward Particle Network ($PARTI
{spot}(PARTIUSDT)
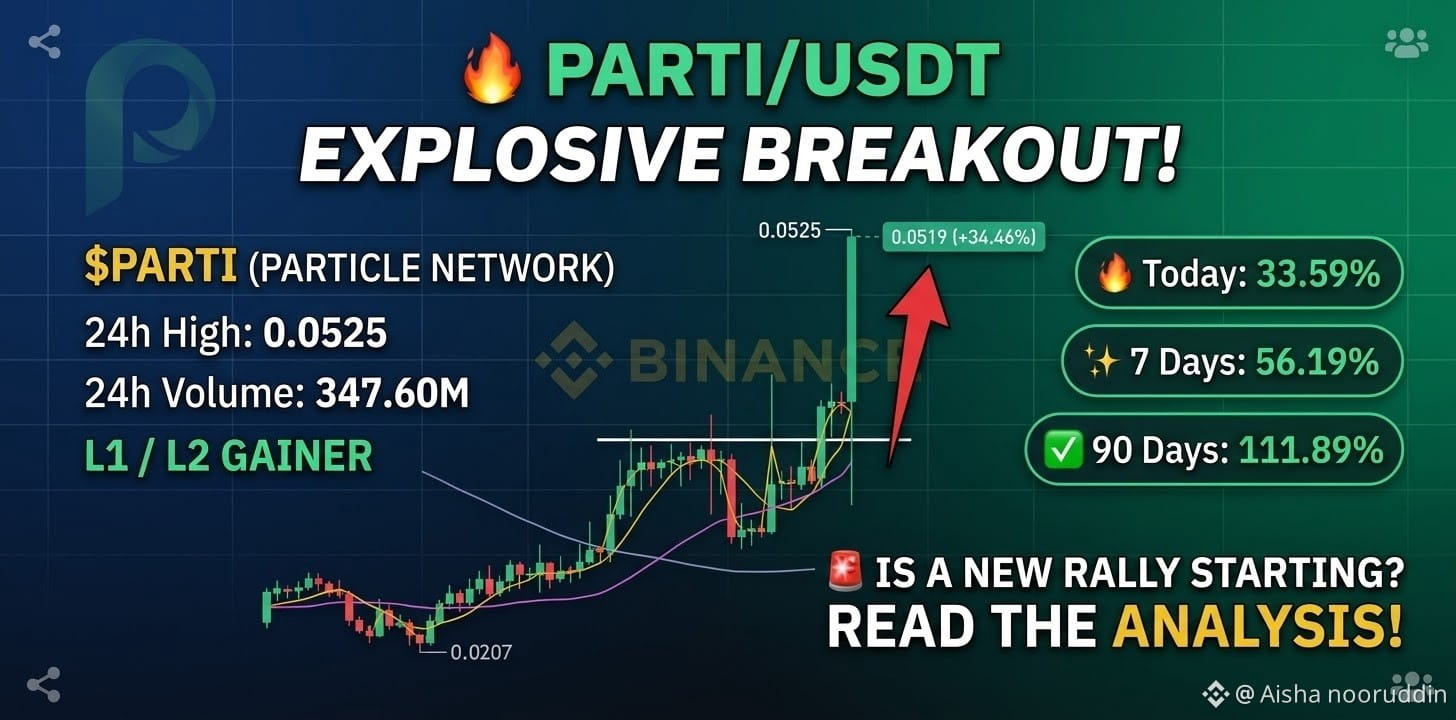
)! After carving out a solid accumulation base near its cycle lows of $0.0207,$PARTI has put on an absolute clinic, printing a powerful bullish vertical surge to hit a 24-hour high of $0.0525.
Let's dive into the technical breakdown of the chart and see what’s next for this Layer 1 / Layer 2 gainer!
📊 Key Market Metrics (1D Chart):
* Current Price: $0.0519 (+34.46%)
* 24h High: $0.0525
* 24h Low: $0.0313
* 24h Volume (PARTI): 347.60M
* 24h Volume (USDT): 13.27M
🔍 Technical Outlook & Price Action
* The Massive Breakout Candle:
Look at that monumental green volume spike on the daily timeframe! After consolidating and respecting moving average bands over the past several weeks, buyers stepped in with heavy conviction, cleanly shattering previous local resistance levels and pushing prices straight up to $0.0525.
* Moving Average (MA) Alignment:
* MA(7) (Yellow): ~0.0383
* MA(25) (Pink): ~0.0344
* MA(99) (Purple): ~0.0272
Price is trading aggressively well above all key moving averages, confirming a fierce short-to-medium-term bullish trend reversal. The rapid expansion of the MA lines signals that momentum is strongly favoring the bulls.
💡 Trading Strategy & What to Watch For:
* The Pullback Watch: Following a massive vertical green candle of over 34%, short-term profit-taking or a healthy retest of breakout zones is always a possibility. Chasing green candles blindly can be risky; look for healthy consolidation or minor pullbacks toward the $0.045 – $0.048 region to find better risk-to-reward entry points.
* Volume Confirmation: The surge is backed by heavy volume (over 347M PARTI traded), showing that this isn't just a low-liquidity flash pump, but a genuine influx of buyer interest.
💬 What's your move? Are you holding your bags, looking to buy the dip, or taking profits here? Let’s discuss in the comments below!
#PARTI #PARTIUSDT #BinanceSquare #CryptoTrading #AltcoinGains #Layer1
The charts are heating up, and altcoin traders are turning their eyes toward Particle Network ($PARTI
)! After carving out a solid accumulation base near its cycle lows of $0.0207,$PARTI has put on an absolute clinic, printing a powerful bullish vertical surge to hit a 24-hour high of $0.0525.
Let's dive into the technical breakdown of the chart and see what’s next for this Layer 1 / Layer 2 gainer!
📊 Key Market Metrics (1D Chart):
* Current Price: $0.0519 (+34.46%)
* 24h High: $0.0525
* 24h Low: $0.0313
* 24h Volume (PARTI): 347.60M
* 24h Volume (USDT): 13.27M
🔍 Technical Outlook & Price Action
* The Massive Breakout Candle:
Look at that monumental green volume spike on the daily timeframe! After consolidating and respecting moving average bands over the past several weeks, buyers stepped in with heavy conviction, cleanly shattering previous local resistance levels and pushing prices straight up to $0.0525.
* Moving Average (MA) Alignment:
* MA(7) (Yellow): ~0.0383
* MA(25) (Pink): ~0.0344
* MA(99) (Purple): ~0.0272
Price is trading aggressively well above all key moving averages, confirming a fierce short-to-medium-term bullish trend reversal. The rapid expansion of the MA lines signals that momentum is strongly favoring the bulls.
💡 Trading Strategy & What to Watch For:
* The Pullback Watch: Following a massive vertical green candle of over 34%, short-term profit-taking or a healthy retest of breakout zones is always a possibility. Chasing green candles blindly can be risky; look for healthy consolidation or minor pullbacks toward the $0.045 – $0.048 region to find better risk-to-reward entry points.
* Volume Confirmation: The surge is backed by heavy volume (over 347M PARTI traded), showing that this isn't just a low-liquidity flash pump, but a genuine influx of buyer interest.
💬 What's your move? Are you holding your bags, looking to buy the dip, or taking profits here? Let’s discuss in the comments below!
#PARTI #PARTIUSDT #BinanceSquare #CryptoTrading #AltcoinGains #Layer1
1
338
Binance ရှိ $LLYB
{spot}(LLYBUSDT)
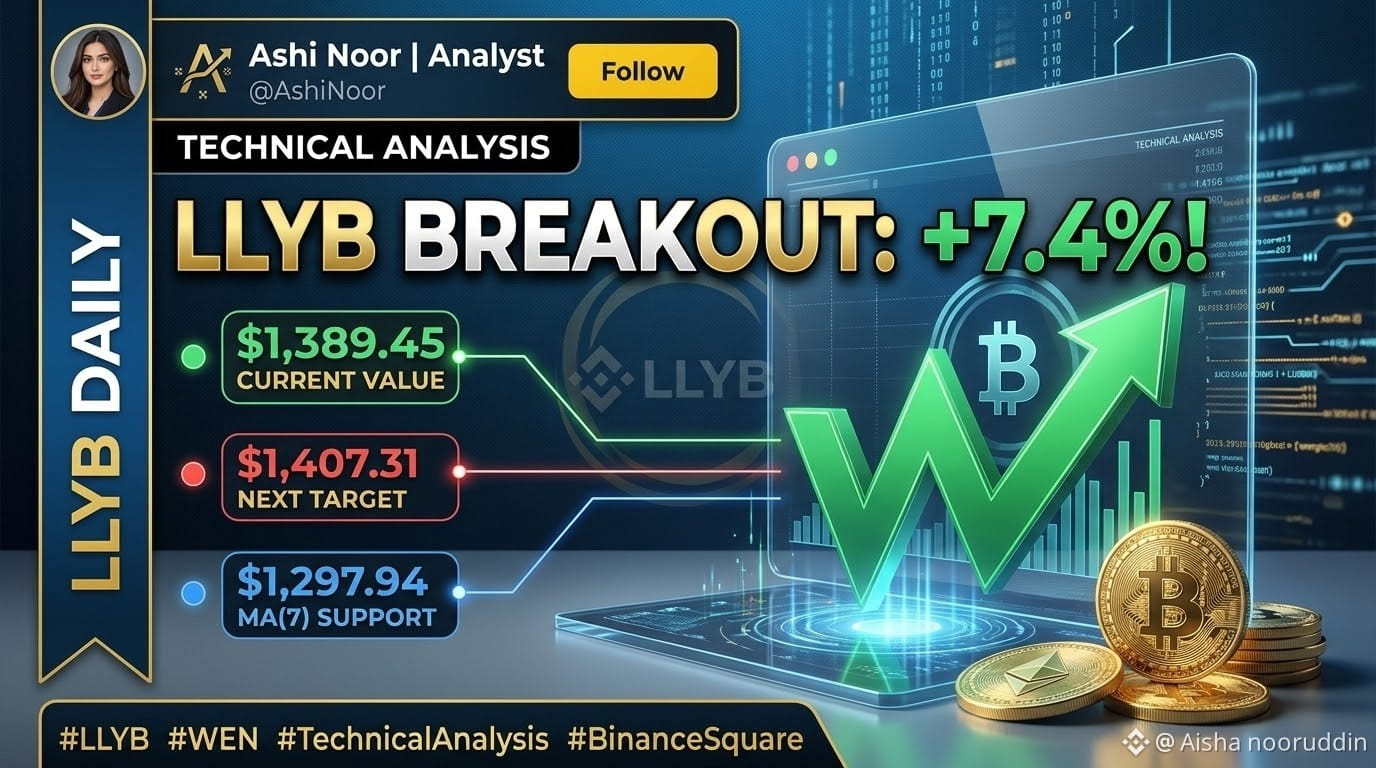
/USDT အတွဲ (Eli Lilly တိုကင်ပြုလုပ်ထားသော စတော့) သည် နေ့စဉ်အရှိန်အဟုန်ကောင်းပြီး ဝယ်ယူမှုအားကောင်းမှုကြောင့် 7.42% မြင့်တက်ကာ $1,389.45 ဖြင့် အရောင်းအဝယ်ဖြစ်နေပါသည်။
📊 အဓိက နည်းပညာဆိုင်ရာ ဈေးနှုန်းအဆင့်များ:
* လက်ရှိဈေးနှုန်း: $1,389.45 (24 နာရီအတွင်း အမြင့်ဆုံး: $1,407.31 | 24 နာရီအတွင်း အနိမ့်ဆုံး: $1,279.63)
* ချက်ချင်းရင်ဆိုင်ရမည့် ခုခံဈေး / ဈေးဖောက်တက်ရန် ရည်မှန်းချက်: $1,407.31
* ကာလတို ထောက်ပံ့ဈေး (MA7): $1,297.94
* အဓိကစက်ဝန်း အနိမ့်ဆုံး / ထောက်ပံ့ဈေးအောက်ခြေ: $1,133.43
💡 အရောင်းအဝယ် အခြေအနေများ:
* အတက်လမ်းကြောင်း ဆက်လက်ဖြစ်နိုင်ခြေ: နေ့စဉ်ပိတ်ဈေးသည် $1,407.31 အမြင့်ဆုံးဈေးထက် အရောင်းအဝယ်ပမာဏများစွာဖြင့် ကျော်လွန်ပါက ဈေးနှုန်းအသစ်များကို ရှာဖွေရန် နည်းပညာပိုင်းအရ လမ်းကြောင်းရှင်းလင်းလာမည်။
* ဈေးပြန်ကျခြင်း / ပြန်လည်စမ်းသပ်ခြင်း: လက်ရှိအမြင့်ဆုံးဈေးအနီးတွင် ဈေးနှုန်းသည် ကာလတိုအတွင်း ငြင်းပယ်ခံရပါက $1,300 – $1,297 (MA7) ထောက်ပံ့ဈေးဇုန်ကို ပြန်လည်စမ်းသပ်ရန် ကျန်းမာသော ဈေးပြင်ဆင်မှု ဖြစ်ပေါ်လာမည်ကို စောင့်ကြည့်ပါ။
⚠️ အန္တရာယ်ကို တင်းကျပ်စွာ စီမံခန့်ခွဲပြီး ဘေးကင်းစွာ အရောင်းအဝယ်လုပ်ပါ!
👇 အသိုင်းအဝိုင်း ဆွေးနွေးမှု:
$LLYB ကို $1,400 ကျော်တက်ဖို့ မျှော်လင့်ပြီး ကိုင်ထားပါသလား၊ ဒါမှမဟုတ် ဈေးကျချိန်မှာ စုဆောင်းဖို့ စောင့်နေပါသလား။ အောက်မှာ ပြောပြပေးပါ! 👇
📌 နေ့စဉ် အရေးပါသော ခရစ်ပ်တိုနှင့် တိုကင်ပြုလုပ်ထားသော ပိုင်ဆိုင်မှုဆိုင်ရာ သုံးသပ်ချက်များအတွက် @Ashi Noor | Analyst ကို Follow လုပ်ပါ!
#Write2Earn #BinanceSquare #LLYB #EliLilly #TokenizedStocks #နည်းပညာပိုင်းသုံးသပ်ချက် $[LLYB]
Binance ရှိ $LLYB
/USDT အတွဲ (Eli Lilly တိုကင်ပြုလုပ်ထားသော စတော့) သည် နေ့စဉ်အရှိန်အဟုန်ကောင်းပြီး ဝယ်ယူမှုအားကောင်းမှုကြောင့် 7.42% မြင့်တက်ကာ $1,389.45 ဖြင့် အရောင်းအဝယ်ဖြစ်နေပါသည်။
📊 အဓိက နည်းပညာဆိုင်ရာ ဈေးနှုန်းအဆင့်များ:
* လက်ရှိဈေးနှုန်း: $1,389.45 (24 နာရီအတွင်း အမြင့်ဆုံး: $1,407.31 | 24 နာရီအတွင်း အနိမ့်ဆုံး: $1,279.63)
* ချက်ချင်းရင်ဆိုင်ရမည့် ခုခံဈေး / ဈေးဖောက်တက်ရန် ရည်မှန်းချက်: $1,407.31
* ကာလတို ထောက်ပံ့ဈေး (MA7): $1,297.94
* အဓိကစက်ဝန်း အနိမ့်ဆုံး / ထောက်ပံ့ဈေးအောက်ခြေ: $1,133.43
💡 အရောင်းအဝယ် အခြေအနေများ:
* အတက်လမ်းကြောင်း ဆက်လက်ဖြစ်နိုင်ခြေ: နေ့စဉ်ပိတ်ဈေးသည် $1,407.31 အမြင့်ဆုံးဈေးထက် အရောင်းအဝယ်ပမာဏများစွာဖြင့် ကျော်လွန်ပါက ဈေးနှုန်းအသစ်များကို ရှာဖွေရန် နည်းပညာပိုင်းအရ လမ်းကြောင်းရှင်းလင်းလာမည်။
* ဈေးပြန်ကျခြင်း / ပြန်လည်စမ်းသပ်ခြင်း: လက်ရှိအမြင့်ဆုံးဈေးအနီးတွင် ဈေးနှုန်းသည် ကာလတိုအတွင်း ငြင်းပယ်ခံရပါက $1,300 – $1,297 (MA7) ထောက်ပံ့ဈေးဇုန်ကို ပြန်လည်စမ်းသပ်ရန် ကျန်းမာသော ဈေးပြင်ဆင်မှု ဖြစ်ပေါ်လာမည်ကို စောင့်ကြည့်ပါ။
⚠️ အန္တရာယ်ကို တင်းကျပ်စွာ စီမံခန့်ခွဲပြီး ဘေးကင်းစွာ အရောင်းအဝယ်လုပ်ပါ!
👇 အသိုင်းအဝိုင်း ဆွေးနွေးမှု:
$LLYB ကို $1,400 ကျော်တက်ဖို့ မျှော်လင့်ပြီး ကိုင်ထားပါသလား၊ ဒါမှမဟုတ် ဈေးကျချိန်မှာ စုဆောင်းဖို့ စောင့်နေပါသလား။ အောက်မှာ ပြောပြပေးပါ! 👇
📌 နေ့စဉ် အရေးပါသော ခရစ်ပ်တိုနှင့် တိုကင်ပြုလုပ်ထားသော ပိုင်ဆိုင်မှုဆိုင်ရာ သုံးသပ်ချက်များအတွက် @Ashi Noor | Analyst ကို Follow လုပ်ပါ!
#Write2Earn #BinanceSquare #LLYB #EliLilly #TokenizedStocks #နည်းပညာပိုင်းသုံးသပ်ချက် $[LLYB]
5
·
--
တက်ရိပ်ရှိသည်
ဘာသာပြန်ဆိုချက် ကြည့်မည်
$HYPE
{spot}(HYPEUSDT)
Pumps +14%! V-Reversal Testing Major Resistance! 🔥📈
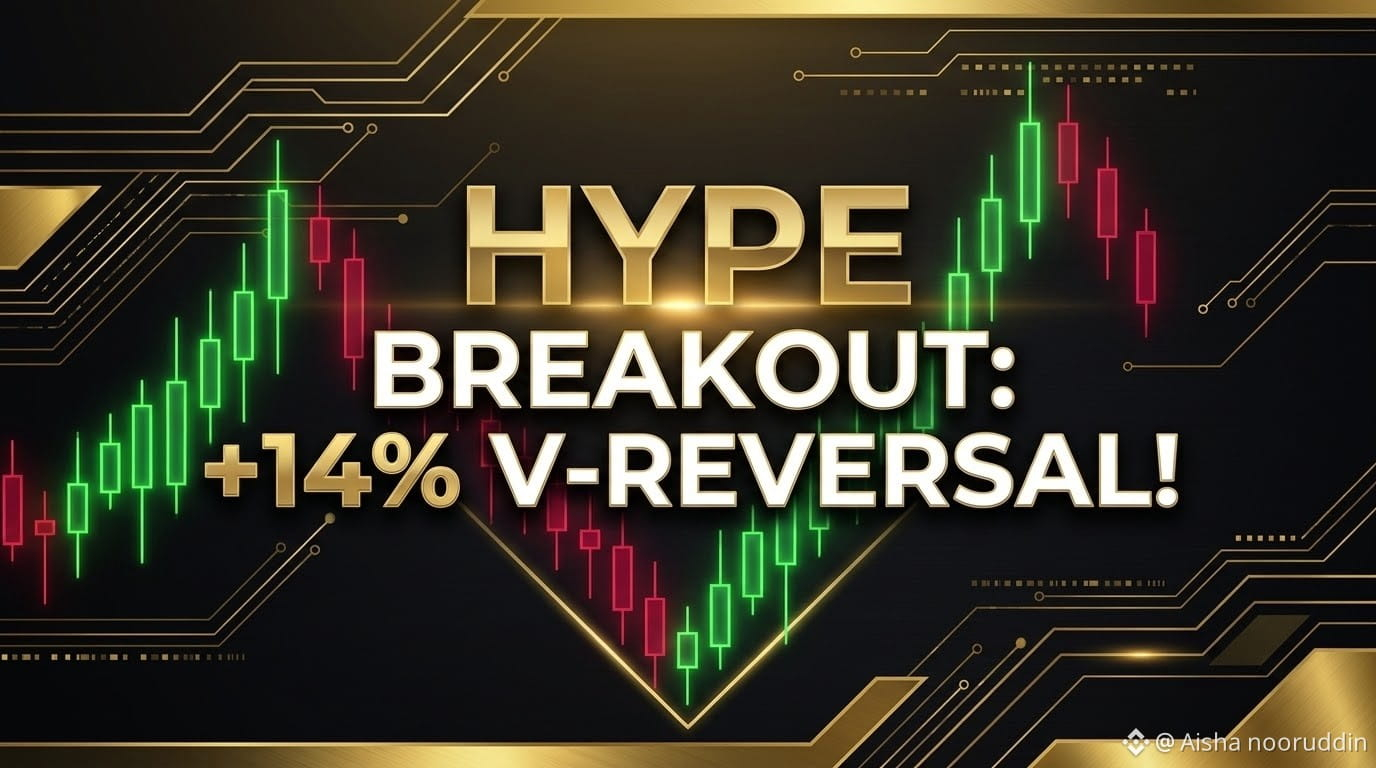
$HYPE /USDT has executed a massive vertical rebound on strong volume, surging +14.21% to $91.21 after finding a strong bottom near $74.45.
📊 Key Technical Levels:
* Current Price: $91.21 (24h High: $92.15 | 24h Low: $78.19)
* Immediate Resistance Target: $95.25 (Recent Swing High)
* Key Dynamic Support (MA25): $82.31
* Short-Term Baseline (MA7): $80.26
* Major Support Floor: $74.45
💡 Trade Scenarios:
* Bullish Continuation: A daily close above $92.15 opens a clear path to retest the $95.25 peak and aim for higher resistance levels.
* Pullback/Correction: If price gets rejected near $92–$95, watch for a healthy pullback toward the $82.31 (MA25) support zone.
⚠️ Volatility is high during V-reversals — practice proper risk management!
👇 Community Discussion:
Are you holding $HYPE for a break past $95, or taking profits here? Drop your strategy below! 👇
📌 Follow @Ashi Noor | Analyst for daily high-probability technical setups!
#Write2Earn #BinanceSquare #HYPE #Hyperliquid #DeFi #TechnicalAnalysis $[HYPE]
$HYPE
Pumps +14%! V-Reversal Testing Major Resistance! 🔥📈
$HYPE /USDT has executed a massive vertical rebound on strong volume, surging +14.21% to $91.21 after finding a strong bottom near $74.45.
📊 Key Technical Levels:
* Current Price: $91.21 (24h High: $92.15 | 24h Low: $78.19)
* Immediate Resistance Target: $95.25 (Recent Swing High)
* Key Dynamic Support (MA25): $82.31
* Short-Term Baseline (MA7): $80.26
* Major Support Floor: $74.45
💡 Trade Scenarios:
* Bullish Continuation: A daily close above $92.15 opens a clear path to retest the $95.25 peak and aim for higher resistance levels.
* Pullback/Correction: If price gets rejected near $92–$95, watch for a healthy pullback toward the $82.31 (MA25) support zone.
⚠️ Volatility is high during V-reversals — practice proper risk management!
👇 Community Discussion:
Are you holding $HYPE for a break past $95, or taking profits here? Drop your strategy below! 👇
📌 Follow @Ashi Noor | Analyst for daily high-probability technical setups!
#Write2Earn #BinanceSquare #HYPE #Hyperliquid #DeFi #TechnicalAnalysis $[HYPE]
280
·
--
တက်ရိပ်ရှိသည်
ဘာသာပြန်ဆိုချက် ကြည့်မည်
$WENB
{spot}(WENBUSDT)
Pumps +15%! Breakout Continuation or Pullback Ahead?
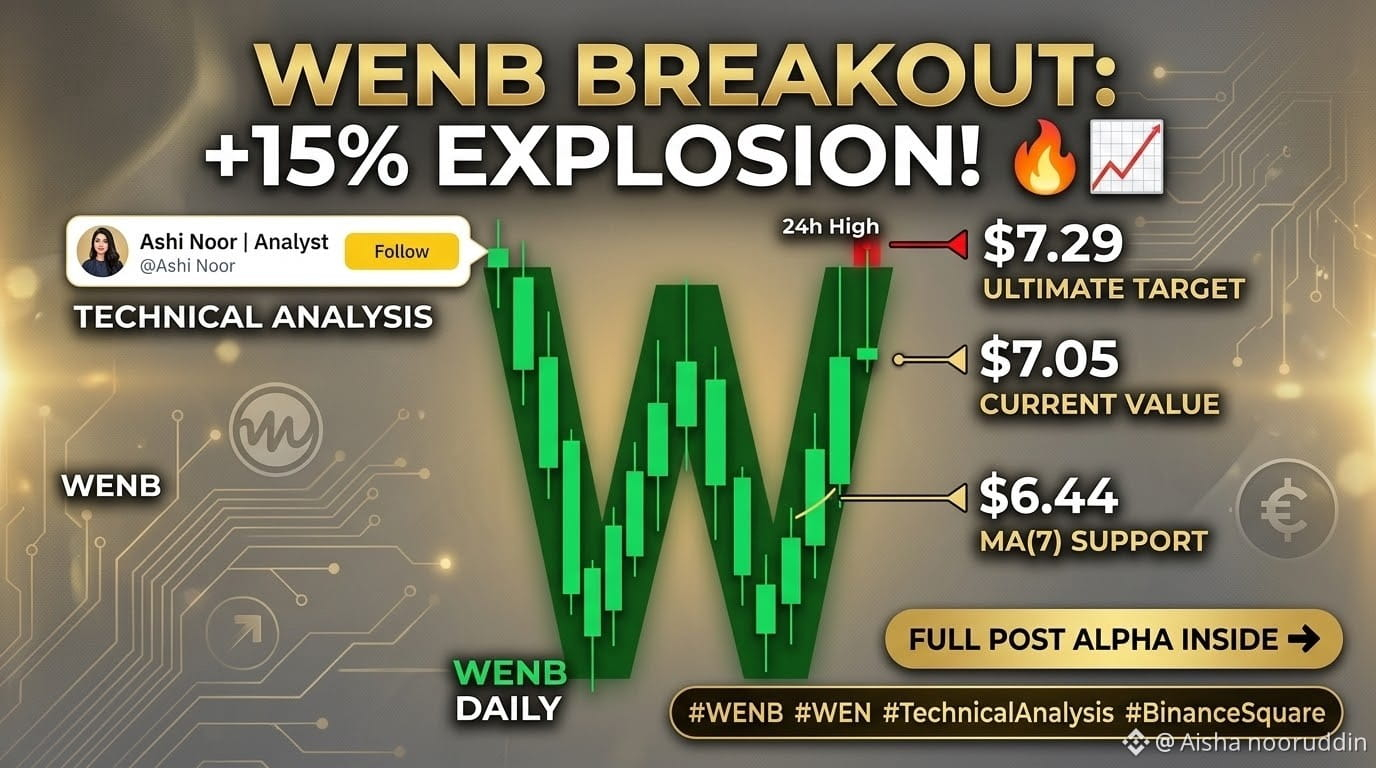
The $WENB /USDT pair surged +15.20% to $7.05, breaking above recent consolidation resistance on strong volume.
📊 Key Technical Levels:
* Current Price: $7.05 (24h High: $7.29 | 24h Low: $6.08)
* Immediate Support (MA7): $6.44
* Intermediate Support (MA25): $6.41
* Breakout Resistance: $7.29
💡 Trade Scenarios:
* Bullish Continuation: Defending the breakout zone opens a path toward retesting the $7.29 high and pushing higher.
* Pullback/Correction: A failure to hold short-term moving averages could trigger a retest of support near $6.41 - $6.44.
⚠️ High volatility asset — manage your risk tightly!
👇 Community Discussion:
Are you longing this breakout or waiting for a dip? Drop your thoughts below! 👇
📌 Follow @Ashi Noor | Analyst for daily technical insights!
#Write2Earn #BinanceSquare #WENB #WEN #TechnicalAnalysis $[WENB
$WENB
Pumps +15%! Breakout Continuation or Pullback Ahead?
The $WENB /USDT pair surged +15.20% to $7.05, breaking above recent consolidation resistance on strong volume.
📊 Key Technical Levels:
* Current Price: $7.05 (24h High: $7.29 | 24h Low: $6.08)
* Immediate Support (MA7): $6.44
* Intermediate Support (MA25): $6.41
* Breakout Resistance: $7.29
💡 Trade Scenarios:
* Bullish Continuation: Defending the breakout zone opens a path toward retesting the $7.29 high and pushing higher.
* Pullback/Correction: A failure to hold short-term moving averages could trigger a retest of support near $6.41 - $6.44.
⚠️ High volatility asset — manage your risk tightly!
👇 Community Discussion:
Are you longing this breakout or waiting for a dip? Drop your thoughts below! 👇
📌 Follow @Ashi Noor | Analyst for daily technical insights!
#Write2Earn #BinanceSquare #WENB #WEN #TechnicalAnalysis $[WENB
54
·
--
ကျရိပ်ရှိသည်
ဘာသာပြန်ဆိုချက် ကြည့်မည်
$MVLLB
{spot}(MVLLBUSDT)
Down -22%! Rebound at $23.12 or Further Crash?
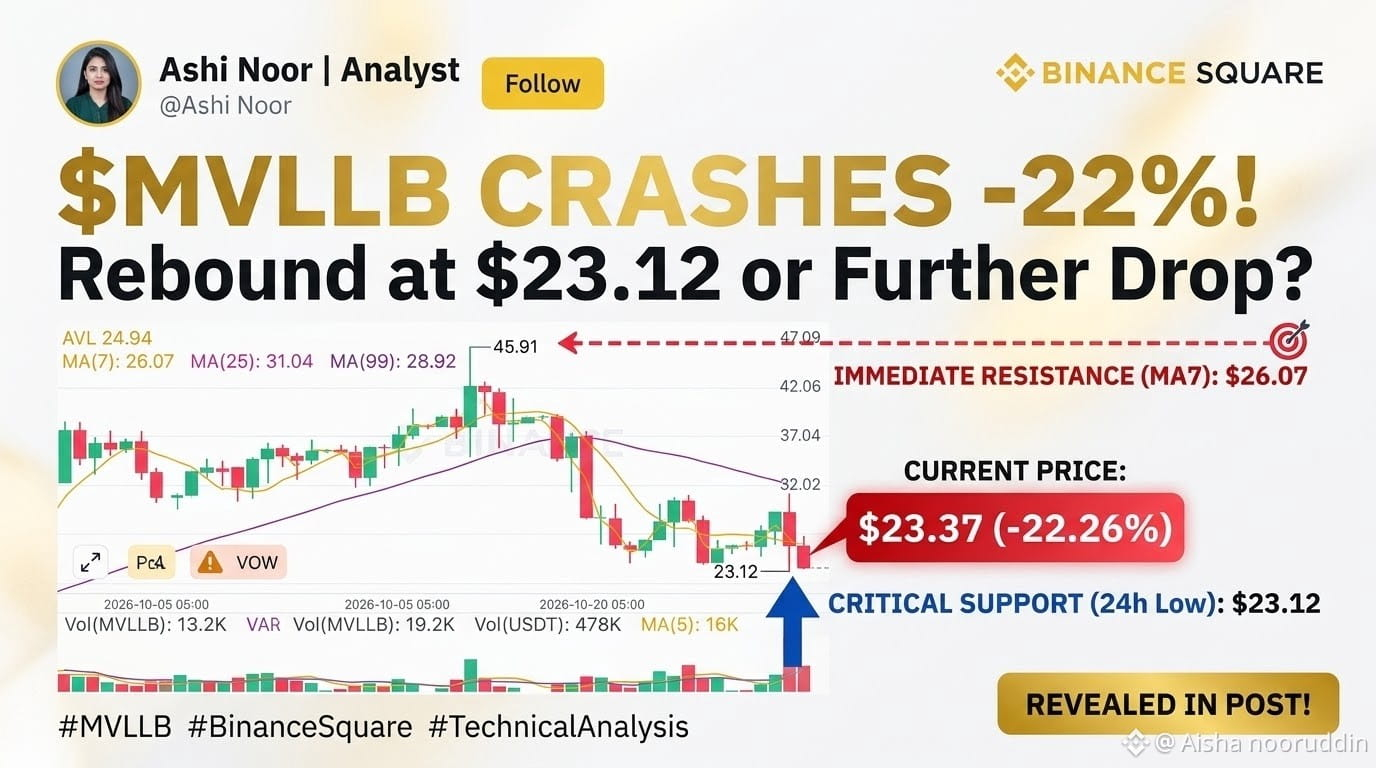
The $MVLLB /USDT daily chart printed a steep -22% red candle, rejecting hard from $31+ resistance down to $23.37 on massive volume.
📊 Key Technical Levels:
* Current Price: $23.37 (24h Low: $23.12 | 24h High: $31.41)
* Immediate Support Floor: $23.12 (Critical 24h Low)
* Overhead Resistance (MA7): $26.07
* Macro Baseline (MA99): $28.92
💡 Trade Scenarios:
* Bullish Relief Bounce: Holding the $23.12 support floor opens a path for a technical relief retest toward $26.07 (MA7).
* Bearish Breakdown: A close below $23.12 signals extended liquidation toward the $21.00 zone.
⚠️ Leveraged ETF asset — manage risk with strict stop-losses!
👇 Community Discussion:
Are you buying the dip near $23.12 or waiting for a deeper pull down? Comment below! 👇
📌 Follow @Ashi Noor | Analyst for daily high-impact technical updates!
#Write2Earn #BinanceSquare #MVLLB #MRVL #TechnicalAnalysis $[MVLLB]
$MVLLB
Down -22%! Rebound at $23.12 or Further Crash?
The $MVLLB /USDT daily chart printed a steep -22% red candle, rejecting hard from $31+ resistance down to $23.37 on massive volume.
📊 Key Technical Levels:
* Current Price: $23.37 (24h Low: $23.12 | 24h High: $31.41)
* Immediate Support Floor: $23.12 (Critical 24h Low)
* Overhead Resistance (MA7): $26.07
* Macro Baseline (MA99): $28.92
💡 Trade Scenarios:
* Bullish Relief Bounce: Holding the $23.12 support floor opens a path for a technical relief retest toward $26.07 (MA7).
* Bearish Breakdown: A close below $23.12 signals extended liquidation toward the $21.00 zone.
⚠️ Leveraged ETF asset — manage risk with strict stop-losses!
👇 Community Discussion:
Are you buying the dip near $23.12 or waiting for a deeper pull down? Comment below! 👇
📌 Follow @Ashi Noor | Analyst for daily high-impact technical updates!
#Write2Earn #BinanceSquare #MVLLB #MRVL #TechnicalAnalysis $[MVLLB]
148

Article
Microsoft သည် AI ကတိကို အကောင်အထည်ဖော်နိုင်မလား: Big Tech ၏ ဒေါ်လာဘီလီယံပေါင်းများစွာတန် လောင်းကြေးနှင့် Crypto ငွေဖြစ်လွယ်မှုအပေါ် ၎င်း၏ သက်ရောက်မှုများ#CanMicrosoftDeliverOnAI 🤖 #
ရေပန်းစားသော အကြောင်းအရာများ Binance Square တွင် ပေါ်လာသည်နှင့်အမျှ #CanMicrosoftDeliverOnAI ဆိုသည့် မေးခွန်းသည် နည်းပညာနှင့် ဘဏ္ဍာရေးဈေးကွက်များတွင် အဓိကအာရုံစိုက်ရာ ဖြစ်လာခဲ့သည်။ Wall Street နှင့် crypto ကုန်သည်များသည် ဉာဏ်ရည်တုအခြေခံအဆောက်အအုံများအတွက် Big Tech ကုမ္ပဏီကြီးများ၏ ကြီးမားလှသော CapEx အသုံးစရိတ်များက ရေရှည်တည်တံ့နိုင်သည့် ဝင်ငွေအဖြစ် ပြောင်းလဲလာခြင်း ရှိမရှိကို စိစစ်လေ့လာနေကြသည်။
ဤသည်မှာ Microsoft ၏ AI အင်ဂျင်၊ အဓိကဈေးကွက်စိန်ခေါ်မှုများနှင့် crypto ကုန်သည်များ ဘာကြောင့် စိတ်ဝင်စားသင့်သည်ဆိုသည့် အကြောင်းအရာများကို ခွဲခြမ်းစိတ်ဖြာဖော်ပြထားခြင်းဖြစ်သည်။
📊 ဆန်းသစ်တီထွင်နိုင်ခြေ (အတက်ဘက်အမြင်):
* လုပ်ငန်းသုံးဖြေရှင်းချက်များနှင့် Azure အသုံးပြုဖြန့်ကျက်မှု:
Microsoft သည် AI ကတိကို အကောင်အထည်ဖော်နိုင်မလား: Big Tech ၏ ဒေါ်လာဘီလီယံပေါင်းများစွာတန် လောင်းကြေးနှင့် Crypto ငွေဖြစ်လွယ်မှုအပေါ် ၎င်း၏ သက်ရောက်မှုများ
#CanMicrosoftDeliverOnAI 🤖 #
ရေပန်းစားသော အကြောင်းအရာများ Binance Square တွင် ပေါ်လာသည်နှင့်အမျှ #CanMicrosoftDeliverOnAI ဆိုသည့် မေးခွန်းသည် နည်းပညာနှင့် ဘဏ္ဍာရေးဈေးကွက်များတွင် အဓိကအာရုံစိုက်ရာ ဖြစ်လာခဲ့သည်။ Wall Street နှင့် crypto ကုန်သည်များသည် ဉာဏ်ရည်တုအခြေခံအဆောက်အအုံများအတွက် Big Tech ကုမ္ပဏီကြီးများ၏ ကြီးမားလှသော CapEx အသုံးစရိတ်များက ရေရှည်တည်တံ့နိုင်သည့် ဝင်ငွေအဖြစ် ပြောင်းလဲလာခြင်း ရှိမရှိကို စိစစ်လေ့လာနေကြသည်။
ဤသည်မှာ Microsoft ၏ AI အင်ဂျင်၊ အဓိကဈေးကွက်စိန်ခေါ်မှုများနှင့် crypto ကုန်သည်များ ဘာကြောင့် စိတ်ဝင်စားသင့်သည်ဆိုသည့် အကြောင်းအရာများကို ခွဲခြမ်းစိတ်ဖြာဖော်ပြထားခြင်းဖြစ်သည်။
📊 ဆန်းသစ်တီထွင်နိုင်ခြေ (အတက်ဘက်အမြင်):
* လုပ်ငန်းသုံးဖြေရှင်းချက်များနှင့် Azure အသုံးပြုဖြန့်ကျက်မှု:
97
Article
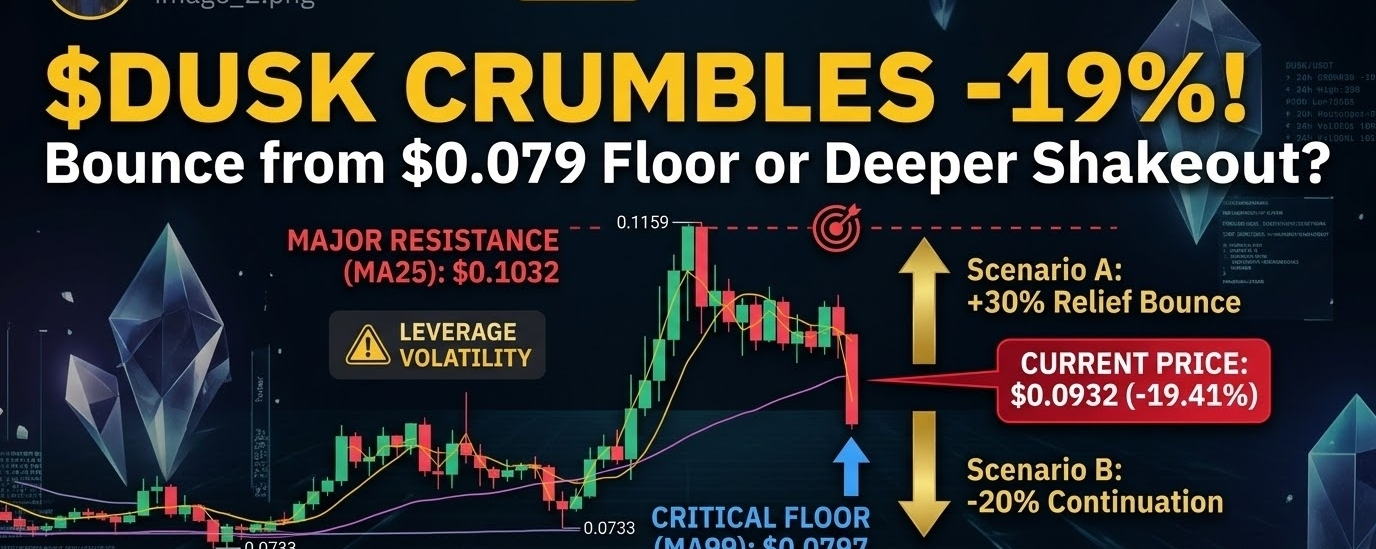
DUSK/USDT သည် ဒေသတွင်း အမြင့်ဆုံးဈေးများမှ လျင်မြန်ပြီး ပြင်းထန်သော ဈေးပြန်ကျမှုကို ကြုံတွေ့ခဲ့သည်။ $0.116 ဝန်းကျင်ရှိ စိတ်ပိုင်းဆိုင်ရာ ခုခံမှုအဆင့်ကို ကျော်ဖြတ်ရန် မအောင်မြင်ပြီးနောက် (၂၄ နာရီအတွင်း အမြင့်ဆုံး: $0.1159)၊$DUSK သည် ယခုအခါ ပြိုလဲနေပြီး -19.41% ကျဆင်းကာ $0.0932 ရှိသည်။
📊 နည်းပညာပိုင်းဆိုင်ရာ သုံးသပ်ချက်နှင့် အညွှန်းကိန်းများကို အသေးစိတ်လေ့လာခြင်း:
* ဒေါင်လိုက် အနီရောင်ဖယောင်းတိုင်နှင့် ဒေသတွင်း ပံ့ပိုးမှုအဆင့် ကျိုးကျမှု: $DUSK ကုန်သွယ်မှုပမာဏ သိသိသာသာမြင့်တက်နေစဉ် ဒေါင်လိုက် bearish engulfing ဖယောင်းတိုင်တစ်ခု ဖြစ်ပေါ်ခဲ့ပြီး၊ အနီးကပ်ရှိ အလျားလိုက် ပံ့ပိုးမှုအဆင့်များကို ရှင်းလင်းစွာ ချိုးဖောက်ခဲ့သည်။
* ရွေ့လျားပျမ်းမျှတန်ဖိုးများ၏ တည်နေရာ: ယခုအခါ ဈေးနှုန်းကျဆင်းမှုသည် အဓိက ပြောင်းလဲနိုင်သော အဆင့်များကို စမ်းသပ်နေသည်။ ကနဦး ဈေးတက်မှုကြောင့် $0.1331 သို့ ရောက်ပြီးနောက် ရွေ့လျားပျမ်းမျှတန်ဖိုးများကြား ကွာဟမှု ပြင်းထန်လာသည်ကို သတိပြုပါ။
DUSK/USDT သည် ဒေသတွင်း အမြင့်ဆုံးဈေးများမှ လျင်မြန်ပြီး ပြင်းထန်သော ဈေးပြန်ကျမှုကို ကြုံတွေ့ခဲ့သည်။
$0.116 ဝန်းကျင်ရှိ စိတ်ပိုင်းဆိုင်ရာ ခုခံမှုအဆင့်ကို ကျော်ဖြတ်ရန် မအောင်မြင်ပြီးနောက် (၂၄ နာရီအတွင်း အမြင့်ဆုံး: $0.1159)၊$DUSK သည် ယခုအခါ ပြိုလဲနေပြီး -19.41% ကျဆင်းကာ $0.0932 ရှိသည်။
📊 နည်းပညာပိုင်းဆိုင်ရာ သုံးသပ်ချက်နှင့် အညွှန်းကိန်းများကို အသေးစိတ်လေ့လာခြင်း:
* ဒေါင်လိုက် အနီရောင်ဖယောင်းတိုင်နှင့် ဒေသတွင်း ပံ့ပိုးမှုအဆင့် ကျိုးကျမှု: $DUSK ကုန်သွယ်မှုပမာဏ သိသိသာသာမြင့်တက်နေစဉ် ဒေါင်လိုက် bearish engulfing ဖယောင်းတိုင်တစ်ခု ဖြစ်ပေါ်ခဲ့ပြီး၊ အနီးကပ်ရှိ အလျားလိုက် ပံ့ပိုးမှုအဆင့်များကို ရှင်းလင်းစွာ ချိုးဖောက်ခဲ့သည်။
* ရွေ့လျားပျမ်းမျှတန်ဖိုးများ၏ တည်နေရာ: ယခုအခါ ဈေးနှုန်းကျဆင်းမှုသည် အဓိက ပြောင်းလဲနိုင်သော အဆင့်များကို စမ်းသပ်နေသည်။ ကနဦး ဈေးတက်မှုကြောင့် $0.1331 သို့ ရောက်ပြီးနောက် ရွေ့လျားပျမ်းမျှတန်ဖိုးများကြား ကွာဟမှု ပြင်းထန်လာသည်ကို သတိပြုပါ။
172
ဘာသာပြန်ဆိုချက် ကြည့်မည်
✨Bismillah-ir-Rahman-ir-Rahim (In the name of Allah, the Most Gracious, the Most Merciful)✨
🌅 Bitcoin Morning Watch: $BTC Testing Key $79.8K Level! Holding Demand or Further Dip? 📊
✨Good morning, Binance Square family! Starting the day with faith and clear focus, let’s dive into today’s morning technical breakdown for Bitcoin (BTC/USDT).
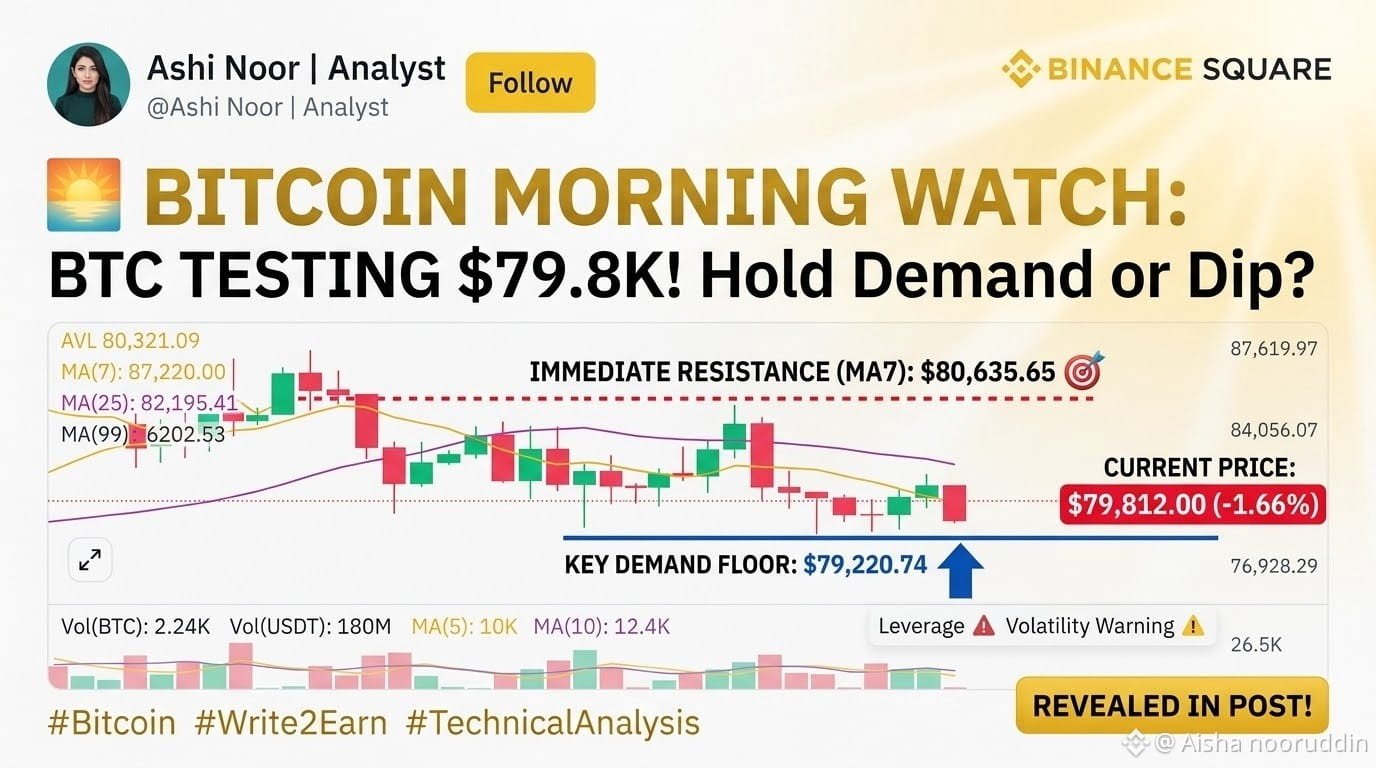
$BTC is currently trading at $79,812.00, down -1.66% over the last 24 hours as sellers push price action back below the psychological $80,000 threshold. After reaching an intraday high of $81,823.00, Bitcoin has retraced close to its local support floor at $79,220.74.
📊 Technical Analysis & Core Indicators:
* Price Action & 24h Range: BTC printed a 24-hour high of $81,823.00 before sliding down to a daily low of $79,710.00. Volume remains high with 13,621.64 BTC ($1.10B USDT) traded over the past 24 hours.
* Moving Average Structure:
* MA(7): Positioned at $80,635.65, acting as immediate overhead dynamic resistance on the daily chart.
* MA(25): Sits higher at $82,195.41, forming a major obstacle that bulls must clear to trigger a trend reversal.
* MA(99): Trending deeply below at $75,202.53, marking the long-term structural baseline.
💡 Trade Setup & Key Scenarios:
* Bullish Reclaim Scenario (Relief Bounce):
If bulls defend the immediate $79,220 – $79,710 demand zone, watch for a push back toward $80,635 (MA7). A daily close above $80.6K is necessary to signal short-term stabilization toward $82,195 (MA25).
* Bearish Breakdown Scenario (Support Test):
If the local demand floor at $79,220.74 fails to hold under selling pressure, expect an extended pullback toward secondary liquidity pockets around $76,928 and the macro MA(99) baseline at $75.2K.
👇 Community Discussion:
Is $BTC getting ready to bounce from the $79.2K demand floor, or are we sweeping lower before the weekend? Drop your trade setups below! 👇
📌 Follow @Ashi Noor | Analyst for daily high-impact market analysis and alpha setups!
#Write2Earn #BinanceSquare #Bitcoin #BTC #TechnicalAnalysis
{spot}(BTCUSDT)
✨Bismillah-ir-Rahman-ir-Rahim (In the name of Allah, the Most Gracious, the Most Merciful)✨
🌅 Bitcoin Morning Watch: $BTC Testing Key $79.8K Level! Holding Demand or Further Dip? 📊
✨Good morning, Binance Square family! Starting the day with faith and clear focus, let’s dive into today’s morning technical breakdown for Bitcoin (BTC/USDT).
$BTC is currently trading at $79,812.00, down -1.66% over the last 24 hours as sellers push price action back below the psychological $80,000 threshold. After reaching an intraday high of $81,823.00, Bitcoin has retraced close to its local support floor at $79,220.74.
📊 Technical Analysis & Core Indicators:
* Price Action & 24h Range: BTC printed a 24-hour high of $81,823.00 before sliding down to a daily low of $79,710.00. Volume remains high with 13,621.64 BTC ($1.10B USDT) traded over the past 24 hours.
* Moving Average Structure:
* MA(7): Positioned at $80,635.65, acting as immediate overhead dynamic resistance on the daily chart.
* MA(25): Sits higher at $82,195.41, forming a major obstacle that bulls must clear to trigger a trend reversal.
* MA(99): Trending deeply below at $75,202.53, marking the long-term structural baseline.
💡 Trade Setup & Key Scenarios:
* Bullish Reclaim Scenario (Relief Bounce):
If bulls defend the immediate $79,220 – $79,710 demand zone, watch for a push back toward $80,635 (MA7). A daily close above $80.6K is necessary to signal short-term stabilization toward $82,195 (MA25).
* Bearish Breakdown Scenario (Support Test):
If the local demand floor at $79,220.74 fails to hold under selling pressure, expect an extended pullback toward secondary liquidity pockets around $76,928 and the macro MA(99) baseline at $75.2K.
👇 Community Discussion:
Is $BTC getting ready to bounce from the $79.2K demand floor, or are we sweeping lower before the weekend? Drop your trade setups below! 👇
📌 Follow @Ashi Noor | Analyst for daily high-impact market analysis and alpha setups!
#Write2Earn #BinanceSquare #Bitcoin #BTC #TechnicalAnalysis
48
ဘာသာပြန်ဆိုချက် ကြည့်မည်
The $SOL
{spot}(SOLUSDT)
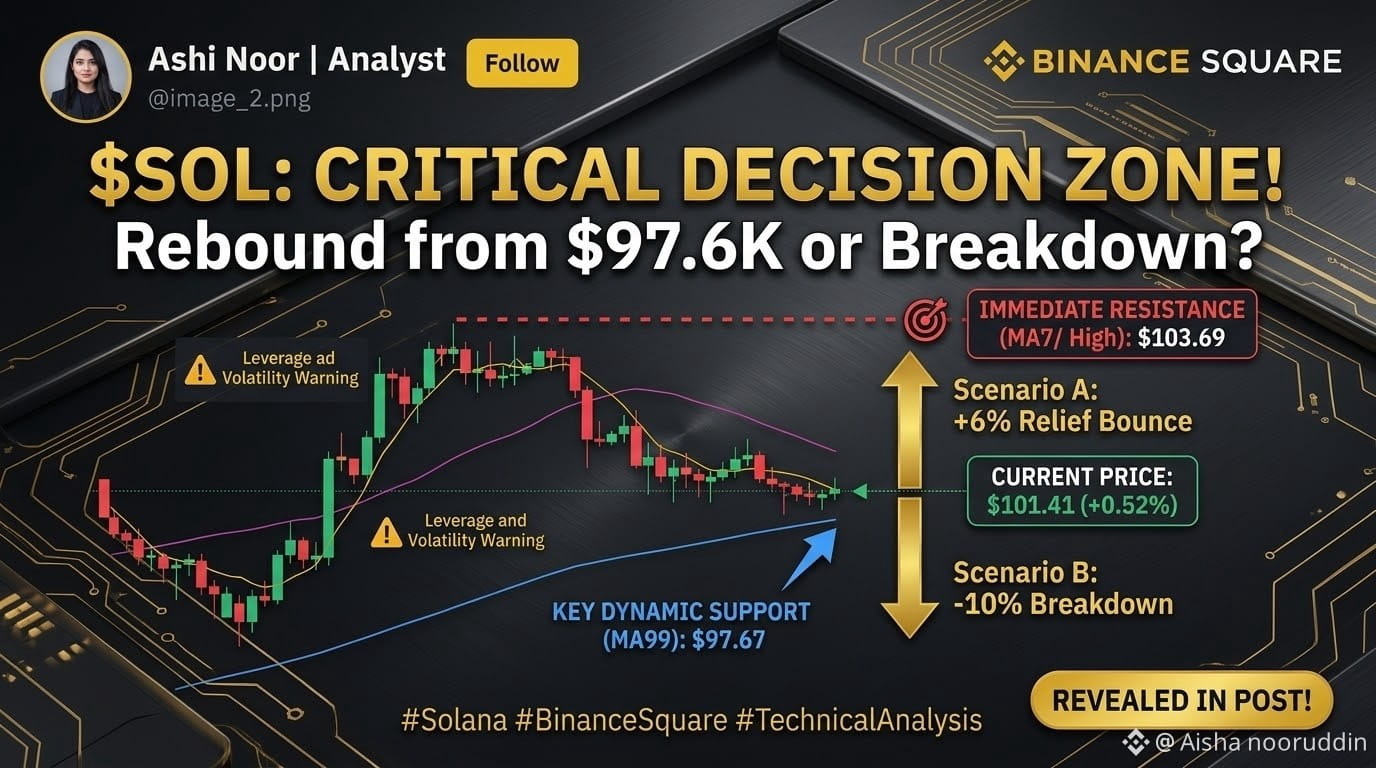
/USDT is the technical battleground today, currently trading at $101.41 (+0.52%) as price action consolidates just above crucial macro support. Solana is compressed between dynamic moving average clusters, setting up a major breakout or breakdown opportunity. Are we looking at a relief bounce or further downside?
📊 Technical Analysis & Core Indicators:
* Consolidation Pattern: Following the swift correction from $125+, $SOL has entered a tight consolidation range between $98 and $104. Look at that immediate price floor holding at $98.62 on the chart.
* Moving Average Clusteter:
* Overhead Resistance (MA7 & High): Immediate selling pressure is found near the intraday high of $103.69 and the short-term 7-day Moving Average (yellow line).
* Dynamic Floor (MA99): broader structural support is sitting right below current price action at $97.67 (purple MA line). A daily close below this line invalidates the immediate recovery thesis.
💡 Trade Setup & Key Scenarios:
Here are the potential scenarios for the next few sessions:
* Scenario A: Bullish Relief Bounce (+6%): Look for an accumulation bounce from the MA99 support floor. A daily candle close above immediate high resistance at $103.69 confirms bullish recovery momentum toward immediate mid-range targets near $110+.
* Scenario B: Bearish Breakdown (-10%): Failure to regain the MA(7) near $102 could trigger heavy selling pressure. If $SOL prints a decisive daily close below the dynamic baseline support at $97.67, expect a breakdown acceleration toward deeper demand zones near $90 and $85.
👇 Community Discussion:
Is Solana leading the Layer 1 bounce back to $110, or are you waiting for a deep retest of $90 first? Drop your trades and profit targets below! 👇
📌 Follow @Ashi Noor | Analyst for daily high-impact technical alpha!
#Write2Earn #BinanceSquare #Solana #SOL #TecnicalAnalysis #Layer1 #CryptoTrading $[SOL]
The $SOL
/USDT is the technical battleground today, currently trading at $101.41 (+0.52%) as price action consolidates just above crucial macro support. Solana is compressed between dynamic moving average clusters, setting up a major breakout or breakdown opportunity. Are we looking at a relief bounce or further downside?
📊 Technical Analysis & Core Indicators:
* Consolidation Pattern: Following the swift correction from $125+, $SOL has entered a tight consolidation range between $98 and $104. Look at that immediate price floor holding at $98.62 on the chart.
* Moving Average Clusteter:
* Overhead Resistance (MA7 & High): Immediate selling pressure is found near the intraday high of $103.69 and the short-term 7-day Moving Average (yellow line).
* Dynamic Floor (MA99): broader structural support is sitting right below current price action at $97.67 (purple MA line). A daily close below this line invalidates the immediate recovery thesis.
💡 Trade Setup & Key Scenarios:
Here are the potential scenarios for the next few sessions:
* Scenario A: Bullish Relief Bounce (+6%): Look for an accumulation bounce from the MA99 support floor. A daily candle close above immediate high resistance at $103.69 confirms bullish recovery momentum toward immediate mid-range targets near $110+.
* Scenario B: Bearish Breakdown (-10%): Failure to regain the MA(7) near $102 could trigger heavy selling pressure. If $SOL prints a decisive daily close below the dynamic baseline support at $97.67, expect a breakdown acceleration toward deeper demand zones near $90 and $85.
👇 Community Discussion:
Is Solana leading the Layer 1 bounce back to $110, or are you waiting for a deep retest of $90 first? Drop your trades and profit targets below! 👇
📌 Follow @Ashi Noor | Analyst for daily high-impact technical alpha!
#Write2Earn #BinanceSquare #Solana #SOL #TecnicalAnalysis #Layer1 #CryptoTrading $[SOL]
67
·
--
တက်ရိပ်ရှိသည်
ဘာသာပြန်ဆိုချက် ကြည့်မည်
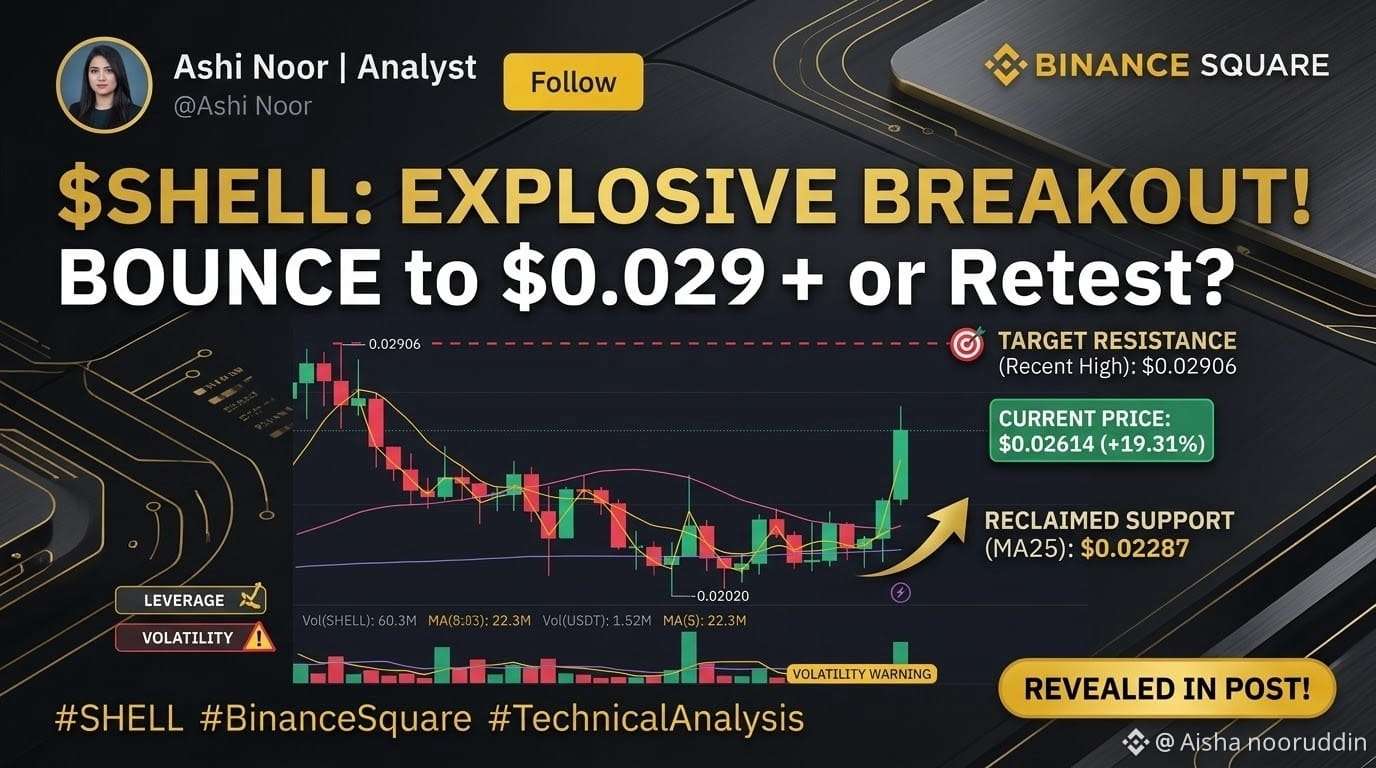
The $SHELL /USDT (MyShell) has ignited with a massive vertical gainer candle, executing an explosive trend reversal from local lows. Currently trading at $0.02614, $SHELL has locked in impressive 24-hour gains of +19.31%, leading the 'AI' category on the gainer board. Is a massive parabolic run beginning?
📊 Key Technical Levels to Watch:
* Current Price: $0.02614 (24h Low: $0.02155 | 24h High: $0.02694)
* Immediate Resistance Reclaimed (MA25): The massive vertical spike has aggressively cleared and closed above the immediate MA(25) resistance at $0.02287, which now flips into critical dynamic support.
* Macro Baseline (MA99): The long-term technical baseline sits just below at $0.02204, acting as a deeper support floor.
💡 Trade Setup & Scenarios:
* Bullish Scenario (Continuation): Securing daily closes above $0.026 confirms immediate bullish continuation momentum. Bulls are targeting a retest of the previous high at $0.02906 and a breakout toward $0.032+. The massive volume spike validates demand.
* Re-test Scenario (Shakeout): If the rally slows, look for a standard retest and successful validation of the newly reclaimed MA(25) at $0.02287 as support to form a higher local low.
⚠️ Volatility is extremely high as volume explodes. Manage risk, avoid high leverage, and use stop-losses.
👇 Community Discussion:
Are you chasing the breakout or waiting for a healthy retest of the MA(25) near $0.023? Share your trade plans and price targets below! 👇
📌 Follow @Ashi Noor | Analyst for daily high-impact technical updates!
#Write2Earn #BinanceSquare #SHELL #AI #TechnicalAnalysis #MyShell #CryptoTrading $[SHELL]
{spot}(SHELLUSDT)
The $SHELL /USDT (MyShell) has ignited with a massive vertical gainer candle, executing an explosive trend reversal from local lows. Currently trading at $0.02614, $SHELL has locked in impressive 24-hour gains of +19.31%, leading the 'AI' category on the gainer board. Is a massive parabolic run beginning?
📊 Key Technical Levels to Watch:
* Current Price: $0.02614 (24h Low: $0.02155 | 24h High: $0.02694)
* Immediate Resistance Reclaimed (MA25): The massive vertical spike has aggressively cleared and closed above the immediate MA(25) resistance at $0.02287, which now flips into critical dynamic support.
* Macro Baseline (MA99): The long-term technical baseline sits just below at $0.02204, acting as a deeper support floor.
💡 Trade Setup & Scenarios:
* Bullish Scenario (Continuation): Securing daily closes above $0.026 confirms immediate bullish continuation momentum. Bulls are targeting a retest of the previous high at $0.02906 and a breakout toward $0.032+. The massive volume spike validates demand.
* Re-test Scenario (Shakeout): If the rally slows, look for a standard retest and successful validation of the newly reclaimed MA(25) at $0.02287 as support to form a higher local low.
⚠️ Volatility is extremely high as volume explodes. Manage risk, avoid high leverage, and use stop-losses.
👇 Community Discussion:
Are you chasing the breakout or waiting for a healthy retest of the MA(25) near $0.023? Share your trade plans and price targets below! 👇
📌 Follow @Ashi Noor | Analyst for daily high-impact technical updates!
#Write2Earn #BinanceSquare #SHELL #AI #TechnicalAnalysis #MyShell #CryptoTrading $[SHELL]
1
144
ဘာသာပြန်ဆိုချက် ကြည့်မည်
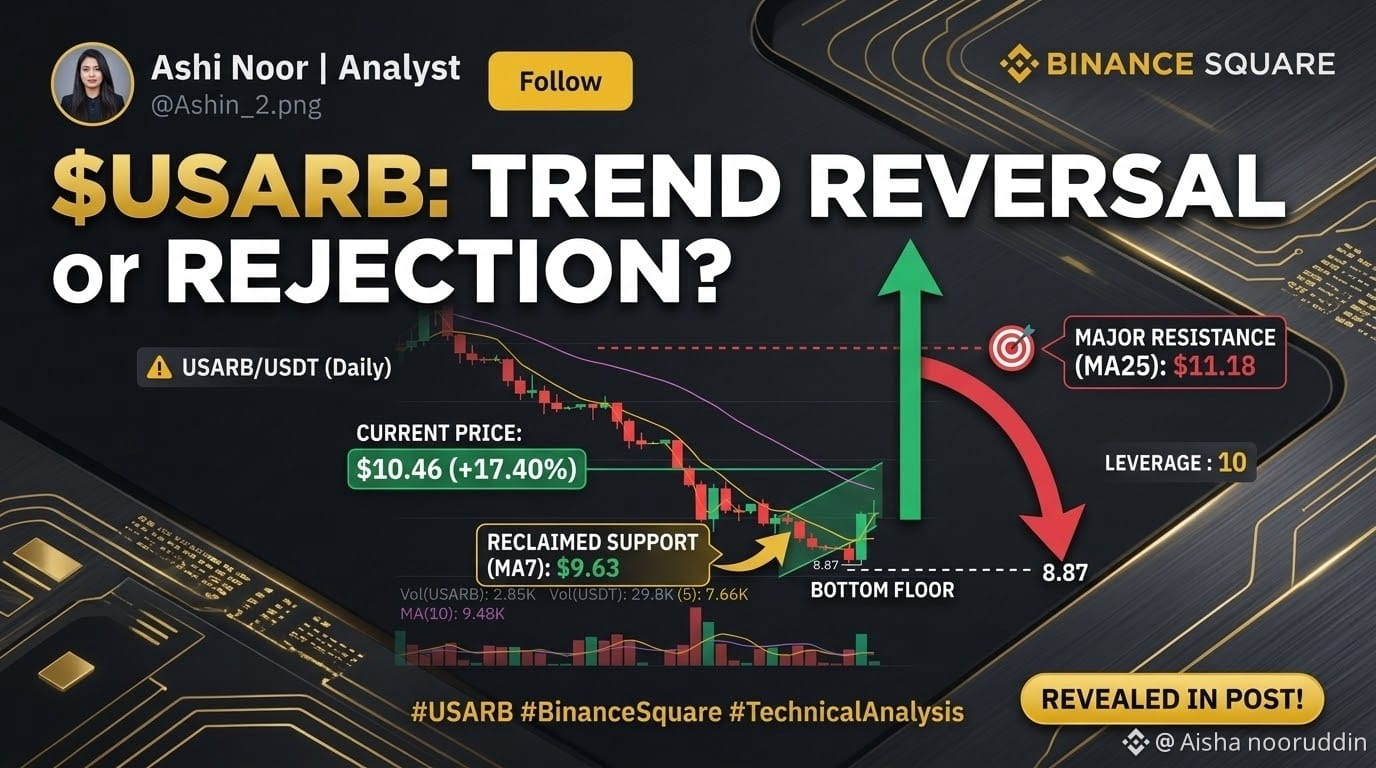
$USARB
{spot}(USARBUSDT)
Bounce from Lows! Reclaim MA(25) at $11.18 or Face Rejection? ⚡
The $USARB /USDT (USA Rare Earth bStocks) daily chart is showing signs of life after a strong bullish bounce, currently up +17.40% at $10.46 as buyers step in off the $8.87 bottom floor.
📊 Key Technical Levels to Watch:
* Current Price: $10.46 (24h High: $10.49 | 24h Low: $8.87)
* Dynamic Support Reclaimed (MA7): Price has pushed back above the 7-day Moving Average at $9.63, signaling early dynamic recovery momentum.
* Overhead Resistance (MA25): The major hurdle sits higher at $11.18, which bulls must break to confirm a full trend reversal.
⚠️ Volume is picking up ($224K USDT 24h vol), but manage risk closely as macro trends remain sensitive.
👇 Community Discussion:
Is $USARB initiating a multi-week trend reversal back toward $12+, or is this just a short-lived relief bounce before testing $8.87 again? Drop your trades below! 👇
📌 Follow @Ashi Noor | Analyst for daily high-impact technical setups!
#Write2Earn #BinanceSquare #USARB #TechnicalAnalysis #bStocks #CryptoTrading $[USARB]
$USARB
Bounce from Lows! Reclaim MA(25) at $11.18 or Face Rejection? ⚡
The $USARB /USDT (USA Rare Earth bStocks) daily chart is showing signs of life after a strong bullish bounce, currently up +17.40% at $10.46 as buyers step in off the $8.87 bottom floor.
📊 Key Technical Levels to Watch:
* Current Price: $10.46 (24h High: $10.49 | 24h Low: $8.87)
* Dynamic Support Reclaimed (MA7): Price has pushed back above the 7-day Moving Average at $9.63, signaling early dynamic recovery momentum.
* Overhead Resistance (MA25): The major hurdle sits higher at $11.18, which bulls must break to confirm a full trend reversal.
⚠️ Volume is picking up ($224K USDT 24h vol), but manage risk closely as macro trends remain sensitive.
👇 Community Discussion:
Is $USARB initiating a multi-week trend reversal back toward $12+, or is this just a short-lived relief bounce before testing $8.87 again? Drop your trades below! 👇
📌 Follow @Ashi Noor | Analyst for daily high-impact technical setups!
#Write2Earn #BinanceSquare #USARB #TechnicalAnalysis #bStocks #CryptoTrading $[USARB]
80
ဘာသာပြန်ဆိုချက် ကြည့်မည်
,,✨Bismillah-ir-Rahman-ir-Rahim (In the name of Allah, the Most Gracious, the Most Merciful)✨
🌄Good morning, Binance Square family! Starting the day with faith and sharp focus, let’s dive into the morning technical update for Bitcoin ($BTC
{spot}(BTCUSDT)
/USDT).
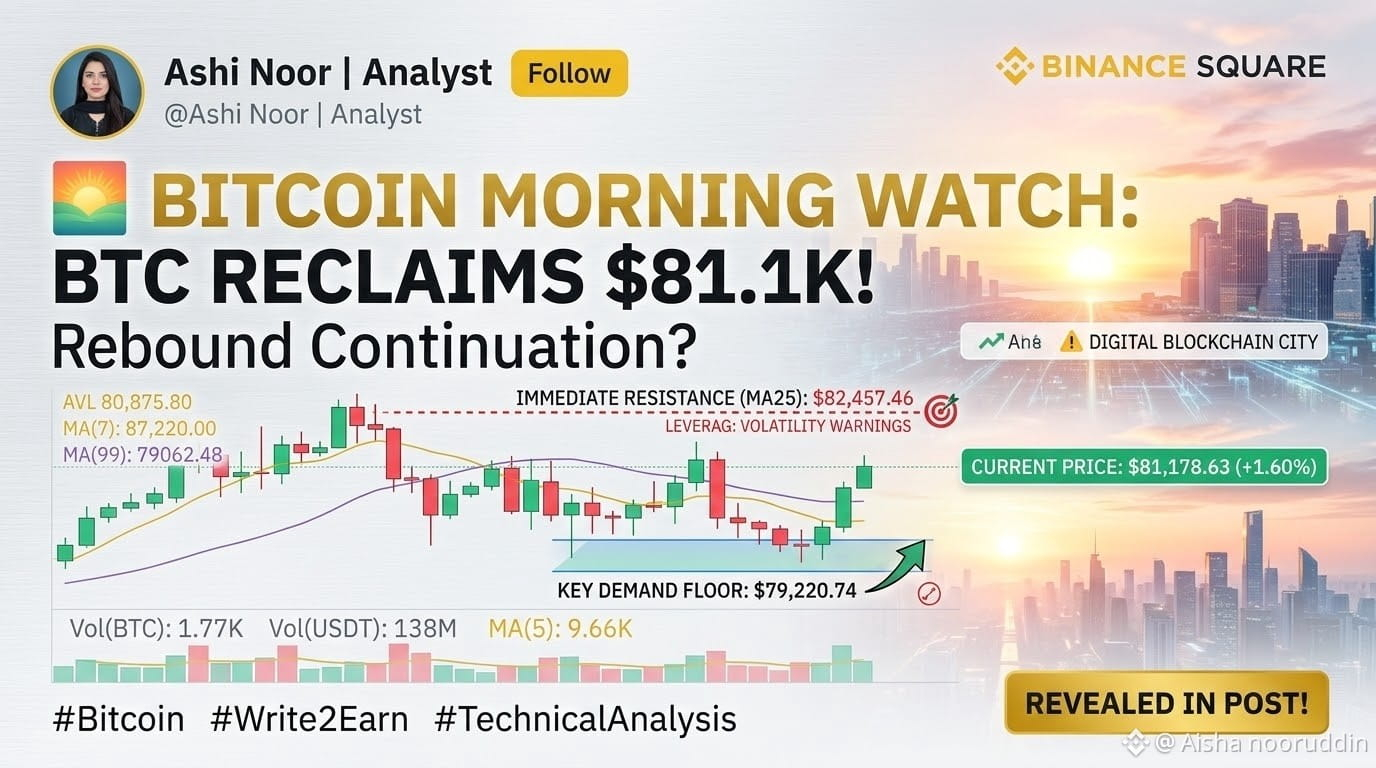
$BTC is currently trading at $81,178.63, showing a +1.60% green recovery in the last 24 hours as bulls step in to defend lower structural supports. After bouncing from the local demand floor at $79,220.74, Bitcoin is fighting its way back upward.
📊 Technical Analysis & Core Indicators:
* Price Action & 24h Range: BTC printed a 24-hour low of $79,506.00 before pushing upward to test an intraday peak of $81,300.00. Volume remains active with 12,703.27 BTC traded over the last day.
* Moving Average Cluster:
* MA(7): Positioned closely at $80,949.86, which price has successfully crossed back above, signaling a positive short-term momentum shift.
* MA(25): Sits at $82,457.46, serving as the primary overhead resistance target for the bulls.
* MA(99): Resting lower at $78,062.48, maintaining the broader structural baseline.
💡 Trade Setup & Key Scenarios:
* Bullish Reclaim Scenario (Continuation):
If bulls can sustain momentum and break firmly above the $81,500 – $82,457 (MA25) resistance cluster, expect an accelerated push toward mid-range targets.
* Pullback / Re-test Scenario:
If the morning rally encounters heavy selling pressure near the daily highs, watch for a healthy re-test of the $80,875 (AVL) to $80,949 (MA7) support zone to maintain bullish structure.
👇 Community Discussion:
With $BTC pushing back above $81.1K this morning, are we heading straight to retest the MA(25) at $82.4K, or will we see another sweep of the lows? Drop your morning trades below! 👇
📌 Follow @Ashi Noor | Analyst for daily high-impact technical analysis and market alpha!
#Write2Earn #BinanceSquare #Bitcoin #BTC #TechnicalAnalysis #CryptoTrading $[BTC]
,,✨Bismillah-ir-Rahman-ir-Rahim (In the name of Allah, the Most Gracious, the Most Merciful)✨
🌄Good morning, Binance Square family! Starting the day with faith and sharp focus, let’s dive into the morning technical update for Bitcoin ($BTC
/USDT).
$BTC is currently trading at $81,178.63, showing a +1.60% green recovery in the last 24 hours as bulls step in to defend lower structural supports. After bouncing from the local demand floor at $79,220.74, Bitcoin is fighting its way back upward.
📊 Technical Analysis & Core Indicators:
* Price Action & 24h Range: BTC printed a 24-hour low of $79,506.00 before pushing upward to test an intraday peak of $81,300.00. Volume remains active with 12,703.27 BTC traded over the last day.
* Moving Average Cluster:
* MA(7): Positioned closely at $80,949.86, which price has successfully crossed back above, signaling a positive short-term momentum shift.
* MA(25): Sits at $82,457.46, serving as the primary overhead resistance target for the bulls.
* MA(99): Resting lower at $78,062.48, maintaining the broader structural baseline.
💡 Trade Setup & Key Scenarios:
* Bullish Reclaim Scenario (Continuation):
If bulls can sustain momentum and break firmly above the $81,500 – $82,457 (MA25) resistance cluster, expect an accelerated push toward mid-range targets.
* Pullback / Re-test Scenario:
If the morning rally encounters heavy selling pressure near the daily highs, watch for a healthy re-test of the $80,875 (AVL) to $80,949 (MA7) support zone to maintain bullish structure.
👇 Community Discussion:
With $BTC pushing back above $81.1K this morning, are we heading straight to retest the MA(25) at $82.4K, or will we see another sweep of the lows? Drop your morning trades below! 👇
📌 Follow @Ashi Noor | Analyst for daily high-impact technical analysis and market alpha!
#Write2Earn #BinanceSquare #Bitcoin #BTC #TechnicalAnalysis #CryptoTrading $[BTC]
89
Log in to explore more content
Join global crypto users on Binance Square
⚡️ Get latest and useful information about crypto.
💬 Trusted by the world’s largest crypto exchange.
👍 Discover real insights from verified creators.
အီးမေးလ် / ဖုန်းနံပါတ်
ရေပန်းစားနေသော ခေါင်းစဉ်များ
WithdrawalsBack: 15 networks live
ကြည့်ရှုမှု 126 ကြိမ်
12 ဦး ဆွေးနွေးနေသည်
Binance သတင်းအပ်ဒိတ် | Binance သည် ကွန်ရက် ၁၅ ခုတွင် BTC၊ ETH၊ USDT နှင့် အခြားပိုင်ဆိုင်မှုများအတွက် ငွေထုတ်ယူမှုများကို ပြန်လည်ဖွင့်လှစ်ကာ တနင်္ဂနွေနေ့ ပစ်မှတ်ကို ပြည့်မီ
Binance News
·နှစ်သက်မှု 17 ခု
·ကြည့်ရှုမှု 7.6k ကြိမ်
BinanceUpdatesProofofReservesAddresses
ကြည့်ရှုမှု 29,176 ကြိမ်
682 ဦး ဆွေးနွေးနေသည်
BinanceToResumePhaseOneOfWithdrawals
ကြည့်ရှုမှု 60,885 ကြိမ်
957 ဦး ဆွေးနွေးနေသည်