
Amazingtradersjg
29 ပို့စ်များ

Amazingtradersjg
တိုင်ကြားမည်
သုံးစွဲသူကို ဘလော့မည်
အမှန်တကယ်ရောင်းဝယ်နေ
Frequent Trader
3.6 နှစ်
3 ဖော်လိုလုပ်ထားသည်
6 ဖော်လိုလုပ်သူများ
7 လိုက်ခ်လုပ်ထားသည်
ပို့စ်များ
ပိုင်ဆိုင်မှုစာရင်း
ဘာသာပြန်ဆိုချက် ကြည့်မည်
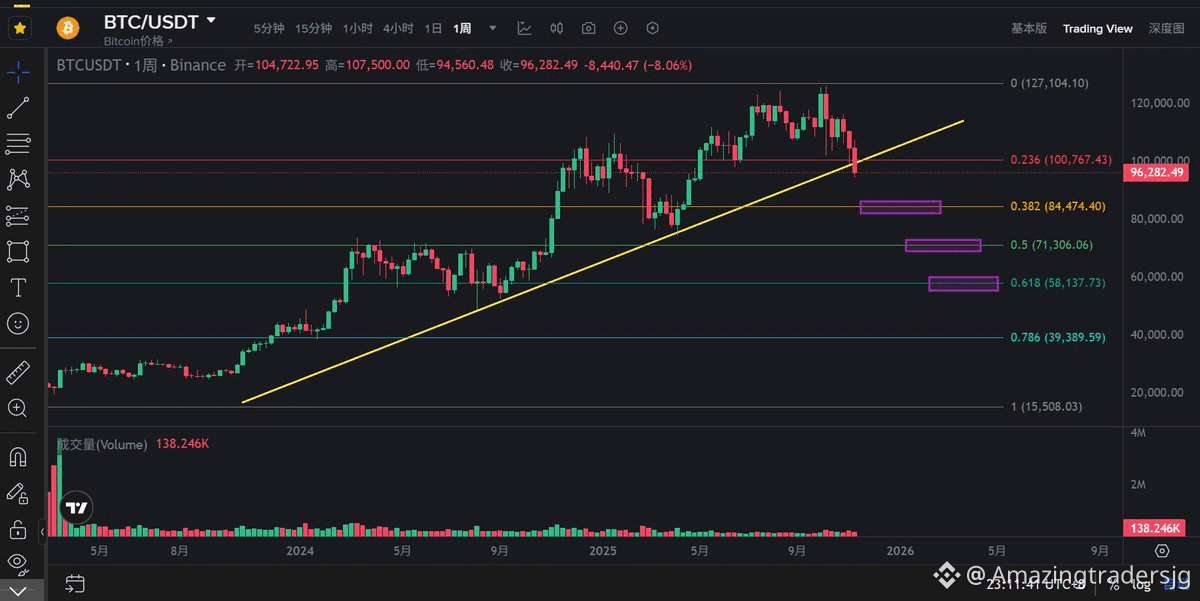
Bitcoin (BTC/USDT) is trading near $63,448 with a short-term neutral-to-negative outlook, testing a demand zone between $62,700 and $62,950. Near-term forecasts see potential consolidation between $60,000 and $65,000, while longer-term models estimate recovery toward $78,000 by late 2026.
#BTC🔥🔥🔥🔥🔥 #BitcoinMaximalism
Bitcoin (BTC/USDT) is trading near $63,448 with a short-term neutral-to-negative outlook, testing a demand zone between $62,700 and $62,950. Near-term forecasts see potential consolidation between $60,000 and $65,000, while longer-term models estimate recovery toward $78,000 by late 2026.
#BTC🔥🔥🔥🔥🔥 #BitcoinMaximalism
#BTC🔥🔥🔥🔥🔥 #BitcoinMaximalism
57
ဘာသာပြန်ဆိုချက် ကြည့်မည်
syn/USDT
Futures
Trade: LONG
LEVERAGE : 3X
⚡️ENTRY:
Targets: 0.17-0.165$
TARGET 1 : 0.18$
TARGET 2 : 0.19$
TARGET 3 : 0.20$
TARGET 4 : 0.22$
TARGET 5 : 0.24$
STOP LOSS : 0.15$
Cautions:
1. Please take entry with low margin only
syn/USDT
Futures
Trade: LONG
LEVERAGE : 3X
⚡️ENTRY:
Targets: 0.17-0.165$
TARGET 1 : 0.18$
TARGET 2 : 0.19$
TARGET 3 : 0.20$
TARGET 4 : 0.22$
TARGET 5 : 0.24$
STOP LOSS : 0.15$
Cautions:
1. Please take entry with low margin only
Futures
Trade: LONG
LEVERAGE : 3X
⚡️ENTRY:
Targets: 0.17-0.165$
TARGET 1 : 0.18$
TARGET 2 : 0.19$
TARGET 3 : 0.20$
TARGET 4 : 0.22$
TARGET 5 : 0.24$
STOP LOSS : 0.15$
Cautions:
1. Please take entry with low margin only
74
ဘာသာပြန်ဆိုချက် ကြည့်မည်
🚀 *ETH/USDT — LONG*
💎 75X Cross
📍 *Entry:* 1860–1810
🎯 *TP:* 1900 • 1940 • 1980 • 2020
🛑 *SL:* 1760
⚠️ *Risk:* Max 3–5% per trade.
🚀 *ETH/USDT — LONG*
💎 75X Cross
📍 *Entry:* 1860–1810
🎯 *TP:* 1900 • 1940 • 1980 • 2020
🛑 *SL:* 1760
⚠️ *Risk:* Max 3–5% per trade.
💎 75X Cross
📍 *Entry:* 1860–1810
🎯 *TP:* 1900 • 1940 • 1980 • 2020
🛑 *SL:* 1760
⚠️ *Risk:* Max 3–5% per trade.
97
ဘာသာပြန်ဆိုချက် ကြည့်မည်
Token Name: zama/USDT
Type of Trading: Futures
Trade: SHORT 🔴
LEVERAGE : 3X
⚡️ENTRY:
Targets: 0.0517-0.053$
📌 TARGET 1 : 0.050$
📌 TARGET 2 : 0.048$
📌 TARGET 3 : 0.046$
📌 TARGET 4 : 0.043$
📌 TARGET 5 : 0.040$
🚨 STOP LOSS 0.0579$
Cautions:
1. Please take entry with low margin only
#amaizingtraders
Token Name: zama/USDT
Type of Trading: Futures
Trade: SHORT 🔴
LEVERAGE : 3X
⚡️ENTRY:
Targets: 0.0517-0.053$
📌 TARGET 1 : 0.050$
📌 TARGET 2 : 0.048$
📌 TARGET 3 : 0.046$
📌 TARGET 4 : 0.043$
📌 TARGET 5 : 0.040$
🚨 STOP LOSS 0.0579$
Cautions:
1. Please take entry with low margin only
#amaizingtraders
Type of Trading: Futures
Trade: SHORT 🔴
LEVERAGE : 3X
⚡️ENTRY:
Targets: 0.0517-0.053$
📌 TARGET 1 : 0.050$
📌 TARGET 2 : 0.048$
📌 TARGET 3 : 0.046$
📌 TARGET 4 : 0.043$
📌 TARGET 5 : 0.040$
🚨 STOP LOSS 0.0579$
Cautions:
1. Please take entry with low margin only
#amaizingtraders
1
226
ဘာသာပြန်ဆိုချက် ကြည့်မည်
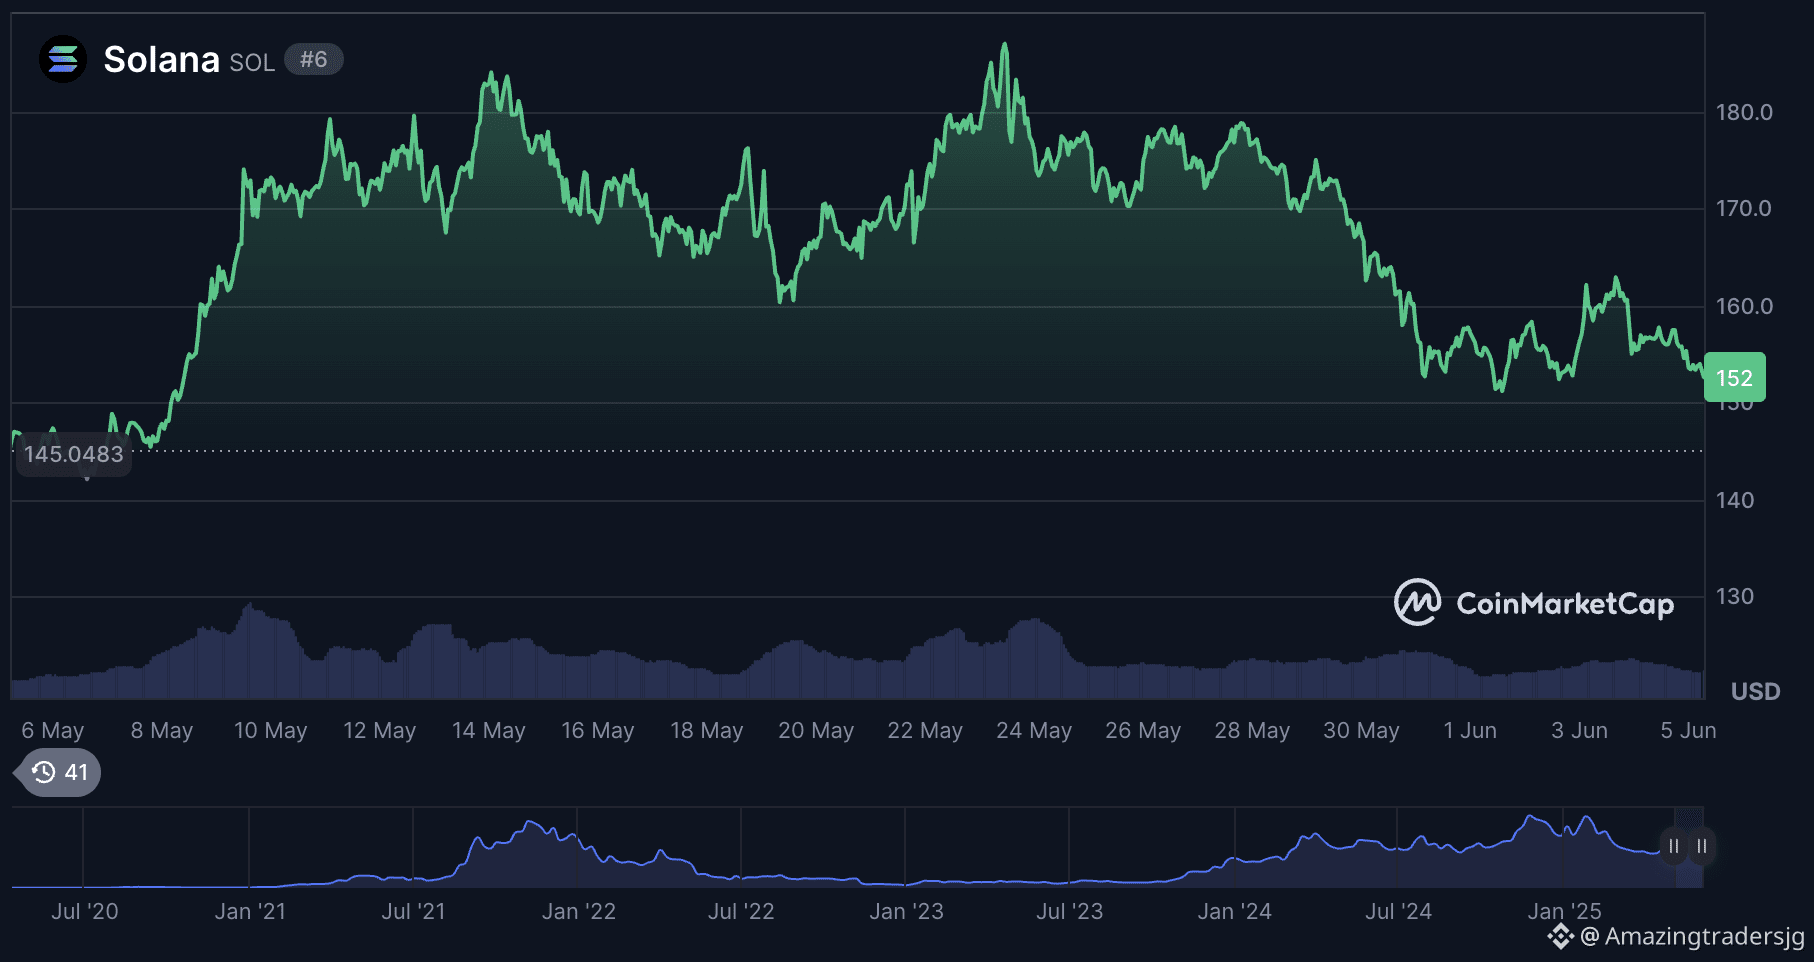
Solana is trading around $76 to $78 with critical short-term resistance near $80. Analysts project mixed targets; the 2026 average forecast ranges from $85 to $289, while long-term 2030 predictions vary widely between a bearish $10 and a bullish $350 to $2,000 depending on institutional adoption.
#solanabasememecoin
Solana is trading around $76 to $78 with critical short-term resistance near $80. Analysts project mixed targets; the 2026 average forecast ranges from $85 to $289, while long-term 2030 predictions vary widely between a bearish $10 and a bullish $350 to $2,000 depending on institutional adoption.
#solanabasememecoin
#solanabasememecoin
49
Arbitrum (ARB) сауда $0.088 USD айланасында, ал узак мөөнөттүү божомолдор 2026-жылдын аягына/2027ге карата жай темпте $0.14–$0.30га калыбына келүүнү көрсөтөт, ал эми Layer-2 кабыл алуу масштабга чыкса 2030-жылга карата $4.60тан $7.00га чейин мүмкүн болгон максаттар бар. Реалдуу убакыттагы диаграммалар . сыяктуу платформаларда көзөмөлдөнөт.
Узак мөөнөттүү баа божомолдору
2026–2027 Болжол: Минимум катары $0.08ден $0.60га чейин орточо жогорку мааниге жетип, рыноктун импульсу турукташкан сайын соода ошол диапазондо жүрүүсү күтүлөт.
2030 Горизонт: Оптимисттик божомолдор боюнча токен $4.60 менен $7.00 аралыгында болот, бул Кулпуланган жалпы нарктын (TVL) өсүшү жана Ethereum тармагынын кеңейиши менен шартталат.#ArbitrumBOLD
#ArbitrumARB
Arbitrum (ARB) сауда $0.088 USD айланасында, ал узак мөөнөттүү божомолдор 2026-жылдын аягына/2027ге карата жай темпте $0.14–$0.30га калыбына келүүнү көрсөтөт, ал эми Layer-2 кабыл алуу масштабга чыкса 2030-жылга карата $4.60тан $7.00га чейин мүмкүн болгон максаттар бар. Реалдуу убакыттагы диаграммалар . сыяктуу платформаларда көзөмөлдөнөт.
Узак мөөнөттүү баа божомолдору
2026–2027 Болжол: Минимум катары $0.08ден $0.60га чейин орточо жогорку мааниге жетип, рыноктун импульсу турукташкан сайын соода ошол диапазондо жүрүүсү күтүлөт.
2030 Горизонт: Оптимисттик божомолдор боюнча токен $4.60 менен $7.00 аралыгында болот, бул Кулпуланган жалпы нарктын (TVL) өсүшү жана Ethereum тармагынын кеңейиши менен шартталат.#ArbitrumBOLD
#ArbitrumARB
Узак мөөнөттүү баа божомолдору
2026–2027 Болжол: Минимум катары $0.08ден $0.60га чейин орточо жогорку мааниге жетип, рыноктун импульсу турукташкан сайын соода ошол диапазондо жүрүүсү күтүлөт.
2030 Горизонт: Оптимисттик божомолдор боюнча токен $4.60 менен $7.00 аралыгында болот, бул Кулпуланган жалпы нарктын (TVL) өсүшү жана Ethereum тармагынын кеңейиши менен шартталат.#ArbitrumBOLD
#ArbitrumARB
1.1k
ဘာသာပြန်ဆိုချက် ကြည့်မည်
Ethereum (ETH) is trading around $1,860 USD, with short-term forecasts predicting a moderate rise toward the $2,000 resistance level by late summer 2026. Longer-term algorithmic and analyst projections suggest a potential price range of $2,500 to $3,700 by 2029, with institutional estimates even higher.
#EthereumNews
Ethereum (ETH) is trading around $1,860 USD, with short-term forecasts predicting a moderate rise toward the $2,000 resistance level by late summer 2026. Longer-term algorithmic and analyst projections suggest a potential price range of $2,500 to $3,700 by 2029, with institutional estimates even higher.
#EthereumNews
#EthereumNews
102
ဘာသာပြန်ဆိုချက် ကြည့်မည်
Overcoming Key Resistance
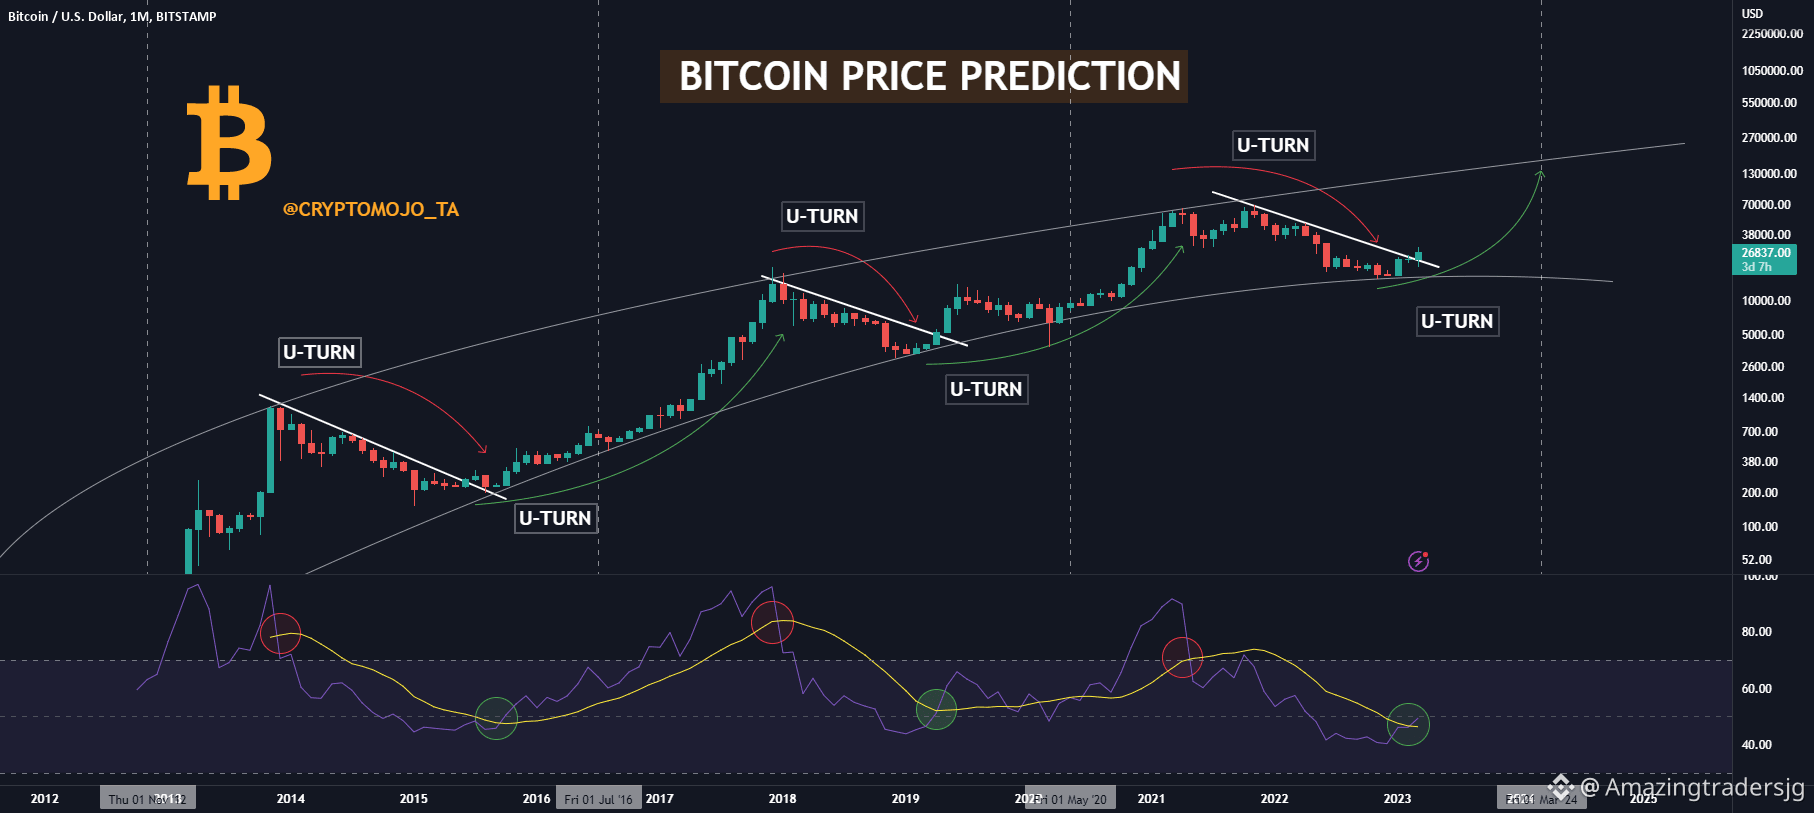
Reclaiming Moving Averages: Bitcoin is battling just below its 50-month exponential moving average (EMA) of $65,150. A decisive hourly close above this marker is required to shift the immediate 24-hour momentum from bearish to bullish.
Upside Targets: If buyers break past local resistance at $65,600, algorithmic indicators favor an immediate push toward $66,879.
#BTC🔥🔥🔥🔥🔥
Overcoming Key Resistance
Reclaiming Moving Averages: Bitcoin is battling just below its 50-month exponential moving average (EMA) of $65,150. A decisive hourly close above this marker is required to shift the immediate 24-hour momentum from bearish to bullish.
Upside Targets: If buyers break past local resistance at $65,600, algorithmic indicators favor an immediate push toward $66,879.
#BTC🔥🔥🔥🔥🔥
Reclaiming Moving Averages: Bitcoin is battling just below its 50-month exponential moving average (EMA) of $65,150. A decisive hourly close above this marker is required to shift the immediate 24-hour momentum from bearish to bullish.
Upside Targets: If buyers break past local resistance at $65,600, algorithmic indicators favor an immediate push toward $66,879.
#BTC🔥🔥🔥🔥🔥
92
ဘာသာပြန်ဆိုချက် ကြည့်မည်
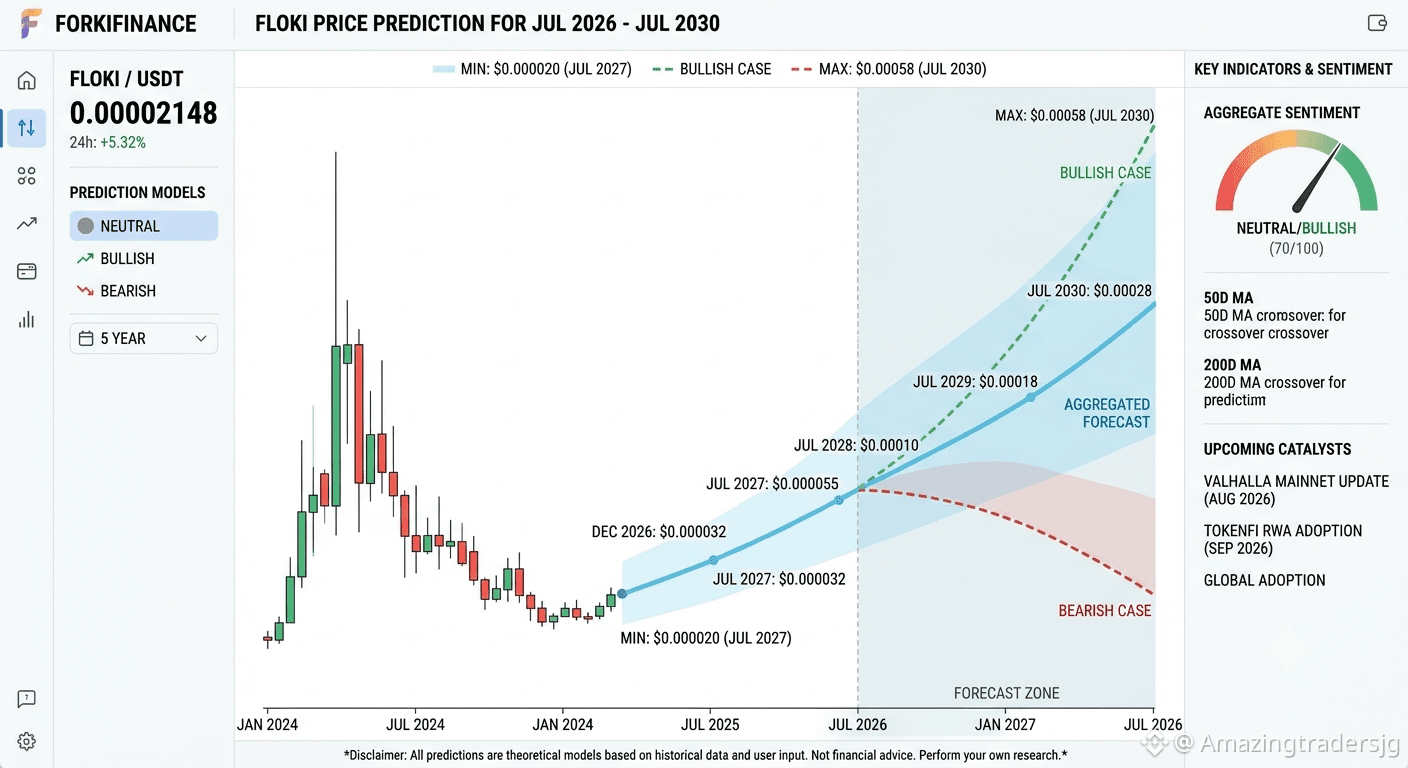
The FLOKI/USDT pair is currently hovering around 0.000021 USDT to 0.000022 USDT. The market is showing a short-term neutral to slightly bearish structure as it handles a minor pullback.
A breakdown of the immediate technical support/resistance levels and aggregated market projections outlines the following outlook:
Short-Term Targets & Technical Levels
* Immediate Support: 0.00002100 USDT. Buyers are actively defending this area; holding above it keeps a short-term bullish reversal on the table.
* Immediate Resistance: 0.00002250 USDT to 0.00002300 USDT. FLOKI needs to break past this range to build upward momentum.
* Bullish Targets (If Support Holds): Short-term momentum could push prices toward 0.00002400 USDT and 0.00002500 USDT in the coming weeks.
Long-Term Price Projections
Meme coin forecasts are highly speculative and heavily dependent on overall market trends (like Bitcoin's movement) and utility updates within the Floki ecosystem (such as their Valhalla metaverse game). Conservative and aggressive aggregated market forecasts project the following averages:
| Period | Minimum Forecast | Maximum Forecast
End of 2026 | $0.000022 USDT | $0.000058 USDT |
| 2027 | $0.000023 USDT | $0.000150 USDT |
| 2030 | $0.000026 USDT | $0.000460 USDT |
⚠️ Risk Warning: Floki is a highly volatile asset. Always practice sound risk management, stick to comfortable position sizes, and never rely solely on automated or algorithmic price predictions for trading decisions.
The FLOKI/USDT pair is currently hovering around 0.000021 USDT to 0.000022 USDT. The market is showing a short-term neutral to slightly bearish structure as it handles a minor pullback.
A breakdown of the immediate technical support/resistance levels and aggregated market projections outlines the following outlook:
Short-Term Targets & Technical Levels
* Immediate Support: 0.00002100 USDT. Buyers are actively defending this area; holding above it keeps a short-term bullish reversal on the table.
* Immediate Resistance: 0.00002250 USDT to 0.00002300 USDT. FLOKI needs to break past this range to build upward momentum.
* Bullish Targets (If Support Holds): Short-term momentum could push prices toward 0.00002400 USDT and 0.00002500 USDT in the coming weeks.
Long-Term Price Projections
Meme coin forecasts are highly speculative and heavily dependent on overall market trends (like Bitcoin's movement) and utility updates within the Floki ecosystem (such as their Valhalla metaverse game). Conservative and aggressive aggregated market forecasts project the following averages:
| Period | Minimum Forecast | Maximum Forecast
End of 2026 | $0.000022 USDT | $0.000058 USDT |
| 2027 | $0.000023 USDT | $0.000150 USDT |
| 2030 | $0.000026 USDT | $0.000460 USDT |
⚠️ Risk Warning: Floki is a highly volatile asset. Always practice sound risk management, stick to comfortable position sizes, and never rely solely on automated or algorithmic price predictions for trading decisions.
A breakdown of the immediate technical support/resistance levels and aggregated market projections outlines the following outlook:
Short-Term Targets & Technical Levels
* Immediate Support: 0.00002100 USDT. Buyers are actively defending this area; holding above it keeps a short-term bullish reversal on the table.
* Immediate Resistance: 0.00002250 USDT to 0.00002300 USDT. FLOKI needs to break past this range to build upward momentum.
* Bullish Targets (If Support Holds): Short-term momentum could push prices toward 0.00002400 USDT and 0.00002500 USDT in the coming weeks.
Long-Term Price Projections
Meme coin forecasts are highly speculative and heavily dependent on overall market trends (like Bitcoin's movement) and utility updates within the Floki ecosystem (such as their Valhalla metaverse game). Conservative and aggressive aggregated market forecasts project the following averages:
| Period | Minimum Forecast | Maximum Forecast
End of 2026 | $0.000022 USDT | $0.000058 USDT |
| 2027 | $0.000023 USDT | $0.000150 USDT |
| 2030 | $0.000026 USDT | $0.000460 USDT |
⚠️ Risk Warning: Floki is a highly volatile asset. Always practice sound risk management, stick to comfortable position sizes, and never rely solely on automated or algorithmic price predictions for trading decisions.
142
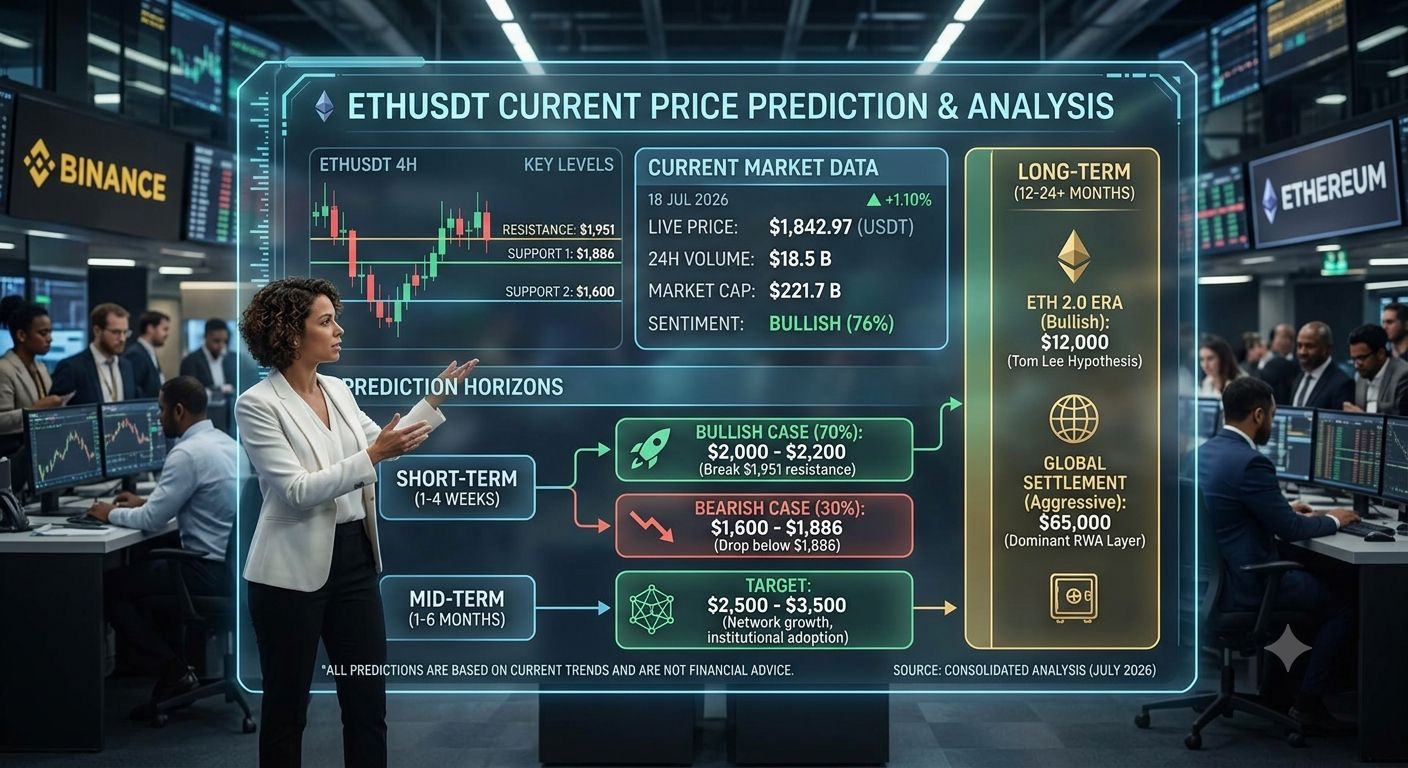
2026年7月18日時点で、イーサリアムの現在のライブ価格はおよそ$1,842〜$1,845 USDTのあたりで推移しています。
市場状況と予測
2026年半ばに向けて、より広範な暗号資産市場には注目すべき変化が起きています。イーサリアムは現在、2025年の史上最高値(約$5,000)からおよそ60%下回る水準で取引されています。
ただし、市場アナリストや予測プラットフォームでは、いくつかの重要な短期〜中期の見通しが追跡されています:
短期予測マーケット:Robinhoodの暗号資産予測マーケットのようなプラットフォームでは、短期のコンセンサスデータが、直近の日次の終値として$1,840〜$1,850という狭いレンジを強く狙っています。これは、統合(レンジ形成)局面を示唆しています。
「ウォール街」ブルケース:機関投資家向けの市場アップデート(Bitmine Immersion Technologiesによるレポートなど)によれば、イーサリアムをめぐる物語は、小口投資家によるミーム主導の投機から、大きな機関投資家のユーティリティ(実需)へと大きく移行しています。
#ETHUSDTANALYSIS #CryptoNewss
2026年7月18日時点で、イーサリアムの現在のライブ価格はおよそ$1,842〜$1,845 USDTのあたりで推移しています。
市場状況と予測
2026年半ばに向けて、より広範な暗号資産市場には注目すべき変化が起きています。イーサリアムは現在、2025年の史上最高値(約$5,000)からおよそ60%下回る水準で取引されています。
ただし、市場アナリストや予測プラットフォームでは、いくつかの重要な短期〜中期の見通しが追跡されています:
短期予測マーケット:Robinhoodの暗号資産予測マーケットのようなプラットフォームでは、短期のコンセンサスデータが、直近の日次の終値として$1,840〜$1,850という狭いレンジを強く狙っています。これは、統合(レンジ形成)局面を示唆しています。
「ウォール街」ブルケース:機関投資家向けの市場アップデート(Bitmine Immersion Technologiesによるレポートなど)によれば、イーサリアムをめぐる物語は、小口投資家によるミーム主導の投機から、大きな機関投資家のユーティリティ(実需)へと大きく移行しています。
#ETHUSDTANALYSIS #CryptoNewss
市場状況と予測
2026年半ばに向けて、より広範な暗号資産市場には注目すべき変化が起きています。イーサリアムは現在、2025年の史上最高値(約$5,000)からおよそ60%下回る水準で取引されています。
ただし、市場アナリストや予測プラットフォームでは、いくつかの重要な短期〜中期の見通しが追跡されています:
短期予測マーケット:Robinhoodの暗号資産予測マーケットのようなプラットフォームでは、短期のコンセンサスデータが、直近の日次の終値として$1,840〜$1,850という狭いレンジを強く狙っています。これは、統合(レンジ形成)局面を示唆しています。
「ウォール街」ブルケース:機関投資家向けの市場アップデート(Bitmine Immersion Technologiesによるレポートなど)によれば、イーサリアムをめぐる物語は、小口投資家によるミーム主導の投機から、大きな機関投資家のユーティリティ(実需)へと大きく移行しています。
#ETHUSDTANALYSIS #CryptoNewss
121
ဘာသာပြန်ဆိုချက် ကြည့်မည်
Guys The Moment Has Arrived That We Were Waiting For... I Just Opened a Long Trade On $SOL With 10x Leverage Isolated In My Futures...👇
My Long Entry: $76.95 - $77.10
TP 1: $80.42
TP 2: $85.12
TP 3: $90.29
TP 4: $100.00
SL: $70.55
Setup Logic:
Price is attempting to form a higher low after a sharp pullback.
The $76.90-$77.00 area is acting as strong intraday support.
Buyers are stepping in near demand, reducing downside momentum.
Guys The Moment Has Arrived That We Were Waiting For... I Just Opened a Long Trade On $SOL With 10x Leverage Isolated In My Futures...👇
My Long Entry: $76.95 - $77.10
TP 1: $80.42
TP 2: $85.12
TP 3: $90.29
TP 4: $100.00
SL: $70.55
Setup Logic:
Price is attempting to form a higher low after a sharp pullback.
The $76.90-$77.00 area is acting as strong intraday support.
Buyers are stepping in near demand, reducing downside momentum.
My Long Entry: $76.95 - $77.10
TP 1: $80.42
TP 2: $85.12
TP 3: $90.29
TP 4: $100.00
SL: $70.55
Setup Logic:
Price is attempting to form a higher low after a sharp pullback.
The $76.90-$77.00 area is acting as strong intraday support.
Buyers are stepping in near demand, reducing downside momentum.
46
ဘာသာပြန်ဆိုချက် ကြည့်မည်
The crypto market slipped as U.S.-Iran military tensions escalated, with the U.S. Treasury sanctioning Iranian Central Bank crypto wallets and Tether freezing $131 million in associated stablecoins. Bitcoin fell below $64,000 following profit-taking and fresh airstrikes.
Sanctions and Stablecoin Freezes
OFAC Action: The U.S. Treasury's OFAC added four Central Bank of Iran crypto addresses to its sanctions list.
Tether Action: Tether immediately froze $131 million in stablecoins across those targeted wallets.
Broader Crackdown: This follows previous U.S. sanctions on major Iranian crypto exchanges like Nobitex used to bypass traditional financial limits.
Market Impact and Price Action
Bitcoin Retreat: BTC pulled back to roughly $63,500–$64,000 after briefly touching a monthly high of $65,500.
Risk Appetite: Overall crypto market capitalization drifted lower to around $2.20 trillion as regional strikes near the Strait of Hormuz dampened investor risk appetite.
If you'd like, I can provide updates on:
Specific altcoin performance (Ethereum, XRP)
Broader traditional market reactions (Oil and gold prices)
The crypto market slipped as U.S.-Iran military tensions escalated, with the U.S. Treasury sanctioning Iranian Central Bank crypto wallets and Tether freezing $131 million in associated stablecoins. Bitcoin fell below $64,000 following profit-taking and fresh airstrikes.
Sanctions and Stablecoin Freezes
OFAC Action: The U.S. Treasury's OFAC added four Central Bank of Iran crypto addresses to its sanctions list.
Tether Action: Tether immediately froze $131 million in stablecoins across those targeted wallets.
Broader Crackdown: This follows previous U.S. sanctions on major Iranian crypto exchanges like Nobitex used to bypass traditional financial limits.
Market Impact and Price Action
Bitcoin Retreat: BTC pulled back to roughly $63,500–$64,000 after briefly touching a monthly high of $65,500.
Risk Appetite: Overall crypto market capitalization drifted lower to around $2.20 trillion as regional strikes near the Strait of Hormuz dampened investor risk appetite.
If you'd like, I can provide updates on:
Specific altcoin performance (Ethereum, XRP)
Broader traditional market reactions (Oil and gold prices)
Sanctions and Stablecoin Freezes
OFAC Action: The U.S. Treasury's OFAC added four Central Bank of Iran crypto addresses to its sanctions list.
Tether Action: Tether immediately froze $131 million in stablecoins across those targeted wallets.
Broader Crackdown: This follows previous U.S. sanctions on major Iranian crypto exchanges like Nobitex used to bypass traditional financial limits.
Market Impact and Price Action
Bitcoin Retreat: BTC pulled back to roughly $63,500–$64,000 after briefly touching a monthly high of $65,500.
Risk Appetite: Overall crypto market capitalization drifted lower to around $2.20 trillion as regional strikes near the Strait of Hormuz dampened investor risk appetite.
If you'd like, I can provide updates on:
Specific altcoin performance (Ethereum, XRP)
Broader traditional market reactions (Oil and gold prices)

95
ဘာသာပြန်ဆိုချက် ကြည့်မည်
Solana (SOL) is trading around $78 with a short-term price prediction ranging from a bearish $65 to a bullish breakout target of $120. Analysts forecast the average price to sit between $75 and $91 for the remainder of 2026, depending on whether it can hold current support and regain momentum.Short-Term Forecasts (2026)Bearish Case: If SOL breaks below the $75-$78 support level, analysts anticipate it could drop to the $60-$65 range due to macroeconomic headwinds and ETF outflows.Bullish Case: A successful breakout above $82 could push SOL toward the $100-$120 resistance zones, with some aggressive short-term targets pointing t0.
Solana (SOL) is trading around $78 with a short-term price prediction ranging from a bearish $65 to a bullish breakout target of $120. Analysts forecast the average price to sit between $75 and $91 for the remainder of 2026, depending on whether it can hold current support and regain momentum.Short-Term Forecasts (2026)Bearish Case: If SOL breaks below the $75-$78 support level, analysts anticipate it could drop to the $60-$65 range due to macroeconomic headwinds and ETF outflows.Bullish Case: A successful breakout above $82 could push SOL toward the $100-$120 resistance zones, with some aggressive short-term targets pointing t0.
109
ဘာသာပြန်ဆိုချက် ကြည့်မည်
The crypto market is experiencing a consolidation phase today, with Bitcoin and major altcoins trading relatively steady as investors closely monitor traditional markets. Overall market momentum has been impacted by US inflation concerns, shifting geopolitical tensions in the Middle East, and ETF liquidity flows.
The crypto market is experiencing a consolidation phase today, with Bitcoin and major altcoins trading relatively steady as investors closely monitor traditional markets. Overall market momentum has been impacted by US inflation concerns, shifting geopolitical tensions in the Middle East, and ETF liquidity flows.

91
ဘာသာပြန်ဆိုချက် ကြည့်မည်
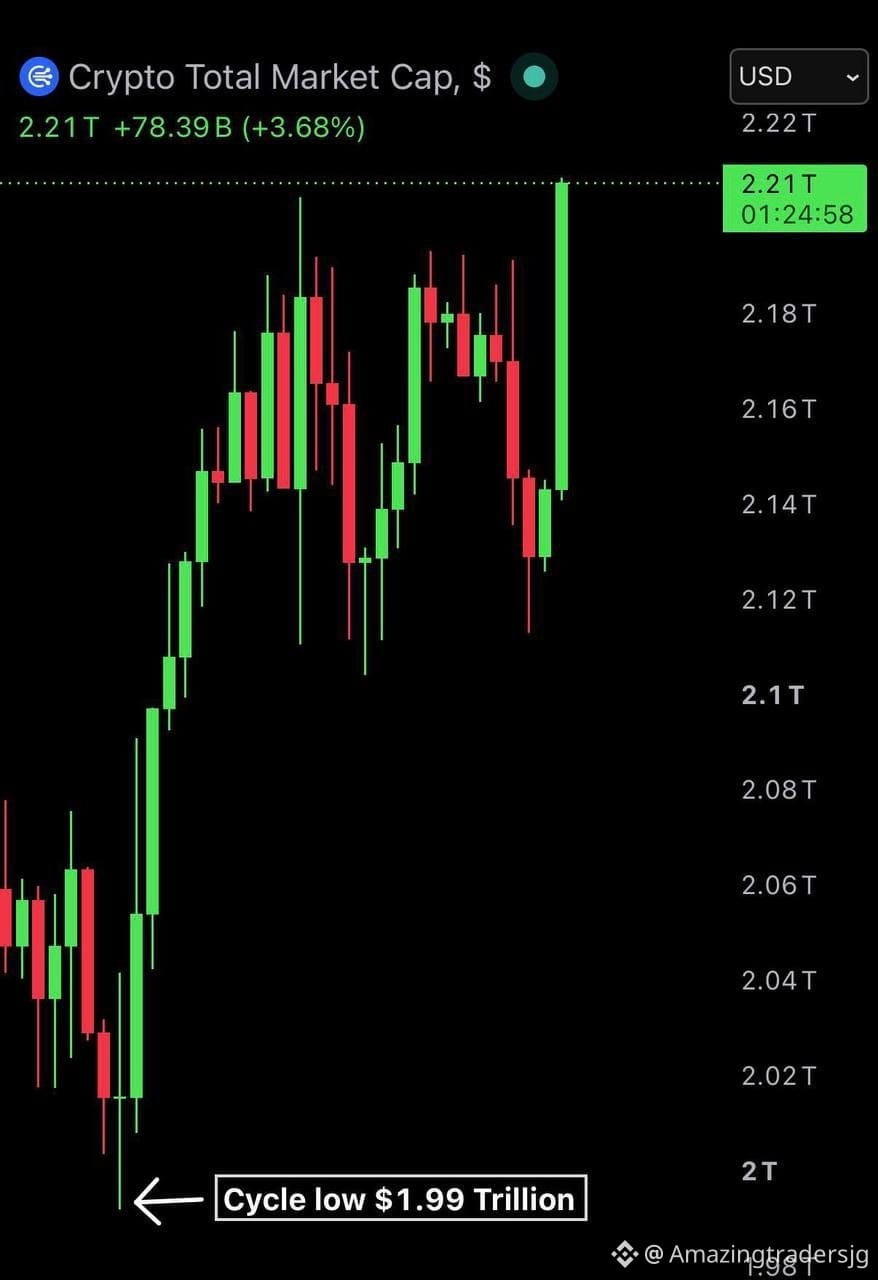
$220 Billion has been added to the crypto market in the first 15 days of July.
BitcoinHoldsThreeWeekHighAt$65K
$220 Billion has been added to the crypto market in the first 15 days of July.
BitcoinHoldsThreeWeekHighAt$65K
BitcoinHoldsThreeWeekHighAt$65K
68
ဘာသာပြန်ဆိုချက် ကြည့်မည်
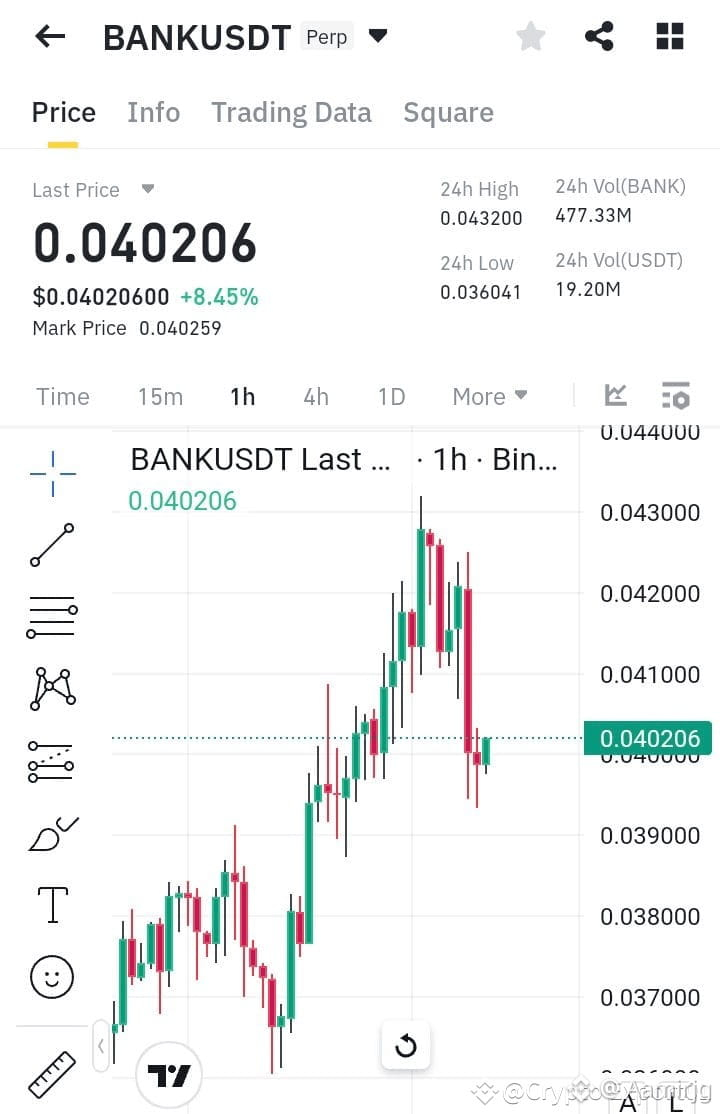
The price prediction for BANK/USDT (referring to Lorenzo Protocol's BANK token traded against Tether) varies across forecasting platforms, estimating a range between $0.033 and $0.090 through late 2026. [1, 2, 3]
Current Market Status
Current Price: Trading around $0.051 USDT.
Recent Range: Reached an all-time low of $0.022 USDT in June 2026 and an all-time high of $0.0895 USDT in late 2025.
Volatility: Evaluated at moderate-to-high volatility typical for altcoin pairs.
Short-Term and Mid-Term Forecasts (2026)
Minimum Expected Price: Algorithmic platforms predict a floor near $0.033 to $0.036 USDT.
Maximum Expected Target: Bullish technical estimates project peaks reaching up to $0.089 to $0.090 USDT if market momentum resumes.
Average Outlook: Most automated models hover around an average projected value of $0.036 to $0.059 USDT for the remainder of the year.
If you'd like, let me know:
Which specific project you mean by BANK (Lorenzo Protocol, Bankcoin, or a different asset)
Whether you want a longer-term outlook (2027–2030)
#bankusdt #BinanceSquareTalks
The price prediction for BANK/USDT (referring to Lorenzo Protocol's BANK token traded against Tether) varies across forecasting platforms, estimating a range between $0.033 and $0.090 through late 2026. [1, 2, 3]
Current Market Status
Current Price: Trading around $0.051 USDT.
Recent Range: Reached an all-time low of $0.022 USDT in June 2026 and an all-time high of $0.0895 USDT in late 2025.
Volatility: Evaluated at moderate-to-high volatility typical for altcoin pairs.
Short-Term and Mid-Term Forecasts (2026)
Minimum Expected Price: Algorithmic platforms predict a floor near $0.033 to $0.036 USDT.
Maximum Expected Target: Bullish technical estimates project peaks reaching up to $0.089 to $0.090 USDT if market momentum resumes.
Average Outlook: Most automated models hover around an average projected value of $0.036 to $0.059 USDT for the remainder of the year.
If you'd like, let me know:
Which specific project you mean by BANK (Lorenzo Protocol, Bankcoin, or a different asset)
Whether you want a longer-term outlook (2027–2030)
#bankusdt #BinanceSquareTalks
Current Market Status
Current Price: Trading around $0.051 USDT.
Recent Range: Reached an all-time low of $0.022 USDT in June 2026 and an all-time high of $0.0895 USDT in late 2025.
Volatility: Evaluated at moderate-to-high volatility typical for altcoin pairs.
Short-Term and Mid-Term Forecasts (2026)
Minimum Expected Price: Algorithmic platforms predict a floor near $0.033 to $0.036 USDT.
Maximum Expected Target: Bullish technical estimates project peaks reaching up to $0.089 to $0.090 USDT if market momentum resumes.
Average Outlook: Most automated models hover around an average projected value of $0.036 to $0.059 USDT for the remainder of the year.
If you'd like, let me know:
Which specific project you mean by BANK (Lorenzo Protocol, Bankcoin, or a different asset)
Whether you want a longer-term outlook (2027–2030)
#bankusdt #BinanceSquareTalks
65
ဘာသာပြန်ဆိုချက် ကြည့်မည်
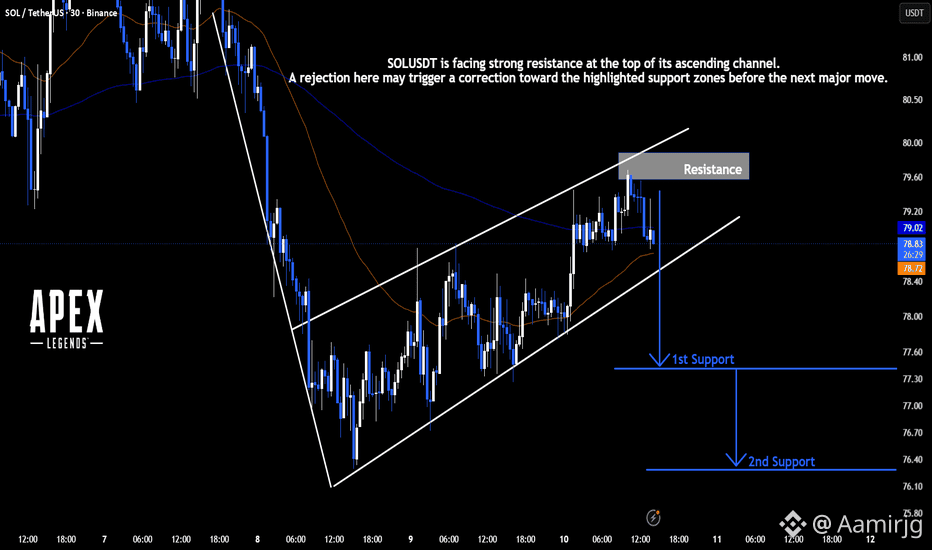
SOLUSDT futures trade around $77.45, facing short-term bearish pressure after breaking below key trendline support. Key levels to watch include resistance near $78.50 - $80.00 and downside support targets at $71.95 and $65.88. You can view live perpetual charts and order books on
#solusdtfuturetrading #BinanceSquareTalks
SOLUSDT futures trade around $77.45, facing short-term bearish pressure after breaking below key trendline support. Key levels to watch include resistance near $78.50 - $80.00 and downside support targets at $71.95 and $65.88. You can view live perpetual charts and order books on
#solusdtfuturetrading #BinanceSquareTalks
#solusdtfuturetrading #BinanceSquareTalks
36
ဘာသာပြန်ဆိုချက် ကြည့်မည်
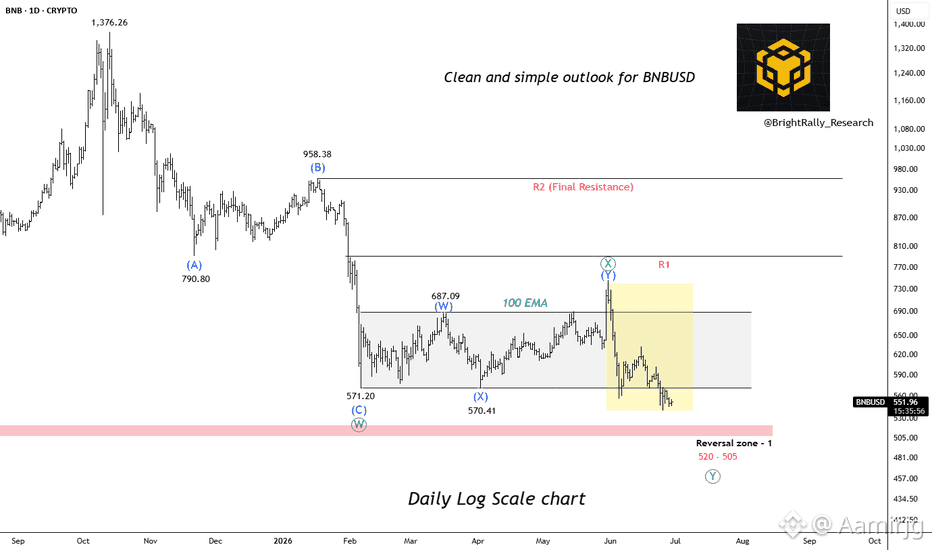
As of July 2026, BNB is trading in the $570 to $585 range. Over the last few weeks, the token has been showing neutral-to-bullish market structure, holding securely above its 200-day moving average (~$550–$560), which serves as a major baseline support level.
Here is what technical analysts and market aggregators are forecasting for BNB over the next 30 days.
30-Day Outlook & Price Targets
Short-term momentum indicators, like the 14-day Relative Strength Index (RSI), are hovering right around 45 to 50. This represents a "neutral zone"—meaning the market is currently consolidating, and a major move in either direction will depend on a breakout past immediate technical levels.
##BNB_Market_Update
As of July 2026, BNB is trading in the $570 to $585 range. Over the last few weeks, the token has been showing neutral-to-bullish market structure, holding securely above its 200-day moving average (~$550–$560), which serves as a major baseline support level.
Here is what technical analysts and market aggregators are forecasting for BNB over the next 30 days.
30-Day Outlook & Price Targets
Short-term momentum indicators, like the 14-day Relative Strength Index (RSI), are hovering right around 45 to 50. This represents a "neutral zone"—meaning the market is currently consolidating, and a major move in either direction will depend on a breakout past immediate technical levels.
##BNB_Market_Update
Here is what technical analysts and market aggregators are forecasting for BNB over the next 30 days.
30-Day Outlook & Price Targets
Short-term momentum indicators, like the 14-day Relative Strength Index (RSI), are hovering right around 45 to 50. This represents a "neutral zone"—meaning the market is currently consolidating, and a major move in either direction will depend on a breakout past immediate technical levels.
##BNB_Market_Update
69
ဘာသာပြန်ဆိုချက် ကြည့်မည်
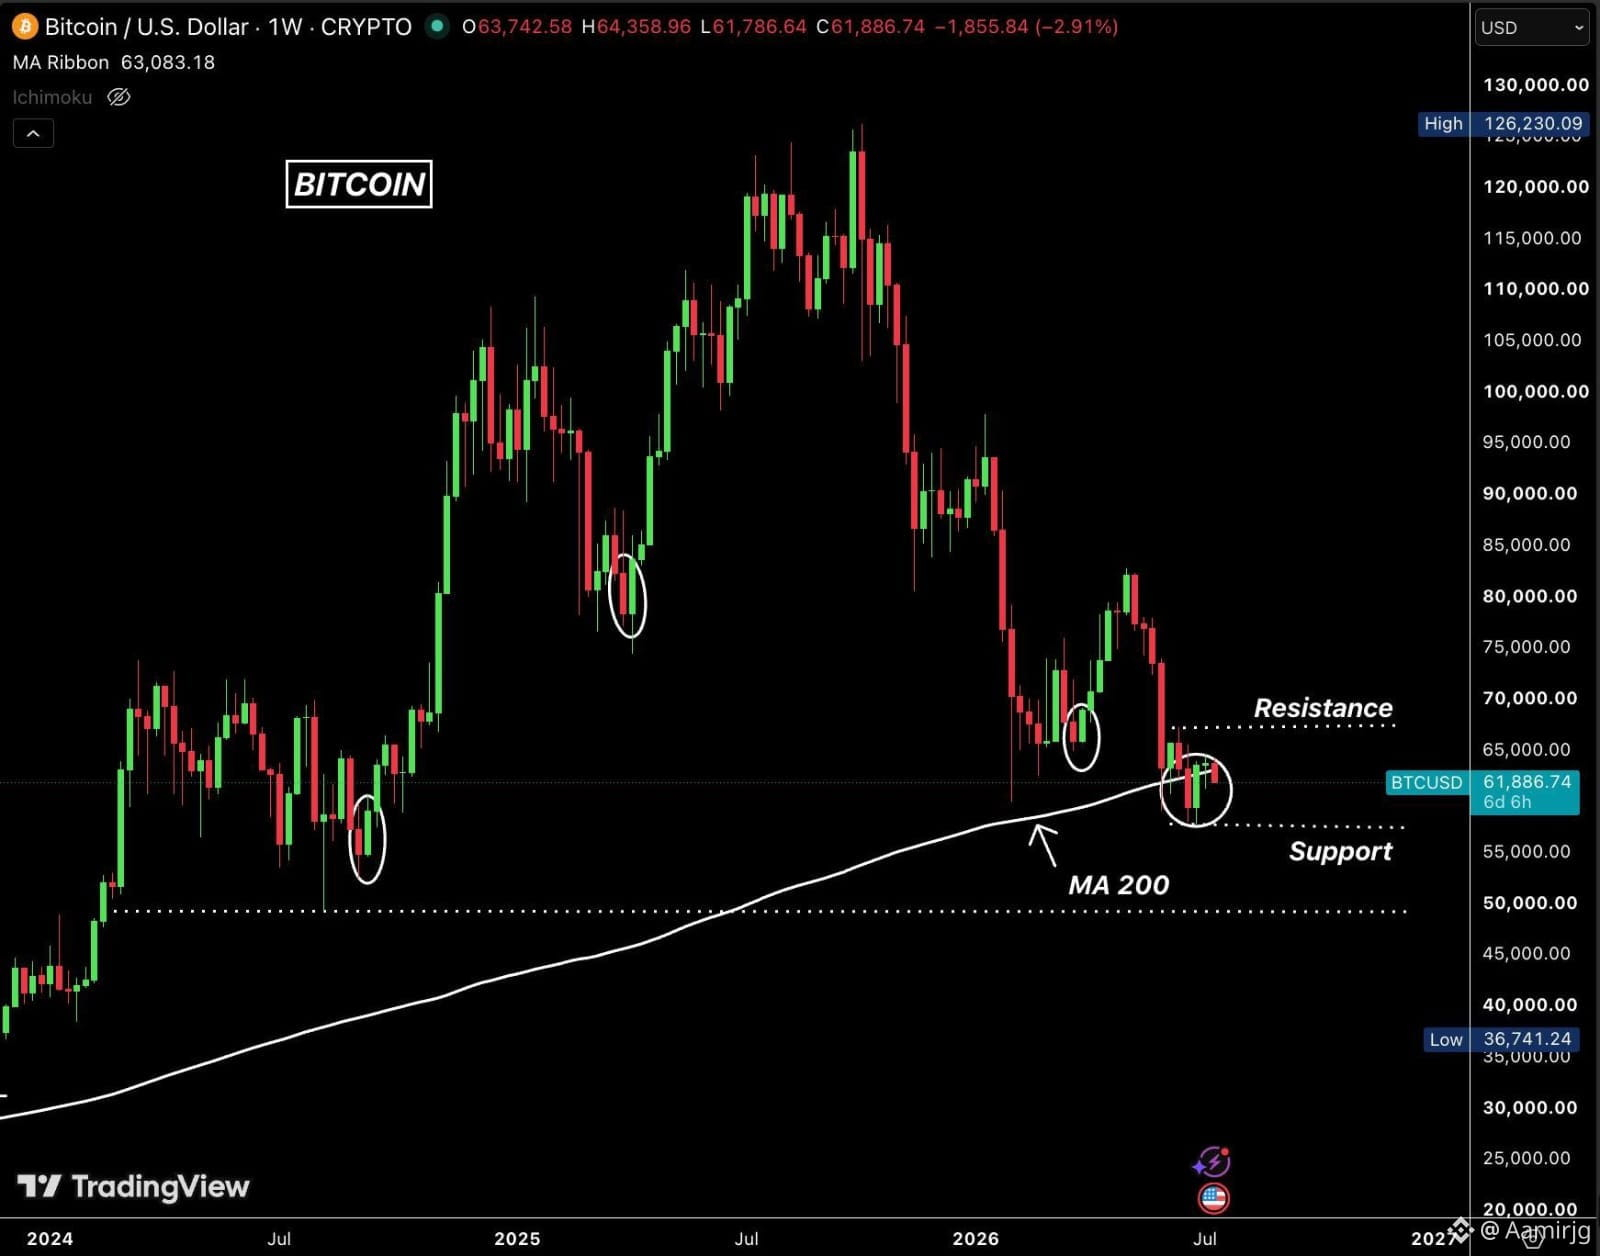
Bitcoin closed weekly above important support level of MA 200 with a doji candle.
This shows the market is still uncertain, but the bullish engulfing candle from three weeks ago remains intact.
Earlier the same pattern appeared 3 times this cycle and each one was followed by a strong rally.
Two scenarios:
1. Hold $58K = Breakout toward $67K, then $83K.
2. Lose $58K on the weekly close = Next support around $49K.
US CPI report this week will be crucial.
Lower inflation could help Bitcoin recover, while higher inflation could send it lower.
Bitcoin closed weekly above important support level of MA 200 with a doji candle.
This shows the market is still uncertain, but the bullish engulfing candle from three weeks ago remains intact.
Earlier the same pattern appeared 3 times this cycle and each one was followed by a strong rally.
Two scenarios:
1. Hold $58K = Breakout toward $67K, then $83K.
2. Lose $58K on the weekly close = Next support around $49K.
US CPI report this week will be crucial.
Lower inflation could help Bitcoin recover, while higher inflation could send it lower.
This shows the market is still uncertain, but the bullish engulfing candle from three weeks ago remains intact.
Earlier the same pattern appeared 3 times this cycle and each one was followed by a strong rally.
Two scenarios:
1. Hold $58K = Breakout toward $67K, then $83K.
2. Lose $58K on the weekly close = Next support around $49K.
US CPI report this week will be crucial.
Lower inflation could help Bitcoin recover, while higher inflation could send it lower.
24
ဘာသာပြန်ဆိုချက် ကြည့်မည်
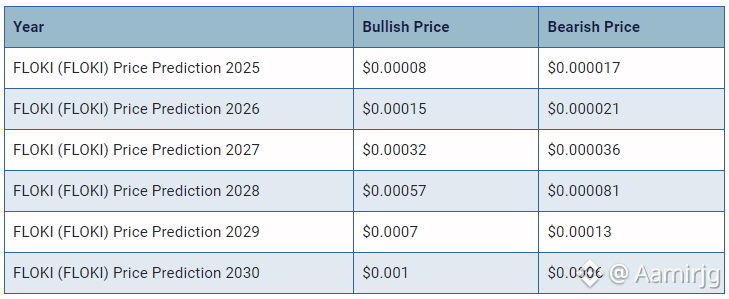
Based on our technical indicators, Floki Inu's 200-day SMA will drop in the next month and will hit $ 0.00002935 by Aug 14, 2026. Floki Inu's short-term 50-Day SMA is estimated to hit $ 0.00002751 by Aug 14, 2026.
The Relative Strength Index (RSI) momentum oscillator is a popular indicator that signals whether a cryptocurrency is oversold (below 30) or overbought (above 70). Currently, the RSI value is at 42.94, which indicates that the FLOKI market is in a neutral position.
Floki Inu Key Price Levels
Based on today's classical pivot point (P1) with the value of $ 0.00002222, Floki Inu has support levels of $ 0.00002193, $ 0.00002149, and the strongest at $ 0.00002119. Similarly, Floki Inu resistance levels are at $ 0.00002267, $ 0.00002296, and $ 0.00002341.
Based on our technical indicators, Floki Inu's 200-day SMA will drop in the next month and will hit $ 0.00002935 by Aug 14, 2026. Floki Inu's short-term 50-Day SMA is estimated to hit $ 0.00002751 by Aug 14, 2026.
The Relative Strength Index (RSI) momentum oscillator is a popular indicator that signals whether a cryptocurrency is oversold (below 30) or overbought (above 70). Currently, the RSI value is at 42.94, which indicates that the FLOKI market is in a neutral position.
Floki Inu Key Price Levels
Based on today's classical pivot point (P1) with the value of $ 0.00002222, Floki Inu has support levels of $ 0.00002193, $ 0.00002149, and the strongest at $ 0.00002119. Similarly, Floki Inu resistance levels are at $ 0.00002267, $ 0.00002296, and $ 0.00002341.
The Relative Strength Index (RSI) momentum oscillator is a popular indicator that signals whether a cryptocurrency is oversold (below 30) or overbought (above 70). Currently, the RSI value is at 42.94, which indicates that the FLOKI market is in a neutral position.
Floki Inu Key Price Levels
Based on today's classical pivot point (P1) with the value of $ 0.00002222, Floki Inu has support levels of $ 0.00002193, $ 0.00002149, and the strongest at $ 0.00002119. Similarly, Floki Inu resistance levels are at $ 0.00002267, $ 0.00002296, and $ 0.00002341.
140
Log in to explore more content
Join global crypto users on Binance Square
⚡️ Get latest and useful information about crypto.
💬 Trusted by the world’s largest crypto exchange.
👍 Discover real insights from verified creators.
အီးမေးလ် / ဖုန်းနံပါတ်
ရေပန်းစားနေသော ခေါင်းစဉ်များ
USMidterms-WhatAreMarketsExpecting?
ကြည့်ရှုမှု 2,841 ကြိမ်
104 ဦး ဆွေးနွေးနေသည်
UBS: ဒီမိုကရက်တစ်ပါတီ၏ ‘အပြာရောင်လှိုင်း’ အနိုင်ရနိုင်ခြေ မြင့်တက်လာမှုကြောင့် ဈေးကွက်၏ စွန့်စားမှုရှောင်ရှားလိုစိတ် ပိုမိုမြင့်တက်
Binance News
·နှစ်သက်မှု 0 ခု
·ကြည့်ရှုမှု 522 ကြိမ်
USOctoberNFP-AreRateCutsStillPossible
ကြည့်ရှုမှု 195,335 ကြိမ်
1,465 ဦး ဆွေးနွေးနေသည်
AMDBeatsExpectations-AINarrativeContinues
ကြည့်ရှုမှု 488 ကြိမ်
48 ဦး ဆွေးနွေးနေသည်