

#btcfallsbelow$84k
btcfallsbelow$84k
161,078 views
257 Discussing
ရေပန်းစားသော
နောက်ဆုံး


·
--
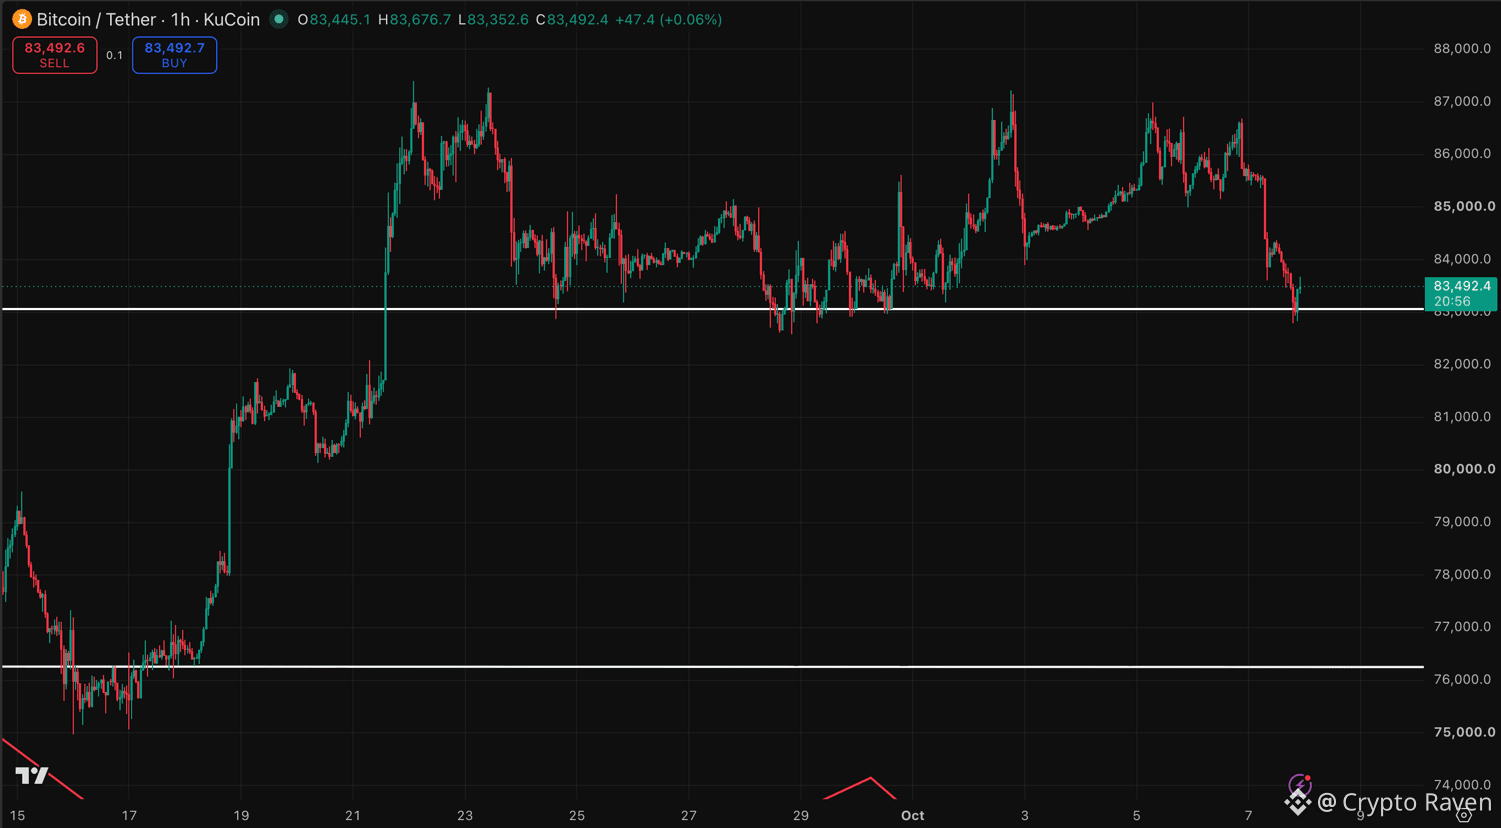
$BTC is at 83K right now!
I told you we would come lower from $87K, and I reminded you again when it was at $85K. I also showed the RSI divergence (STF). This support is important for Bitcoin now. If we can hold it, we can aim for around $90K until the election. If we lose it, $77K is the next support.
I am more interested in opening a long around those lower levels. If you still want to open a long now, make sure you DCA around the $77K area so you are not stuck if price keeps falling.
#BTCFallsBelow$84K
$BTC is at 83K right now!
I told you we would come lower from $87K, and I reminded you again when it was at $85K. I also showed the RSI divergence (STF). This support is important for Bitcoin now. If we can hold it, we can aim for around $90K until the election. If we lose it, $77K is the next support.
I am more interested in opening a long around those lower levels. If you still want to open a long now, make sure you DCA around the $77K area so you are not stuck if price keeps falling.
#BTCFallsBelow$84K
I told you we would come lower from $87K, and I reminded you again when it was at $85K. I also showed the RSI divergence (STF). This support is important for Bitcoin now. If we can hold it, we can aim for around $90K until the election. If we lose it, $77K is the next support.
I am more interested in opening a long around those lower levels. If you still want to open a long now, make sure you DCA around the $77K area so you are not stuck if price keeps falling.
#BTCFallsBelow$84K
AngelOfCrypto_-:
that's good
10
1
25
49.5k

·
--
စိစစ်အတည်ပြုထားသည်

Article
📉 الكريبتو يتضرر بشدة فهل هذا وقت الشراء؟كثير من الناس يسألوني الآن: هل هذه فرصة للدخول؟
خلوني أشوفها معكم من 3 زوايا: الأساسي، النفسي، والفني.
1️⃣ التحليل الأساسي
العوامل الحالية ما زالت تضغط على الأصول عالية المخاطر. عوائد السندات الأمريكية ارتفعت بقوة، ووصل عائد الـ30 سنة إلى 5.70%، وهو أعلى مستوى منذ 2002، بالتزامن مع بقاء أسعار النفط مرتفعة.
بمعنى آخر، الصورة الكلية ما زالت تحتاج الحذر. ممكن نشوف ارتدادات، لكن استمرار الصعود يحتاج تحسن واضح في ظروف السيولة والفائدة والهبوط دائما سيكون سيد الموقف.
2️⃣ التحليل النفسي
رغم الأخبار السلبية، السوق صعد بقوة وجذب الكثير من السيولة والمتداولين للدخول مع الزخم.
والآن نشوف الوجه الآخر للحركة: خوف، تصفيات، وبيع تحت الضغط.
وهنا تبدأ الفرصة التي أراقبها أنا شخصيا. عندما يبيع الناس بدافع الخوف، يبدأ المال الذكي بالبحث عن مناطق مناسبة لبناء مراكز، خصوصا بعد موجات التصفيات القوية.
لكن هذا لا يعني أن كل هبوط هو قاع، لازم من إدارة مخاطر.
3️⃣ التحليل الفني
بالنسبة لي، منطقة $79,500–$82,000 في $BTC هي المنطقة الحاسمة.
إعادة اختبارها ستكون مهمة جدا لتحديد السيناريو القادم:
🟢 الثبات فوقها واستعادة الزخم = فرصة لاستمرار التعافي، مع مراقبة $87,700 ثم $90,000.
🔴 كسرها والثبات تحتها = احتمال استمرار التصحيح بشكل أعمق.
حاليا، الفريمات الصغيرة قد تعطي ارتدادات ومضاربات، لكن على الصورة الأكبر أنا أراقب منطقة $82K–$79.5K لأنها بالنسبة لي هي الحاسمة.
باختصار شديد، مازال هناك مساحة للتصحيح أكثر، في حال لو تريد بناء صفقات من الآن لازم تكون حذر وبإدارة مخاطر صارمة ✅️
{spot}(BTCUSDT)
#BTCFallsBelow$84K
#StriveBuys2000BTCFor$169M
#SECApproves3XBitcoinETF
#BinanceLaunchesBinanceIntelligence
📉 الكريبتو يتضرر بشدة فهل هذا وقت الشراء؟
كثير من الناس يسألوني الآن: هل هذه فرصة للدخول؟
خلوني أشوفها معكم من 3 زوايا: الأساسي، النفسي، والفني.
1️⃣ التحليل الأساسي
العوامل الحالية ما زالت تضغط على الأصول عالية المخاطر. عوائد السندات الأمريكية ارتفعت بقوة، ووصل عائد الـ30 سنة إلى 5.70%، وهو أعلى مستوى منذ 2002، بالتزامن مع بقاء أسعار النفط مرتفعة.
بمعنى آخر، الصورة الكلية ما زالت تحتاج الحذر. ممكن نشوف ارتدادات، لكن استمرار الصعود يحتاج تحسن واضح في ظروف السيولة والفائدة والهبوط دائما سيكون سيد الموقف.
2️⃣ التحليل النفسي
رغم الأخبار السلبية، السوق صعد بقوة وجذب الكثير من السيولة والمتداولين للدخول مع الزخم.
والآن نشوف الوجه الآخر للحركة: خوف، تصفيات، وبيع تحت الضغط.
وهنا تبدأ الفرصة التي أراقبها أنا شخصيا. عندما يبيع الناس بدافع الخوف، يبدأ المال الذكي بالبحث عن مناطق مناسبة لبناء مراكز، خصوصا بعد موجات التصفيات القوية.
لكن هذا لا يعني أن كل هبوط هو قاع، لازم من إدارة مخاطر.
3️⃣ التحليل الفني
بالنسبة لي، منطقة $79,500–$82,000 في $BTC هي المنطقة الحاسمة.
إعادة اختبارها ستكون مهمة جدا لتحديد السيناريو القادم:
🟢 الثبات فوقها واستعادة الزخم = فرصة لاستمرار التعافي، مع مراقبة $87,700 ثم $90,000.
🔴 كسرها والثبات تحتها = احتمال استمرار التصحيح بشكل أعمق.
حاليا، الفريمات الصغيرة قد تعطي ارتدادات ومضاربات، لكن على الصورة الأكبر أنا أراقب منطقة $82K–$79.5K لأنها بالنسبة لي هي الحاسمة.
باختصار شديد، مازال هناك مساحة للتصحيح أكثر، في حال لو تريد بناء صفقات من الآن لازم تكون حذر وبإدارة مخاطر صارمة ✅️
#BTCFallsBelow$84K
#StriveBuys2000BTCFor$169M
#SECApproves3XBitcoinETF
#BinanceLaunchesBinanceIntelligence
خلوني أشوفها معكم من 3 زوايا: الأساسي، النفسي، والفني.
1️⃣ التحليل الأساسي
العوامل الحالية ما زالت تضغط على الأصول عالية المخاطر. عوائد السندات الأمريكية ارتفعت بقوة، ووصل عائد الـ30 سنة إلى 5.70%، وهو أعلى مستوى منذ 2002، بالتزامن مع بقاء أسعار النفط مرتفعة.
بمعنى آخر، الصورة الكلية ما زالت تحتاج الحذر. ممكن نشوف ارتدادات، لكن استمرار الصعود يحتاج تحسن واضح في ظروف السيولة والفائدة والهبوط دائما سيكون سيد الموقف.
2️⃣ التحليل النفسي
رغم الأخبار السلبية، السوق صعد بقوة وجذب الكثير من السيولة والمتداولين للدخول مع الزخم.
والآن نشوف الوجه الآخر للحركة: خوف، تصفيات، وبيع تحت الضغط.
وهنا تبدأ الفرصة التي أراقبها أنا شخصيا. عندما يبيع الناس بدافع الخوف، يبدأ المال الذكي بالبحث عن مناطق مناسبة لبناء مراكز، خصوصا بعد موجات التصفيات القوية.
لكن هذا لا يعني أن كل هبوط هو قاع، لازم من إدارة مخاطر.
3️⃣ التحليل الفني
بالنسبة لي، منطقة $79,500–$82,000 في $BTC هي المنطقة الحاسمة.
إعادة اختبارها ستكون مهمة جدا لتحديد السيناريو القادم:
🟢 الثبات فوقها واستعادة الزخم = فرصة لاستمرار التعافي، مع مراقبة $87,700 ثم $90,000.
🔴 كسرها والثبات تحتها = احتمال استمرار التصحيح بشكل أعمق.
حاليا، الفريمات الصغيرة قد تعطي ارتدادات ومضاربات، لكن على الصورة الأكبر أنا أراقب منطقة $82K–$79.5K لأنها بالنسبة لي هي الحاسمة.
باختصار شديد، مازال هناك مساحة للتصحيح أكثر، في حال لو تريد بناء صفقات من الآن لازم تكون حذر وبإدارة مخاطر صارمة ✅️
#BTCFallsBelow$84K
#StriveBuys2000BTCFor$169M
#SECApproves3XBitcoinETF
#BinanceLaunchesBinanceIntelligence
Cryptocurrency Champion:
👍👍👍
3
5
1k

·
--
စိစစ်အတည်ပြုထားသည်
BTC Falls Below $84K: The Market Is Testing Its Next Support
Bitcoin slipped below $84,000, extending the pullback after failing to hold the $87,000 area.
The move was not driven by crypto alone.
Around $550M+ in crypto positions were liquidated within 24 hours, with long positions taking most of the damage. That forced selling added momentum to an already fragile market.
At the same time, the macro backdrop is becoming less friendly for risk assets.
Oil prices moved higher, the 10-year US Treasury yield climbed above 5.3%, and the US dollar strengthened. Higher yields and a stronger dollar can reduce appetite for assets like Bitcoin, especially when traders are already cautious about the Fed’s next move.
Still, there is one detail worth watching: US spot Bitcoin ETFs recorded roughly $119M in net inflows on October 6. Institutional demand has not completely disappeared, but it wasn’t enough to absorb the short-term selling pressure.
For me, the key levels now are simple:
$83K–$84K: immediate support
$80K: next major area if $83K breaks
$86.5K–$87K: resistance Bitcoin needs to reclaim
A move below $84K doesn’t automatically mean the larger trend has turned bearish.
But the market is clearly asking a more important question now:
Can BTC defend the low-$80K area, or does this pullback have another leg down?
I’m watching liquidity, ETF flows and the Fed narrative closely from here.
#BTCFallsBelow$84K
$BTC $WLD $FOGO
{future}(FOGOUSDT)
{future}(WLDUSDT)
{future}(BTCUSDT)
BTC Falls Below $84K: The Market Is Testing Its Next Support
Bitcoin slipped below $84,000, extending the pullback after failing to hold the $87,000 area.
The move was not driven by crypto alone.
Around $550M+ in crypto positions were liquidated within 24 hours, with long positions taking most of the damage. That forced selling added momentum to an already fragile market.
At the same time, the macro backdrop is becoming less friendly for risk assets.
Oil prices moved higher, the 10-year US Treasury yield climbed above 5.3%, and the US dollar strengthened. Higher yields and a stronger dollar can reduce appetite for assets like Bitcoin, especially when traders are already cautious about the Fed’s next move.
Still, there is one detail worth watching: US spot Bitcoin ETFs recorded roughly $119M in net inflows on October 6. Institutional demand has not completely disappeared, but it wasn’t enough to absorb the short-term selling pressure.
For me, the key levels now are simple:
$83K–$84K: immediate support
$80K: next major area if $83K breaks
$86.5K–$87K: resistance Bitcoin needs to reclaim
A move below $84K doesn’t automatically mean the larger trend has turned bearish.
But the market is clearly asking a more important question now:
Can BTC defend the low-$80K area, or does this pullback have another leg down?
I’m watching liquidity, ETF flows and the Fed narrative closely from here.
#BTCFallsBelow$84K
$BTC $WLD $FOGO
Bitcoin slipped below $84,000, extending the pullback after failing to hold the $87,000 area.
The move was not driven by crypto alone.
Around $550M+ in crypto positions were liquidated within 24 hours, with long positions taking most of the damage. That forced selling added momentum to an already fragile market.
At the same time, the macro backdrop is becoming less friendly for risk assets.
Oil prices moved higher, the 10-year US Treasury yield climbed above 5.3%, and the US dollar strengthened. Higher yields and a stronger dollar can reduce appetite for assets like Bitcoin, especially when traders are already cautious about the Fed’s next move.
Still, there is one detail worth watching: US spot Bitcoin ETFs recorded roughly $119M in net inflows on October 6. Institutional demand has not completely disappeared, but it wasn’t enough to absorb the short-term selling pressure.
For me, the key levels now are simple:
$83K–$84K: immediate support
$80K: next major area if $83K breaks
$86.5K–$87K: resistance Bitcoin needs to reclaim
A move below $84K doesn’t automatically mean the larger trend has turned bearish.
But the market is clearly asking a more important question now:
Can BTC defend the low-$80K area, or does this pullback have another leg down?
I’m watching liquidity, ETF flows and the Fed narrative closely from here.
#BTCFallsBelow$84K
$BTC $WLD $FOGO

kashif Raaz open:
The ETF inflow detail is the most important counterweight here — $119M in net inflows during a $550M liquidation flush means real spot demand absorbed the leveraged panic. That's structurally bullish even if price hasn't shown it yet. My read: the low-$80Ks hold as long as ETF flows stay positive, because spot buying puts a floor under the leverage washout. Another leg down needs a macro shock, not just positioning.
3
10
16.4k

·
--

Article
$101 Million Worth of Crypto Transferred from US Government-Linked Wallets!While the leading cryptocurrency Bitcoin has been trading sideways in recent days, new developments in the markets have increased selling pressure. The price of $BTC has fallen to levels around $84,000.
At this point, activity in US government-linked wallets and tensions around the Strait of Hormuz, which pushed oil prices above $100, put pressure on global risk appetite and increased selling pressure on Bitcoin, causing a sudden drop in price.
This sudden drop led to liquidations of approximately $550 million in the crypto market within hours; the majority of losses came from long positions.
$101 Million Worth of Crypto Transferred from US Government-Linked Wallets!
A noticeable surge in cryptocurrency wallets linked to the US government has been observed. According to the on-chain tracking platform Lookonchain, Bitcoin and $BNB totaling approximately $103 million were transferred from government-linked addresses.
At this point, the US government completed Bitcoin transfers exceeding $70 million last night and $BNB transfers this morning.
Bitcoin accounted for the largest portion of the transfers. A US-linked address sent 833.6 $BTC, worth approximately $71 million, to Coinbase Prime.During the same process, approximately 40,285 $BNB , worth about $31.63 million, were also transferred. Unlike Bitcoin, $BNB was sent to an unknown address after multiple transfers.The wallets still contain approximately $27.5 billion worth of cryptocurrencies.
#BinanceLaunchesBinanceIntelligence #BTCFallsBelow$84K
#WinklevossFilesSpotZcashETFApplication
$101 Million Worth of Crypto Transferred from US Government-Linked Wallets!
While the leading cryptocurrency Bitcoin has been trading sideways in recent days, new developments in the markets have increased selling pressure. The price of $BTC has fallen to levels around $84,000.
At this point, activity in US government-linked wallets and tensions around the Strait of Hormuz, which pushed oil prices above $100, put pressure on global risk appetite and increased selling pressure on Bitcoin, causing a sudden drop in price.
This sudden drop led to liquidations of approximately $550 million in the crypto market within hours; the majority of losses came from long positions.
$101 Million Worth of Crypto Transferred from US Government-Linked Wallets!
A noticeable surge in cryptocurrency wallets linked to the US government has been observed. According to the on-chain tracking platform Lookonchain, Bitcoin and $BNB totaling approximately $103 million were transferred from government-linked addresses.
At this point, the US government completed Bitcoin transfers exceeding $70 million last night and $BNB transfers this morning.
Bitcoin accounted for the largest portion of the transfers. A US-linked address sent 833.6 $BTC, worth approximately $71 million, to Coinbase Prime.During the same process, approximately 40,285 $BNB , worth about $31.63 million, were also transferred. Unlike Bitcoin, $BNB was sent to an unknown address after multiple transfers.The wallets still contain approximately $27.5 billion worth of cryptocurrencies.
#BinanceLaunchesBinanceIntelligence #BTCFallsBelow$84K
#WinklevossFilesSpotZcashETFApplication
At this point, activity in US government-linked wallets and tensions around the Strait of Hormuz, which pushed oil prices above $100, put pressure on global risk appetite and increased selling pressure on Bitcoin, causing a sudden drop in price.
This sudden drop led to liquidations of approximately $550 million in the crypto market within hours; the majority of losses came from long positions.
$101 Million Worth of Crypto Transferred from US Government-Linked Wallets!
A noticeable surge in cryptocurrency wallets linked to the US government has been observed. According to the on-chain tracking platform Lookonchain, Bitcoin and $BNB totaling approximately $103 million were transferred from government-linked addresses.
At this point, the US government completed Bitcoin transfers exceeding $70 million last night and $BNB transfers this morning.
Bitcoin accounted for the largest portion of the transfers. A US-linked address sent 833.6 $BTC, worth approximately $71 million, to Coinbase Prime.During the same process, approximately 40,285 $BNB , worth about $31.63 million, were also transferred. Unlike Bitcoin, $BNB was sent to an unknown address after multiple transfers.The wallets still contain approximately $27.5 billion worth of cryptocurrencies.
#BinanceLaunchesBinanceIntelligence #BTCFallsBelow$84K
#WinklevossFilesSpotZcashETFApplication
442

·
--
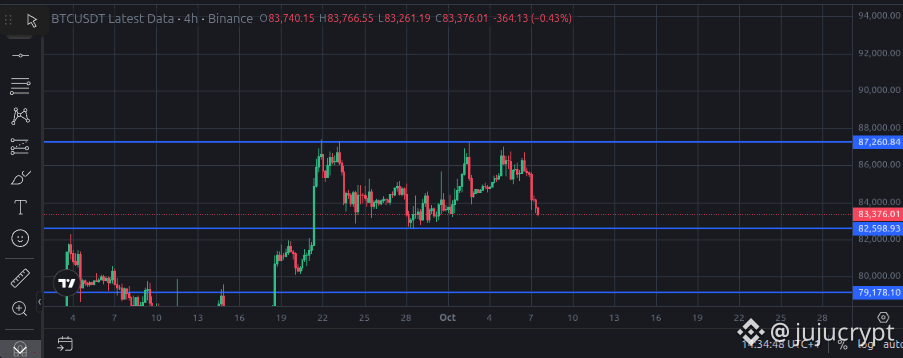
Yesterday, U.S. stocks pumped and hit new all-time highs.
That likely gave traders more confidence to open long positions on $BTC and $ETH , expecting crypto to follow.
But today, the market moved the other way and triggered a wave of liquidations.
Over $550M in crypto positions were liquidated.
Just shows how quickly leverage can turn a normal pullback into a bigger move.
#BTCFallsBelow$84K
Yesterday, U.S. stocks pumped and hit new all-time highs.
That likely gave traders more confidence to open long positions on $BTC and $ETH , expecting crypto to follow.
But today, the market moved the other way and triggered a wave of liquidations.
Over $550M in crypto positions were liquidated.
Just shows how quickly leverage can turn a normal pullback into a bigger move.
#BTCFallsBelow$84K
That likely gave traders more confidence to open long positions on $BTC and $ETH , expecting crypto to follow.
But today, the market moved the other way and triggered a wave of liquidations.
Over $550M in crypto positions were liquidated.
Just shows how quickly leverage can turn a normal pullback into a bigger move.
#BTCFallsBelow$84K
kashif Raaz open:
Classic trap sequence — equities printing ATHs while BTC breaks structure lower, and retail piles into leveraged longs expecting the catch-up trade. The $550M in liquidations shows exactly how crowded that long side had become. Markets rarely hand out the obvious rotation without shaking out the leveraged money first.
1
8
28.4k

·
--
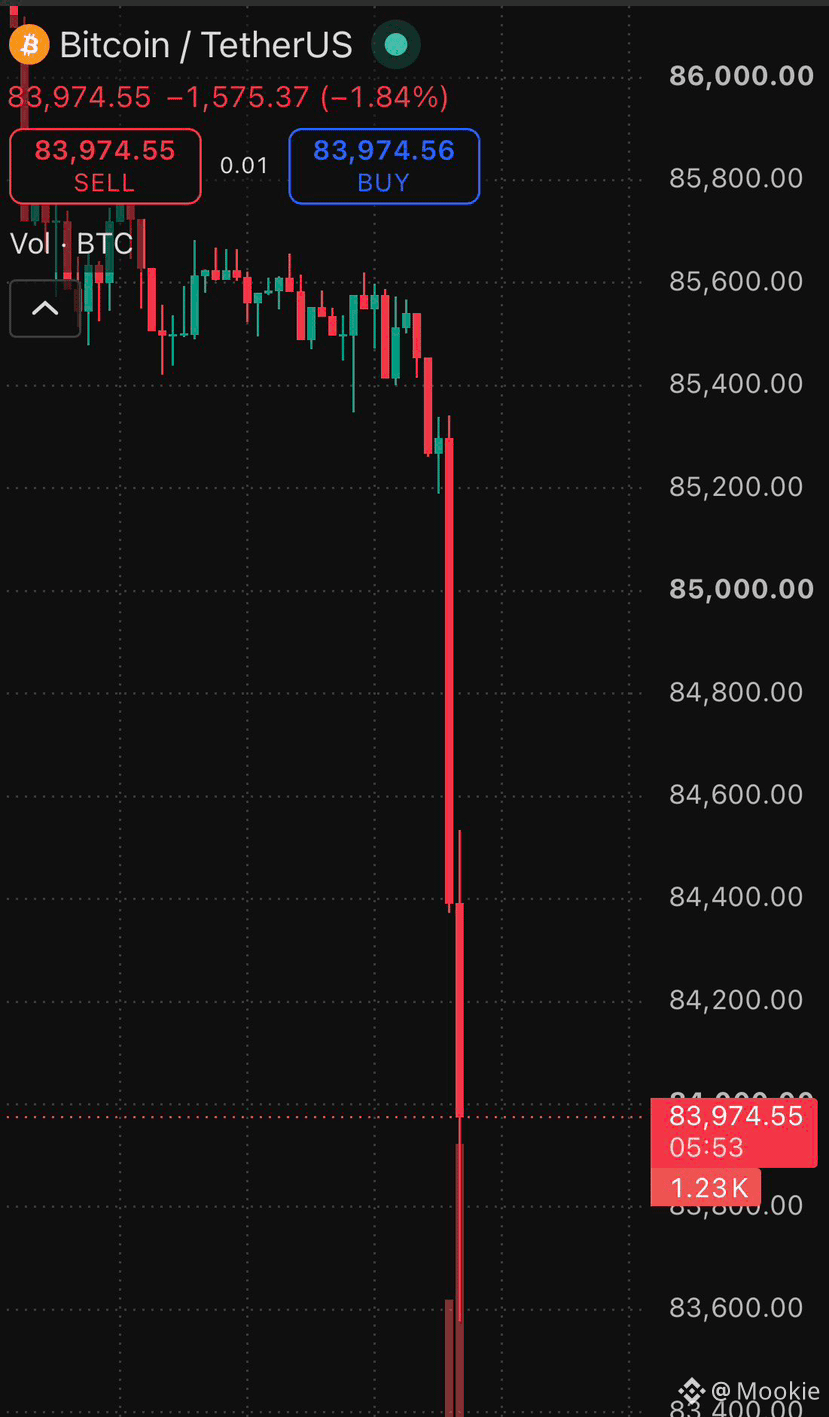
$400M in $BTC LONGS liquidated in just 15 MINUTES 🩸
Bitcoin’s drop below $84K triggered a major leverage flush, forcing heavily leveraged longs out of the market and adding more selling pressure.
Now the reaction matters. A quick reclaim of $84K would be a good sign, while staying below it puts $82.7K back in focus.
Let’s see if buyers step in here.
#bitcoin
{spot}(BTCUSDT)
$400M in $BTC LONGS liquidated in just 15 MINUTES 🩸
Bitcoin’s drop below $84K triggered a major leverage flush, forcing heavily leveraged longs out of the market and adding more selling pressure.
Now the reaction matters. A quick reclaim of $84K would be a good sign, while staying below it puts $82.7K back in focus.
Let’s see if buyers step in here.
#bitcoin
Bitcoin’s drop below $84K triggered a major leverage flush, forcing heavily leveraged longs out of the market and adding more selling pressure.
Now the reaction matters. A quick reclaim of $84K would be a good sign, while staying below it puts $82.7K back in focus.
Let’s see if buyers step in here.
#bitcoin
kashif Raaz open:
The speed is the story here — $400M in 15 minutes means this wasn't distribution, it was a pure leverage event. Forced sellers don't discriminate on price, which is why these flushes often mark short-term bottoms rather than breakdowns. The reclaim test you mention is exactly right: if BTC gets back above $84K quickly, the market just reset positioning at a discount. If it can't, the flush becomes the first leg, not the washout.
44
15
147
232.6k

Article
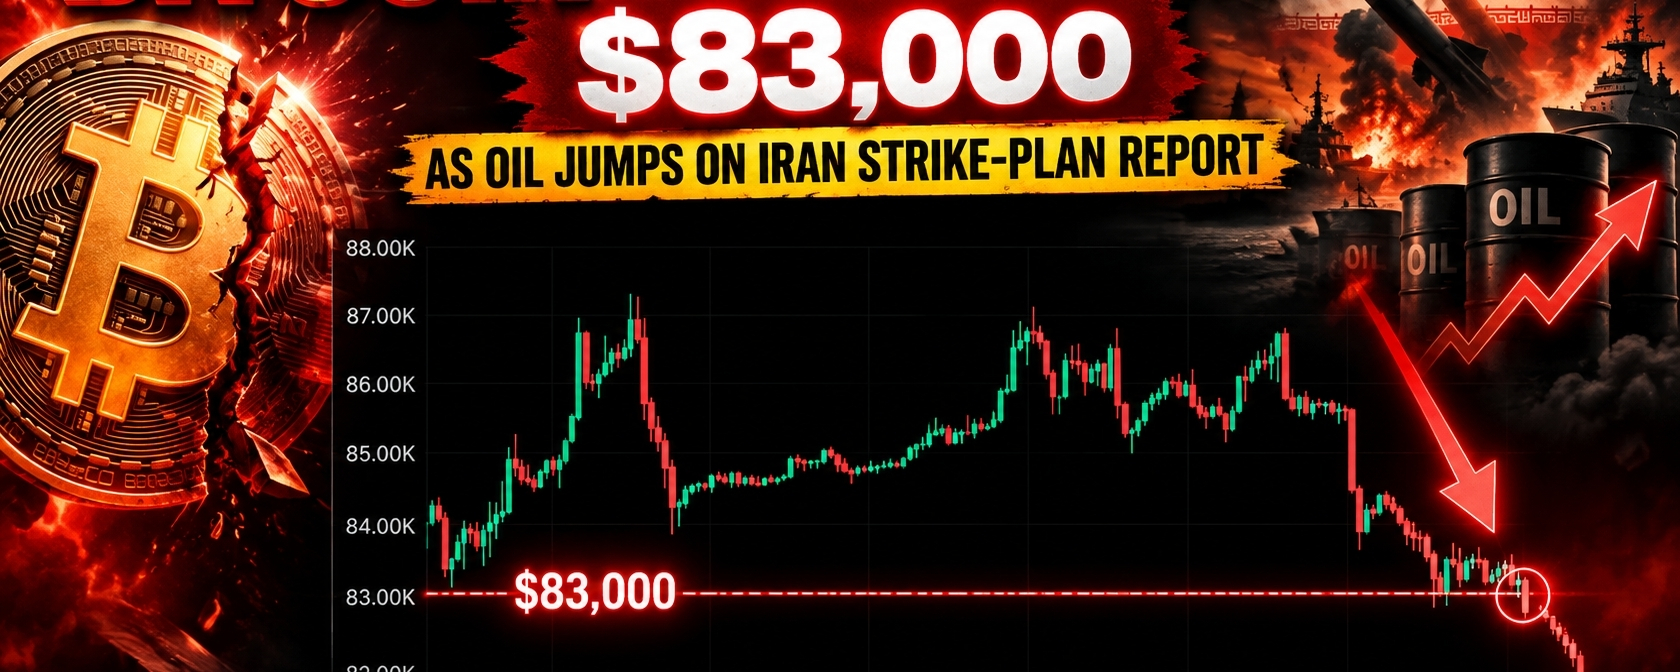
Bitcoin Slips Below $83K as Oil Surge Adds Pressure to Risk AssetsBitcoin came under renewed selling pressure as it dropped below the $83,000 level, with rising geopolitical tensions and a sharp move in oil prices adding another layer of uncertainty to already-fragile markets.
BTC fell roughly 1.6% to around $82,800 during Thursday’s Asian session. The breakdown is significant because the $83K area had been acting as an important short-term level. AmirRajpootBnB noted that a sustained move below this zone could potentially open a faster path toward $80,000.
The move in Bitcoin coincided with a major jump in crude oil. Brent crude moved above $102, reportedly after news that the White House had asked the Pentagon to prepare potential strike options involving Iran. The geopolitical risk pushed investors toward safer assets and contributed to higher Treasury yields, which were again approaching levels not seen since 2002.
Altcoins Feel the Pressure
The broader crypto market also weakened.
XRP was among the biggest major-coin losers, falling nearly 4% to around $1.42. DOGE declined about 3%, while Ethereum dropped roughly 3% toward $2,570.
Meanwhile, HYPE and SOL both lost more than 2%, while ZEC slipped less than 1%.
Interestingly, BNB and TRX managed to remain in positive territory, each gaining less than 1% while much of the market traded lower.
What Comes Next?
The key question now is whether Bitcoin can quickly reclaim $83,000 or whether the breakdown develops into a deeper correction.
The combination of higher oil prices, geopolitical uncertainty, rising yields and weaker risk appetite creates a difficult environment for crypto in the short term.
Still, one important point remains: a breakdown is not automatically a guaranteed collapse. Bitcoin needs confirmation below support before traders assume the next major leg lower is underway.
For now, $83K is the level to watch closely. If bulls reclaim it, the breakdown could prove temporary. If sellers continue defending below it, $80K becomes an increasingly important downside area.
#BinanceLaunchesBinanceIntelligence
#SP500AndNasdaqHitRecordHighs #BTCFallsBelow$84K #SECApproves3XBitcoinETF
Bitcoin Slips Below $83K as Oil Surge Adds Pressure to Risk Assets
Bitcoin came under renewed selling pressure as it dropped below the $83,000 level, with rising geopolitical tensions and a sharp move in oil prices adding another layer of uncertainty to already-fragile markets.
BTC fell roughly 1.6% to around $82,800 during Thursday’s Asian session. The breakdown is significant because the $83K area had been acting as an important short-term level. AmirRajpootBnB noted that a sustained move below this zone could potentially open a faster path toward $80,000.
The move in Bitcoin coincided with a major jump in crude oil. Brent crude moved above $102, reportedly after news that the White House had asked the Pentagon to prepare potential strike options involving Iran. The geopolitical risk pushed investors toward safer assets and contributed to higher Treasury yields, which were again approaching levels not seen since 2002.
Altcoins Feel the Pressure
The broader crypto market also weakened.
XRP was among the biggest major-coin losers, falling nearly 4% to around $1.42. DOGE declined about 3%, while Ethereum dropped roughly 3% toward $2,570.
Meanwhile, HYPE and SOL both lost more than 2%, while ZEC slipped less than 1%.
Interestingly, BNB and TRX managed to remain in positive territory, each gaining less than 1% while much of the market traded lower.
What Comes Next?
The key question now is whether Bitcoin can quickly reclaim $83,000 or whether the breakdown develops into a deeper correction.
The combination of higher oil prices, geopolitical uncertainty, rising yields and weaker risk appetite creates a difficult environment for crypto in the short term.
Still, one important point remains: a breakdown is not automatically a guaranteed collapse. Bitcoin needs confirmation below support before traders assume the next major leg lower is underway.
For now, $83K is the level to watch closely. If bulls reclaim it, the breakdown could prove temporary. If sellers continue defending below it, $80K becomes an increasingly important downside area.
#BinanceLaunchesBinanceIntelligence
#SP500AndNasdaqHitRecordHighs #BTCFallsBelow$84K #SECApproves3XBitcoinETF
BTC fell roughly 1.6% to around $82,800 during Thursday’s Asian session. The breakdown is significant because the $83K area had been acting as an important short-term level. AmirRajpootBnB noted that a sustained move below this zone could potentially open a faster path toward $80,000.
The move in Bitcoin coincided with a major jump in crude oil. Brent crude moved above $102, reportedly after news that the White House had asked the Pentagon to prepare potential strike options involving Iran. The geopolitical risk pushed investors toward safer assets and contributed to higher Treasury yields, which were again approaching levels not seen since 2002.
Altcoins Feel the Pressure
The broader crypto market also weakened.
XRP was among the biggest major-coin losers, falling nearly 4% to around $1.42. DOGE declined about 3%, while Ethereum dropped roughly 3% toward $2,570.
Meanwhile, HYPE and SOL both lost more than 2%, while ZEC slipped less than 1%.
Interestingly, BNB and TRX managed to remain in positive territory, each gaining less than 1% while much of the market traded lower.
What Comes Next?
The key question now is whether Bitcoin can quickly reclaim $83,000 or whether the breakdown develops into a deeper correction.
The combination of higher oil prices, geopolitical uncertainty, rising yields and weaker risk appetite creates a difficult environment for crypto in the short term.
Still, one important point remains: a breakdown is not automatically a guaranteed collapse. Bitcoin needs confirmation below support before traders assume the next major leg lower is underway.
For now, $83K is the level to watch closely. If bulls reclaim it, the breakdown could prove temporary. If sellers continue defending below it, $80K becomes an increasingly important downside area.
#BinanceLaunchesBinanceIntelligence
#SP500AndNasdaqHitRecordHighs #BTCFallsBelow$84K #SECApproves3XBitcoinETF
3
515

·
--
$BTC ₿ Bitcoin (BTC) — Latest Analysis
October 8, 2026
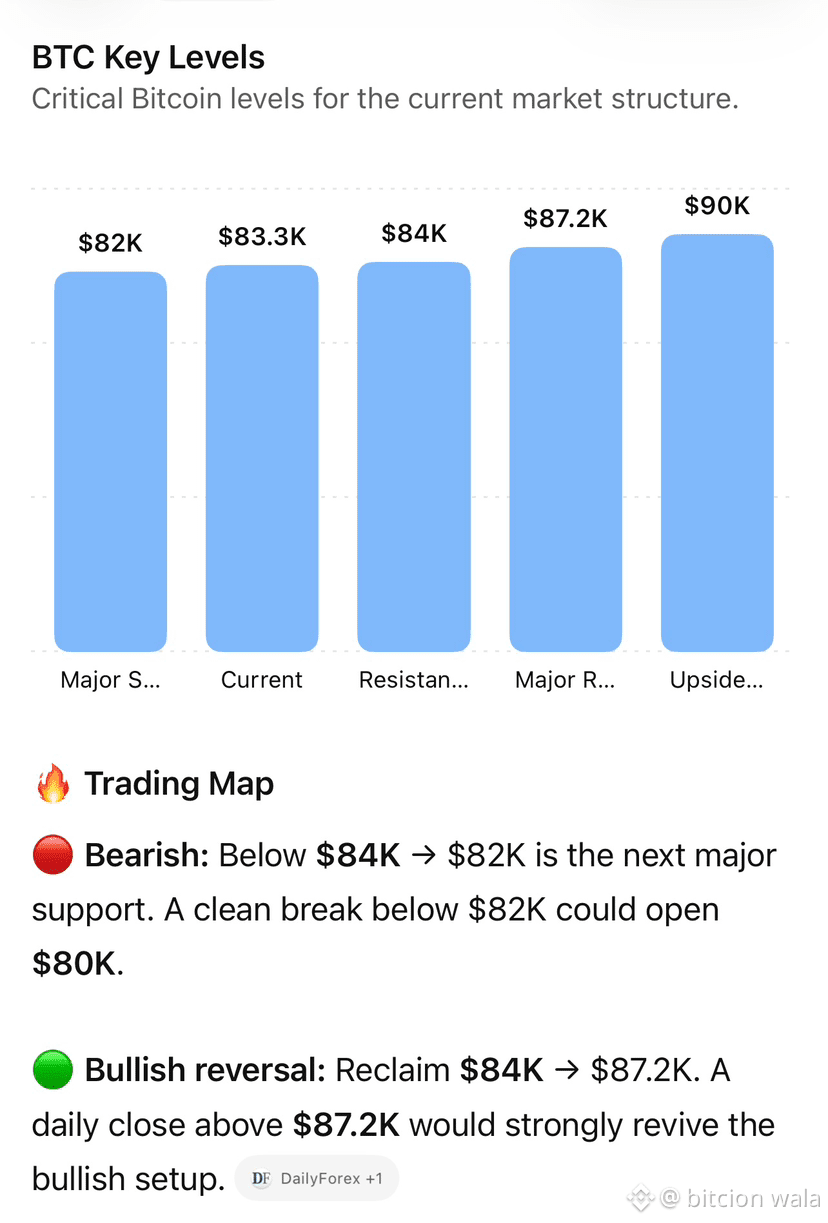
BTC ≈ $83.3K — Bitcoin has turned short-term bearish after failing repeatedly near $87K and breaking below $84K. Rising U.S. Treasury yields and a stronger dollar are currently pressuring risk assets.
🔥 Trading Map
🔴 Bearish: Below $84K → $82K is the next major support. A clean break below $82K could open $80K.
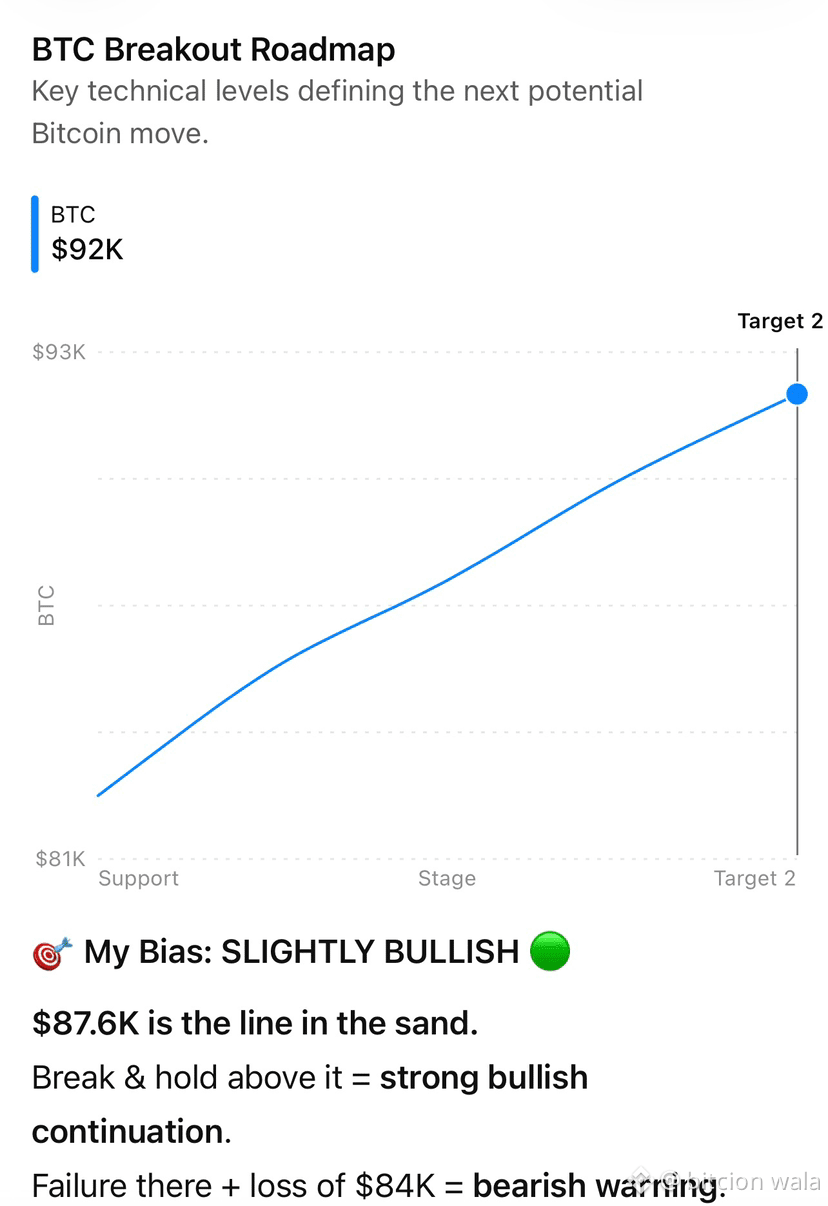
🟢 Bullish reversal: Reclaim $84K → $87.2K. A daily close above $87.2K would strongly revive the bullish setup.
🎯 My Bias: BEARISH ⚠️
$84K is now the key level.
Below it → $82K/$80K risk.
Above it again → momentum can recover toward $87K–$90K.
Macro warning: U.S. 10Y Treasury yield recently reached 5.36%, creating significant pressure on BTC. #FedMinutesFocusOnOctoberPause #EvernorthDelaysNasdaqDebutToOct12 #BTCFallsBelow$84K #USMortgageRatesRiseTo7.49%
$BTC ₿ Bitcoin (BTC) — Latest Analysis
October 8, 2026
BTC ≈ $83.3K — Bitcoin has turned short-term bearish after failing repeatedly near $87K and breaking below $84K. Rising U.S. Treasury yields and a stronger dollar are currently pressuring risk assets.
🔥 Trading Map
🔴 Bearish: Below $84K → $82K is the next major support. A clean break below $82K could open $80K.
🟢 Bullish reversal: Reclaim $84K → $87.2K. A daily close above $87.2K would strongly revive the bullish setup.
🎯 My Bias: BEARISH ⚠️
$84K is now the key level.
Below it → $82K/$80K risk.
Above it again → momentum can recover toward $87K–$90K.
Macro warning: U.S. 10Y Treasury yield recently reached 5.36%, creating significant pressure on BTC. #FedMinutesFocusOnOctoberPause #EvernorthDelaysNasdaqDebutToOct12 #BTCFallsBelow$84K #USMortgageRatesRiseTo7.49%
October 8, 2026
BTC ≈ $83.3K — Bitcoin has turned short-term bearish after failing repeatedly near $87K and breaking below $84K. Rising U.S. Treasury yields and a stronger dollar are currently pressuring risk assets.
🔥 Trading Map
🔴 Bearish: Below $84K → $82K is the next major support. A clean break below $82K could open $80K.
🟢 Bullish reversal: Reclaim $84K → $87.2K. A daily close above $87.2K would strongly revive the bullish setup.
🎯 My Bias: BEARISH ⚠️
$84K is now the key level.
Below it → $82K/$80K risk.
Above it again → momentum can recover toward $87K–$90K.
Macro warning: U.S. 10Y Treasury yield recently reached 5.36%, creating significant pressure on BTC. #FedMinutesFocusOnOctoberPause #EvernorthDelaysNasdaqDebutToOct12 #BTCFallsBelow$84K #USMortgageRatesRiseTo7.49%
92

·
--
ကျရိပ်ရှိသည်
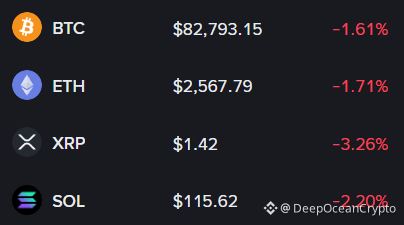
📍 BTC ($82.7K): Just testing support before the next big expansion. Healthy pullbacks build the strongest bull runs. 📍 ETH & SOL ($2.5K & $115): Mid-cap giants taking a quick breath after recent momentum. 📍 XRP ($1.42): Shakeout mode to clear high-leverage late longs.
Remember: Red days are where wealth is created, green days are just where it’s celebrated. 📈✨
Are you accumulating on this discount, or waiting for higher confirmation?
#crypto #MarketAnalysis #BinanceLaunchesBinanceIntelligence #FedMinutesFocusOnOctoberPause #BTCFallsBelow$84K
{future}(XRPUSDT)
{future}(ETHUSDT)
{future}(BTCUSDT)
📍 BTC ($82.7K): Just testing support before the next big expansion. Healthy pullbacks build the strongest bull runs. 📍 ETH & SOL ($2.5K & $115): Mid-cap giants taking a quick breath after recent momentum. 📍 XRP ($1.42): Shakeout mode to clear high-leverage late longs.
Remember: Red days are where wealth is created, green days are just where it’s celebrated. 📈✨
Are you accumulating on this discount, or waiting for higher confirmation?
#crypto #MarketAnalysis #BinanceLaunchesBinanceIntelligence #FedMinutesFocusOnOctoberPause #BTCFallsBelow$84K
Remember: Red days are where wealth is created, green days are just where it’s celebrated. 📈✨
Are you accumulating on this discount, or waiting for higher confirmation?
#crypto #MarketAnalysis #BinanceLaunchesBinanceIntelligence #FedMinutesFocusOnOctoberPause #BTCFallsBelow$84K
1
228

Article
➤ Bitcoin Slips to $83K: Panic or Healthy Reset? Here's What the Data Says$BTC
◆━━━━━━━━━━━━━━━━━━◆
If you opened your charts this morning and felt your stomach drop, you're not alone. 😅
Bitcoin is trading around $83,260 on the perpetual market, down about 0.70% on the day. Over the last 24 hours, price has moved between $82,726 and $84,364.
After a strong run earlier this month, this pullback feels sharp.
But sharp doesn't always mean random.
Let's break down what's actually happening.
◆━━━━━━━━━━━━━━━━━━◆
① THE LEVERAGE FLUSH
This is the biggest driver.
As BTC failed to clear resistance near $87,000, a crowd of traders was already positioned long. When price slipped under $84,000, forced liquidations kicked in.
✔︎ Roughly $546M–$609M was liquidated across crypto in 24 hours
✔︎ About 88%–94% of Bitcoin liquidations were long positions
✔︎ Open interest still sits near $1.49B on the chart, so leverage hasn't fully left the room
When longs get forced out, selling feeds on itself.
Price falls → Positions get liquidated → More selling hits the market → Price falls again.
That's how a normal dip can turn into a fast drop.
◆━━━━━━━━━━━━━━━━━━◆
② ETF DEMAND COOLED
Institutional flows matter more than many traders realize.
➤ Spot Bitcoin ETFs saw about $89.9M in net outflows on October 5
➤ That came right after roughly $293M of inflows over the previous two sessions
One red day doesn't change the trend.
However, when flows swing from strong buying to selling at the exact moment price hits resistance, it removes a cushion the market was leaning on.
◆━━━━━━━━━━━━━━━━━━◆
③ MACRO PRESSURE IS BACK
Bitcoin doesn't trade in a bubble.
✔︎ Treasury yields have been rising
✔︎ The US dollar has been getting stronger
✔︎ Oil prices have climbed amid geopolitical tension
✔︎ Traders are waiting on the Fed minutes and the October 14 US CPI data
Higher yields and a stronger dollar often pull money away from risk assets.
Add major economic events into the mix, and many traders prefer to reduce exposure until the picture becomes clearer.
◆━━━━━━━━━━━━━━━━━━◆
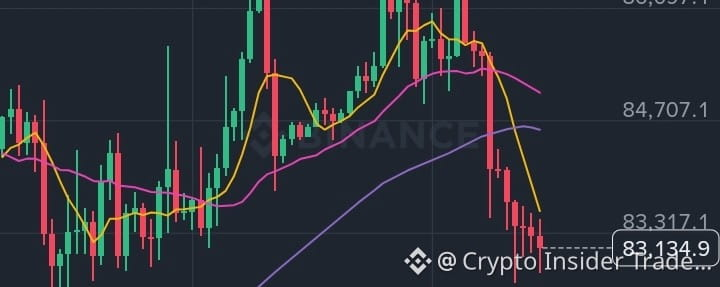
WHAT THE 4H CHART IS SHOWING
Looking at the 4-hour structure:
➜ Price was rejected near the $87,222 high and has been making lower highs since
➜ BTC is trading below the MA(5) at ~83,435, MA(10) at ~84,217, and MA(20) at ~85,047
➜ The recent swing low sits near $82,555
➜ Volume picked up on the red candles, which shows sellers were active
Short-term momentum is clearly bearish.
But this is a short-term read, and the broader range has not broken yet.
◆━━━━━━━━━━━━━━━━━━◆
LEVELS ANALYSTS ARE WATCHING
Not predictions—just reference points.
◆ Around $83,000 is a key support area many are watching
◆ Around $81,300–$82,600 is the next zone below that
◆ Around $84,000–$85,000 is resistance now, since old support is acting as a ceiling
◆ Some analysts see a broader range of $81,300–$86,500 into the CPI release
If price holds the range, this may simply be consolidation.
If support fails alongside weak flows, volatility could expand.
Neither outcome is guaranteed.
◆━━━━━━━━━━━━━━━━━━◆
THE LESSON HERE
Most traders ask:
"Why is it dropping?"
A better question might be:
"Was I positioned for volatility?"
✔︎ Size positions so a normal swing doesn't force you out
✔︎ Be careful with high leverage around major data releases
✔︎ Wait for confirmation instead of chasing every candle
✔︎ Have a plan before the move, not during it
Dips don't hurt traders. Unplanned dips do.
◆━━━━━━━━━━━━━━━━━━◆
FINAL THOUGHTS
Bitcoin's drop appears to be driven by three forces stacking together:
① A leverage flush
② Cooling ETF flows
③ Macro pressure
That's a market resetting, not necessarily a market breaking.
The traders who last are usually the ones who manage risk first and opinions second.
What do you think: healthy reset or something deeper?
Share this with a trader friend who needs a calm take today.
Follow for more clear, no-hype market breakdowns.
Disclaimer: This content is for educational and informational purposes only and is not financial advice. Crypto assets are highly volatile and carry significant risk, including the loss of your capital. Always do your own research and only trade with funds you can afford to lose.
◆━━━━━━━━━━━━━━━━━━◆
#RobinhoodAdds$25MInBitcoinToBalanceSheet #FedMinutesFocusOnOctoberPause #BTCFallsBelow$84K #SECApproves3XBitcoinETF #BTC☀
{future}(BTCUSDT)
➤ Bitcoin Slips to $83K: Panic or Healthy Reset? Here's What the Data Says
$BTC
◆━━━━━━━━━━━━━━━━━━◆
If you opened your charts this morning and felt your stomach drop, you're not alone. 😅
Bitcoin is trading around $83,260 on the perpetual market, down about 0.70% on the day. Over the last 24 hours, price has moved between $82,726 and $84,364.
After a strong run earlier this month, this pullback feels sharp.
But sharp doesn't always mean random.
Let's break down what's actually happening.
◆━━━━━━━━━━━━━━━━━━◆
① THE LEVERAGE FLUSH
This is the biggest driver.
As BTC failed to clear resistance near $87,000, a crowd of traders was already positioned long. When price slipped under $84,000, forced liquidations kicked in.
✔︎ Roughly $546M–$609M was liquidated across crypto in 24 hours
✔︎ About 88%–94% of Bitcoin liquidations were long positions
✔︎ Open interest still sits near $1.49B on the chart, so leverage hasn't fully left the room
When longs get forced out, selling feeds on itself.
Price falls → Positions get liquidated → More selling hits the market → Price falls again.
That's how a normal dip can turn into a fast drop.
◆━━━━━━━━━━━━━━━━━━◆
② ETF DEMAND COOLED
Institutional flows matter more than many traders realize.
➤ Spot Bitcoin ETFs saw about $89.9M in net outflows on October 5
➤ That came right after roughly $293M of inflows over the previous two sessions
One red day doesn't change the trend.
However, when flows swing from strong buying to selling at the exact moment price hits resistance, it removes a cushion the market was leaning on.
◆━━━━━━━━━━━━━━━━━━◆
③ MACRO PRESSURE IS BACK
Bitcoin doesn't trade in a bubble.
✔︎ Treasury yields have been rising
✔︎ The US dollar has been getting stronger
✔︎ Oil prices have climbed amid geopolitical tension
✔︎ Traders are waiting on the Fed minutes and the October 14 US CPI data
Higher yields and a stronger dollar often pull money away from risk assets.
Add major economic events into the mix, and many traders prefer to reduce exposure until the picture becomes clearer.
◆━━━━━━━━━━━━━━━━━━◆
WHAT THE 4H CHART IS SHOWING
Looking at the 4-hour structure:
➜ Price was rejected near the $87,222 high and has been making lower highs since
➜ BTC is trading below the MA(5) at ~83,435, MA(10) at ~84,217, and MA(20) at ~85,047
➜ The recent swing low sits near $82,555
➜ Volume picked up on the red candles, which shows sellers were active
Short-term momentum is clearly bearish.
But this is a short-term read, and the broader range has not broken yet.
◆━━━━━━━━━━━━━━━━━━◆
LEVELS ANALYSTS ARE WATCHING
Not predictions—just reference points.
◆ Around $83,000 is a key support area many are watching
◆ Around $81,300–$82,600 is the next zone below that
◆ Around $84,000–$85,000 is resistance now, since old support is acting as a ceiling
◆ Some analysts see a broader range of $81,300–$86,500 into the CPI release
If price holds the range, this may simply be consolidation.
If support fails alongside weak flows, volatility could expand.
Neither outcome is guaranteed.
◆━━━━━━━━━━━━━━━━━━◆
THE LESSON HERE
Most traders ask:
"Why is it dropping?"
A better question might be:
"Was I positioned for volatility?"
✔︎ Size positions so a normal swing doesn't force you out
✔︎ Be careful with high leverage around major data releases
✔︎ Wait for confirmation instead of chasing every candle
✔︎ Have a plan before the move, not during it
Dips don't hurt traders. Unplanned dips do.
◆━━━━━━━━━━━━━━━━━━◆
FINAL THOUGHTS
Bitcoin's drop appears to be driven by three forces stacking together:
① A leverage flush
② Cooling ETF flows
③ Macro pressure
That's a market resetting, not necessarily a market breaking.
The traders who last are usually the ones who manage risk first and opinions second.
What do you think: healthy reset or something deeper?
Share this with a trader friend who needs a calm take today.
Follow for more clear, no-hype market breakdowns.
Disclaimer: This content is for educational and informational purposes only and is not financial advice. Crypto assets are highly volatile and carry significant risk, including the loss of your capital. Always do your own research and only trade with funds you can afford to lose.
◆━━━━━━━━━━━━━━━━━━◆
#RobinhoodAdds$25MInBitcoinToBalanceSheet #FedMinutesFocusOnOctoberPause #BTCFallsBelow$84K #SECApproves3XBitcoinETF #BTC☀
◆━━━━━━━━━━━━━━━━━━◆
If you opened your charts this morning and felt your stomach drop, you're not alone. 😅
Bitcoin is trading around $83,260 on the perpetual market, down about 0.70% on the day. Over the last 24 hours, price has moved between $82,726 and $84,364.
After a strong run earlier this month, this pullback feels sharp.
But sharp doesn't always mean random.
Let's break down what's actually happening.
◆━━━━━━━━━━━━━━━━━━◆
① THE LEVERAGE FLUSH
This is the biggest driver.
As BTC failed to clear resistance near $87,000, a crowd of traders was already positioned long. When price slipped under $84,000, forced liquidations kicked in.
✔︎ Roughly $546M–$609M was liquidated across crypto in 24 hours
✔︎ About 88%–94% of Bitcoin liquidations were long positions
✔︎ Open interest still sits near $1.49B on the chart, so leverage hasn't fully left the room
When longs get forced out, selling feeds on itself.
Price falls → Positions get liquidated → More selling hits the market → Price falls again.
That's how a normal dip can turn into a fast drop.
◆━━━━━━━━━━━━━━━━━━◆
② ETF DEMAND COOLED
Institutional flows matter more than many traders realize.
➤ Spot Bitcoin ETFs saw about $89.9M in net outflows on October 5
➤ That came right after roughly $293M of inflows over the previous two sessions
One red day doesn't change the trend.
However, when flows swing from strong buying to selling at the exact moment price hits resistance, it removes a cushion the market was leaning on.
◆━━━━━━━━━━━━━━━━━━◆
③ MACRO PRESSURE IS BACK
Bitcoin doesn't trade in a bubble.
✔︎ Treasury yields have been rising
✔︎ The US dollar has been getting stronger
✔︎ Oil prices have climbed amid geopolitical tension
✔︎ Traders are waiting on the Fed minutes and the October 14 US CPI data
Higher yields and a stronger dollar often pull money away from risk assets.
Add major economic events into the mix, and many traders prefer to reduce exposure until the picture becomes clearer.
◆━━━━━━━━━━━━━━━━━━◆
WHAT THE 4H CHART IS SHOWING
Looking at the 4-hour structure:
➜ Price was rejected near the $87,222 high and has been making lower highs since
➜ BTC is trading below the MA(5) at ~83,435, MA(10) at ~84,217, and MA(20) at ~85,047
➜ The recent swing low sits near $82,555
➜ Volume picked up on the red candles, which shows sellers were active
Short-term momentum is clearly bearish.
But this is a short-term read, and the broader range has not broken yet.
◆━━━━━━━━━━━━━━━━━━◆
LEVELS ANALYSTS ARE WATCHING
Not predictions—just reference points.
◆ Around $83,000 is a key support area many are watching
◆ Around $81,300–$82,600 is the next zone below that
◆ Around $84,000–$85,000 is resistance now, since old support is acting as a ceiling
◆ Some analysts see a broader range of $81,300–$86,500 into the CPI release
If price holds the range, this may simply be consolidation.
If support fails alongside weak flows, volatility could expand.
Neither outcome is guaranteed.
◆━━━━━━━━━━━━━━━━━━◆
THE LESSON HERE
Most traders ask:
"Why is it dropping?"
A better question might be:
"Was I positioned for volatility?"
✔︎ Size positions so a normal swing doesn't force you out
✔︎ Be careful with high leverage around major data releases
✔︎ Wait for confirmation instead of chasing every candle
✔︎ Have a plan before the move, not during it
Dips don't hurt traders. Unplanned dips do.
◆━━━━━━━━━━━━━━━━━━◆
FINAL THOUGHTS
Bitcoin's drop appears to be driven by three forces stacking together:
① A leverage flush
② Cooling ETF flows
③ Macro pressure
That's a market resetting, not necessarily a market breaking.
The traders who last are usually the ones who manage risk first and opinions second.
What do you think: healthy reset or something deeper?
Share this with a trader friend who needs a calm take today.
Follow for more clear, no-hype market breakdowns.
Disclaimer: This content is for educational and informational purposes only and is not financial advice. Crypto assets are highly volatile and carry significant risk, including the loss of your capital. Always do your own research and only trade with funds you can afford to lose.
◆━━━━━━━━━━━━━━━━━━◆
#RobinhoodAdds$25MInBitcoinToBalanceSheet #FedMinutesFocusOnOctoberPause #BTCFallsBelow$84K #SECApproves3XBitcoinETF #BTC☀
321

·
--
ကျရိပ်ရှိသည်
GM Market Briefing☕️
Thursday, October 8 2026
$BTC Outlook (GMT):
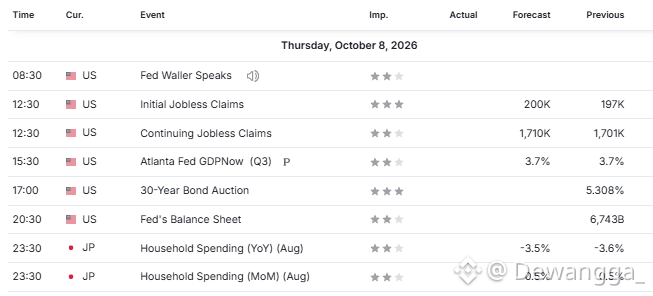
🟥00:00–09:00 → Down => Asian session. China holiday, thin liquidity. Bitcoin continues to bleed after yesterday's crash. Fed Waller speaks at 08:30 but no major impact expected.
🟨09:00–11:00 → Slow => London open. Markets digest Waller and wait for US data. Range-bound with a bearish bias.
🟨11:00–15:00 → Slow => US session. Initial Jobless Claims at 12:30. A rise would be dovish, but data is unreliable. Expect choppy, data-dependent movement.
🟥15:00–18:00 → Down => Afternoon US session. Atlanta Fed GDPNow and 30-Year Bond Auction. If yields rise, Bitcoin may extend losses.
🟨18:00–00:00 → Slow => Late US close. Fed's Balance Sheet and Japan data. Sideways drift into the overnight.
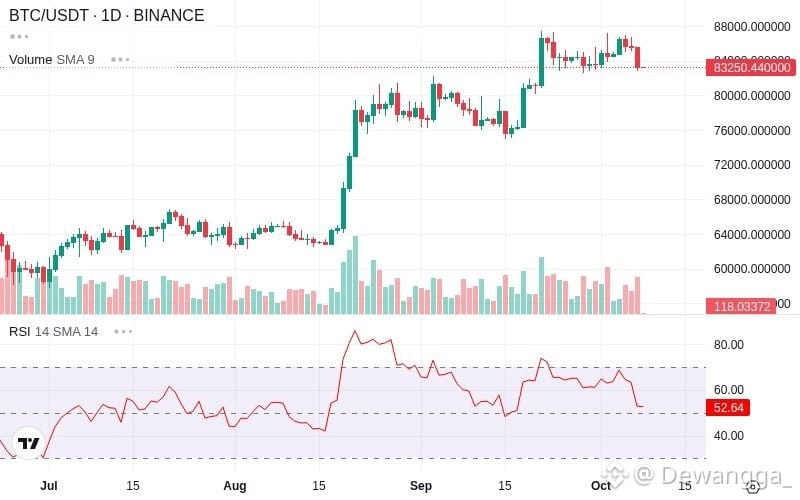
Bias: Bearish
RSI: 52.60
NFA DYOR 🔥
Not a buy/sell signal🛑
Follow and tip if you find this helpful, unfollow and block if you are disturbed☕️
Today’s focus is Initial Jobless Claims. A rise would normally weaken the dollar and support Bitcoin, but the data is manipulated. Fed Waller speaks early, but his impact is limited. The trend remains bearish in the short term, but oversold conditions (CCI -121) suggest a bounce is possible. Expect another red day, but the downside may be limited.
📉 Bitcoin crashed to 82k. Data inconsistency and Blackrock selling.
📊 Initial Jobless Claims later. Dovish if it rises, but data unreliable.
🏛 Fed Waller speaks. Low impact.
💎 Strategy: Today is data-dependent. Do not chase the downside. If you are in profit, consider taking some off the table. If you are not positioned, wait for a clear signal. Always manage risk and never invest more than you can afford to lose.
$LAZIO $FIL #FedMinutesFocusOnOctoberPause #BinanceLaunchesBinanceIntelligence #EvernorthDelaysNasdaqDebutToOct12 #BTCFallsBelow$84K
GM Market Briefing☕️
Thursday, October 8 2026
$BTC Outlook (GMT):
🟥00:00–09:00 → Down => Asian session. China holiday, thin liquidity. Bitcoin continues to bleed after yesterday's crash. Fed Waller speaks at 08:30 but no major impact expected.
🟨09:00–11:00 → Slow => London open. Markets digest Waller and wait for US data. Range-bound with a bearish bias.
🟨11:00–15:00 → Slow => US session. Initial Jobless Claims at 12:30. A rise would be dovish, but data is unreliable. Expect choppy, data-dependent movement.
🟥15:00–18:00 → Down => Afternoon US session. Atlanta Fed GDPNow and 30-Year Bond Auction. If yields rise, Bitcoin may extend losses.
🟨18:00–00:00 → Slow => Late US close. Fed's Balance Sheet and Japan data. Sideways drift into the overnight.
Bias: Bearish
RSI: 52.60
NFA DYOR 🔥
Not a buy/sell signal🛑
Follow and tip if you find this helpful, unfollow and block if you are disturbed☕️
Today’s focus is Initial Jobless Claims. A rise would normally weaken the dollar and support Bitcoin, but the data is manipulated. Fed Waller speaks early, but his impact is limited. The trend remains bearish in the short term, but oversold conditions (CCI -121) suggest a bounce is possible. Expect another red day, but the downside may be limited.
📉 Bitcoin crashed to 82k. Data inconsistency and Blackrock selling.
📊 Initial Jobless Claims later. Dovish if it rises, but data unreliable.
🏛 Fed Waller speaks. Low impact.
💎 Strategy: Today is data-dependent. Do not chase the downside. If you are in profit, consider taking some off the table. If you are not positioned, wait for a clear signal. Always manage risk and never invest more than you can afford to lose.
$LAZIO $FIL #FedMinutesFocusOnOctoberPause #BinanceLaunchesBinanceIntelligence #EvernorthDelaysNasdaqDebutToOct12 #BTCFallsBelow$84K
Thursday, October 8 2026
$BTC Outlook (GMT):
🟥00:00–09:00 → Down => Asian session. China holiday, thin liquidity. Bitcoin continues to bleed after yesterday's crash. Fed Waller speaks at 08:30 but no major impact expected.
🟨09:00–11:00 → Slow => London open. Markets digest Waller and wait for US data. Range-bound with a bearish bias.
🟨11:00–15:00 → Slow => US session. Initial Jobless Claims at 12:30. A rise would be dovish, but data is unreliable. Expect choppy, data-dependent movement.
🟥15:00–18:00 → Down => Afternoon US session. Atlanta Fed GDPNow and 30-Year Bond Auction. If yields rise, Bitcoin may extend losses.
🟨18:00–00:00 → Slow => Late US close. Fed's Balance Sheet and Japan data. Sideways drift into the overnight.
Bias: Bearish
RSI: 52.60
NFA DYOR 🔥
Not a buy/sell signal🛑
Follow and tip if you find this helpful, unfollow and block if you are disturbed☕️
Today’s focus is Initial Jobless Claims. A rise would normally weaken the dollar and support Bitcoin, but the data is manipulated. Fed Waller speaks early, but his impact is limited. The trend remains bearish in the short term, but oversold conditions (CCI -121) suggest a bounce is possible. Expect another red day, but the downside may be limited.
📉 Bitcoin crashed to 82k. Data inconsistency and Blackrock selling.
📊 Initial Jobless Claims later. Dovish if it rises, but data unreliable.
🏛 Fed Waller speaks. Low impact.
💎 Strategy: Today is data-dependent. Do not chase the downside. If you are in profit, consider taking some off the table. If you are not positioned, wait for a clear signal. Always manage risk and never invest more than you can afford to lose.
$LAZIO $FIL #FedMinutesFocusOnOctoberPause #BinanceLaunchesBinanceIntelligence #EvernorthDelaysNasdaqDebutToOct12 #BTCFallsBelow$84K
1
287

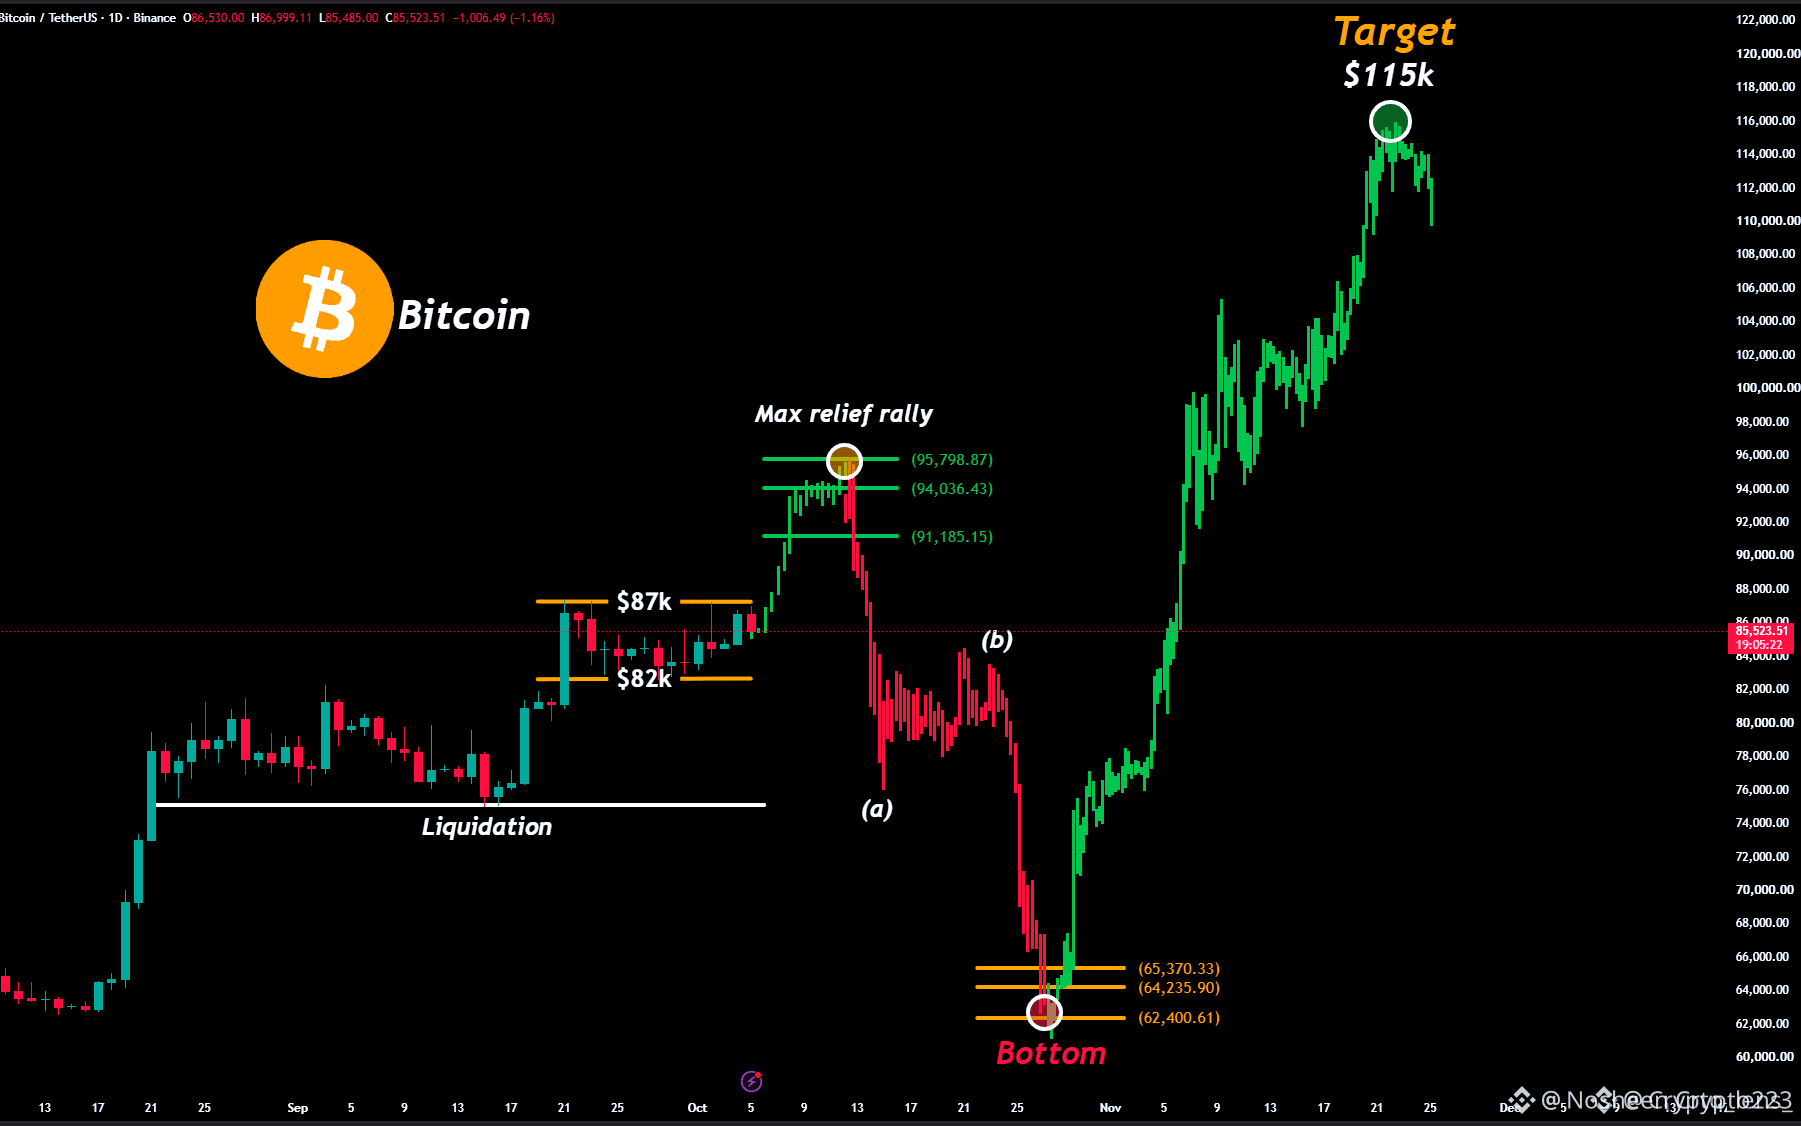
البيتكوين عالق بين $82K و$87K لسبب 👀
$BTC قد يستعد لدفعة أخيرة نحو $95K 🚀📈 قبل اكتمال فخ الثيران.
الأسبوع المقبل، قد نشهد رفضًا هبوطيًا آخر يدفع $BTC نحو منطقة ~$62K 📉⚠️
$85K → $95K → $75K → $84K → $62K
قد تكون هناك هزة أخيرة تخرج المتداولين المتأخرين من مراكزهم 🚨
وبعدها قد تبدأ الموجة الصعودية الحقيقية 🔥🐂
تابعني وفعل الإشعارات 🔔
لا تتأخر.
أي تحديث جديد سيظهر هنا أولًا 👀⚡
البيتكوين عالق بين $82K و$87K لسبب 👀
$BTC قد يستعد لدفعة أخيرة نحو $95K 🚀📈 قبل اكتمال فخ الثيران.
الأسبوع المقبل، قد نشهد رفضًا هبوطيًا آخر يدفع $BTC نحو منطقة ~$62K 📉⚠️
$85K → $95K → $75K → $84K → $62K
قد تكون هناك هزة أخيرة تخرج المتداولين المتأخرين من مراكزهم 🚨
وبعدها قد تبدأ الموجة الصعودية الحقيقية 🔥🐂
تابعني وفعل الإشعارات 🔔
لا تتأخر.
أي تحديث جديد سيظهر هنا أولًا 👀⚡
$BTC قد يستعد لدفعة أخيرة نحو $95K 🚀📈 قبل اكتمال فخ الثيران.
الأسبوع المقبل، قد نشهد رفضًا هبوطيًا آخر يدفع $BTC نحو منطقة ~$62K 📉⚠️
$85K → $95K → $75K → $84K → $62K
قد تكون هناك هزة أخيرة تخرج المتداولين المتأخرين من مراكزهم 🚨
وبعدها قد تبدأ الموجة الصعودية الحقيقية 🔥🐂
تابعني وفعل الإشعارات 🔔
لا تتأخر.
أي تحديث جديد سيظهر هنا أولًا 👀⚡
KiSerVik:
цікава інформація. підписуюсь на тебе. подивись, у мене також є цікаві публікації
7
18
17.9k

After 326 posts, I finally learned why my Write to Earn was $0.
I was posting without chart and without cashtag.
From today I will post with live chart and real levels.
Today BTC is 83,398. I think 83k is important support.
Learning again from zero but with right method.
$BTC $BNB
#BTCFallsBelow$84K
{spot}(BNBUSDT)
{spot}(BTCUSDT)
After 326 posts, I finally learned why my Write to Earn was $0.
I was posting without chart and without cashtag.
From today I will post with live chart and real levels.
Today BTC is 83,398. I think 83k is important support.
Learning again from zero but with right method.
$BTC $BNB
#BTCFallsBelow$84K
I was posting without chart and without cashtag.
From today I will post with live chart and real levels.
Today BTC is 83,398. I think 83k is important support.
Learning again from zero but with right method.
$BTC $BNB
#BTCFallsBelow$84K
113

·
--
တက်ရိပ်ရှိသည်
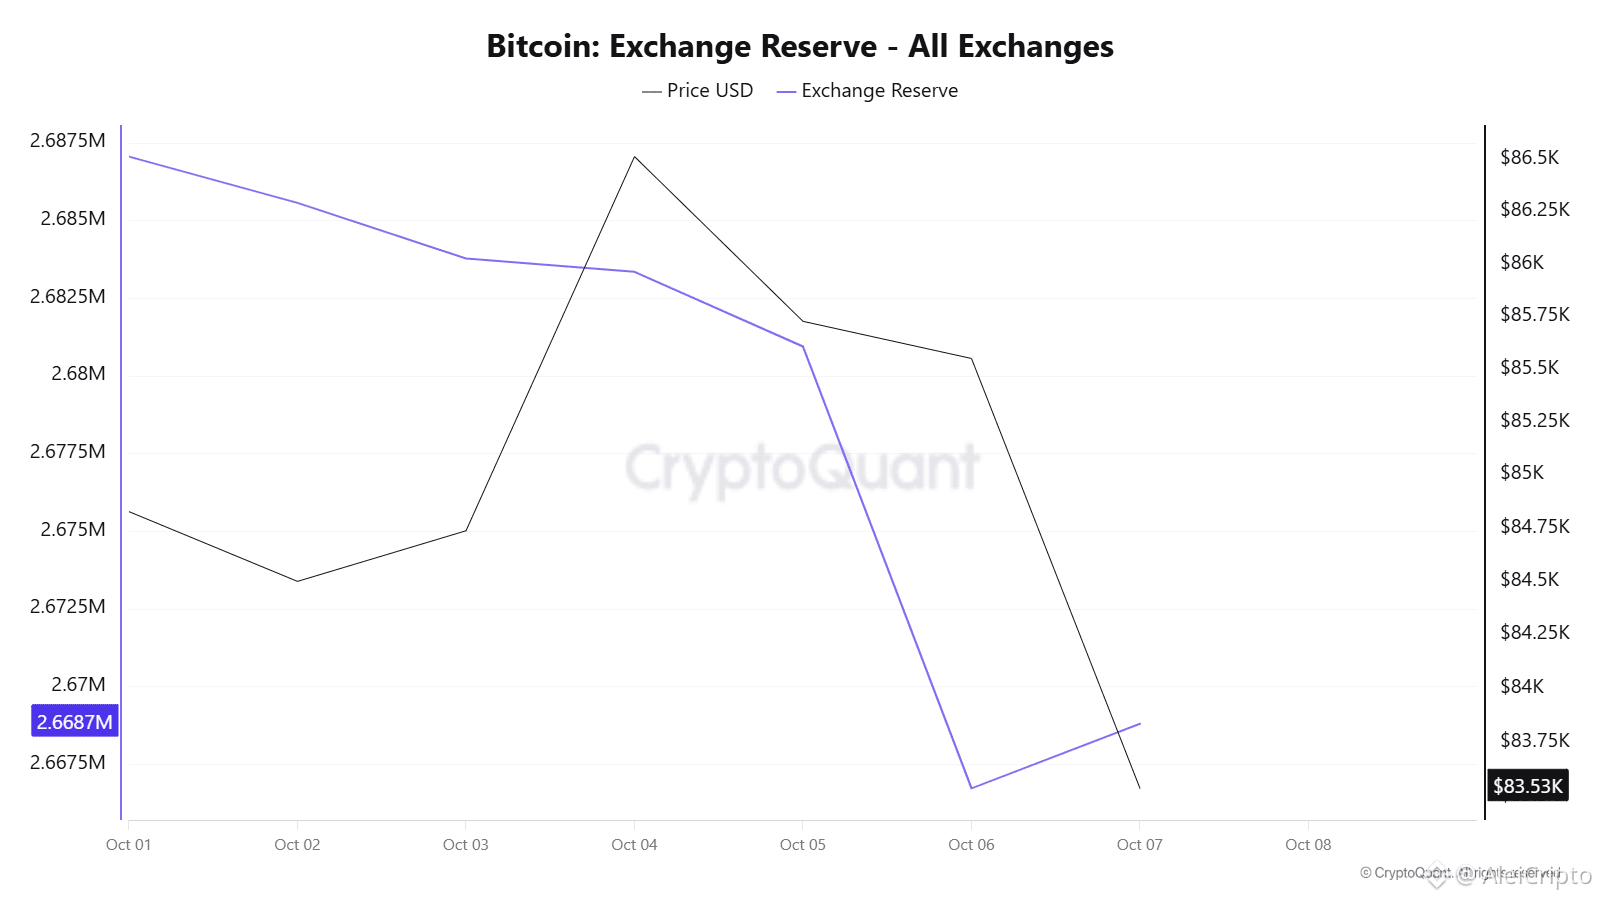
📊 $BTC | On-Chain & Liquidez (07-Oct)
🔹 Reservas CEX: 2.668.700 BTC (-0,45%)↳ Salida fuerte hacia el mínimo local (2.6687M BTC): Menor presión vendedora a corto plazo.
🔹 Mapa de Liquidez:↳ Mayor densidad de liquidaciones ubicada en la zona alta del gráfico. ↳ Precio en fase de consolidación (~$83.53K).
💡 Proyección:
Fuerza vendedora reducida en CEX junto a un pool relevante de liquidaciones por encima del precio actual sugieren alta probabilidad de expansión/barrido alcista hacia resistencias para limpiar cortos antes de definir la siguiente estructura.
#BTCFallsBelow$84K
{future}(RLCUSDT)
{future}(BTCUSDT)
📊 $BTC | On-Chain & Liquidez (07-Oct)
🔹 Reservas CEX: 2.668.700 BTC (-0,45%)↳ Salida fuerte hacia el mínimo local (2.6687M BTC): Menor presión vendedora a corto plazo.
🔹 Mapa de Liquidez:↳ Mayor densidad de liquidaciones ubicada en la zona alta del gráfico. ↳ Precio en fase de consolidación (~$83.53K).
💡 Proyección:
Fuerza vendedora reducida en CEX junto a un pool relevante de liquidaciones por encima del precio actual sugieren alta probabilidad de expansión/barrido alcista hacia resistencias para limpiar cortos antes de definir la siguiente estructura.
#BTCFallsBelow$84K
🔹 Reservas CEX: 2.668.700 BTC (-0,45%)↳ Salida fuerte hacia el mínimo local (2.6687M BTC): Menor presión vendedora a corto plazo.
🔹 Mapa de Liquidez:↳ Mayor densidad de liquidaciones ubicada en la zona alta del gráfico. ↳ Precio en fase de consolidación (~$83.53K).
💡 Proyección:
Fuerza vendedora reducida en CEX junto a un pool relevante de liquidaciones por encima del precio actual sugieren alta probabilidad de expansión/barrido alcista hacia resistencias para limpiar cortos antes de definir la siguiente estructura.
#BTCFallsBelow$84K
816

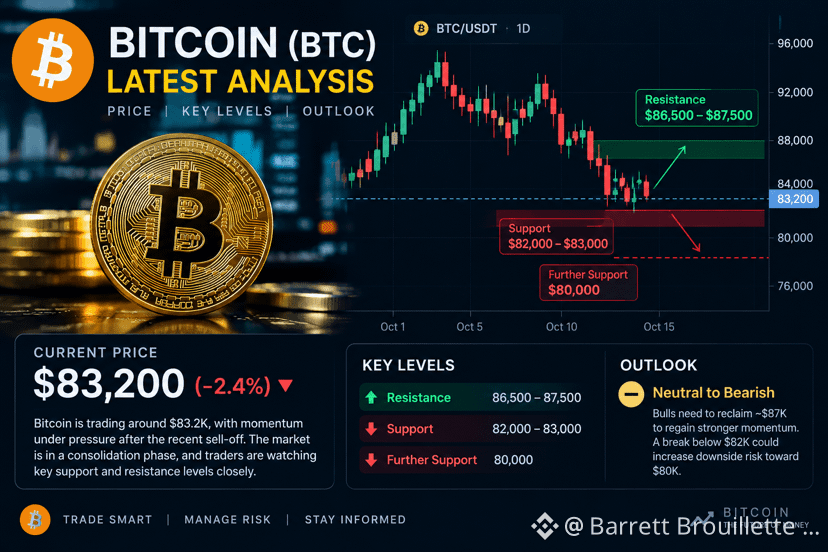
$BTC Bitcoin — Latest Short Analysis
BTC is around $83.2K, with near-term momentum under pressure after the recent sell-off. Key support is around $82K–$83K; holding this zone could allow a rebound toward $86.5K–$87.5K. A break below $82K could increase downside risk toward $80K.
Outlook: 🟡 Neutral-to-bearish short term. Bulls need to reclaim ~$87K to regain stronger momentum. #FedMinutesFocusOnOctoberPause #BinanceLaunchesBinanceIntelligence #BTCFallsBelow$84K
{spot}(BTCUSDT)
$BTC Bitcoin — Latest Short Analysis
BTC is around $83.2K, with near-term momentum under pressure after the recent sell-off. Key support is around $82K–$83K; holding this zone could allow a rebound toward $86.5K–$87.5K. A break below $82K could increase downside risk toward $80K.
Outlook: 🟡 Neutral-to-bearish short term. Bulls need to reclaim ~$87K to regain stronger momentum. #FedMinutesFocusOnOctoberPause #BinanceLaunchesBinanceIntelligence #BTCFallsBelow$84K
BTC is around $83.2K, with near-term momentum under pressure after the recent sell-off. Key support is around $82K–$83K; holding this zone could allow a rebound toward $86.5K–$87.5K. A break below $82K could increase downside risk toward $80K.
Outlook: 🟡 Neutral-to-bearish short term. Bulls need to reclaim ~$87K to regain stronger momentum. #FedMinutesFocusOnOctoberPause #BinanceLaunchesBinanceIntelligence #BTCFallsBelow$84K
34

·
--
ကျရိပ်ရှိသည်
Today’s screen favors defensive observation: BTC, ETH, and SOL are all down over 24 hours, so broad-market momentum is weak.
RLC, NMR, and ORCA have high activity but are also down sharply today, highlighting reversal risk after recent volatility.
The clearest opportunity is to watch for stabilization, improving volume, and relative strength—not to chase fast moves.
{spot}(BTCUSDT)
$BTC $SOL
#BTC #solana #BTCFallsBelow$84K #BinanceLaunchesBinanceIntelligence
Today’s screen favors defensive observation: BTC, ETH, and SOL are all down over 24 hours, so broad-market momentum is weak.
RLC, NMR, and ORCA have high activity but are also down sharply today, highlighting reversal risk after recent volatility.
The clearest opportunity is to watch for stabilization, improving volume, and relative strength—not to chase fast moves.
$BTC $SOL
#BTC #solana #BTCFallsBelow$84K #BinanceLaunchesBinanceIntelligence
RLC, NMR, and ORCA have high activity but are also down sharply today, highlighting reversal risk after recent volatility.
The clearest opportunity is to watch for stabilization, improving volume, and relative strength—not to chase fast moves.
$BTC $SOL
#BTC #solana #BTCFallsBelow$84K #BinanceLaunchesBinanceIntelligence
224

·
--
ကျရိပ်ရှိသည်
$BTC
{future}(BTCUSDT)
🚨#Bitcoin has slipped below $84,000 after reaching $87,197 last Friday, while analysts have offered competing views on whether October can deliver a recovery toward $100,000.#BTCFallsBelow$84K
$BTC
🚨#Bitcoin has slipped below $84,000 after reaching $87,197 last Friday, while analysts have offered competing views on whether October can deliver a recovery toward $100,000.#BTCFallsBelow$84K
🚨#Bitcoin has slipped below $84,000 after reaching $87,197 last Friday, while analysts have offered competing views on whether October can deliver a recovery toward $100,000.#BTCFallsBelow$84K

26
🚨 #bitcoin CRASHES BELOW $84K - $550M WIPED!
Bitcoin fell to $83,323, down 2.7% in 24h, after Iran escalated attacks on tankers in Strait of Hormuz. Brent oil jumped above $101, US Treasury yields + dollar pumped, risk assets dumped. BTC rejected at $87K for 3rd time since Sept 23. 
Liquidations: $550M in longs in 24h, Open Interest $69.29B still — more volatility coming.
#BTCFallsBelow$84K $BTC
{spot}(BTCUSDT)
🚨 #bitcoin CRASHES BELOW $84K - $550M WIPED!
Bitcoin fell to $83,323, down 2.7% in 24h, after Iran escalated attacks on tankers in Strait of Hormuz. Brent oil jumped above $101, US Treasury yields + dollar pumped, risk assets dumped. BTC rejected at $87K for 3rd time since Sept 23. 
Liquidations: $550M in longs in 24h, Open Interest $69.29B still — more volatility coming.
#BTCFallsBelow$84K $BTC
Bitcoin fell to $83,323, down 2.7% in 24h, after Iran escalated attacks on tankers in Strait of Hormuz. Brent oil jumped above $101, US Treasury yields + dollar pumped, risk assets dumped. BTC rejected at $87K for 3rd time since Sept 23. 
Liquidations: $550M in longs in 24h, Open Interest $69.29B still — more volatility coming.
#BTCFallsBelow$84K $BTC

113

·
--
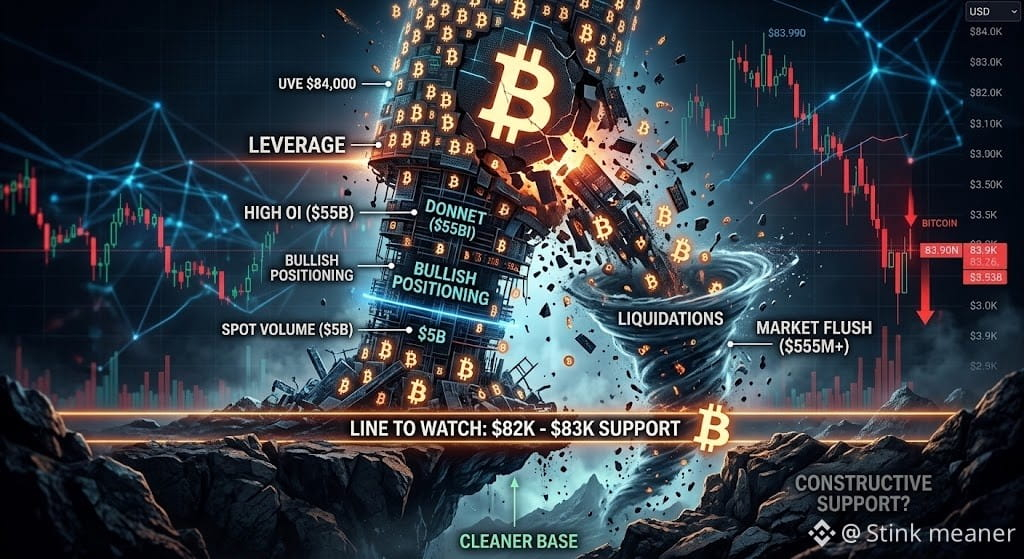
🚨 Bitcoin didn't just lose $84K. It flushed the leverage that built above it.
#btcfallssbelow$84k
BTC briefly traded near $83.8K, while crypto liquidations reached about $555M, including $487M of longs over 24 hours.
The derivatives structure explains the violence:
~$55B Bitcoin futures OI versus only about $5B of spot volume.
That's the important distinction.
This isn't necessarily a fundamental Bitcoin breakdown.
It's what happens when too much bullish positioning meets a failed breakout.
And the $82K–$83K area is now becoming the line to watch; analysts have described that zone as potentially constructive support rather than automatically the start of a deeper collapse.
Does this flush create the cleaner base BTC needed for another attempt at $87K — or is the failed breakout turning resistance into a larger distribution zone?
Not financial advice. Liquidation data can understate total market-wide losses, and holding $82K–$83K would not by itself confirm a bullish reversal.DYOR
$BTC $ETH
#bitcoin #crypto #BTCFallsBelow$84K #BinanceSquareTalks #SECApproves3XBitcoinETF
🚨 Bitcoin didn't just lose $84K. It flushed the leverage that built above it.
#btcfallssbelow$84k
BTC briefly traded near $83.8K, while crypto liquidations reached about $555M, including $487M of longs over 24 hours.
The derivatives structure explains the violence:
~$55B Bitcoin futures OI versus only about $5B of spot volume.
That's the important distinction.
This isn't necessarily a fundamental Bitcoin breakdown.
It's what happens when too much bullish positioning meets a failed breakout.
And the $82K–$83K area is now becoming the line to watch; analysts have described that zone as potentially constructive support rather than automatically the start of a deeper collapse.
Does this flush create the cleaner base BTC needed for another attempt at $87K — or is the failed breakout turning resistance into a larger distribution zone?
Not financial advice. Liquidation data can understate total market-wide losses, and holding $82K–$83K would not by itself confirm a bullish reversal.DYOR
$BTC $ETH
#bitcoin #crypto #BTCFallsBelow$84K #BinanceSquareTalks #SECApproves3XBitcoinETF
#btcfallssbelow$84k
BTC briefly traded near $83.8K, while crypto liquidations reached about $555M, including $487M of longs over 24 hours.
The derivatives structure explains the violence:
~$55B Bitcoin futures OI versus only about $5B of spot volume.
That's the important distinction.
This isn't necessarily a fundamental Bitcoin breakdown.
It's what happens when too much bullish positioning meets a failed breakout.
And the $82K–$83K area is now becoming the line to watch; analysts have described that zone as potentially constructive support rather than automatically the start of a deeper collapse.
Does this flush create the cleaner base BTC needed for another attempt at $87K — or is the failed breakout turning resistance into a larger distribution zone?
Not financial advice. Liquidation data can understate total market-wide losses, and holding $82K–$83K would not by itself confirm a bullish reversal.DYOR
$BTC $ETH
#bitcoin #crypto #BTCFallsBelow$84K #BinanceSquareTalks #SECApproves3XBitcoinETF
humkash:
Please Follow me. I Followed you back. Please like my post.
1
2
266

·
--
တက်ရိပ်ရှိသည်
#BTCFallsBelow$84K
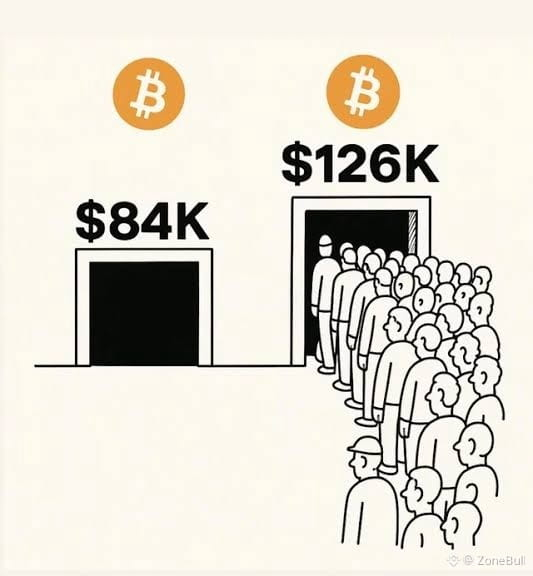
$BTC dropped to 84k🔥
but taking this as strong support, it might even go to 126k. If it breaks the support from here, then BTC will dump, and this won't even happen $NMR
{future}(BTCUSDT)
{spot}(NMRUSDT)
#BTCFallsBelow$84K
$BTC dropped to 84k🔥
but taking this as strong support, it might even go to 126k. If it breaks the support from here, then BTC will dump, and this won't even happen $NMR
$BTC dropped to 84k🔥
but taking this as strong support, it might even go to 126k. If it breaks the support from here, then BTC will dump, and this won't even happen $NMR
2
767
Log in to explore more content
Join global crypto users on Binance Square
⚡️ Get latest and useful information about crypto.
💬 Trusted by the world’s largest crypto exchange.
👍 Discover real insights from verified creators.
အီးမေးလ် / ဖုန်းနံပါတ်
ရေပန်းစားနေသော ခေါင်းစဉ်များ
1
#FedMinutesFocusOnOctoberPause
353,082 views
2,173 Discussing
2
#VitalikWarnsAICouldWeakenCryptographySecurity
5 views
13 Discussing
3
#XRPSpotETFsHold$1.7BWeeklyInflowsSlow
151 views
17 Discussing
4
#FrenchHillUrgesCLARITYActPassageInLameDuck
1,453 views
97 Discussing
5
#EthereumSpotETFRecords$161MNetOutflows
85 views
13 Discussing
6
#IMFGrantsWaiverForElSalvadorBitcoinBreach
8,975 views
237 Discussing
7
#BinanceLaunchesBinanceIntelligence
1.3M views
7,120 Discussing
8
#EvernorthDelaysNasdaqDebutToOct12
53,065 views
527 Discussing
9
#RobinhoodAdds$25MInBitcoinToBalanceSheet
17,826 views
105 Discussing
10
#SP500AndNasdaqHitRecordHighs
56,845 views
699 Discussing