

#markets
markets
9.8M views
27,071 Discussing
ရေပန်းစားသော
နောက်ဆုံး
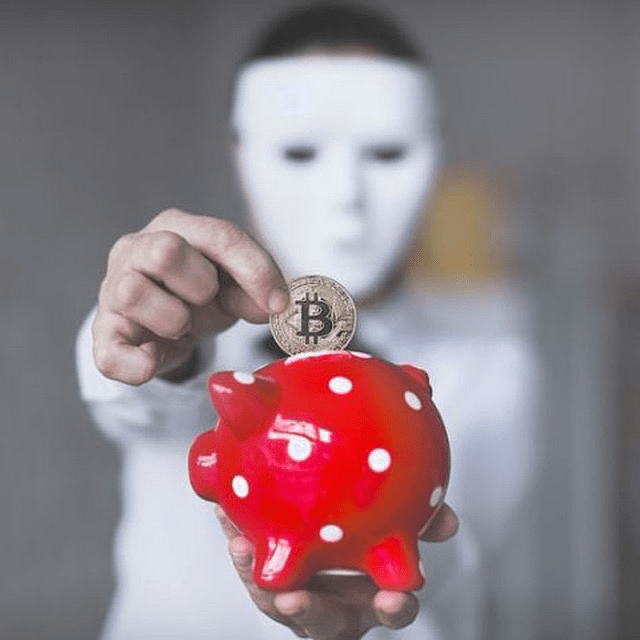
#markets #bond #crypto
🔥 Bond markets are in turmoil, yet $BTC and Wall Street remain calm: what is happening in the markets?
A striking divergence in financial markets: while the US debt market signals rising risks, crypto and stocks are acting as if everything is under control.
📊 Key figures and facts:
The MOVE Index (measuring expected volatility in US Treasuries) has surged from 80 to 104—its highest level since March.
The cause: another spike in oil and diesel prices driven by the conflict in the Middle East, which has reignited inflation fears. Yields on 10-year US bonds approached the 5.2% mark.
Meanwhile, BVIV (Bitcoin volatility) remains at 37 (close to the yearly low of 35).
The VIX (S&P 500 volatility) is also hovering near the bottom—around 14.
❓ What is the anomaly?
For the first time since April 2024, the correlation between MOVE and VIX has turned negative (-0.06). The relationship between MOVE and Bitcoin volatility is even more negatively correlated (-0.37). In other words, the bond market is actively buying "insurance" against turbulence, while crypto and stocks remain relaxed.
⚠️ What does this mean?
Typically, a spike in Treasury volatility leads to tighter financial conditions and puts pressure on risk assets. The bond market is sending an alarming signal that $BTC and Wall Street are currently ignoring. Is this a sign of the ironclad resilience of risk assets, or merely the calm before the storm?
{future}(BTCUSDT)
#markets #bond #crypto
🔥 Bond markets are in turmoil, yet $BTC and Wall Street remain calm: what is happening in the markets?
A striking divergence in financial markets: while the US debt market signals rising risks, crypto and stocks are acting as if everything is under control.
📊 Key figures and facts:
The MOVE Index (measuring expected volatility in US Treasuries) has surged from 80 to 104—its highest level since March.
The cause: another spike in oil and diesel prices driven by the conflict in the Middle East, which has reignited inflation fears. Yields on 10-year US bonds approached the 5.2% mark.
Meanwhile, BVIV (Bitcoin volatility) remains at 37 (close to the yearly low of 35).
The VIX (S&P 500 volatility) is also hovering near the bottom—around 14.
❓ What is the anomaly?
For the first time since April 2024, the correlation between MOVE and VIX has turned negative (-0.06). The relationship between MOVE and Bitcoin volatility is even more negatively correlated (-0.37). In other words, the bond market is actively buying "insurance" against turbulence, while crypto and stocks remain relaxed.
⚠️ What does this mean?
Typically, a spike in Treasury volatility leads to tighter financial conditions and puts pressure on risk assets. The bond market is sending an alarming signal that $BTC and Wall Street are currently ignoring. Is this a sign of the ironclad resilience of risk assets, or merely the calm before the storm?
1
81

🚨 高盛与德意志银行:标普500涨势仍在 🧠
📊 | $BTC | $ETH | $BNB |
- 请关注、点赞并留言,分享您的观点,一起探讨。 📈
- 高盛驳斥标普500收益泡沫担忧,预计下周起实现连续一个季度两位数增长。
- 德意志银行重申年终目标8000点,显示对指数后市保持信心。
- 两大投行一致认为标普500的上涨动力尚未耗尽。
- 市场情绪转为看跌,出现下行压力和恐慌波动。 🔥
- 若标普500继续突破8000点,可能刺激资金流入风险资产。
- 短期内指数或将受抛售压力,预计出现区间震荡并出现回调。
- 大户鲸鱼行为显示出分配或低位吸筹迹象,暗示后市波动或加大。
- 鉴于市场情绪转弱,短线看跌为主,但若宏观数据回暖,趋势或将逆转。
- 您认为标普500还能保持强势吗?欢迎分享看法。
- 关注我们,获取更多市场深度分析,期待您的评论。
- #Crypto #ETF #Whales #Trading #Markets
198

·
--
War doesn’t stay in the headlines anymore.
It moves oil, inflation, rates… and eventually markets.
That’s what I’m watching right now.
Not just crypto prices — but how money moves when uncertainty gets bigger.
What are you watching most: oil, gold or crypto? 👀
#Crypto #Markets #GlobalMarkets #Binance #Trading
It moves oil, inflation, rates… and eventually markets.
That’s what I’m watching right now.
Not just crypto prices — but how money moves when uncertainty gets bigger.
What are you watching most: oil, gold or crypto? 👀
#Crypto #Markets #GlobalMarkets #Binance #Trading
1
97
·
--
Europe is already talking about the second-order effects of the Strait of Hormuz shock.
$AKE
EU finance ministers are set to discuss a bloc-wide tax on windfall profits at energy companies that benefited from the sharp rise in oil and gas prices after the closure of the Strait of Hormuz, with more talks due next month. That matters because once policymakers start reacting to an energy spike, the market begins pricing not just supply risk — but also inflation, margins, and policy pressure.
For traders, the channels are clear: crude, European equities, EUR/USD, gold, and broader risk sentiment. Higher energy costs can keep inflation sticky, which can complicate rate-cut expectations and put pressure on growth-sensitive assets. Crypto usually trades like a high-beta risk asset in that environment, so BTC and altcoins could stay reactive to moves in yields and the dollar.
$ONE
While macro risk is building, , and are still showing strong momentum on Binance Futures — a reminder that speculative appetite is alive even as the macro backdrop gets heavier.
$G
The key question now is whether this turns into a short-lived energy shock, or the start of a more persistent inflation problem for global markets.
#Oil #Inflation #Markets
286

·
--
ကျရိပ်ရှိသည်
🚨 IT’S HAPPENING: GLOBAL MARKETS ARE SHOWING STRESS! 🌍📉
🇨🇳 Chinese stocks just took a major hit, with the SSE Composite dropping around 2% and roughly ¥1.295 trillion wiped out in market value.
But that’s not the only warning sign. 🛢️
Oil just hit a 112-day high, adding fresh pressure to inflation and raising concerns about what higher energy prices could mean for central banks.
⚠️ Stocks down + Oil up = a combination traders cannot ignore.
If oil keeps climbing, inflation fears could return and markets may start pricing in higher-for-longer rates.
🔥 Something is changing in global markets.
#ChinaStocks #oil #markets
34

·
--
တက်ရိပ်ရှိသည်
📊 EARNINGS SEASON IS HERE!
Markets are watching company results closely. Revenue, earnings, and forward guidance can all spark sharp moves—sometimes in either direction.
👀 Keep an eye on:
Earnings surprises vs. expectations
Management outlook and guidance
How the market reacts after results
Strong numbers don’t always mean a stock goes up, so stay disciplined and do your own research.
Which company’s earnings are you watching this season?
#EarningsSeason #Stocks #Markets #Investing
{spot}(BTCUSDT)
{spot}(BNBUSDT)
{spot}(ETHUSDT)
📊 EARNINGS SEASON IS HERE!
Markets are watching company results closely. Revenue, earnings, and forward guidance can all spark sharp moves—sometimes in either direction.
👀 Keep an eye on:
Earnings surprises vs. expectations
Management outlook and guidance
How the market reacts after results
Strong numbers don’t always mean a stock goes up, so stay disciplined and do your own research.
Which company’s earnings are you watching this season?
#EarningsSeason #Stocks #Markets #Investing
1
4

·
--
Flows Show Intent Before Candles Do
This post looks at how exchange deposits and withdrawals can reveal positioning before it shows up on the chart.
Before an asset can be sold on an exchange, it has to arrive there. Before it can be held long term, it usually leaves. Deposits and withdrawals are the logistics of intent, and they are visible on-chain while price still looks calm.
Each flow has a mechanical meaning. Deposits of the native asset add potential supply. Withdrawals remove sellable supply. Stablecoin deposits add potential buying power, but idle capital is a condition, not a trigger. The gap between preparation and execution can be minutes or days, and during that gap the chart still shows the old state of the market.
The common shortcut says inflows are bearish and outflows are bullish. That ignores who moved, what moved, where it went and what price was doing. A deposit can be a holder preparing to sell, but it can also be collateral for leverage, market maker inventory or an internal exchange transfer.
Consider a pattern seen across many Bitcoin and Ethereum cycles. Price grinds higher while exchange balances rise, with large deposits from long-dormant wallets landing near recent highs. The candles look normal, but more sellable supply now sits ready. When selling arrives, the move can accelerate. In the reverse case, balances fall during a rally, liquid supply thins, and each wave of demand meets less inventory.
Flows also read better next to other data. Rising deposits alongside climbing funding rates and open interest point to leverage building, not spot selling. And a large deposit into a deep order book may barely register.
The key insight: flows describe probability, not certainty. Candles show results, flows show where pressure is being stored.
#Crypto #Markets #MarketAnalysis #Bitcoin
85

·
--
The Warsaw Stock Exchange has suspended trading in shares of Ukrainian agricultural holding Astarta following a 19.14% drop in its stock price.
The price fell from PLN 37.25 to PLN 30.2, reaching its lowest level since September 2024. In May, the stock was trading above PLN 60. Trading volume prior to the suspension totaled PLN 1.52 million.
#Stocks #Markets
The price fell from PLN 37.25 to PLN 30.2, reaching its lowest level since September 2024. In May, the stock was trading above PLN 60. Trading volume prior to the suspension totaled PLN 1.52 million.
#Stocks #Markets

·
--
Picture this: previous local highs are still holding, and the whole setup now hangs on a clean break of $0.62.
The familiar pain is jumping in too early, sure the level is finished, then watching price slide back and turn a breakout into a slow loss. That FOMO entry around an old high is how a decent read quietly becomes a bad trade.
What matters here is the hold, not the headline number. When prior highs keep acting as a floor, the market is showing acceptance rather than rejection, the same grinding behavior $BTC has shown under a widely watched level. Clear $0.62 and the path opens. Lose that hold, and this starts to look like the failed breaks that have shown up on $ETH after a local high seemed secure.
Set it next to earlier cycles and the comparison gets sharper. Those moves often expanded quickly once resistance finally gave way. More recent attempts have been slower, with the real move arriving only after the level was actually cleared, not merely approached. That is the lesson inside this chart.
What's your take if $0.62 finally gives way?
#CryptoTrading #PriceAction #Markets
29
·
--
Goldman Sachs’ risk-appetite indicator has turned negative for the first time since April as investors sell AI stocks and move into Treasurys, according to a Wall Street Journal report.
#Markets #Economy
Goldman Sachs’ risk-appetite indicator has turned negative for the first time since April as investors sell AI stocks and move into Treasurys, according to a Wall Street Journal report.
#Markets #Economy
#Markets #Economy
13
·
--
The four largest banks in the world by total assets are Chinese. Industrial and Commercial Bank of China (ICBC) leads the ranking in 2026 with $7.65 trillion in assets.
The top four also includes Agricultural Bank of China with $6.97 trillion, China Construction Bank with $6.52 trillion, and Bank of China with $5.48 trillion. The combined assets of the four Chinese institutions exceed $26 trillion.
The largest bank outside China is American $JPM, which holds fifth place with $4.42 trillion in assets.
#Economy #Markets
The four largest banks in the world by total assets are Chinese. Industrial and Commercial Bank of China (ICBC) leads the ranking in 2026 with $7.65 trillion in assets.
The top four also includes Agricultural Bank of China with $6.97 trillion, China Construction Bank with $6.52 trillion, and Bank of China with $5.48 trillion. The combined assets of the four Chinese institutions exceed $26 trillion.
The largest bank outside China is American $JPM , which holds fifth place with $4.42 trillion in assets.
#Economy #Markets
11

BNB +0.52% while ETH -1.70%. The majors split today.
How the majors moved - 2026-10-20
BTC 81,595 (-1.37%)
ETH 2,391 (-1.70%)
BNB 729.39 (+0.52%)
SOL 104.31 (-1.31%)
TRX 0.3322 (+0.30%)
The majors are split - no single direction today.
USDT in dirhams on Binance spot: 3.666 / 3.667. The dollar peg is 3.6725.
💬 What do you look at first each morning: price, volume or news?
Trading crypto from Dubai since 2019.
$BTC $ETH $BNB
#Crypto #BTC #Markets
70
·
--
China's trade surplus reached $938.1 billion in the first nine months of 2026, according to the Associated Press.
In September, China's exports grew by 36.3% year-on-year, while imports increased by 31%, resulting in a monthly trade surplus of $133.5 billion. Export growth was supported primarily by technology products, automobiles, and industrial equipment.
The widening gap between exports and imports is heightening concerns among trading partners regarding competition, market access, and global trade imbalances.
#Economy #Markets
·
--
A comparison between Cisco's stock chart prior to the 2000 crash, which saw a drop of over 90%, and the recent rally in $NVDA has drawn attention online.
The charts display a nearly identical pattern, characterized by a rapid price surge and similar candlestick formations.
#Markets #Stocks
A comparison between Cisco's stock chart prior to the 2000 crash, which saw a drop of over 90%, and the recent rally in $NVDA has drawn attention online.
The charts display a nearly identical pattern, characterized by a rapid price surge and similar candlestick formations.
#Markets #Stocks
The charts display a nearly identical pattern, characterized by a rapid price surge and similar candlestick formations.
#Markets #Stocks
76

Elon Musk did post this exact statement on X on October 19 2026
He said next year he will give one of his SpaceX shares to every kid in America and called it the first of many
The math is wild though
Roughly 72 million children live in the US and SpaceX trades around 146 dollars a share which puts the pledge near 10.5 billion dollars
But here is the catch nobody has answered yet
No details on eligibility no age cutoff no word on how shares get held for minors and no clarity on whether Trump Accounts are involved
Musk has a history of floating big ideas that shift later so the announcement is real but the execution is a complete blank
$SPCX #ElonMusk #SpaceX #Crypto #markets
{future}(SPCXUSDT)
Elon Musk did post this exact statement on X on October 19 2026
He said next year he will give one of his SpaceX shares to every kid in America and called it the first of many
The math is wild though
Roughly 72 million children live in the US and SpaceX trades around 146 dollars a share which puts the pledge near 10.5 billion dollars
But here is the catch nobody has answered yet
No details on eligibility no age cutoff no word on how shares get held for minors and no clarity on whether Trump Accounts are involved
Musk has a history of floating big ideas that shift later so the announcement is real but the execution is a complete blank
$SPCX #ElonMusk #SpaceX #Crypto #markets
Sardinha de ouro:
exatamente... me faz lembrar do início das criptos ... hoje ja nao existe dúvidas sobre....
3
332

🥇 الذهب: هل يستفيد من تراجع النفط؟
💰 الذهب الفوري: $4,171.65 للأونصة — 19 أكتوبر 2026.
ارتفع الذهب بشكل طفيف مع تراجع أسعار النفط وتخفف بعض مخاوف التضخم، بينما تظل قرارات الفيدرالي والبيانات الاقتصادية عوامل رئيسية لتحركه.
🔹 تراجع عوائد السندات وضعف الدولار قد يدعمان الذهب.
🔹 ارتفاع الدولار أو تشدد الفيدرالي قد يضغطان عليه.
🎯 توقع الأيام القادمة: تذبذب مع ميل إيجابي إذا تراجعت العوائد واستمر الطلب على الملاذات الآمنة.
راقب الدولار وعوائد السندات، فهما قد يكونان مفتاح الحركة القادمة.
#Gold#Markets
⚠️ السعر الفوري يختلف عن أسعار الذهب المحلي والمشغولات.
{spot}(XAUTUSDT)
$XAUT
$BTC
🥇 الذهب: هل يستفيد من تراجع النفط؟
💰 الذهب الفوري: $4,171.65 للأونصة — 19 أكتوبر 2026.
ارتفع الذهب بشكل طفيف مع تراجع أسعار النفط وتخفف بعض مخاوف التضخم، بينما تظل قرارات الفيدرالي والبيانات الاقتصادية عوامل رئيسية لتحركه.
🔹 تراجع عوائد السندات وضعف الدولار قد يدعمان الذهب.
🔹 ارتفاع الدولار أو تشدد الفيدرالي قد يضغطان عليه.
🎯 توقع الأيام القادمة: تذبذب مع ميل إيجابي إذا تراجعت العوائد واستمر الطلب على الملاذات الآمنة.
راقب الدولار وعوائد السندات، فهما قد يكونان مفتاح الحركة القادمة.
#Gold#Markets
⚠️ السعر الفوري يختلف عن أسعار الذهب المحلي والمشغولات.
$XAUT
$BTC
151
·
--
Anthropic co-founder Jack Clark stated that artificial intelligence could drive US gross domestic product to $44 trillion by 2030. This represents nearly a 50% increase from the current GDP of $30 trillion.
According to Clark, this growth will be enabled by AI agents becoming autonomous and making scientific discoveries independently.
#Economy #Markets
According to Clark, this growth will be enabled by AI agents becoming autonomous and making scientific discoveries independently.
#Economy #Markets
2
·
--
$BLK sees tokenized funds moving deeper into Wall Street’s core infrastructure, according to Bloomberg.
Key applications for tokenized assets include their use as collateral and enabling around-the-clock transfers across financial systems.
#Crypto #Markets
$BLK sees tokenized funds moving deeper into Wall Street’s core infrastructure, according to Bloomberg.
Key applications for tokenized assets include their use as collateral and enabling around-the-clock transfers across financial systems.
#Crypto #Markets
Key applications for tokenized assets include their use as collateral and enabling around-the-clock transfers across financial systems.
#Crypto #Markets

·
--
📰 AI Chip Bets Suffer $34M Liquidation Wipeout As Bitcoin, Ethereum Near Danger Zone Ahead Of Black Monday Fears
According to Coinglass, broader crypto markets saw nearly $352 million in liquidations over 24 hours.
Source : Asianet Newsable
Time : 2026-10-18 17:30:07
Credit : stocktwits inc
#markets
$JST $BTC $ETH
Share your opinion in the comment section below
According to Coinglass, broader crypto markets saw nearly $352 million in liquidations over 24 hours.
Source : Asianet Newsable
Time : 2026-10-18 17:30:07
Credit : stocktwits inc
#markets
$JST $BTC $ETH
Share your opinion in the comment section below
·
--
📰 Bitcoin Stocks To Watch Now – October 18th
IREN, BitMine Immersion Technologies, TeraWulf, Cipher Mining, MARA, Strategy Inc Variable Rate Series A Perpetual Stretch Preferred Stock, and Riot Platforms are the seven Bitcoin stocks to watch today, according to MarketBeat’s stock screener tool. Bitcoin stocks are shares of publicly traded companies whose business or financial results are closely connected to Bitcoin, such as […]
Source : Bbns
Time : 2026-10-18 16:03:03
Credit : grant hamersma
#markets #partner_feed_articles
$SNT $JST $BTC
Share your opinion in the comment section below
101
Log in to explore more content
Join global crypto users on Binance Square
⚡️ Get latest and useful information about crypto.
💬 Trusted by the world’s largest crypto exchange.
👍 Discover real insights from verified creators.
အီးမေးလ် / ဖုန်းနံပါတ်
ရေပန်းစားနေသော ခေါင်းစဉ်များ
1
#EarningsSeason
1.2M views
5,774 Discussing
2
#JPMorganPredictsBitcoinBestPerformingAssetOverNextDecade
9,409 views
51 Discussing
3
#InjectiveSignsMoUToMakeKRW1ExclusiveWonSettlementAsset
8,781 views
36 Discussing
4
#SwitzerlandApprovesFirstBitcoinETF
61,492 views
883 Discussing
5
#SkyAISellsAllSOLAndLaunchesCashTenderOffer
57,912 views
785 Discussing
6
#BankNegaraMalaysiaReportedlyLaunchesTokenizedBondPlatform
2,506 views
44 Discussing
7
#USBitcoinETFsRecord$527MInflows
11,161 views
90 Discussing
8
#ArbitrumProposalSeeks100MillionARBToBoostUSDGAdoption
3,152 views
56 Discussing
9
#KOSPIFallsMoreThan2%
98,947 views
1,249 Discussing
10
#ElicePlunges33%InKoreanIPODebut
43,406 views
872 Discussing