

#cryptoliquidity
cryptoliquidity
310,002 views
931 Discussing
ရေပန်းစားသော
နောက်ဆုံး

·
--
စိစစ်အတည်ပြုထားသည်
#CircleMints500MUSDCOnSolana
A impressora da Circle voltou a esquentar na rede Solana!
Foram emitidos 500 milhões de USDC divididos em duas transações diretas. Movimentos desse porte em stablecoins costumam ser um termômetro claro de liquidez: as tesourarias estão se preparando para absorver demanda de capital institucional e volume de negociação.
Com taxas baixas e transações instantâneas, a Solana continua sendo o porto seguro para quem busca liquidez eficiente em DeFi, corretoras descentralizadas e trading de alta frequência. Quando centenas de milhões chegam em forma de combustível estável, o mercado acende o alerta para possíveis movimentos fortes na volatilidade.
A questão que fica: esse injeção massiva de capital antecede uma grande puxada do ecossistema ou é apenas um rebalanceamento tático de liquidez?
Acompanhe os dados on-chain, proteja seu risco e fique atento aos próximos capítulos!
$SOL
#solana
#CryptoLiquidity
#CircleMints500MUSDCOnSolana
A impressora da Circle voltou a esquentar na rede Solana!
Foram emitidos 500 milhões de USDC divididos em duas transações diretas. Movimentos desse porte em stablecoins costumam ser um termômetro claro de liquidez: as tesourarias estão se preparando para absorver demanda de capital institucional e volume de negociação.
Com taxas baixas e transações instantâneas, a Solana continua sendo o porto seguro para quem busca liquidez eficiente em DeFi, corretoras descentralizadas e trading de alta frequência. Quando centenas de milhões chegam em forma de combustível estável, o mercado acende o alerta para possíveis movimentos fortes na volatilidade.
A questão que fica: esse injeção massiva de capital antecede uma grande puxada do ecossistema ou é apenas um rebalanceamento tático de liquidez?
Acompanhe os dados on-chain, proteja seu risco e fique atento aos próximos capítulos!
$SOL
#solana
#CryptoLiquidity
A impressora da Circle voltou a esquentar na rede Solana!
Foram emitidos 500 milhões de USDC divididos em duas transações diretas. Movimentos desse porte em stablecoins costumam ser um termômetro claro de liquidez: as tesourarias estão se preparando para absorver demanda de capital institucional e volume de negociação.
Com taxas baixas e transações instantâneas, a Solana continua sendo o porto seguro para quem busca liquidez eficiente em DeFi, corretoras descentralizadas e trading de alta frequência. Quando centenas de milhões chegam em forma de combustível estável, o mercado acende o alerta para possíveis movimentos fortes na volatilidade.
A questão que fica: esse injeção massiva de capital antecede uma grande puxada do ecossistema ou é apenas um rebalanceamento tático de liquidez?
Acompanhe os dados on-chain, proteja seu risco e fique atento aos próximos capítulos!
$SOL
#solana
#CryptoLiquidity
792

🚨 LIQUIDITY WARNING — $BTC vs $LINK 👀
A $1MBABYDOGE
{spot}(1MBABYDOGEUSDT)
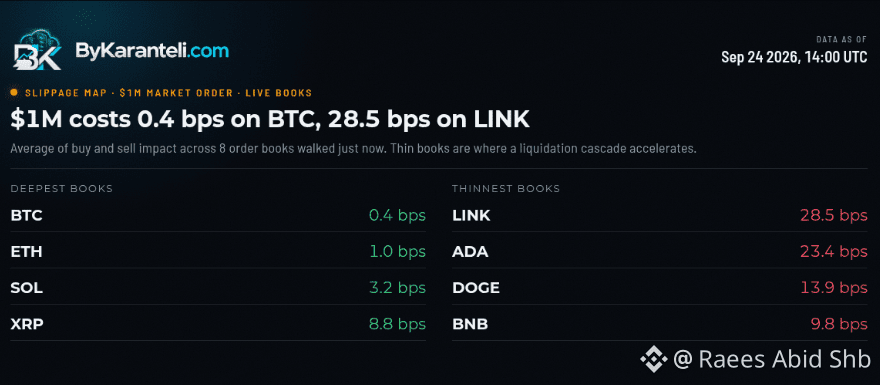
market order reportedly costs only 0.4 bps on $BTC, compared with 28.5 bps on $LINK.
That’s a huge difference in market depth. 📊
💰 $BTC: 0.4 bps
🔗 $LINK: 28.5 bps
When order books are thinner, large market orders can move price much more aggressively.
And once volatility starts feeding into itself, liquidations + slippage + forced orders can create a cascade effect. ⚠️
Liquidity matters — especially when size gets big.
#BTC #LINK #Bitcoin #Chainlink #CryptoLiquidity #CryptoTrading #Trading #MarketStructure #BinanceSquare
🚨 LIQUIDITY WARNING — $BTC vs $LINK 👀
A $1MBABYDOGE
market order reportedly costs only 0.4 bps on $BTC, compared with 28.5 bps on $LINK.
That’s a huge difference in market depth. 📊
💰 $BTC: 0.4 bps
🔗 $LINK: 28.5 bps
When order books are thinner, large market orders can move price much more aggressively.
And once volatility starts feeding into itself, liquidations + slippage + forced orders can create a cascade effect. ⚠️
Liquidity matters — especially when size gets big.
#BTC #LINK #Bitcoin #Chainlink #CryptoLiquidity #CryptoTrading #Trading #MarketStructure #BinanceSquare
A $1MBABYDOGE
market order reportedly costs only 0.4 bps on $BTC, compared with 28.5 bps on $LINK.
That’s a huge difference in market depth. 📊
💰 $BTC: 0.4 bps
🔗 $LINK: 28.5 bps
When order books are thinner, large market orders can move price much more aggressively.
And once volatility starts feeding into itself, liquidations + slippage + forced orders can create a cascade effect. ⚠️
Liquidity matters — especially when size gets big.
#BTC #LINK #Bitcoin #Chainlink #CryptoLiquidity #CryptoTrading #Trading #MarketStructure #BinanceSquare
1
266

·
--
Why is nobody talking about how the stablecoin landscape is shifting right under our feet?
Most traders keep holding cash in idle pools or chasing volatile yield farms, completely missing the structural changes that dictate where liquidity actually flows. Ignoring institutional positioning usually means catching the tail end of volume rotations when it is already too late.
Binance just committed $100M to Circle alongside a 5-year partnership to deeply integrate $USDC across its entire product suite. This is not just a standard balance sheet allocation. When the largest exchange puts direct capital into expanding $USDC utility, it signals a massive push toward unified cross-product liquidity and tighter regulatory alignment.
To position properly for this shift, start by auditing where your dry powder sits and monitor pairing fee structures as liquidity pools rebalance toward $USDC over the coming months. Track cross-margin asset efficiency and watch for new yield incentives on $FDUSD or other pegged pairs as market share battles heat up. Liquidity always leaves clues before the broader market reacts.
Where do you think stablecoin dominance goes from here?
#Binance #USDC #CryptoLiquidity
Why is nobody talking about how the stablecoin landscape is shifting right under our feet?
Most traders keep holding cash in idle pools or chasing volatile yield farms, completely missing the structural changes that dictate where liquidity actually flows. Ignoring institutional positioning usually means catching the tail end of volume rotations when it is already too late.
Binance just committed $100M to Circle alongside a 5-year partnership to deeply integrate $USDC across its entire product suite. This is not just a standard balance sheet allocation. When the largest exchange puts direct capital into expanding $USDC utility, it signals a massive push toward unified cross-product liquidity and tighter regulatory alignment.
To position properly for this shift, start by auditing where your dry powder sits and monitor pairing fee structures as liquidity pools rebalance toward $USDC over the coming months. Track cross-margin asset efficiency and watch for new yield incentives on $FDUSD or other pegged pairs as market share battles heat up. Liquidity always leaves clues before the broader market reacts.
Where do you think stablecoin dominance goes from here?
#Binance #USDC #CryptoLiquidity
Most traders keep holding cash in idle pools or chasing volatile yield farms, completely missing the structural changes that dictate where liquidity actually flows. Ignoring institutional positioning usually means catching the tail end of volume rotations when it is already too late.
Binance just committed $100M to Circle alongside a 5-year partnership to deeply integrate $USDC across its entire product suite. This is not just a standard balance sheet allocation. When the largest exchange puts direct capital into expanding $USDC utility, it signals a massive push toward unified cross-product liquidity and tighter regulatory alignment.
To position properly for this shift, start by auditing where your dry powder sits and monitor pairing fee structures as liquidity pools rebalance toward $USDC over the coming months. Track cross-margin asset efficiency and watch for new yield incentives on $FDUSD or other pegged pairs as market share battles heat up. Liquidity always leaves clues before the broader market reacts.
Where do you think stablecoin dominance goes from here?
#Binance #USDC #CryptoLiquidity
231

Picture this: two tokens launch on the same day with similar narratives and similar communities, and six months later one still has real two-sided markets while the other is a graveyard of wash-traded volume.
Every trader knows that feeling. You enter a position thinking the order book is deep, then one dump later the bids vanish and you're looking at a 30% haircut just to get out.
Here's what actually happened if you zoom out. After 2022, a handful of projects started publishing their market maker agreements, inventory levels, and spread commitments in public. Compare that to the old playbook where a team quietly hired a MM, pumped the chart for listing day, then let the book go dark. $BTC and $ETH never needed that theater because the liquidity was always organic.
Look at how $BNB listings have evolved since then. Projects that show their MM terms upfront tend to keep tighter spreads 90 days after going live. The ones that stay silent watch their average spread widen by 4x within a month, and volume quietly migrates to whatever still looks liquid on the surface.
Transparency isn't a branding exercise. It's the difference between a market you can actually trade and one that's just a chart.
Where do you think this goes from here?
#MarketMaking #CryptoLiquidity #Trading
Picture this: two tokens launch on the same day with similar narratives and similar communities, and six months later one still has real two-sided markets while the other is a graveyard of wash-traded volume.
Every trader knows that feeling. You enter a position thinking the order book is deep, then one dump later the bids vanish and you're looking at a 30% haircut just to get out.
Here's what actually happened if you zoom out. After 2022, a handful of projects started publishing their market maker agreements, inventory levels, and spread commitments in public. Compare that to the old playbook where a team quietly hired a MM, pumped the chart for listing day, then let the book go dark. $BTC and $ETH never needed that theater because the liquidity was always organic.
Look at how $BNB listings have evolved since then. Projects that show their MM terms upfront tend to keep tighter spreads 90 days after going live. The ones that stay silent watch their average spread widen by 4x within a month, and volume quietly migrates to whatever still looks liquid on the surface.
Transparency isn't a branding exercise. It's the difference between a market you can actually trade and one that's just a chart.
Where do you think this goes from here?
#MarketMaking #CryptoLiquidity #Trading
Every trader knows that feeling. You enter a position thinking the order book is deep, then one dump later the bids vanish and you're looking at a 30% haircut just to get out.
Here's what actually happened if you zoom out. After 2022, a handful of projects started publishing their market maker agreements, inventory levels, and spread commitments in public. Compare that to the old playbook where a team quietly hired a MM, pumped the chart for listing day, then let the book go dark. $BTC and $ETH never needed that theater because the liquidity was always organic.
Look at how $BNB listings have evolved since then. Projects that show their MM terms upfront tend to keep tighter spreads 90 days after going live. The ones that stay silent watch their average spread widen by 4x within a month, and volume quietly migrates to whatever still looks liquid on the surface.
Transparency isn't a branding exercise. It's the difference between a market you can actually trade and one that's just a chart.
Where do you think this goes from here?
#MarketMaking #CryptoLiquidity #Trading

1
100

·
--
#xrpexchangereserveshitsevenyearlow
🪙 🪙 XRP “Ran Out of Supply.” So Why Isn’t the Price Moving?
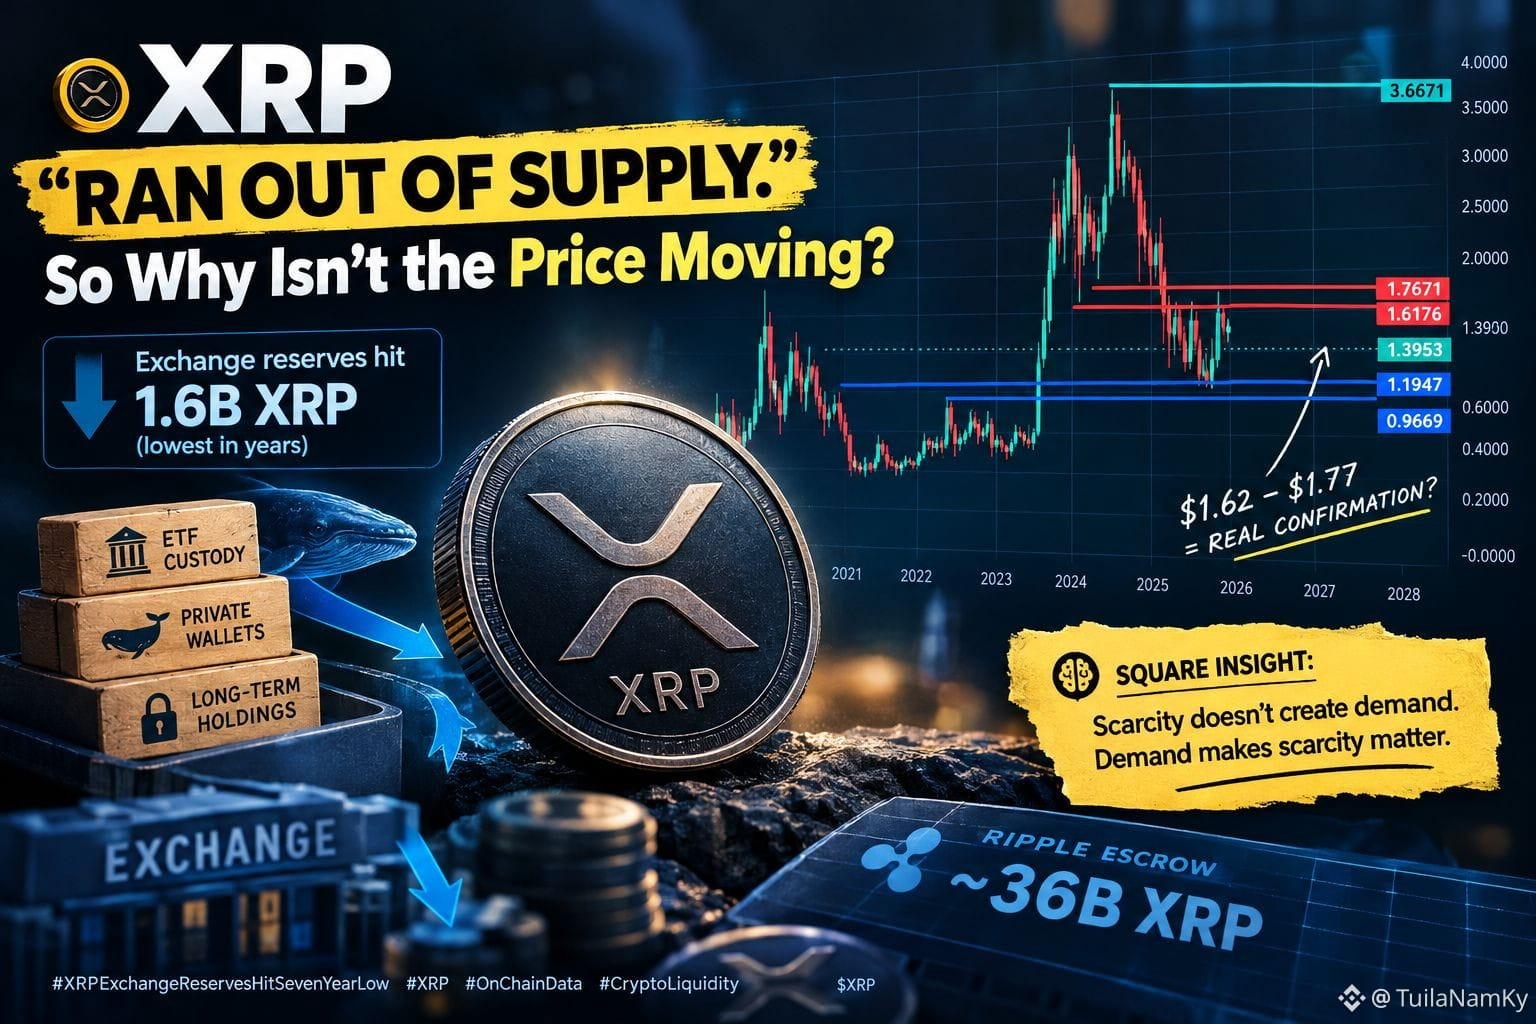
XRP exchange reserves just hit around 1.6B tokens — reportedly the lowest level in years.
Sounds bullish, right?
But here’s the funny part:
We’ve heard this story before. 😂
Reserves peaked around 3.76B XRP in October 2025, meaning tracked exchange balances have fallen dramatically.
And roughly 1B XRP has reportedly moved into ETF custody.
BUT HERE’S WHAT MANY PEOPLE MISS 👀
Lower exchange balances ≠ lower total supply.
XRP may leave exchanges and move into:
🏦 ETF custody
🐋 Private wallets
🔐 Long-term holdings
And there’s another detail:
Ripple still holds roughly 36B XRP in escrow.
There’s also a data-coverage problem.
Different analytics providers track different exchanges, so “exchange reserves” isn't necessarily a complete picture of every XRP sitting on every platform.
More importantly:
Supply can fall without demand rising.
And the weekly chart makes that even more interesting. 👀
XRP has reclaimed the $1.19 area, but price is still below the $1.62–$1.77 resistance zone.
So far, lower exchange reserves haven't translated into a confirmed breakout.
That means the real question isn't:
“Is XRP becoming scarce?”
It’s:
“Where is the sustained demand that turns lower liquidity into higher prices?”
Because thin liquidity can amplify volatility in BOTH directions.
The real confirmation may ultimately come from price — not exchange balances.
🧠 Square Insight:
Scarcity doesn't create demand.
Demand makes scarcity matter.
So what comes first for XRP:
More supply leaving exchanges — or enough demand to finally break the $1.62–$1.77 zone?
Market commentary only. Not financial advice.
#XRP #OnChainData #CryptoLiquidity $XRP
{future}(XRPUSDT)
#xrpexchangereserveshitsevenyearlow
🪙 🪙 XRP “Ran Out of Supply.” So Why Isn’t the Price Moving?
XRP exchange reserves just hit around 1.6B tokens — reportedly the lowest level in years.
Sounds bullish, right?
But here’s the funny part:
We’ve heard this story before. 😂
Reserves peaked around 3.76B XRP in October 2025, meaning tracked exchange balances have fallen dramatically.
And roughly 1B XRP has reportedly moved into ETF custody.
BUT HERE’S WHAT MANY PEOPLE MISS 👀
Lower exchange balances ≠ lower total supply.
XRP may leave exchanges and move into:
🏦 ETF custody
🐋 Private wallets
🔐 Long-term holdings
And there’s another detail:
Ripple still holds roughly 36B XRP in escrow.
There’s also a data-coverage problem.
Different analytics providers track different exchanges, so “exchange reserves” isn't necessarily a complete picture of every XRP sitting on every platform.
More importantly:
Supply can fall without demand rising.
And the weekly chart makes that even more interesting. 👀
XRP has reclaimed the $1.19 area, but price is still below the $1.62–$1.77 resistance zone.
So far, lower exchange reserves haven't translated into a confirmed breakout.
That means the real question isn't:
“Is XRP becoming scarce?”
It’s:
“Where is the sustained demand that turns lower liquidity into higher prices?”
Because thin liquidity can amplify volatility in BOTH directions.
The real confirmation may ultimately come from price — not exchange balances.
🧠 Square Insight:
Scarcity doesn't create demand.
Demand makes scarcity matter.
So what comes first for XRP:
More supply leaving exchanges — or enough demand to finally break the $1.62–$1.77 zone?
Market commentary only. Not financial advice.
#XRP #OnChainData #CryptoLiquidity $XRP
🪙 🪙 XRP “Ran Out of Supply.” So Why Isn’t the Price Moving?
XRP exchange reserves just hit around 1.6B tokens — reportedly the lowest level in years.
Sounds bullish, right?
But here’s the funny part:
We’ve heard this story before. 😂
Reserves peaked around 3.76B XRP in October 2025, meaning tracked exchange balances have fallen dramatically.
And roughly 1B XRP has reportedly moved into ETF custody.
BUT HERE’S WHAT MANY PEOPLE MISS 👀
Lower exchange balances ≠ lower total supply.
XRP may leave exchanges and move into:
🏦 ETF custody
🐋 Private wallets
🔐 Long-term holdings
And there’s another detail:
Ripple still holds roughly 36B XRP in escrow.
There’s also a data-coverage problem.
Different analytics providers track different exchanges, so “exchange reserves” isn't necessarily a complete picture of every XRP sitting on every platform.
More importantly:
Supply can fall without demand rising.
And the weekly chart makes that even more interesting. 👀
XRP has reclaimed the $1.19 area, but price is still below the $1.62–$1.77 resistance zone.
So far, lower exchange reserves haven't translated into a confirmed breakout.
That means the real question isn't:
“Is XRP becoming scarce?”
It’s:
“Where is the sustained demand that turns lower liquidity into higher prices?”
Because thin liquidity can amplify volatility in BOTH directions.
The real confirmation may ultimately come from price — not exchange balances.
🧠 Square Insight:
Scarcity doesn't create demand.
Demand makes scarcity matter.
So what comes first for XRP:
More supply leaving exchanges — or enough demand to finally break the $1.62–$1.77 zone?
Market commentary only. Not financial advice.
#XRP #OnChainData #CryptoLiquidity $XRP
3
1.9k

加拿大皇家银行(RBC)首席经济学家Francis Donald近日针对货币政策前景发表最新研报,预测加拿大央行明年可能将进行四次加息,推动政策利率升至3.25%,并警告首次加息甚至存在提前至2026年底的风险。
这一激进转向显著打破了市场此前的宽松预期。尽管面临美加贸易不确定性,且预测今明两年加拿大GDP增速均低于2%,但人口增速放缓使人均实际产出更具韧性。叠加资源富集的西部省份提供增长动能,能源价格潜在上涨风险正促使央行防范二次通胀压力,凸显出结构性通胀的顽固性。
从宏观金融维度看,主流央行若重启加息周期,将直接推升主权债券收益率并为本国货币提供支撑。这种政策分歧不仅压缩了全球流动性环境的宽松窗口,更向市场传递出紧缩周期或远未彻底终结的鹰派信号,持续压制高估值风险资产的表现空间。
对于加密市场而言,$BTC 与主流山寨币对流动性边际变化极其敏感。在主要经济体面临长期高利率(Higher for Longer)乃至重启加息的阴影下,增量资金入场将受到严格制约,投资者需高度警惕宏观流动性紧缩对风险资产估值的二次冲击。📉
#BankOfCanada #MacroEconomy #InterestRates #CryptoLiquidity
加拿大皇家银行(RBC)首席经济学家Francis Donald近日针对货币政策前景发表最新研报,预测加拿大央行明年可能将进行四次加息,推动政策利率升至3.25%,并警告首次加息甚至存在提前至2026年底的风险。
这一激进转向显著打破了市场此前的宽松预期。尽管面临美加贸易不确定性,且预测今明两年加拿大GDP增速均低于2%,但人口增速放缓使人均实际产出更具韧性。叠加资源富集的西部省份提供增长动能,能源价格潜在上涨风险正促使央行防范二次通胀压力,凸显出结构性通胀的顽固性。
从宏观金融维度看,主流央行若重启加息周期,将直接推升主权债券收益率并为本国货币提供支撑。这种政策分歧不仅压缩了全球流动性环境的宽松窗口,更向市场传递出紧缩周期或远未彻底终结的鹰派信号,持续压制高估值风险资产的表现空间。
对于加密市场而言,$BTC 与主流山寨币对流动性边际变化极其敏感。在主要经济体面临长期高利率(Higher for Longer)乃至重启加息的阴影下,增量资金入场将受到严格制约,投资者需高度警惕宏观流动性紧缩对风险资产估值的二次冲击。📉
#BankOfCanada #MacroEconomy #InterestRates #CryptoLiquidity
这一激进转向显著打破了市场此前的宽松预期。尽管面临美加贸易不确定性,且预测今明两年加拿大GDP增速均低于2%,但人口增速放缓使人均实际产出更具韧性。叠加资源富集的西部省份提供增长动能,能源价格潜在上涨风险正促使央行防范二次通胀压力,凸显出结构性通胀的顽固性。
从宏观金融维度看,主流央行若重启加息周期,将直接推升主权债券收益率并为本国货币提供支撑。这种政策分歧不仅压缩了全球流动性环境的宽松窗口,更向市场传递出紧缩周期或远未彻底终结的鹰派信号,持续压制高估值风险资产的表现空间。
对于加密市场而言,$BTC 与主流山寨币对流动性边际变化极其敏感。在主要经济体面临长期高利率(Higher for Longer)乃至重启加息的阴影下,增量资金入场将受到严格制约,投资者需高度警惕宏观流动性紧缩对风险资产估值的二次冲击。📉
#BankOfCanada #MacroEconomy #InterestRates #CryptoLiquidity
141

根据最新市场交易数据与彭博利率定价显示,目前利率掉期市场已完全消化英国央行在2027年底前实施5次、每次25个基点的降息预期。与此同时,美股盘中出现技术性回调,标普500指数下跌0.8%触及日内低点,纳斯达克综合指数跌幅超过1%,道琼斯指数小幅下挫0.4%。
从宏观流动性周期来看,海外央行明确的宽松路径正在逐步确立。英国央行累计125个基点的降息定价,进一步印证了全球紧缩周期正在加速走向终点。美股三大指数在连续上涨后的日内回踩,更多属于高位健康的技术性休整与杠杆清洗,而非基本面趋势的逆转,整体风险偏好依然维持在较高区间。
在传统金融市场中,主要央行降息路径的逐步明朗化将直接对全球流动性形成长期支撑。随着基准利率预期回落,债券收益率的上行空间受到严格压制,美元指数的长期上行阻力也在逐步加大。美股短期的震荡调整为中长期做多资金提供了更为理想的逢低介入位置,整体宏观环境对风险资产极具吸引力。
对于加密资产而言,全球央行步入流动性释放周期是核心的结构性利好。随着市场资金成本逐步走低,避险与投机需求将加速向去中心化资产扩散。BTC在宏观调整期间展现出极强的抗跌韧性与底部支撑特征,技术形态上正在蓄力突破关键阻力位,短期流动性波动反而为中长线多头提供了优质的建仓窗口。📈
#BankOfEngland #InterestRates #CryptoLiquidity
根据最新市场交易数据与彭博利率定价显示,目前利率掉期市场已完全消化英国央行在2027年底前实施5次、每次25个基点的降息预期。与此同时,美股盘中出现技术性回调,标普500指数下跌0.8%触及日内低点,纳斯达克综合指数跌幅超过1%,道琼斯指数小幅下挫0.4%。
从宏观流动性周期来看,海外央行明确的宽松路径正在逐步确立。英国央行累计125个基点的降息定价,进一步印证了全球紧缩周期正在加速走向终点。美股三大指数在连续上涨后的日内回踩,更多属于高位健康的技术性休整与杠杆清洗,而非基本面趋势的逆转,整体风险偏好依然维持在较高区间。
在传统金融市场中,主要央行降息路径的逐步明朗化将直接对全球流动性形成长期支撑。随着基准利率预期回落,债券收益率的上行空间受到严格压制,美元指数的长期上行阻力也在逐步加大。美股短期的震荡调整为中长期做多资金提供了更为理想的逢低介入位置,整体宏观环境对风险资产极具吸引力。
对于加密资产而言,全球央行步入流动性释放周期是核心的结构性利好。随着市场资金成本逐步走低,避险与投机需求将加速向去中心化资产扩散。BTC在宏观调整期间展现出极强的抗跌韧性与底部支撑特征,技术形态上正在蓄力突破关键阻力位,短期流动性波动反而为中长线多头提供了优质的建仓窗口。📈
#BankOfEngland #InterestRates #CryptoLiquidity
从宏观流动性周期来看,海外央行明确的宽松路径正在逐步确立。英国央行累计125个基点的降息定价,进一步印证了全球紧缩周期正在加速走向终点。美股三大指数在连续上涨后的日内回踩,更多属于高位健康的技术性休整与杠杆清洗,而非基本面趋势的逆转,整体风险偏好依然维持在较高区间。
在传统金融市场中,主要央行降息路径的逐步明朗化将直接对全球流动性形成长期支撑。随着基准利率预期回落,债券收益率的上行空间受到严格压制,美元指数的长期上行阻力也在逐步加大。美股短期的震荡调整为中长期做多资金提供了更为理想的逢低介入位置,整体宏观环境对风险资产极具吸引力。
对于加密资产而言,全球央行步入流动性释放周期是核心的结构性利好。随着市场资金成本逐步走低,避险与投机需求将加速向去中心化资产扩散。BTC在宏观调整期间展现出极强的抗跌韧性与底部支撑特征,技术形态上正在蓄力突破关键阻力位,短期流动性波动反而为中长线多头提供了优质的建仓窗口。📈
#BankOfEngland #InterestRates #CryptoLiquidity
81
美国前总统唐纳德·特朗普(Donald Trump)近日在其Truth Social社交平台上公开发表声明,重申将向全美所有成年人发放每人5,000美元的“特朗普红利”(Trump Dividend)。他强调,得益于经济增长与外部投资带来的数万亿美元国家收入,这一直接补贴计划完全可行,并援引此前曾推行的法案与补贴举措作为例证,呼吁选民支持其财政扩张愿景。
从宏观与技术面逻辑来看,这种超大规模的直接财政刺激预期,本质上是对市场流动性预期的强力提振。如果该类普惠性现金补贴未来得以兑现,其规模将远超疫情时期的多轮刺激支票,直接扭转当下的通缩性去杠杆预期,推动美国M2货币供应量重新进入上行扩张通道。
在传统金融市场上,市场对于大规模直升机撒钱的预期将压低美元指数(DXY)的中长期走势,同时推升美债长端收益率的通胀溢价。这种强烈的名义增长与流动性注入预期,极大地利好以美股为主的风险资产,大宗商品及通胀对冲资产在技术结构上也迎来了更强劲的底部买盘支撑。
对于加密市场而言,这无疑是极具想象空间的流动性催化剂。2020至2021年纾困支票直接流向散户交易池的历史依然历历在目,$BTC 在关键支撑位筑底后,宏观宽松叙事将进一步强化多头突破动能,推动场外增量资本加速进场,风险偏好全面回暖。
#TrumpDividend #FiscalStimulus #CryptoLiquidity
美国前总统唐纳德·特朗普(Donald Trump)近日在其Truth Social社交平台上公开发表声明,重申将向全美所有成年人发放每人5,000美元的“特朗普红利”(Trump Dividend)。他强调,得益于经济增长与外部投资带来的数万亿美元国家收入,这一直接补贴计划完全可行,并援引此前曾推行的法案与补贴举措作为例证,呼吁选民支持其财政扩张愿景。
从宏观与技术面逻辑来看,这种超大规模的直接财政刺激预期,本质上是对市场流动性预期的强力提振。如果该类普惠性现金补贴未来得以兑现,其规模将远超疫情时期的多轮刺激支票,直接扭转当下的通缩性去杠杆预期,推动美国M2货币供应量重新进入上行扩张通道。
在传统金融市场上,市场对于大规模直升机撒钱的预期将压低美元指数(DXY)的中长期走势,同时推升美债长端收益率的通胀溢价。这种强烈的名义增长与流动性注入预期,极大地利好以美股为主的风险资产,大宗商品及通胀对冲资产在技术结构上也迎来了更强劲的底部买盘支撑。
对于加密市场而言,这无疑是极具想象空间的流动性催化剂。2020至2021年纾困支票直接流向散户交易池的历史依然历历在目,$BTC 在关键支撑位筑底后,宏观宽松叙事将进一步强化多头突破动能,推动场外增量资本加速进场,风险偏好全面回暖。
#TrumpDividend #FiscalStimulus #CryptoLiquidity
从宏观与技术面逻辑来看,这种超大规模的直接财政刺激预期,本质上是对市场流动性预期的强力提振。如果该类普惠性现金补贴未来得以兑现,其规模将远超疫情时期的多轮刺激支票,直接扭转当下的通缩性去杠杆预期,推动美国M2货币供应量重新进入上行扩张通道。
在传统金融市场上,市场对于大规模直升机撒钱的预期将压低美元指数(DXY)的中长期走势,同时推升美债长端收益率的通胀溢价。这种强烈的名义增长与流动性注入预期,极大地利好以美股为主的风险资产,大宗商品及通胀对冲资产在技术结构上也迎来了更强劲的底部买盘支撑。
对于加密市场而言,这无疑是极具想象空间的流动性催化剂。2020至2021年纾困支票直接流向散户交易池的历史依然历历在目,$BTC 在关键支撑位筑底后,宏观宽松叙事将进一步强化多头突破动能,推动场外增量资本加速进场,风险偏好全面回暖。
#TrumpDividend #FiscalStimulus #CryptoLiquidity
5

Stablecoin Supply Update 📊
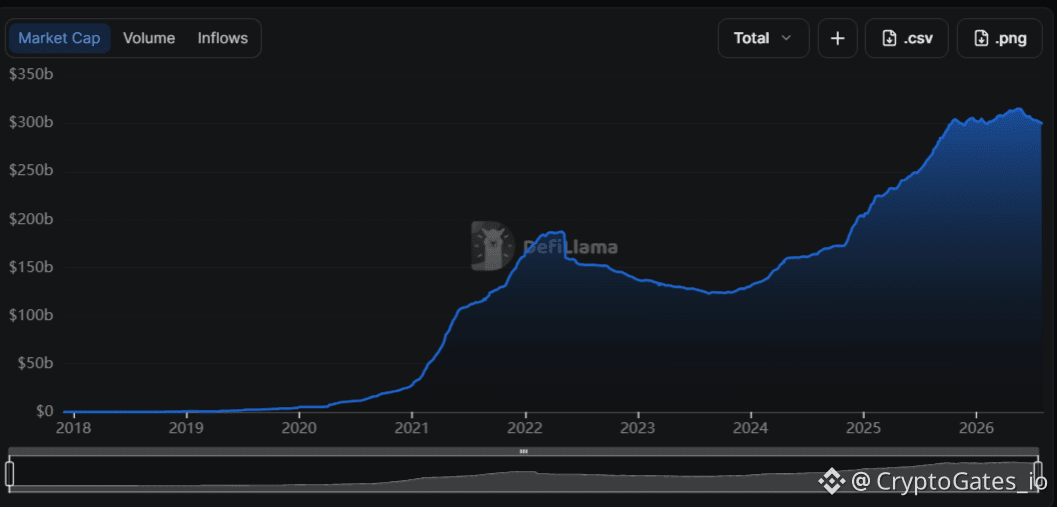
Total mcap: $300.436B
7d: -0.17% (-$501M)
USDT dominance: 60.95%
Marginal contraction in aggregate stablecoin supply this week. No meaningful dry-powder buildup signal at current levels - supply is essentially flat.
For traders using stablecoin flow as a liquidity gauge, this reading sits in neutral territory. Structural shifts in this metric tend to show up over multi-week windows, not single sessions.
Backtest this scenario before you trade it...
#StablecoinFlow #CryptoLiquidity #CryptoGates
Stablecoin Supply Update 📊
Total mcap: $300.436B
7d: -0.17% (-$501M)
USDT dominance: 60.95%
Marginal contraction in aggregate stablecoin supply this week. No meaningful dry-powder buildup signal at current levels - supply is essentially flat.
For traders using stablecoin flow as a liquidity gauge, this reading sits in neutral territory. Structural shifts in this metric tend to show up over multi-week windows, not single sessions.
Backtest this scenario before you trade it...
#StablecoinFlow #CryptoLiquidity #CryptoGates
Total mcap: $300.436B
7d: -0.17% (-$501M)
USDT dominance: 60.95%
Marginal contraction in aggregate stablecoin supply this week. No meaningful dry-powder buildup signal at current levels - supply is essentially flat.
For traders using stablecoin flow as a liquidity gauge, this reading sits in neutral territory. Structural shifts in this metric tend to show up over multi-week windows, not single sessions.
Backtest this scenario before you trade it...
#StablecoinFlow #CryptoLiquidity #CryptoGates
63

·
--
တက်ရိပ်ရှိသည်
🐋 $1.26 Billion Moved On-Chain Today. Here's What's Happening.
While retail panics, whales are busy. Today's largest transfers:
🔵 Coinbase Institutional → Unknown : 4,180 BTC = $304.7M (single tx)
🔵 Unknown → Coinbase Institutional : 1,960 BTC = $143.1M 🔵 OKX → Unknown : 1,670 BTC = $123M
🔵 Unknown → Unknown : 1,440 BTC = $105.9M
🟡 Bitfinex ↔ Tether Treasury : $308M+ USDT recycled in multiple rounds
🟡 Bitfinex → Kraken : $119M USDT transferred
What does this mean?
✅ Massive $BTC moving off exchanges = potential accumulation
✅ USDT being recycled between Bitfinex & Tether = liquidity being staged ⚠️ But DeFi TVL dropped -0.93% in 24h to $79.67B — on-chain liquidity is thinning
{future}(BTCUSDT)
DEX volume is up +16.7% and Perps volume surged +28.5% — traders are active, but directionally confused.
The whales are moving. The question is: which direction are they loading? 🤔
#WhaleAlert #Onchain #CryptoLiquidity
🐋 $1.26 Billion Moved On-Chain Today. Here's What's Happening.
While retail panics, whales are busy. Today's largest transfers:
🔵 Coinbase Institutional → Unknown : 4,180 BTC = $304.7M (single tx)
🔵 Unknown → Coinbase Institutional : 1,960 BTC = $143.1M 🔵 OKX → Unknown : 1,670 BTC = $123M
🔵 Unknown → Unknown : 1,440 BTC = $105.9M
🟡 Bitfinex ↔ Tether Treasury : $308M+ USDT recycled in multiple rounds
🟡 Bitfinex → Kraken : $119M USDT transferred
What does this mean?
✅ Massive $BTC moving off exchanges = potential accumulation
✅ USDT being recycled between Bitfinex & Tether = liquidity being staged ⚠️ But DeFi TVL dropped -0.93% in 24h to $79.67B — on-chain liquidity is thinning
DEX volume is up +16.7% and Perps volume surged +28.5% — traders are active, but directionally confused.
The whales are moving. The question is: which direction are they loading? 🤔
#WhaleAlert #Onchain #CryptoLiquidity
While retail panics, whales are busy. Today's largest transfers:
🔵 Coinbase Institutional → Unknown : 4,180 BTC = $304.7M (single tx)
🔵 Unknown → Coinbase Institutional : 1,960 BTC = $143.1M 🔵 OKX → Unknown : 1,670 BTC = $123M
🔵 Unknown → Unknown : 1,440 BTC = $105.9M
🟡 Bitfinex ↔ Tether Treasury : $308M+ USDT recycled in multiple rounds
🟡 Bitfinex → Kraken : $119M USDT transferred
What does this mean?
✅ Massive $BTC moving off exchanges = potential accumulation
✅ USDT being recycled between Bitfinex & Tether = liquidity being staged ⚠️ But DeFi TVL dropped -0.93% in 24h to $79.67B — on-chain liquidity is thinning
DEX volume is up +16.7% and Perps volume surged +28.5% — traders are active, but directionally confused.
The whales are moving. The question is: which direction are they loading? 🤔
#WhaleAlert #Onchain #CryptoLiquidity
121

📉 Volume-to-Cap Ratio Reveals Market Health Beneath the Surface: A deeper look at the $65B daily trading figure
On July 30, 2026, With $2.27T in total market cap and $65.08B in 24-hour volume, the current volume-to-cap ratio of 2.87% sits below the historical average of 3.5-5%, indicating reduced speculative activity.
However, Bitcoin and Ethereum alone account for 58% of total volume, showing that liquidity is heavily concentrated in the top two assets rather than distributed across the market.
A declining volume-to-cap ratio can signal either market maturation with less speculative churn, or waning trader interest — the distinction is critical for interpreting the data.
📌 Key Takeaway:
The declining volume-to-cap ratio points to a maturing market where volume concentrates in top-tier assets, reducing the noise from speculative trading in small-cap coins.
#MarketAnalysis #Volume #CryptoLiquidity
#BinanceAlphaAlert
📉 Volume-to-Cap Ratio Reveals Market Health Beneath the Surface: A deeper look at the $65B daily trading figure
On July 30, 2026, With $2.27T in total market cap and $65.08B in 24-hour volume, the current volume-to-cap ratio of 2.87% sits below the historical average of 3.5-5%, indicating reduced speculative activity.
However, Bitcoin and Ethereum alone account for 58% of total volume, showing that liquidity is heavily concentrated in the top two assets rather than distributed across the market.
A declining volume-to-cap ratio can signal either market maturation with less speculative churn, or waning trader interest — the distinction is critical for interpreting the data.
📌 Key Takeaway:
The declining volume-to-cap ratio points to a maturing market where volume concentrates in top-tier assets, reducing the noise from speculative trading in small-cap coins.
#MarketAnalysis #Volume #CryptoLiquidity
#BinanceAlphaAlert
On July 30, 2026, With $2.27T in total market cap and $65.08B in 24-hour volume, the current volume-to-cap ratio of 2.87% sits below the historical average of 3.5-5%, indicating reduced speculative activity.
However, Bitcoin and Ethereum alone account for 58% of total volume, showing that liquidity is heavily concentrated in the top two assets rather than distributed across the market.
A declining volume-to-cap ratio can signal either market maturation with less speculative churn, or waning trader interest — the distinction is critical for interpreting the data.
📌 Key Takeaway:
The declining volume-to-cap ratio points to a maturing market where volume concentrates in top-tier assets, reducing the noise from speculative trading in small-cap coins.
#MarketAnalysis #Volume #CryptoLiquidity
#BinanceAlphaAlert
18

·
--
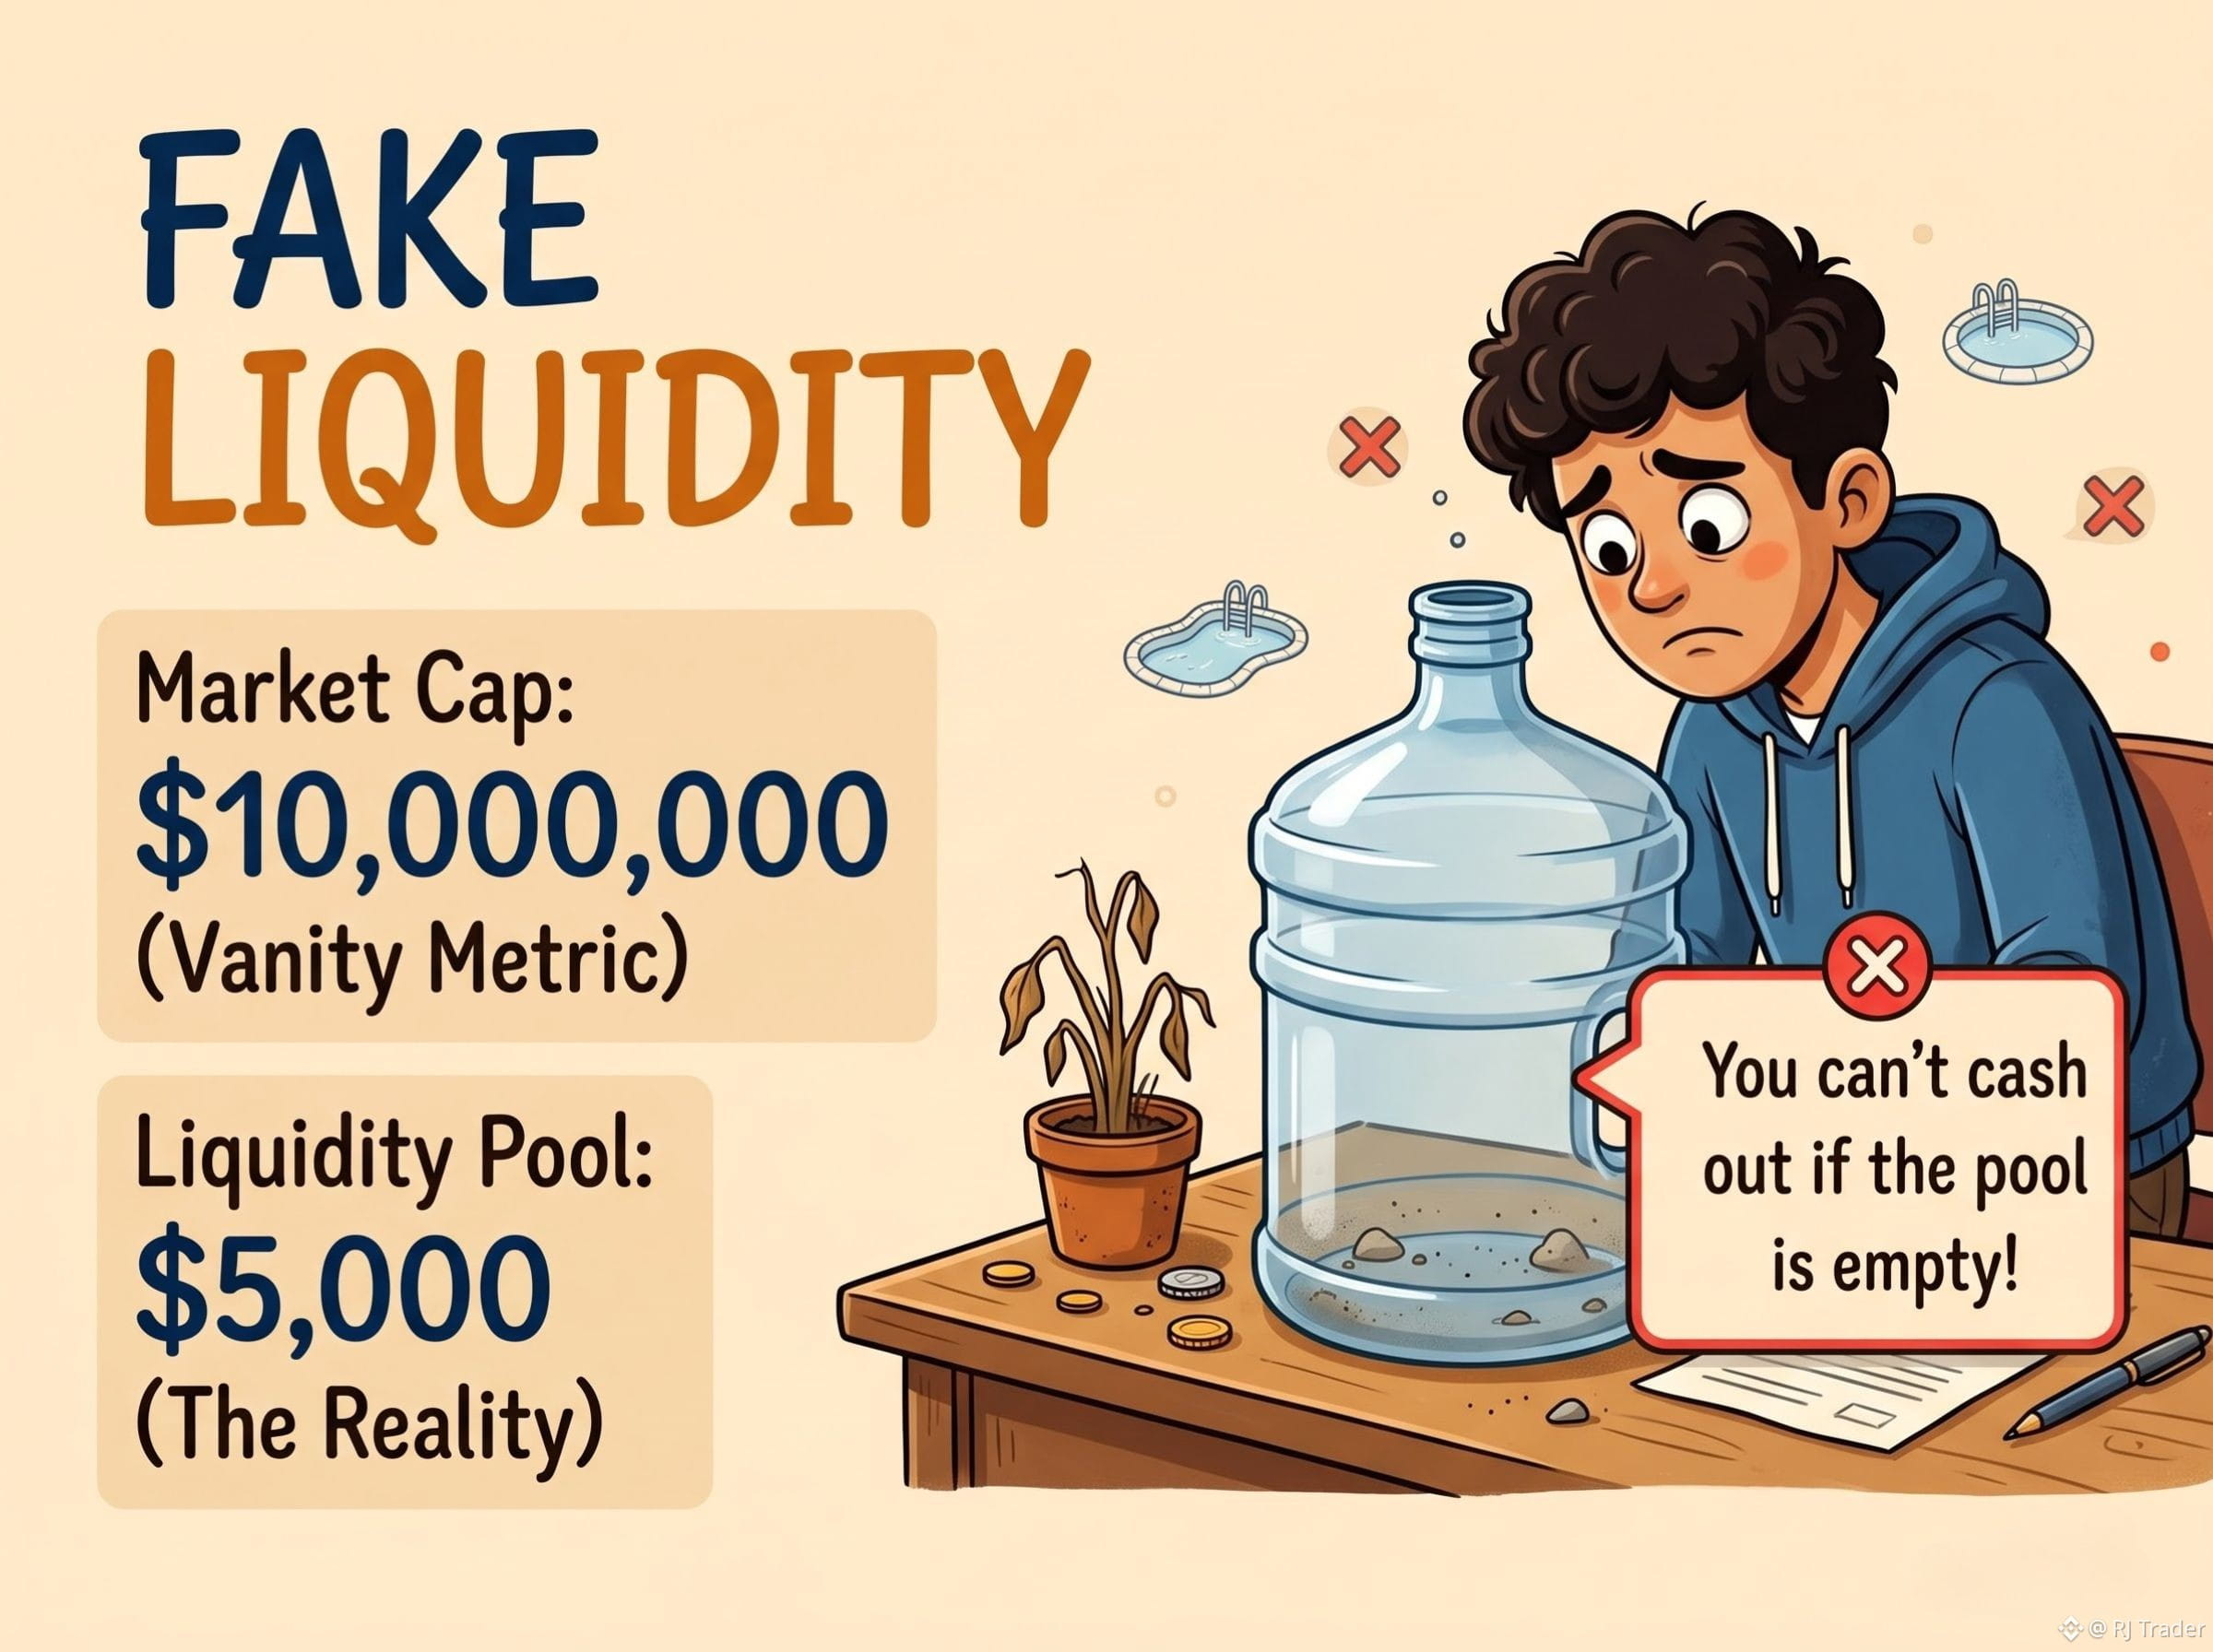
2/7 The Fake Liquidity Lie
Why a "$10 Million Market Cap" means absolutely nothing if the liquidity pool is completely empty. 💧📉 Part 2: The illusion of fake liquidity.
Do you check the liquidity pool size before buying? 🧐
#CryptoLiquidity #DeFiScams #SmartMoney #CryptoTips
2/7 The Fake Liquidity Lie
Why a "$10 Million Market Cap" means absolutely nothing if the liquidity pool is completely empty. 💧📉 Part 2: The illusion of fake liquidity.
Do you check the liquidity pool size before buying? 🧐
#CryptoLiquidity #DeFiScams #SmartMoney #CryptoTips
Why a "$10 Million Market Cap" means absolutely nothing if the liquidity pool is completely empty. 💧📉 Part 2: The illusion of fake liquidity.
Do you check the liquidity pool size before buying? 🧐
#CryptoLiquidity #DeFiScams #SmartMoney #CryptoTips
9

Article
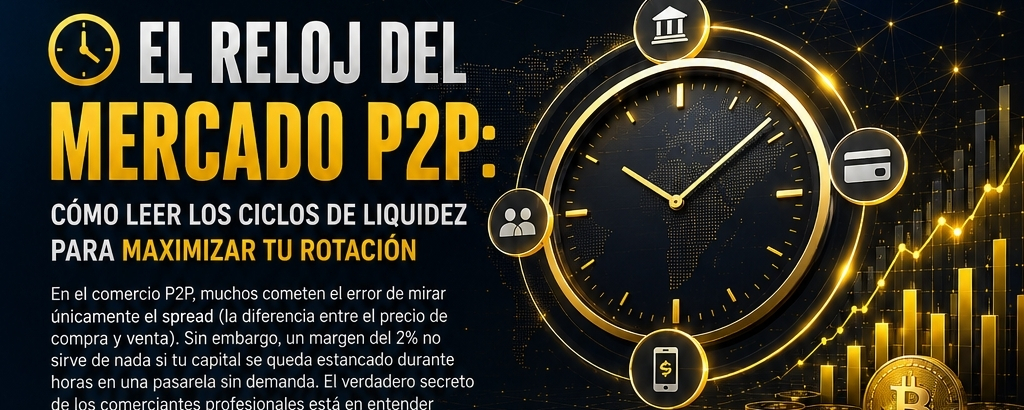
⏱️ El Reloj del Mercado P2P: Cómo leer los ciclos de liquidez para maximizar tu rotaciónEn el comercio P2P, muchos cometen el error de mirar únicamente el spread (la diferencia entre el precio de compra y venta). Sin embargo, un margen del 2% no sirve de nada si tu capital se queda estancado durante horas en una pasarela sin demanda. El verdadero secreto de los comerciantes profesionales está en entender los ciclos de liquidez.
Hoy compartimos cómo estructuramos el mapa de flujo en Nexora Group Services para mantener el dinero en constante movimiento:
🔹 1. Mapea las 'Horas Pico' por Pasarela
Cada billetera digital, procesador global o banco local tiene su propio comportamiento. Hay canales que registran un volumen masivo a primera hora de la mañana debido a transferencias comerciales, mientras que otros se activan al final de la tarde o fines de semana por remesas o comercio minorista. Operar en el canal correcto a la hora correcta duplica tu velocidad de rotación.
🔹 2. La Trampa del Spread Alto
Cuando veas un método de pago con un spread inusualmente alto, desconfía un poco. Por lo general, significa una de dos cosas: o la liquidez es extremadamente baja (tardarás horas en completar una orden) o el riesgo de contraparte y contracargos es elevado. El comerciante institucional prefiere un spread más ajustado pero con una rotación veloz que le permita hacer interés compuesto varias veces al día.
🔹 3. Conciliación y Gestión de Órdenes Canceladas
Monitorear el ratio de órdenes completadas frente a las canceladas no es solo un requisito estético para tu perfil de comerciante. Cada orden cancelada es tiempo muerto donde tu capital estuvo bloqueado en el sistema sin generar rendimiento. Optimiza tus anuncios, pon términos claros y filtra tus contrapartes para mantener tu tasa de finalización por encima del 95%.
El arbitraje y el comercio P2P exitoso no se definen por la operación más grande que hiciste hoy, sino por la eficiencia y seguridad con la que hiciste rotar tu capital de trabajo.
¿Cuál es tu métrica principal al elegir un método de pago: el porcentaje de ganancia o la velocidad de salida? ¡Debatamos en los comentarios! 👇
#BinanceP2P #CryptoLiquidity #P2PTrading #Fintech #nexora
⏱️ El Reloj del Mercado P2P: Cómo leer los ciclos de liquidez para maximizar tu rotación
En el comercio P2P, muchos cometen el error de mirar únicamente el spread (la diferencia entre el precio de compra y venta). Sin embargo, un margen del 2% no sirve de nada si tu capital se queda estancado durante horas en una pasarela sin demanda. El verdadero secreto de los comerciantes profesionales está en entender los ciclos de liquidez.
Hoy compartimos cómo estructuramos el mapa de flujo en Nexora Group Services para mantener el dinero en constante movimiento:
🔹 1. Mapea las 'Horas Pico' por Pasarela
Cada billetera digital, procesador global o banco local tiene su propio comportamiento. Hay canales que registran un volumen masivo a primera hora de la mañana debido a transferencias comerciales, mientras que otros se activan al final de la tarde o fines de semana por remesas o comercio minorista. Operar en el canal correcto a la hora correcta duplica tu velocidad de rotación.
🔹 2. La Trampa del Spread Alto
Cuando veas un método de pago con un spread inusualmente alto, desconfía un poco. Por lo general, significa una de dos cosas: o la liquidez es extremadamente baja (tardarás horas en completar una orden) o el riesgo de contraparte y contracargos es elevado. El comerciante institucional prefiere un spread más ajustado pero con una rotación veloz que le permita hacer interés compuesto varias veces al día.
🔹 3. Conciliación y Gestión de Órdenes Canceladas
Monitorear el ratio de órdenes completadas frente a las canceladas no es solo un requisito estético para tu perfil de comerciante. Cada orden cancelada es tiempo muerto donde tu capital estuvo bloqueado en el sistema sin generar rendimiento. Optimiza tus anuncios, pon términos claros y filtra tus contrapartes para mantener tu tasa de finalización por encima del 95%.
El arbitraje y el comercio P2P exitoso no se definen por la operación más grande que hiciste hoy, sino por la eficiencia y seguridad con la que hiciste rotar tu capital de trabajo.
¿Cuál es tu métrica principal al elegir un método de pago: el porcentaje de ganancia o la velocidad de salida? ¡Debatamos en los comentarios! 👇
#BinanceP2P #CryptoLiquidity #P2PTrading #Fintech #nexora
Hoy compartimos cómo estructuramos el mapa de flujo en Nexora Group Services para mantener el dinero en constante movimiento:
🔹 1. Mapea las 'Horas Pico' por Pasarela
Cada billetera digital, procesador global o banco local tiene su propio comportamiento. Hay canales que registran un volumen masivo a primera hora de la mañana debido a transferencias comerciales, mientras que otros se activan al final de la tarde o fines de semana por remesas o comercio minorista. Operar en el canal correcto a la hora correcta duplica tu velocidad de rotación.
🔹 2. La Trampa del Spread Alto
Cuando veas un método de pago con un spread inusualmente alto, desconfía un poco. Por lo general, significa una de dos cosas: o la liquidez es extremadamente baja (tardarás horas en completar una orden) o el riesgo de contraparte y contracargos es elevado. El comerciante institucional prefiere un spread más ajustado pero con una rotación veloz que le permita hacer interés compuesto varias veces al día.
🔹 3. Conciliación y Gestión de Órdenes Canceladas
Monitorear el ratio de órdenes completadas frente a las canceladas no es solo un requisito estético para tu perfil de comerciante. Cada orden cancelada es tiempo muerto donde tu capital estuvo bloqueado en el sistema sin generar rendimiento. Optimiza tus anuncios, pon términos claros y filtra tus contrapartes para mantener tu tasa de finalización por encima del 95%.
El arbitraje y el comercio P2P exitoso no se definen por la operación más grande que hiciste hoy, sino por la eficiencia y seguridad con la que hiciste rotar tu capital de trabajo.
¿Cuál es tu métrica principal al elegir un método de pago: el porcentaje de ganancia o la velocidad de salida? ¡Debatamos en los comentarios! 👇
#BinanceP2P #CryptoLiquidity #P2PTrading #Fintech #nexora
2
147

·
--
🚨 2008 LIQUIDITY ALERT vs. RETAIL PANIC: Bottom or Beginning?
The macro landscape is flashing major structural alerts.
Research firm Delphi Digital warns that global liquidity indicators have officially compressed to levels last seen leading into the 2008 Global Financial Crisis.
🔄 The Capital Rotation: Alts to BTC
Tightening liquidity always triggers a massive flight to safety.
The Mechanics: Capital aggressively rotates out of speculative Altcoins into Bitcoin before hiding in cash.The History: This mirrors the 2022 liquidity squeeze, which violently pushed Bitcoin dominance up from 39% to 48%
📊 Santiment: Peak Retail Fear at $76K
While the macro plumbing looks severe, on-chain analytics firm Santiment flags a major contrarian indicator.
Following Bitcoin’s drop to $76,000, social sentiment flipped deeply bearish. Historically, this level of retail panic marks an exhaustion zone for sellers rather than a structural breakdown, frequently triggering sharp local reversals.
🔍 The Ultimate Tug-of-War
We are caught between evaporating global liquidity (bad for alts) and peak retail panic (historically good for a BTC bottom).
Are you rotating capital into BTC to weather the storm, or buying the panic at $76k? Let's discuss below! 👇#bitcoin #macroeconomy #DelphiDigital #CryptoLiquidity
$BTC
{spot}(BTCUSDT)
🚨 2008 LIQUIDITY ALERT vs. RETAIL PANIC: Bottom or Beginning?
The macro landscape is flashing major structural alerts.
Research firm Delphi Digital warns that global liquidity indicators have officially compressed to levels last seen leading into the 2008 Global Financial Crisis.
🔄 The Capital Rotation: Alts to BTC
Tightening liquidity always triggers a massive flight to safety.
The Mechanics: Capital aggressively rotates out of speculative Altcoins into Bitcoin before hiding in cash.The History: This mirrors the 2022 liquidity squeeze, which violently pushed Bitcoin dominance up from 39% to 48%
📊 Santiment: Peak Retail Fear at $76K
While the macro plumbing looks severe, on-chain analytics firm Santiment flags a major contrarian indicator.
Following Bitcoin’s drop to $76,000, social sentiment flipped deeply bearish. Historically, this level of retail panic marks an exhaustion zone for sellers rather than a structural breakdown, frequently triggering sharp local reversals.
🔍 The Ultimate Tug-of-War
We are caught between evaporating global liquidity (bad for alts) and peak retail panic (historically good for a BTC bottom).
Are you rotating capital into BTC to weather the storm, or buying the panic at $76k? Let's discuss below! 👇#bitcoin #macroeconomy #DelphiDigital #CryptoLiquidity
$BTC
The macro landscape is flashing major structural alerts.
Research firm Delphi Digital warns that global liquidity indicators have officially compressed to levels last seen leading into the 2008 Global Financial Crisis.
🔄 The Capital Rotation: Alts to BTC
Tightening liquidity always triggers a massive flight to safety.
The Mechanics: Capital aggressively rotates out of speculative Altcoins into Bitcoin before hiding in cash.The History: This mirrors the 2022 liquidity squeeze, which violently pushed Bitcoin dominance up from 39% to 48%
📊 Santiment: Peak Retail Fear at $76K
While the macro plumbing looks severe, on-chain analytics firm Santiment flags a major contrarian indicator.
Following Bitcoin’s drop to $76,000, social sentiment flipped deeply bearish. Historically, this level of retail panic marks an exhaustion zone for sellers rather than a structural breakdown, frequently triggering sharp local reversals.
🔍 The Ultimate Tug-of-War
We are caught between evaporating global liquidity (bad for alts) and peak retail panic (historically good for a BTC bottom).
Are you rotating capital into BTC to weather the storm, or buying the panic at $76k? Let's discuss below! 👇#bitcoin #macroeconomy #DelphiDigital #CryptoLiquidity
$BTC
72

·
--

Article
The Strait of Hormuz & Crypto LiquidityWhen the world’s most vital maritime chokepoint gets squeezed by military standoffs, the structural vulnerabilities of traditional global trade are laid bare for everyone to see. The recent escalation surrounding the Strait of Hormuz—where a localized conflict instantly threatens a massive percentage of the global oil supply—is doing something much deeper than just fluctuating the price of crude. My ongoing analysis of global capital flows suggests we are witnessing a profound structural migration. As physical ships face delays, soaring insurance premiums, and the constant threat of drone strikes, capital is quietly abandoning slow, geographically bound financial systems and flooding into the frictionless liquidity of the blockchain.
Looking closely at the on-chain data over the past week, the correlation between geopolitical friction in the Middle East and the rapid expansion of tokenized safe havens is undeniable. In the past, a crisis in the Persian Gulf meant investors had to scramble for physical gold or pile into legacy fiat reserves through slow, institutional banking channels that close over the weekend. Today, the modern trader is bypassing those bottlenecks entirely. We are seeing a massive volume surge in tokenized commodities and on-chain gold assets, proving that market participants are treating decentralized protocols as the ultimate emergency exit when physical supply chains break down.
This shift represents a fundamental psychological change in how we view liquidity during a crisis. Traditional finance relies heavily on centralized banking rails and physical infrastructure that can be halted by a single government decree or a well-placed naval blockade. Blockchain liquidity, by contrast, operates completely independently of shipping lanes and national borders. When maritime trade in the Strait becomes restricted, it creates a domino effect of hyperinflation and currency volatility in surrounding regions, prompting local populations and global enterprises alike to rapidly convert vulnerable cash into stable digital assets and decentralized reserves to preserve their purchasing power.
However, navigating this parallel financial reality requires a level-headed understanding of market mechanics. The immediate influx of panic-driven capital into the crypto ecosystem frequently triggers massive localized premiums on major assets and sharp liquidations in highly leveraged derivatives markets. While the underlying blockchain infrastructure remains open and functional twenty-four-seven, the extreme volatility born from breaking news alerts means that emotional trading can be just as dangerous as the conflict itself. True portfolio resilience in this new era relies on identifying highly liquid, deeply backed real-world asset tokens that can withstand overnight geopolitical shocks.
Ultimately, the friction in the Strait of Hormuz is accelerating an inevitable truth: physical infrastructure is fragile, but decentralized liquidity is resilient. We are no longer just looking at a localized maritime dispute, but rather a live-testing ground for a brand new global economic playbook. As traditional shipping lanes grow more precarious, the investors, institutions, and everyday individuals who learn to move their capital seamlessly into on-chain safe havens today are the ones who will successfully outpace the systemic vulnerabilities of tomorrow.
#StraitOfHormuz
#RWA
#CryptoLiquidity
The Strait of Hormuz & Crypto Liquidity
When the world’s most vital maritime chokepoint gets squeezed by military standoffs, the structural vulnerabilities of traditional global trade are laid bare for everyone to see. The recent escalation surrounding the Strait of Hormuz—where a localized conflict instantly threatens a massive percentage of the global oil supply—is doing something much deeper than just fluctuating the price of crude. My ongoing analysis of global capital flows suggests we are witnessing a profound structural migration. As physical ships face delays, soaring insurance premiums, and the constant threat of drone strikes, capital is quietly abandoning slow, geographically bound financial systems and flooding into the frictionless liquidity of the blockchain.
Looking closely at the on-chain data over the past week, the correlation between geopolitical friction in the Middle East and the rapid expansion of tokenized safe havens is undeniable. In the past, a crisis in the Persian Gulf meant investors had to scramble for physical gold or pile into legacy fiat reserves through slow, institutional banking channels that close over the weekend. Today, the modern trader is bypassing those bottlenecks entirely. We are seeing a massive volume surge in tokenized commodities and on-chain gold assets, proving that market participants are treating decentralized protocols as the ultimate emergency exit when physical supply chains break down.
This shift represents a fundamental psychological change in how we view liquidity during a crisis. Traditional finance relies heavily on centralized banking rails and physical infrastructure that can be halted by a single government decree or a well-placed naval blockade. Blockchain liquidity, by contrast, operates completely independently of shipping lanes and national borders. When maritime trade in the Strait becomes restricted, it creates a domino effect of hyperinflation and currency volatility in surrounding regions, prompting local populations and global enterprises alike to rapidly convert vulnerable cash into stable digital assets and decentralized reserves to preserve their purchasing power.
However, navigating this parallel financial reality requires a level-headed understanding of market mechanics. The immediate influx of panic-driven capital into the crypto ecosystem frequently triggers massive localized premiums on major assets and sharp liquidations in highly leveraged derivatives markets. While the underlying blockchain infrastructure remains open and functional twenty-four-seven, the extreme volatility born from breaking news alerts means that emotional trading can be just as dangerous as the conflict itself. True portfolio resilience in this new era relies on identifying highly liquid, deeply backed real-world asset tokens that can withstand overnight geopolitical shocks.
Ultimately, the friction in the Strait of Hormuz is accelerating an inevitable truth: physical infrastructure is fragile, but decentralized liquidity is resilient. We are no longer just looking at a localized maritime dispute, but rather a live-testing ground for a brand new global economic playbook. As traditional shipping lanes grow more precarious, the investors, institutions, and everyday individuals who learn to move their capital seamlessly into on-chain safe havens today are the ones who will successfully outpace the systemic vulnerabilities of tomorrow.
#StraitOfHormuz
#RWA
#CryptoLiquidity
Looking closely at the on-chain data over the past week, the correlation between geopolitical friction in the Middle East and the rapid expansion of tokenized safe havens is undeniable. In the past, a crisis in the Persian Gulf meant investors had to scramble for physical gold or pile into legacy fiat reserves through slow, institutional banking channels that close over the weekend. Today, the modern trader is bypassing those bottlenecks entirely. We are seeing a massive volume surge in tokenized commodities and on-chain gold assets, proving that market participants are treating decentralized protocols as the ultimate emergency exit when physical supply chains break down.
This shift represents a fundamental psychological change in how we view liquidity during a crisis. Traditional finance relies heavily on centralized banking rails and physical infrastructure that can be halted by a single government decree or a well-placed naval blockade. Blockchain liquidity, by contrast, operates completely independently of shipping lanes and national borders. When maritime trade in the Strait becomes restricted, it creates a domino effect of hyperinflation and currency volatility in surrounding regions, prompting local populations and global enterprises alike to rapidly convert vulnerable cash into stable digital assets and decentralized reserves to preserve their purchasing power.
However, navigating this parallel financial reality requires a level-headed understanding of market mechanics. The immediate influx of panic-driven capital into the crypto ecosystem frequently triggers massive localized premiums on major assets and sharp liquidations in highly leveraged derivatives markets. While the underlying blockchain infrastructure remains open and functional twenty-four-seven, the extreme volatility born from breaking news alerts means that emotional trading can be just as dangerous as the conflict itself. True portfolio resilience in this new era relies on identifying highly liquid, deeply backed real-world asset tokens that can withstand overnight geopolitical shocks.
Ultimately, the friction in the Strait of Hormuz is accelerating an inevitable truth: physical infrastructure is fragile, but decentralized liquidity is resilient. We are no longer just looking at a localized maritime dispute, but rather a live-testing ground for a brand new global economic playbook. As traditional shipping lanes grow more precarious, the investors, institutions, and everyday individuals who learn to move their capital seamlessly into on-chain safe havens today are the ones who will successfully outpace the systemic vulnerabilities of tomorrow.
#StraitOfHormuz
#RWA
#CryptoLiquidity
161

Le crash de BTC sous 67k déclenche un dénouement massif des leviers
Au cours des dernières 24 heures, Bitcoin est passé sous la ligne de support macro à 67 000 $, une cascade de liquidations de contrats à terme ayant effacé 1,76 milliard de dollars d'exposition, les positions longues seules coûtant environ 734 millions de dollars. Les données on‑chain montrent un record de 53,8 k BTC précipités vers les échanges centralisés, tous en perte, tandis que les flux entrants des ETF spot institutionnels sont devenus négatifs, retirant près de 4 milliards de dollars en deux semaines.
🕸️ Le côté baissier domine : l'absence de nouvelle demande spot et la sortie continue des ETF suggèrent que le coussin à la hausse a disparu, et la compression des leviers a probablement épuisé la pression d'achat. Un contrepoint haussier serait un rallye de couverture des shorts après la panique, mais sans retour de capitaux, le plancher reste mince et une nouvelle baisse pourrait tester la fourchette 60k‑62k $.
⚡ Le signal le plus révélateur est l'effondrement simultané des leviers et le retrait des liquidités institutionnelles – un double coup dur qui rend un rebond rapide peu probable.
⚠️ Analyse personnelle uniquement. Pas un conseil financier. Faites vos propres recherches. #BTC #CryptoLiquidity #MarketStructure
$BTC
{spot}(BTCUSDT)
Le crash de BTC sous 67k déclenche un dénouement massif des leviers
Au cours des dernières 24 heures, Bitcoin est passé sous la ligne de support macro à 67 000 $, une cascade de liquidations de contrats à terme ayant effacé 1,76 milliard de dollars d'exposition, les positions longues seules coûtant environ 734 millions de dollars. Les données on‑chain montrent un record de 53,8 k BTC précipités vers les échanges centralisés, tous en perte, tandis que les flux entrants des ETF spot institutionnels sont devenus négatifs, retirant près de 4 milliards de dollars en deux semaines.
🕸️ Le côté baissier domine : l'absence de nouvelle demande spot et la sortie continue des ETF suggèrent que le coussin à la hausse a disparu, et la compression des leviers a probablement épuisé la pression d'achat. Un contrepoint haussier serait un rallye de couverture des shorts après la panique, mais sans retour de capitaux, le plancher reste mince et une nouvelle baisse pourrait tester la fourchette 60k‑62k $.
⚡ Le signal le plus révélateur est l'effondrement simultané des leviers et le retrait des liquidités institutionnelles – un double coup dur qui rend un rebond rapide peu probable.
⚠️ Analyse personnelle uniquement. Pas un conseil financier. Faites vos propres recherches. #BTC #CryptoLiquidity #MarketStructure
$BTC
Au cours des dernières 24 heures, Bitcoin est passé sous la ligne de support macro à 67 000 $, une cascade de liquidations de contrats à terme ayant effacé 1,76 milliard de dollars d'exposition, les positions longues seules coûtant environ 734 millions de dollars. Les données on‑chain montrent un record de 53,8 k BTC précipités vers les échanges centralisés, tous en perte, tandis que les flux entrants des ETF spot institutionnels sont devenus négatifs, retirant près de 4 milliards de dollars en deux semaines.
🕸️ Le côté baissier domine : l'absence de nouvelle demande spot et la sortie continue des ETF suggèrent que le coussin à la hausse a disparu, et la compression des leviers a probablement épuisé la pression d'achat. Un contrepoint haussier serait un rallye de couverture des shorts après la panique, mais sans retour de capitaux, le plancher reste mince et une nouvelle baisse pourrait tester la fourchette 60k‑62k $.
⚡ Le signal le plus révélateur est l'effondrement simultané des leviers et le retrait des liquidités institutionnelles – un double coup dur qui rend un rebond rapide peu probable.
⚠️ Analyse personnelle uniquement. Pas un conseil financier. Faites vos propres recherches. #BTC #CryptoLiquidity #MarketStructure
$BTC
171
💧 Stablecoin Importance for Market Health: USDT and USDC as the Market's Circulatory System
On July 10, 2026, stablecoins $USDT and $USDC process a combined $53.17B in daily volume. These assets are the lifeblood of crypto markets, enabling efficient trading and liquidity.
$USDT holds a market cap of $184.17B while $USDC follows at $73.29B. Without stablecoins, trading pairs would be limited and spreads would widen significantly.
Stablecoin reserves also represent sidelined buying power. When confidence returns, these assets can be deployed rapidly into Bitcoin and altcoins, fueling price moves.
📌 Key Takeaway:
Stablecoins are the unsung heroes of crypto — $257B+ in combined market cap provides the liquidity backbone for the entire ecosystem.
#Stablecoins #CryptoLiquidity
#BinanceAlphaAlert
💧 Stablecoin Importance for Market Health: USDT and USDC as the Market's Circulatory System
On July 10, 2026, stablecoins $USDT and $USDC process a combined $53.17B in daily volume. These assets are the lifeblood of crypto markets, enabling efficient trading and liquidity.
$USDT holds a market cap of $184.17B while $USDC follows at $73.29B. Without stablecoins, trading pairs would be limited and spreads would widen significantly.
Stablecoin reserves also represent sidelined buying power. When confidence returns, these assets can be deployed rapidly into Bitcoin and altcoins, fueling price moves.
📌 Key Takeaway:
Stablecoins are the unsung heroes of crypto — $257B+ in combined market cap provides the liquidity backbone for the entire ecosystem.
#Stablecoins #CryptoLiquidity
#BinanceAlphaAlert
On July 10, 2026, stablecoins $USDT and $USDC process a combined $53.17B in daily volume. These assets are the lifeblood of crypto markets, enabling efficient trading and liquidity.
$USDT holds a market cap of $184.17B while $USDC follows at $73.29B. Without stablecoins, trading pairs would be limited and spreads would widen significantly.
Stablecoin reserves also represent sidelined buying power. When confidence returns, these assets can be deployed rapidly into Bitcoin and altcoins, fueling price moves.
📌 Key Takeaway:
Stablecoins are the unsung heroes of crypto — $257B+ in combined market cap provides the liquidity backbone for the entire ecosystem.
#Stablecoins #CryptoLiquidity
#BinanceAlphaAlert
21

Understanding Crypto Liquidity: How Order Books, Slippage, and Market Depth Drive ExecutionWhen traders evaluate digital asset markets, their attention naturally gravitates toward price charts. Green and red candles, moving averages, and momentum indicators dominate screens. However, behind every price movement lies an invisible structural engine that determines whether a trade executes seamlessly or suffers costly execution drag: market liquidity.
Understanding liquidity is a crucial milestone that separates novice market participants from disciplined intermediate traders. In fast-moving digital asset markets that operate 24 hours a day, 7 days a week, liquidity dictates market stability, price volatility, and execution quality.
This guide breaks down the mechanics of crypto liquidity, how to interpret order book depth, the subtle mechanics of slippage, and practical strategies to evaluate liquidity before taking execution risks.
---
### What Is Market Liquidity?
At its most fundamental level, liquidity measures how easily an asset can be bought or sold in a market without causing a significant change in its price.
In a highly liquid market, a participant can execute a substantial trade, and the prevailing market price will barely move because there are sufficient orders on the opposite side of the transaction. In an illiquid market, even a modest trade can cause dramatic price movements because available orders are sparse.
In the digital asset space, liquidity manifests in two primary forms:
1. **Asset Liquidity:** Refers to how easily a specific digital asset can be converted into fiat currency or widely accepted stablecoins without taking a significant price discount. High-cap assets like Bitcoin and Ethereum possess deep asset liquidity, whereas newly issued or micro-cap tokens often lack it.
2. **Market Liquidity:** Refers to the density of active buy and sell orders on a specific exchange or decentralized venue at any given moment.
Market liquidity relies on the continuous interaction between **market makers** and **market takers**. Market makers provide liquidity by placing limit orders above and below the current price, populating the order book. Market takers consume liquidity by executing market orders that immediately match against those existing limit orders.
---
### The Central Limit Order Book, Market Depth, and Bid-Ask Spreads
To understand liquidity on centralized exchanges, one must examine the Central Limit Order Book (CLOB). An order book aggregates all resting limit orders into two opposing columns:
* **The Bid Side:** Orders from buyers willing to purchase the asset at specific prices at or below the current market rate.
* **The Ask (or Offer) Side:** Orders from sellers willing to sell the asset at specific prices at or above the current market rate.
The difference between the highest available bid price and the lowest available ask price is known as the **Bid-Ask Spread**.
* **Narrow Spread:** Indicates robust liquidity and active competition among market makers. For established assets on high-volume venues, spreads are often paper-thin ( fractions of a percentage point).
* **Wide Spread:** Indicates thin liquidity, lower participant activity, or elevated uncertainty. Illiquid tokens frequently exhibit wide spreads, meaning a buyer immediately incurs an execution penalty if they attempt to sell back into the market instantly.
**Market Depth** refers to the cumulative volume of limit orders resting at various price levels away from the best bid and ask. Traders visualize this using a depth chart, which shows cumulative buy and sell volume as opposing lines.
#### A Practical Example of Slippage and Price Impact
Consider a hypothetical token trading at a display price of $10.00. An investor decides to place a market buy order for 500 tokens.
The seller side of the order book shows the following resting ask limit orders:
* 100 tokens available at $10.00
* 200 tokens available at $10.10
* 500 tokens available at $10.50
Because a market order demands immediate execution at the best available prices, it fills sequentially up the order book:
1. The first 100 tokens fill at $10.00 (Total cost: $1,000)
2. The next 200 tokens fill at $10.10 (Total cost: $2,020)
3. The remaining 200 tokens fill at $10.50 (Total cost: $2,100)
The total spend is $5,120 for 500 tokens, yielding an average execution price of $10.24 per token.
The difference between the expected price ($10.00) and the actual average execution price ($10.24) is **slippage**. The buyer paid a 2.4% execution premium simply because the top of the order book lacked sufficient depth to absorb the order size.
---
### Centralized vs. Decentralized Liquidity Models
Liquidity functions differently depending on the structural architecture of the execution venue.
#### Centralized Exchange (CEX) Liquidity
Centralized platforms use matching engines paired with traditional order books. Institutional market makers provide continuous liquidity using automated algorithms. While CEXs generally offer the deepest order books and lowest slippage for major assets, liquidity on these venues can thin out quickly if market makers reduce risk during extreme market events.
#### Decentralized Exchange (DEX) Liquidity
Decentralized platforms typically rely on **Automated Market Makers (AMMs)** rather than traditional order books. Instead of matching buyers directly with sellers, users swap tokens against a smart-contract-based Liquidity Pool containing pairs of assets.
In constant-product AMMs, prices adjust automatically based on mathematical formulas as swaps alter the ratio of assets in the pool. Price impact on a DEX depends directly on the size of the swap relative to the total liquidity locked in the pool. Liquidity providers supply these pools to earn transaction fees, but face operational risks such as impermanent loss when asset ratios change drastically.
---
### Why Liquidity Evaporates: Liquidity Cascades and Structural Volatility
Liquidity in crypto markets is dynamic rather than constant. It tends to expand during calm, trending conditions and contract sharply during unexpected market shocks.
During rapid price contractions, several factors can cause liquidity to disappear:
1. **Automated Risk Offloading:** Professional market makers employ strict risk parameters. When market volatility exceeds predefined limits, algorithms automatically widen bid-ask spreads or cancel resting limit orders to protect balance sheets.
2. **Liquidation Cascades:** In leveraged derivatives markets, when asset prices break critical price thresholds, exchange risk management systems issue automated market sell orders to liquidate underwater positions. These forced market orders absorb all available bid liquidity down the order book, creating swift downward price spikes ("flash crashes").
3. **Off-Peak Liquidity Windows:** Because digital asset markets operate continuously, traditional institutional liquidity varies across international time zones. Trading volumes during weekend hours or non-overlapping bank hours often drop, making order books thinner and more sensitive to smaller orders.
---
### Practical Liquidity Analysis for Intermediate Traders
Traders can incorporate structural liquidity checks into their routine market analysis to refine trade execution:
* **Examine Depth Metrics (+2% / -2% Depth):** Rather than relying solely on total 24-hour volume, evaluate the nominal dollar value sitting within 2% of the current price on both sides of the book. High depth within this range suggests strong execution efficiency.
* **Utilize Limit and Algorithmic Orders:** In less liquid markets, using limit orders eliminates positive and negative slippage by ensuring control over the fill price, though it introduces non-execution risk.
* **Monitor Volume-to-Market-Cap Ratios:** Low trading volume relative to circulating market capitalization can signal that an asset is illiquid, making position entry and exit challenging for larger allocations.
* **Track Execution Benchmarks (VWAP):** Institutional traders monitor the Volume-Weighted Average Price (VWAP) to break large orders into smaller chunks over time, matching historical trading distribution to minimize market impact.
---
### Limitations, Order Book Illusions, and Risks
Relying purely on visible order book data carries inherent limitations and risks:
* **Spoofing and Phantom Liquidity:** Large market actors may place non-executable limit orders (such as large buy walls) to project artificial support, only to cancel them right before price reaches that level.
* **Iceberg Orders:** Institutional traders often execute large trades using "iceberg" orders, which reveal only a fraction of the total size on the visible order book at any one time.
* **Wash Trading:** On lower-tier platforms, automated bots may engage in wash trading—trading back and forth with themselves—to display inflated volume statistics that do not represent genuine market depth.
---
### Conclusion
Liquidity is a core foundation of market micro-structure. It dictates how efficiently prices are discovered and how safely market participants can move in and out of positions. By learning to look beyond simple line charts—analyzing order book depth, measuring spreads, accounting for slippage, and recognizing the structural differences between CEX and DEX environments—intermediate traders can make more informed execution decisions.
Markets remain unpredictable, liquidity can shrink when it is needed most, and past order book depth offers no guarantee of future market conditions. Managing trade sizing relative to available market depth remains a primary discipline for long-term survival in digital asset trading.
#CryptoLiquidity #MarketDepth #OrderBook Analysis
Understanding Crypto Liquidity: How Order Books, Slippage, and Market Depth Drive Execution
When traders evaluate digital asset markets, their attention naturally gravitates toward price charts. Green and red candles, moving averages, and momentum indicators dominate screens. However, behind every price movement lies an invisible structural engine that determines whether a trade executes seamlessly or suffers costly execution drag: market liquidity.
Understanding liquidity is a crucial milestone that separates novice market participants from disciplined intermediate traders. In fast-moving digital asset markets that operate 24 hours a day, 7 days a week, liquidity dictates market stability, price volatility, and execution quality.
This guide breaks down the mechanics of crypto liquidity, how to interpret order book depth, the subtle mechanics of slippage, and practical strategies to evaluate liquidity before taking execution risks.
---
### What Is Market Liquidity?
At its most fundamental level, liquidity measures how easily an asset can be bought or sold in a market without causing a significant change in its price.
In a highly liquid market, a participant can execute a substantial trade, and the prevailing market price will barely move because there are sufficient orders on the opposite side of the transaction. In an illiquid market, even a modest trade can cause dramatic price movements because available orders are sparse.
In the digital asset space, liquidity manifests in two primary forms:
1. **Asset Liquidity:** Refers to how easily a specific digital asset can be converted into fiat currency or widely accepted stablecoins without taking a significant price discount. High-cap assets like Bitcoin and Ethereum possess deep asset liquidity, whereas newly issued or micro-cap tokens often lack it.
2. **Market Liquidity:** Refers to the density of active buy and sell orders on a specific exchange or decentralized venue at any given moment.
Market liquidity relies on the continuous interaction between **market makers** and **market takers**. Market makers provide liquidity by placing limit orders above and below the current price, populating the order book. Market takers consume liquidity by executing market orders that immediately match against those existing limit orders.
---
### The Central Limit Order Book, Market Depth, and Bid-Ask Spreads
To understand liquidity on centralized exchanges, one must examine the Central Limit Order Book (CLOB). An order book aggregates all resting limit orders into two opposing columns:
* **The Bid Side:** Orders from buyers willing to purchase the asset at specific prices at or below the current market rate.
* **The Ask (or Offer) Side:** Orders from sellers willing to sell the asset at specific prices at or above the current market rate.
The difference between the highest available bid price and the lowest available ask price is known as the **Bid-Ask Spread**.
* **Narrow Spread:** Indicates robust liquidity and active competition among market makers. For established assets on high-volume venues, spreads are often paper-thin ( fractions of a percentage point).
* **Wide Spread:** Indicates thin liquidity, lower participant activity, or elevated uncertainty. Illiquid tokens frequently exhibit wide spreads, meaning a buyer immediately incurs an execution penalty if they attempt to sell back into the market instantly.
**Market Depth** refers to the cumulative volume of limit orders resting at various price levels away from the best bid and ask. Traders visualize this using a depth chart, which shows cumulative buy and sell volume as opposing lines.
#### A Practical Example of Slippage and Price Impact
Consider a hypothetical token trading at a display price of $10.00. An investor decides to place a market buy order for 500 tokens.
The seller side of the order book shows the following resting ask limit orders:
* 100 tokens available at $10.00
* 200 tokens available at $10.10
* 500 tokens available at $10.50
Because a market order demands immediate execution at the best available prices, it fills sequentially up the order book:
1. The first 100 tokens fill at $10.00 (Total cost: $1,000)
2. The next 200 tokens fill at $10.10 (Total cost: $2,020)
3. The remaining 200 tokens fill at $10.50 (Total cost: $2,100)
The total spend is $5,120 for 500 tokens, yielding an average execution price of $10.24 per token.
The difference between the expected price ($10.00) and the actual average execution price ($10.24) is **slippage**. The buyer paid a 2.4% execution premium simply because the top of the order book lacked sufficient depth to absorb the order size.
---
### Centralized vs. Decentralized Liquidity Models
Liquidity functions differently depending on the structural architecture of the execution venue.
#### Centralized Exchange (CEX) Liquidity
Centralized platforms use matching engines paired with traditional order books. Institutional market makers provide continuous liquidity using automated algorithms. While CEXs generally offer the deepest order books and lowest slippage for major assets, liquidity on these venues can thin out quickly if market makers reduce risk during extreme market events.
#### Decentralized Exchange (DEX) Liquidity
Decentralized platforms typically rely on **Automated Market Makers (AMMs)** rather than traditional order books. Instead of matching buyers directly with sellers, users swap tokens against a smart-contract-based Liquidity Pool containing pairs of assets.
In constant-product AMMs, prices adjust automatically based on mathematical formulas as swaps alter the ratio of assets in the pool. Price impact on a DEX depends directly on the size of the swap relative to the total liquidity locked in the pool. Liquidity providers supply these pools to earn transaction fees, but face operational risks such as impermanent loss when asset ratios change drastically.
---
### Why Liquidity Evaporates: Liquidity Cascades and Structural Volatility
Liquidity in crypto markets is dynamic rather than constant. It tends to expand during calm, trending conditions and contract sharply during unexpected market shocks.
During rapid price contractions, several factors can cause liquidity to disappear:
1. **Automated Risk Offloading:** Professional market makers employ strict risk parameters. When market volatility exceeds predefined limits, algorithms automatically widen bid-ask spreads or cancel resting limit orders to protect balance sheets.
2. **Liquidation Cascades:** In leveraged derivatives markets, when asset prices break critical price thresholds, exchange risk management systems issue automated market sell orders to liquidate underwater positions. These forced market orders absorb all available bid liquidity down the order book, creating swift downward price spikes ("flash crashes").
3. **Off-Peak Liquidity Windows:** Because digital asset markets operate continuously, traditional institutional liquidity varies across international time zones. Trading volumes during weekend hours or non-overlapping bank hours often drop, making order books thinner and more sensitive to smaller orders.
---
### Practical Liquidity Analysis for Intermediate Traders
Traders can incorporate structural liquidity checks into their routine market analysis to refine trade execution:
* **Examine Depth Metrics (+2% / -2% Depth):** Rather than relying solely on total 24-hour volume, evaluate the nominal dollar value sitting within 2% of the current price on both sides of the book. High depth within this range suggests strong execution efficiency.
* **Utilize Limit and Algorithmic Orders:** In less liquid markets, using limit orders eliminates positive and negative slippage by ensuring control over the fill price, though it introduces non-execution risk.
* **Monitor Volume-to-Market-Cap Ratios:** Low trading volume relative to circulating market capitalization can signal that an asset is illiquid, making position entry and exit challenging for larger allocations.
* **Track Execution Benchmarks (VWAP):** Institutional traders monitor the Volume-Weighted Average Price (VWAP) to break large orders into smaller chunks over time, matching historical trading distribution to minimize market impact.
---
### Limitations, Order Book Illusions, and Risks
Relying purely on visible order book data carries inherent limitations and risks:
* **Spoofing and Phantom Liquidity:** Large market actors may place non-executable limit orders (such as large buy walls) to project artificial support, only to cancel them right before price reaches that level.
* **Iceberg Orders:** Institutional traders often execute large trades using "iceberg" orders, which reveal only a fraction of the total size on the visible order book at any one time.
* **Wash Trading:** On lower-tier platforms, automated bots may engage in wash trading—trading back and forth with themselves—to display inflated volume statistics that do not represent genuine market depth.
---
### Conclusion
Liquidity is a core foundation of market micro-structure. It dictates how efficiently prices are discovered and how safely market participants can move in and out of positions. By learning to look beyond simple line charts—analyzing order book depth, measuring spreads, accounting for slippage, and recognizing the structural differences between CEX and DEX environments—intermediate traders can make more informed execution decisions.
Markets remain unpredictable, liquidity can shrink when it is needed most, and past order book depth offers no guarantee of future market conditions. Managing trade sizing relative to available market depth remains a primary discipline for long-term survival in digital asset trading.
#CryptoLiquidity #MarketDepth #OrderBook Analysis
Understanding liquidity is a crucial milestone that separates novice market participants from disciplined intermediate traders. In fast-moving digital asset markets that operate 24 hours a day, 7 days a week, liquidity dictates market stability, price volatility, and execution quality.
This guide breaks down the mechanics of crypto liquidity, how to interpret order book depth, the subtle mechanics of slippage, and practical strategies to evaluate liquidity before taking execution risks.
---
### What Is Market Liquidity?
At its most fundamental level, liquidity measures how easily an asset can be bought or sold in a market without causing a significant change in its price.
In a highly liquid market, a participant can execute a substantial trade, and the prevailing market price will barely move because there are sufficient orders on the opposite side of the transaction. In an illiquid market, even a modest trade can cause dramatic price movements because available orders are sparse.
In the digital asset space, liquidity manifests in two primary forms:
1. **Asset Liquidity:** Refers to how easily a specific digital asset can be converted into fiat currency or widely accepted stablecoins without taking a significant price discount. High-cap assets like Bitcoin and Ethereum possess deep asset liquidity, whereas newly issued or micro-cap tokens often lack it.
2. **Market Liquidity:** Refers to the density of active buy and sell orders on a specific exchange or decentralized venue at any given moment.
Market liquidity relies on the continuous interaction between **market makers** and **market takers**. Market makers provide liquidity by placing limit orders above and below the current price, populating the order book. Market takers consume liquidity by executing market orders that immediately match against those existing limit orders.
---
### The Central Limit Order Book, Market Depth, and Bid-Ask Spreads
To understand liquidity on centralized exchanges, one must examine the Central Limit Order Book (CLOB). An order book aggregates all resting limit orders into two opposing columns:
* **The Bid Side:** Orders from buyers willing to purchase the asset at specific prices at or below the current market rate.
* **The Ask (or Offer) Side:** Orders from sellers willing to sell the asset at specific prices at or above the current market rate.
The difference between the highest available bid price and the lowest available ask price is known as the **Bid-Ask Spread**.
* **Narrow Spread:** Indicates robust liquidity and active competition among market makers. For established assets on high-volume venues, spreads are often paper-thin ( fractions of a percentage point).
* **Wide Spread:** Indicates thin liquidity, lower participant activity, or elevated uncertainty. Illiquid tokens frequently exhibit wide spreads, meaning a buyer immediately incurs an execution penalty if they attempt to sell back into the market instantly.
**Market Depth** refers to the cumulative volume of limit orders resting at various price levels away from the best bid and ask. Traders visualize this using a depth chart, which shows cumulative buy and sell volume as opposing lines.
#### A Practical Example of Slippage and Price Impact
Consider a hypothetical token trading at a display price of $10.00. An investor decides to place a market buy order for 500 tokens.
The seller side of the order book shows the following resting ask limit orders:
* 100 tokens available at $10.00
* 200 tokens available at $10.10
* 500 tokens available at $10.50
Because a market order demands immediate execution at the best available prices, it fills sequentially up the order book:
1. The first 100 tokens fill at $10.00 (Total cost: $1,000)
2. The next 200 tokens fill at $10.10 (Total cost: $2,020)
3. The remaining 200 tokens fill at $10.50 (Total cost: $2,100)
The total spend is $5,120 for 500 tokens, yielding an average execution price of $10.24 per token.
The difference between the expected price ($10.00) and the actual average execution price ($10.24) is **slippage**. The buyer paid a 2.4% execution premium simply because the top of the order book lacked sufficient depth to absorb the order size.
---
### Centralized vs. Decentralized Liquidity Models
Liquidity functions differently depending on the structural architecture of the execution venue.
#### Centralized Exchange (CEX) Liquidity
Centralized platforms use matching engines paired with traditional order books. Institutional market makers provide continuous liquidity using automated algorithms. While CEXs generally offer the deepest order books and lowest slippage for major assets, liquidity on these venues can thin out quickly if market makers reduce risk during extreme market events.
#### Decentralized Exchange (DEX) Liquidity
Decentralized platforms typically rely on **Automated Market Makers (AMMs)** rather than traditional order books. Instead of matching buyers directly with sellers, users swap tokens against a smart-contract-based Liquidity Pool containing pairs of assets.
In constant-product AMMs, prices adjust automatically based on mathematical formulas as swaps alter the ratio of assets in the pool. Price impact on a DEX depends directly on the size of the swap relative to the total liquidity locked in the pool. Liquidity providers supply these pools to earn transaction fees, but face operational risks such as impermanent loss when asset ratios change drastically.
---
### Why Liquidity Evaporates: Liquidity Cascades and Structural Volatility
Liquidity in crypto markets is dynamic rather than constant. It tends to expand during calm, trending conditions and contract sharply during unexpected market shocks.
During rapid price contractions, several factors can cause liquidity to disappear:
1. **Automated Risk Offloading:** Professional market makers employ strict risk parameters. When market volatility exceeds predefined limits, algorithms automatically widen bid-ask spreads or cancel resting limit orders to protect balance sheets.
2. **Liquidation Cascades:** In leveraged derivatives markets, when asset prices break critical price thresholds, exchange risk management systems issue automated market sell orders to liquidate underwater positions. These forced market orders absorb all available bid liquidity down the order book, creating swift downward price spikes ("flash crashes").
3. **Off-Peak Liquidity Windows:** Because digital asset markets operate continuously, traditional institutional liquidity varies across international time zones. Trading volumes during weekend hours or non-overlapping bank hours often drop, making order books thinner and more sensitive to smaller orders.
---
### Practical Liquidity Analysis for Intermediate Traders
Traders can incorporate structural liquidity checks into their routine market analysis to refine trade execution:
* **Examine Depth Metrics (+2% / -2% Depth):** Rather than relying solely on total 24-hour volume, evaluate the nominal dollar value sitting within 2% of the current price on both sides of the book. High depth within this range suggests strong execution efficiency.
* **Utilize Limit and Algorithmic Orders:** In less liquid markets, using limit orders eliminates positive and negative slippage by ensuring control over the fill price, though it introduces non-execution risk.
* **Monitor Volume-to-Market-Cap Ratios:** Low trading volume relative to circulating market capitalization can signal that an asset is illiquid, making position entry and exit challenging for larger allocations.
* **Track Execution Benchmarks (VWAP):** Institutional traders monitor the Volume-Weighted Average Price (VWAP) to break large orders into smaller chunks over time, matching historical trading distribution to minimize market impact.
---
### Limitations, Order Book Illusions, and Risks
Relying purely on visible order book data carries inherent limitations and risks:
* **Spoofing and Phantom Liquidity:** Large market actors may place non-executable limit orders (such as large buy walls) to project artificial support, only to cancel them right before price reaches that level.
* **Iceberg Orders:** Institutional traders often execute large trades using "iceberg" orders, which reveal only a fraction of the total size on the visible order book at any one time.
* **Wash Trading:** On lower-tier platforms, automated bots may engage in wash trading—trading back and forth with themselves—to display inflated volume statistics that do not represent genuine market depth.
---
### Conclusion
Liquidity is a core foundation of market micro-structure. It dictates how efficiently prices are discovered and how safely market participants can move in and out of positions. By learning to look beyond simple line charts—analyzing order book depth, measuring spreads, accounting for slippage, and recognizing the structural differences between CEX and DEX environments—intermediate traders can make more informed execution decisions.
Markets remain unpredictable, liquidity can shrink when it is needed most, and past order book depth offers no guarantee of future market conditions. Managing trade sizing relative to available market depth remains a primary discipline for long-term survival in digital asset trading.
#CryptoLiquidity #MarketDepth #OrderBook Analysis
79

·
--
#oilfuturesfallabout4%
Oil futures just plunged over 4% as the Strait of Hormuz opens up. Here is the massive liquidity alpha for crypto. 👇
Oil futures slid more than 4% on Wednesday, with WTI crude falling to $70.04 and Brent crude dropping 4.9% to $73.29 a barrel—hitting their lowest levels since the outbreak of the regional conflict.
What is the real-time macro reality?
Hormuz Traffic Surge:
Hundreds of laden tankers idling in the Persian Gulf are finally moving as ship tracking data shows massive vessels crossing the Strait of Hormuz with transponders completely turned on.
Peace Talks Fuel Supply:
The massive drop in the geopolitical risk premium follows the ongoing US-Iran peace talks in Switzerland, providing direct confidence that the strait will remain open.
Inflation Deflation:
Oil dropping by $3+ a barrel in a single session completely overshadows federal data showing U.S. commercial crude stocks declining by 6.1 million barrels.
The Takeaway for Crypto Traders:
High oil prices act as a hidden tax on global liquidity, forcing central banks to stay hawkish. Now, as energy markets dump and wartime premiums erase, systemic inflation is cooling off rapidly. This shifts global macro conditions from tightening to expanding, paving the way for institutional capital to rotate back into hyper-liquid risk assets like crypto. Follow the liquidity shift!
Core assets to watch under this macro capital rotation:
$BTC | $SOL
{spot}(SOLUSDT)
| $BNB
{spot}(BNBUSDT)
| $ETH
{spot}(ETHUSDT)
#CryptoLiquidity
#oilfuturesfallabout4%
Oil futures just plunged over 4% as the Strait of Hormuz opens up. Here is the massive liquidity alpha for crypto. 👇
Oil futures slid more than 4% on Wednesday, with WTI crude falling to $70.04 and Brent crude dropping 4.9% to $73.29 a barrel—hitting their lowest levels since the outbreak of the regional conflict.
What is the real-time macro reality?
Hormuz Traffic Surge:
Hundreds of laden tankers idling in the Persian Gulf are finally moving as ship tracking data shows massive vessels crossing the Strait of Hormuz with transponders completely turned on.
Peace Talks Fuel Supply:
The massive drop in the geopolitical risk premium follows the ongoing US-Iran peace talks in Switzerland, providing direct confidence that the strait will remain open.
Inflation Deflation:
Oil dropping by $3+ a barrel in a single session completely overshadows federal data showing U.S. commercial crude stocks declining by 6.1 million barrels.
The Takeaway for Crypto Traders:
High oil prices act as a hidden tax on global liquidity, forcing central banks to stay hawkish. Now, as energy markets dump and wartime premiums erase, systemic inflation is cooling off rapidly. This shifts global macro conditions from tightening to expanding, paving the way for institutional capital to rotate back into hyper-liquid risk assets like crypto. Follow the liquidity shift!
Core assets to watch under this macro capital rotation:
$BTC | $SOL
| $BNB
| $ETH
#CryptoLiquidity
Oil futures just plunged over 4% as the Strait of Hormuz opens up. Here is the massive liquidity alpha for crypto. 👇
Oil futures slid more than 4% on Wednesday, with WTI crude falling to $70.04 and Brent crude dropping 4.9% to $73.29 a barrel—hitting their lowest levels since the outbreak of the regional conflict.
What is the real-time macro reality?
Hormuz Traffic Surge:
Hundreds of laden tankers idling in the Persian Gulf are finally moving as ship tracking data shows massive vessels crossing the Strait of Hormuz with transponders completely turned on.
Peace Talks Fuel Supply:
The massive drop in the geopolitical risk premium follows the ongoing US-Iran peace talks in Switzerland, providing direct confidence that the strait will remain open.
Inflation Deflation:
Oil dropping by $3+ a barrel in a single session completely overshadows federal data showing U.S. commercial crude stocks declining by 6.1 million barrels.
The Takeaway for Crypto Traders:
High oil prices act as a hidden tax on global liquidity, forcing central banks to stay hawkish. Now, as energy markets dump and wartime premiums erase, systemic inflation is cooling off rapidly. This shifts global macro conditions from tightening to expanding, paving the way for institutional capital to rotate back into hyper-liquid risk assets like crypto. Follow the liquidity shift!
Core assets to watch under this macro capital rotation:
$BTC | $SOL
| $BNB
| $ETH
#CryptoLiquidity
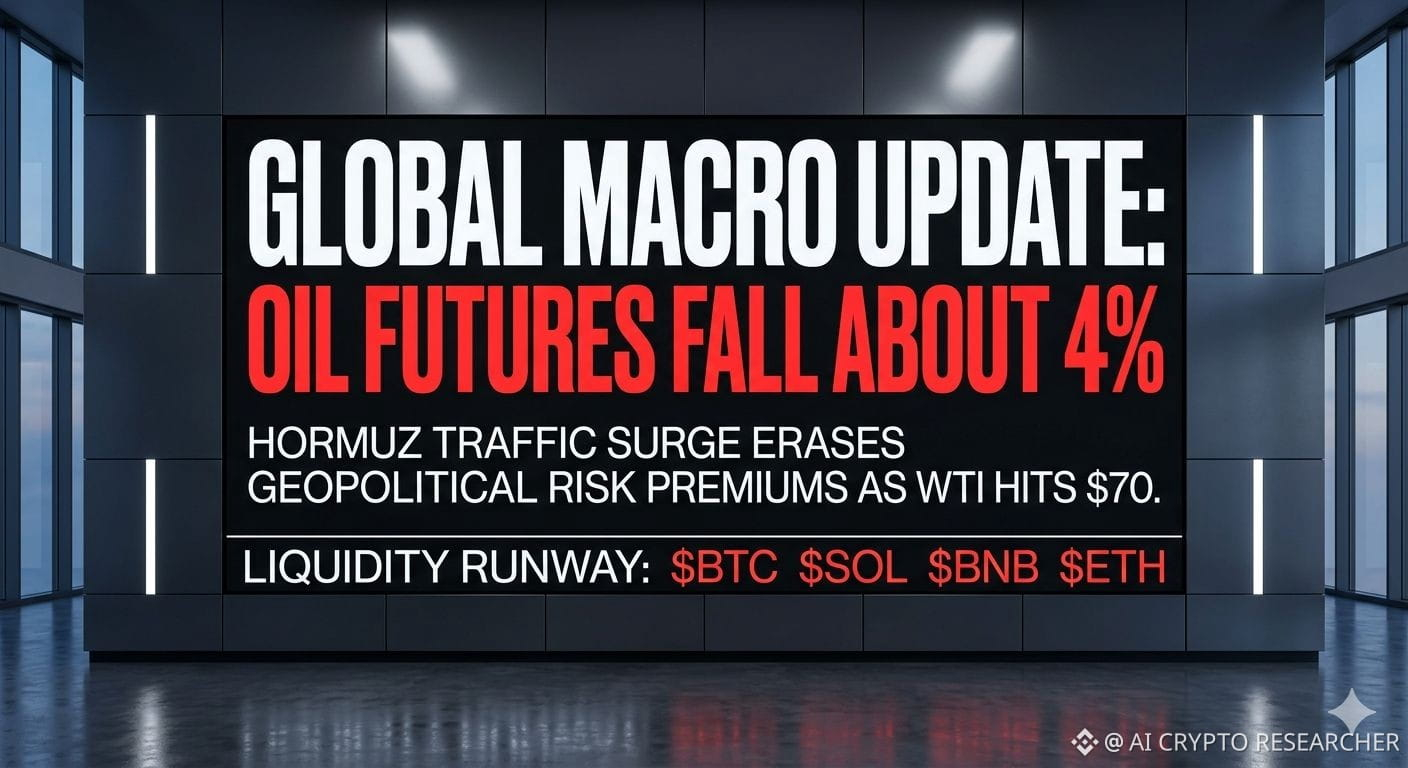
120
◎ Market Liquidity Remains Deep Despite Consolidation: $64.4B in daily volume confirms healthy market structure
On July 14, 2026, total market liquidity measured by 24-hour volume stands at $64.40B, providing ample room for large orders.
Bitcoin alone contributes $28.34B in volume, while Ethereum adds $8.53B, forming the core of exchange activity.
Stablecoin liquidity from $USDT ($42.07B) and $USDC ($11.98B) supports efficient arbitrage and trading.
Depth across major pairs suggests the market can absorb significant inflows and outflows without excessive slippage.
📌 Key Takeaway:
With $64.4B in daily volume, crypto market liquidity remains robust. This depth supports institutional participation and minimizes slippage for large trades.
#CryptoLiquidity #Volume #Trading #MarketDepth
#BinanceAlphaAlert
◎ Market Liquidity Remains Deep Despite Consolidation: $64.4B in daily volume confirms healthy market structure
On July 14, 2026, total market liquidity measured by 24-hour volume stands at $64.40B, providing ample room for large orders.
Bitcoin alone contributes $28.34B in volume, while Ethereum adds $8.53B, forming the core of exchange activity.
Stablecoin liquidity from $USDT ($42.07B) and $USDC ($11.98B) supports efficient arbitrage and trading.
Depth across major pairs suggests the market can absorb significant inflows and outflows without excessive slippage.
📌 Key Takeaway:
With $64.4B in daily volume, crypto market liquidity remains robust. This depth supports institutional participation and minimizes slippage for large trades.
#CryptoLiquidity #Volume #Trading #MarketDepth
#BinanceAlphaAlert
On July 14, 2026, total market liquidity measured by 24-hour volume stands at $64.40B, providing ample room for large orders.
Bitcoin alone contributes $28.34B in volume, while Ethereum adds $8.53B, forming the core of exchange activity.
Stablecoin liquidity from $USDT ($42.07B) and $USDC ($11.98B) supports efficient arbitrage and trading.
Depth across major pairs suggests the market can absorb significant inflows and outflows without excessive slippage.
📌 Key Takeaway:
With $64.4B in daily volume, crypto market liquidity remains robust. This depth supports institutional participation and minimizes slippage for large trades.
#CryptoLiquidity #Volume #Trading #MarketDepth
#BinanceAlphaAlert
22
Log in to explore more content
Join global crypto users on Binance Square
⚡️ Get latest and useful information about crypto.
💬 Trusted by the world’s largest crypto exchange.
👍 Discover real insights from verified creators.
အီးမေးလ် / ဖုန်းနံပါတ်
ရေပန်းစားနေသော ခေါင်းစဉ်များ
1
#BitcoinClears$85200
1,066 views
76 Discussing
2
#AltcoinSeasonIndexHoldsAbove60For5Days
9,616 views
487 Discussing
3
#USADPAdds90000JobsInSeptember
2,717 views
234 Discussing
4
#USCorePCEEasesTo3%InAugust
2,640 views
197 Discussing
5
#KospiPostsWorstQuarterSince2020
3,121 views
246 Discussing
6
#SECToClarifyOnChainFundraisingRules
9,581 views
411 Discussing
7
#UKFCAOpensCryptoFirmAuthorization
13,090 views
394 Discussing
8
#JapanMOFStudyGroupOnTokenizedGovtBonds
11,362 views
322 Discussing
9
#QNTRises287%
54,153 views
726 Discussing
10
#TrumpRejectsAIRulesForVoluntaryAudits
34,979 views
646 Discussing