
#chipstocksextendlossesafternvidiaceochange
chipstocksextendlossesafternvidiaceochange
ရေပန်းစားသော
နောက်ဆုံး


·
--
ဘာသာပြန်ဆိုချက် ကြည့်မည်
STOCKS | U.S. Stocks Open Mixed as Nvidia Shares Fall 13%The Dow Jones Industrial Average opened up 0.11%, while the S&P 500 fell 0.77% and the Nasdaq Composite dropped 1.51%. According to Odaily, Nvidia shares fell 13% at the open, wiping $500 billion from its market value, and the company announced that Jensen Huang had resigned.
Other major stocks moved unevenly: Apple rose 0.31%, Microsoft 0.36%, Alphabet Class A 0.53%, Amazon 1.4%, Taiwan Semiconductor Manufacturing Co. fell 3.73%, SpaceX fell 0.51%, Broadcom rose 3.7%, Meta fell 0.42%, Tesla fell 0.25%, SK Hynix fell 5.38%, Advanced Micro Devices rose 2.54%, Micron Technology fell 4.65%, ASML fell 2.16%, Cisco fell 0.99%, Oracle fell 2.91%, Intel fell 4.11%, Dell Technologies Class C fell 8.66%, and Arm fell 5.21%. Nvidia was down 13.93% in the other stock figures reported.
STOCKS | U.S. Stocks Open Mixed as Nvidia Shares Fall 13%
The Dow Jones Industrial Average opened up 0.11%, while the S&P 500 fell 0.77% and the Nasdaq Composite dropped 1.51%. According to Odaily, Nvidia shares fell 13% at the open, wiping $500 billion from its market value, and the company announced that Jensen Huang had resigned.
Other major stocks moved unevenly: Apple rose 0.31%, Microsoft 0.36%, Alphabet Class A 0.53%, Amazon 1.4%, Taiwan Semiconductor Manufacturing Co. fell 3.73%, SpaceX fell 0.51%, Broadcom rose 3.7%, Meta fell 0.42%, Tesla fell 0.25%, SK Hynix fell 5.38%, Advanced Micro Devices rose 2.54%, Micron Technology fell 4.65%, ASML fell 2.16%, Cisco fell 0.99%, Oracle fell 2.91%, Intel fell 4.11%, Dell Technologies Class C fell 8.66%, and Arm fell 5.21%. Nvidia was down 13.93% in the other stock figures reported.
Other major stocks moved unevenly: Apple rose 0.31%, Microsoft 0.36%, Alphabet Class A 0.53%, Amazon 1.4%, Taiwan Semiconductor Manufacturing Co. fell 3.73%, SpaceX fell 0.51%, Broadcom rose 3.7%, Meta fell 0.42%, Tesla fell 0.25%, SK Hynix fell 5.38%, Advanced Micro Devices rose 2.54%, Micron Technology fell 4.65%, ASML fell 2.16%, Cisco fell 0.99%, Oracle fell 2.91%, Intel fell 4.11%, Dell Technologies Class C fell 8.66%, and Arm fell 5.21%. Nvidia was down 13.93% in the other stock figures reported.
529


စိစစ်အတည်ပြုထားသည်
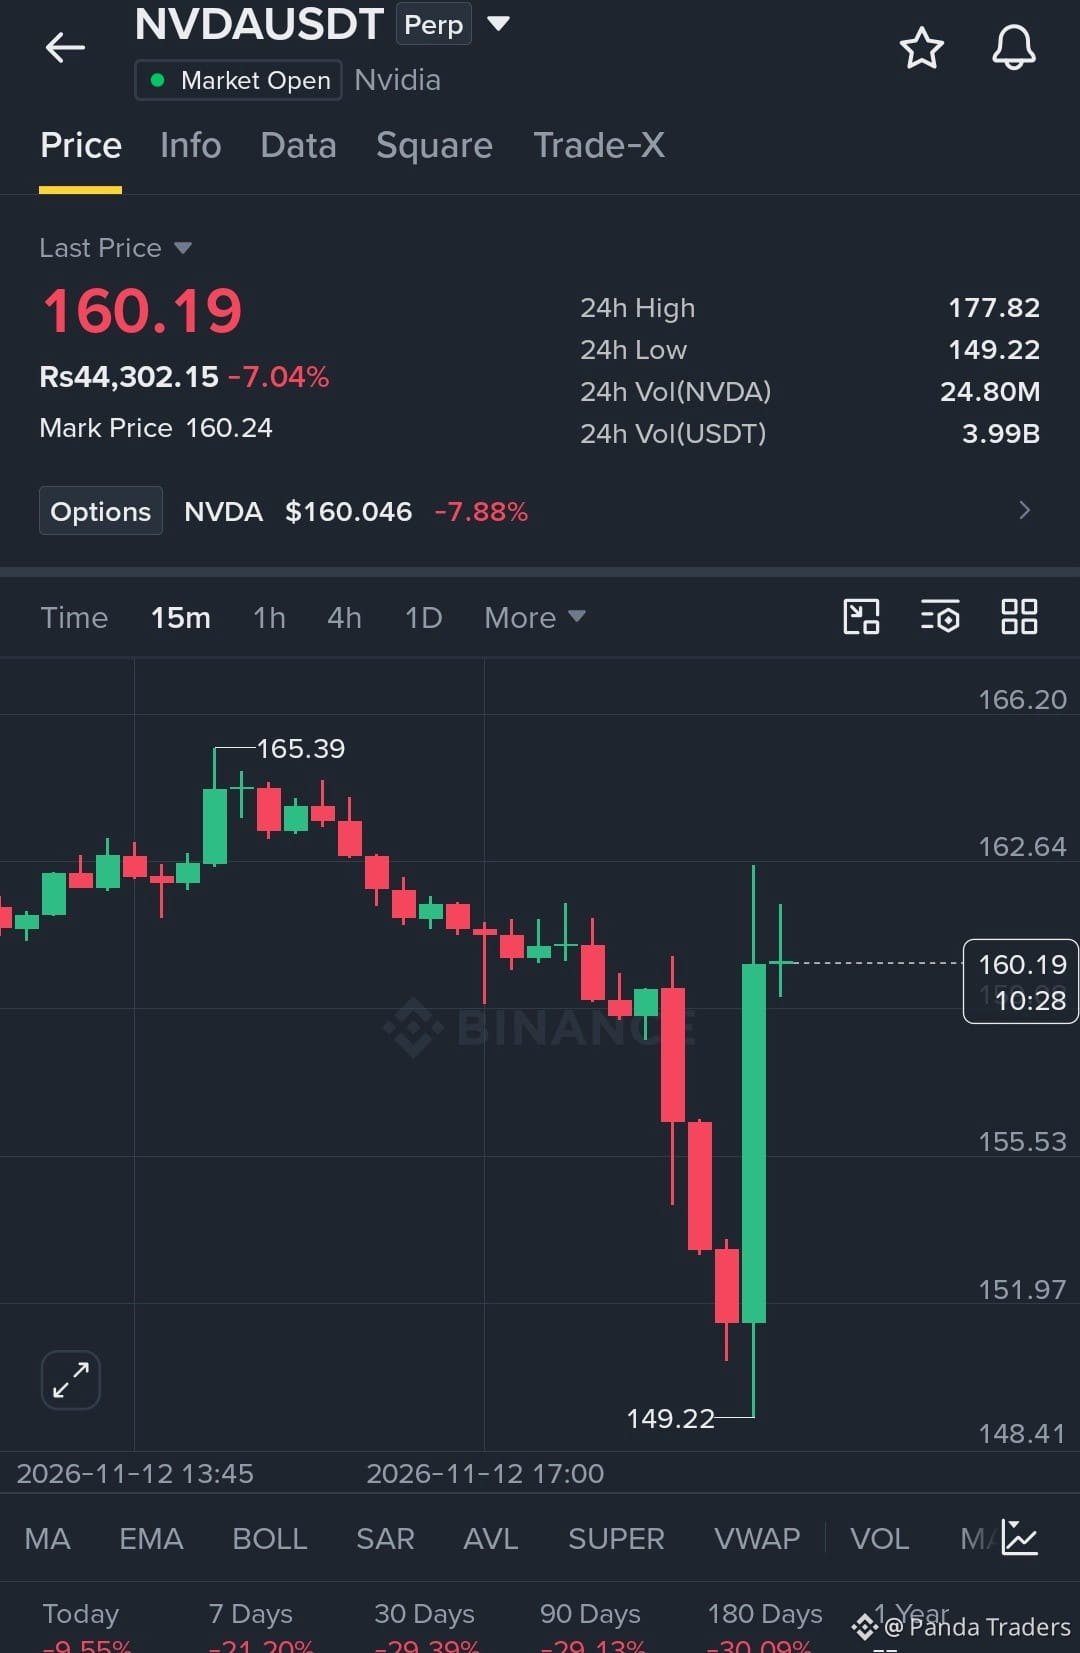
🚨 NVIDIA ဟာ သူ့ရဲ့အင်ပါယာကို တည်ဆောက်ခဲ့သူကို ဆုံးရှုံးလိုက်ရပြီ! CZ ရဲ့ သတိပေးချက်ကို လူတွေ သတိထားလာကြပြီ!
အခြေအနေက အတော်လေး ပြင်းထန်လာနေပါပြီ။
Jensen Huang ဟာ သူ့ရဲ့ကိုယ်ရေးကိုယ်တာဘဝနဲ့ ပတ်သက်တဲ့ မကြာသေးမီက အငြင်းပွားမှုတွေနဲ့ အမျိုးသားလုံခြုံရေးဆိုင်ရာ စိုးရိမ်မှုတွေကြောင့် NVIDIA ရဲ့ CEO ရာထူးကနေ တရားဝင် နုတ်ထွက်လိုက်ပါပြီ။
Colette Kress က ယာယီ CEO အဖြစ် တာဝန်ယူလိုက်ပါပြီ။
စျေးကွက်ရဲ့ တုံ့ပြန်မှုကိုလည်း ကြည့်လိုက်ပါ—NVIDIA ရှယ်ယာတွေဟာ စျေးကွက်မဖွင့်မီ အရောင်းအဝယ်မှာ ၁၀% လောက် ကျဆင်းသွားပါတယ်! 📉
Jensen ကို လွှတ်ပေးလိုက်တာဟာ NVIDIA အတွက် အကြီးအကျယ် မှားယွင်းတဲ့ ဆုံးဖြတ်ချက်လားဆိုတဲ့ အငြင်းပွားမှုကြီးလည်း ဖြစ်နေပါတယ်။
ဘာကြောင့်လဲဆိုတာ ကျွန်တော် နားလည်ပါတယ်။
ဒီလူဟာ NVIDIA ကို AI လုပ်ငန်းကြီးတစ်ခုဖြစ်လာအောင် နှစ်ပေါင်း ၃၀ ကျော်ကြာ တည်ဆောက်ခဲ့သူပါ။ CEO တစ်ယောက်ကို အစားထိုးလို့ရပေမယ့် ကုမ္ပဏီတစ်ခုလုံးရဲ့ နောက်ကွယ်က မျှော်မှန်းချက်ကို အစားထိုးဖို့ကတော့ တခြားကိစ္စတစ်ခုပါပဲ။
အငြင်းပွားမှုက ပြင်းထန်ပြီး အမျိုးသားလုံခြုံရေးဆိုင်ရာ စွပ်စွဲချက်တွေကိုလည်း စုံစမ်းနေဆဲပါ။
ဒါကို ဈေးကျချိန်မှာ ဝယ်ယူဖို့ နောက်ထပ်အခွင့်အရေးတစ်ခုလို့ မယူဆလိုက်ပါနဲ့။ ဒီလောက်ကြီးမားတဲ့ ကုမ္ပဏီတစ်ခုဟာ တည်ထောင်သူ CEO ကို ရုတ်တရက် ဆုံးရှုံးသွားတဲ့အခါ ဖြစ်ပေါ်လာတဲ့ မသေချာမှုတွေက နည်းပညာရှယ်ယာတွေနဲ့ ပိုမိုကျယ်ပြန့်တဲ့ စျေးကွက်တစ်ခုလုံးဆီ ပျံ့နှံ့သွားနိုင်ပါတယ်။
NVIDIA၊ Nasdaq နဲ့ AI နဲ့ဆက်စပ်တဲ့ ရှယ်ယာတွေကို စောင့်ကြည့်ထားပါ။ ဈေးနှုန်းအတက်အကျ ကြမ်းတမ်းနိုင်တာကို မျှော်လင့်ထားပြီး ပထမဆုံး ပြန်တက်လာတဲ့အချိန်မှာ အလျင်စလို လိုက်မဝယ်မိပါစေနဲ့။
မေးခွန်းတစ်ခုပါ—NVIDIA ရဲ့ ဆုံးဖြတ်ချက် မှန်ကန်ခဲ့သလား၊ ဒါမှမဟုတ် Jensen Huang ကို ဆုံးရှုံးလိုက်ရတာကို နောင်တရမလား? 👀
$NVDA
{future}(NVDAUSDT)
#HuangExitNvidiaStrategyInFocus #ChipStocksExtendLossesAfterNvidiaCEOChange #MSCIRemovalMayCurbStrategy’sBitcoinBuying
🚨 NVIDIA ဟာ သူ့ရဲ့အင်ပါယာကို တည်ဆောက်ခဲ့သူကို ဆုံးရှုံးလိုက်ရပြီ! CZ ရဲ့ သတိပေးချက်ကို လူတွေ သတိထားလာကြပြီ!
အခြေအနေက အတော်လေး ပြင်းထန်လာနေပါပြီ။
Jensen Huang ဟာ သူ့ရဲ့ကိုယ်ရေးကိုယ်တာဘဝနဲ့ ပတ်သက်တဲ့ မကြာသေးမီက အငြင်းပွားမှုတွေနဲ့ အမျိုးသားလုံခြုံရေးဆိုင်ရာ စိုးရိမ်မှုတွေကြောင့် NVIDIA ရဲ့ CEO ရာထူးကနေ တရားဝင် နုတ်ထွက်လိုက်ပါပြီ။
Colette Kress က ယာယီ CEO အဖြစ် တာဝန်ယူလိုက်ပါပြီ။
စျေးကွက်ရဲ့ တုံ့ပြန်မှုကိုလည်း ကြည့်လိုက်ပါ—NVIDIA ရှယ်ယာတွေဟာ စျေးကွက်မဖွင့်မီ အရောင်းအဝယ်မှာ ၁၀% လောက် ကျဆင်းသွားပါတယ်! 📉
Jensen ကို လွှတ်ပေးလိုက်တာဟာ NVIDIA အတွက် အကြီးအကျယ် မှားယွင်းတဲ့ ဆုံးဖြတ်ချက်လားဆိုတဲ့ အငြင်းပွားမှုကြီးလည်း ဖြစ်နေပါတယ်။
ဘာကြောင့်လဲဆိုတာ ကျွန်တော် နားလည်ပါတယ်။
ဒီလူဟာ NVIDIA ကို AI လုပ်ငန်းကြီးတစ်ခုဖြစ်လာအောင် နှစ်ပေါင်း ၃၀ ကျော်ကြာ တည်ဆောက်ခဲ့သူပါ။ CEO တစ်ယောက်ကို အစားထိုးလို့ရပေမယ့် ကုမ္ပဏီတစ်ခုလုံးရဲ့ နောက်ကွယ်က မျှော်မှန်းချက်ကို အစားထိုးဖို့ကတော့ တခြားကိစ္စတစ်ခုပါပဲ။
အငြင်းပွားမှုက ပြင်းထန်ပြီး အမျိုးသားလုံခြုံရေးဆိုင်ရာ စွပ်စွဲချက်တွေကိုလည်း စုံစမ်းနေဆဲပါ။
ဒါကို ဈေးကျချိန်မှာ ဝယ်ယူဖို့ နောက်ထပ်အခွင့်အရေးတစ်ခုလို့ မယူဆလိုက်ပါနဲ့။ ဒီလောက်ကြီးမားတဲ့ ကုမ္ပဏီတစ်ခုဟာ တည်ထောင်သူ CEO ကို ရုတ်တရက် ဆုံးရှုံးသွားတဲ့အခါ ဖြစ်ပေါ်လာတဲ့ မသေချာမှုတွေက နည်းပညာရှယ်ယာတွေနဲ့ ပိုမိုကျယ်ပြန့်တဲ့ စျေးကွက်တစ်ခုလုံးဆီ ပျံ့နှံ့သွားနိုင်ပါတယ်။
NVIDIA၊ Nasdaq နဲ့ AI နဲ့ဆက်စပ်တဲ့ ရှယ်ယာတွေကို စောင့်ကြည့်ထားပါ။ ဈေးနှုန်းအတက်အကျ ကြမ်းတမ်းနိုင်တာကို မျှော်လင့်ထားပြီး ပထမဆုံး ပြန်တက်လာတဲ့အချိန်မှာ အလျင်စလို လိုက်မဝယ်မိပါစေနဲ့။
မေးခွန်းတစ်ခုပါ—NVIDIA ရဲ့ ဆုံးဖြတ်ချက် မှန်ကန်ခဲ့သလား၊ ဒါမှမဟုတ် Jensen Huang ကို ဆုံးရှုံးလိုက်ရတာကို နောင်တရမလား? 👀
$NVDA
#HuangExitNvidiaStrategyInFocus #ChipStocksExtendLossesAfterNvidiaCEOChange #MSCIRemovalMayCurbStrategy’sBitcoinBuying
အခြေအနေက အတော်လေး ပြင်းထန်လာနေပါပြီ။
Jensen Huang ဟာ သူ့ရဲ့ကိုယ်ရေးကိုယ်တာဘဝနဲ့ ပတ်သက်တဲ့ မကြာသေးမီက အငြင်းပွားမှုတွေနဲ့ အမျိုးသားလုံခြုံရေးဆိုင်ရာ စိုးရိမ်မှုတွေကြောင့် NVIDIA ရဲ့ CEO ရာထူးကနေ တရားဝင် နုတ်ထွက်လိုက်ပါပြီ။
Colette Kress က ယာယီ CEO အဖြစ် တာဝန်ယူလိုက်ပါပြီ။
စျေးကွက်ရဲ့ တုံ့ပြန်မှုကိုလည်း ကြည့်လိုက်ပါ—NVIDIA ရှယ်ယာတွေဟာ စျေးကွက်မဖွင့်မီ အရောင်းအဝယ်မှာ ၁၀% လောက် ကျဆင်းသွားပါတယ်! 📉
Jensen ကို လွှတ်ပေးလိုက်တာဟာ NVIDIA အတွက် အကြီးအကျယ် မှားယွင်းတဲ့ ဆုံးဖြတ်ချက်လားဆိုတဲ့ အငြင်းပွားမှုကြီးလည်း ဖြစ်နေပါတယ်။
ဘာကြောင့်လဲဆိုတာ ကျွန်တော် နားလည်ပါတယ်။
ဒီလူဟာ NVIDIA ကို AI လုပ်ငန်းကြီးတစ်ခုဖြစ်လာအောင် နှစ်ပေါင်း ၃၀ ကျော်ကြာ တည်ဆောက်ခဲ့သူပါ။ CEO တစ်ယောက်ကို အစားထိုးလို့ရပေမယ့် ကုမ္ပဏီတစ်ခုလုံးရဲ့ နောက်ကွယ်က မျှော်မှန်းချက်ကို အစားထိုးဖို့ကတော့ တခြားကိစ္စတစ်ခုပါပဲ။
အငြင်းပွားမှုက ပြင်းထန်ပြီး အမျိုးသားလုံခြုံရေးဆိုင်ရာ စွပ်စွဲချက်တွေကိုလည်း စုံစမ်းနေဆဲပါ။
ဒါကို ဈေးကျချိန်မှာ ဝယ်ယူဖို့ နောက်ထပ်အခွင့်အရေးတစ်ခုလို့ မယူဆလိုက်ပါနဲ့။ ဒီလောက်ကြီးမားတဲ့ ကုမ္ပဏီတစ်ခုဟာ တည်ထောင်သူ CEO ကို ရုတ်တရက် ဆုံးရှုံးသွားတဲ့အခါ ဖြစ်ပေါ်လာတဲ့ မသေချာမှုတွေက နည်းပညာရှယ်ယာတွေနဲ့ ပိုမိုကျယ်ပြန့်တဲ့ စျေးကွက်တစ်ခုလုံးဆီ ပျံ့နှံ့သွားနိုင်ပါတယ်။
NVIDIA၊ Nasdaq နဲ့ AI နဲ့ဆက်စပ်တဲ့ ရှယ်ယာတွေကို စောင့်ကြည့်ထားပါ။ ဈေးနှုန်းအတက်အကျ ကြမ်းတမ်းနိုင်တာကို မျှော်လင့်ထားပြီး ပထမဆုံး ပြန်တက်လာတဲ့အချိန်မှာ အလျင်စလို လိုက်မဝယ်မိပါစေနဲ့။
မေးခွန်းတစ်ခုပါ—NVIDIA ရဲ့ ဆုံးဖြတ်ချက် မှန်ကန်ခဲ့သလား၊ ဒါမှမဟုတ် Jensen Huang ကို ဆုံးရှုံးလိုက်ရတာကို နောင်တရမလား? 👀
$NVDA
#HuangExitNvidiaStrategyInFocus #ChipStocksExtendLossesAfterNvidiaCEOChange #MSCIRemovalMayCurbStrategy’sBitcoinBuying


1
748

·
--
ဘာသာပြန်ဆိုချက် ကြည့်မည်
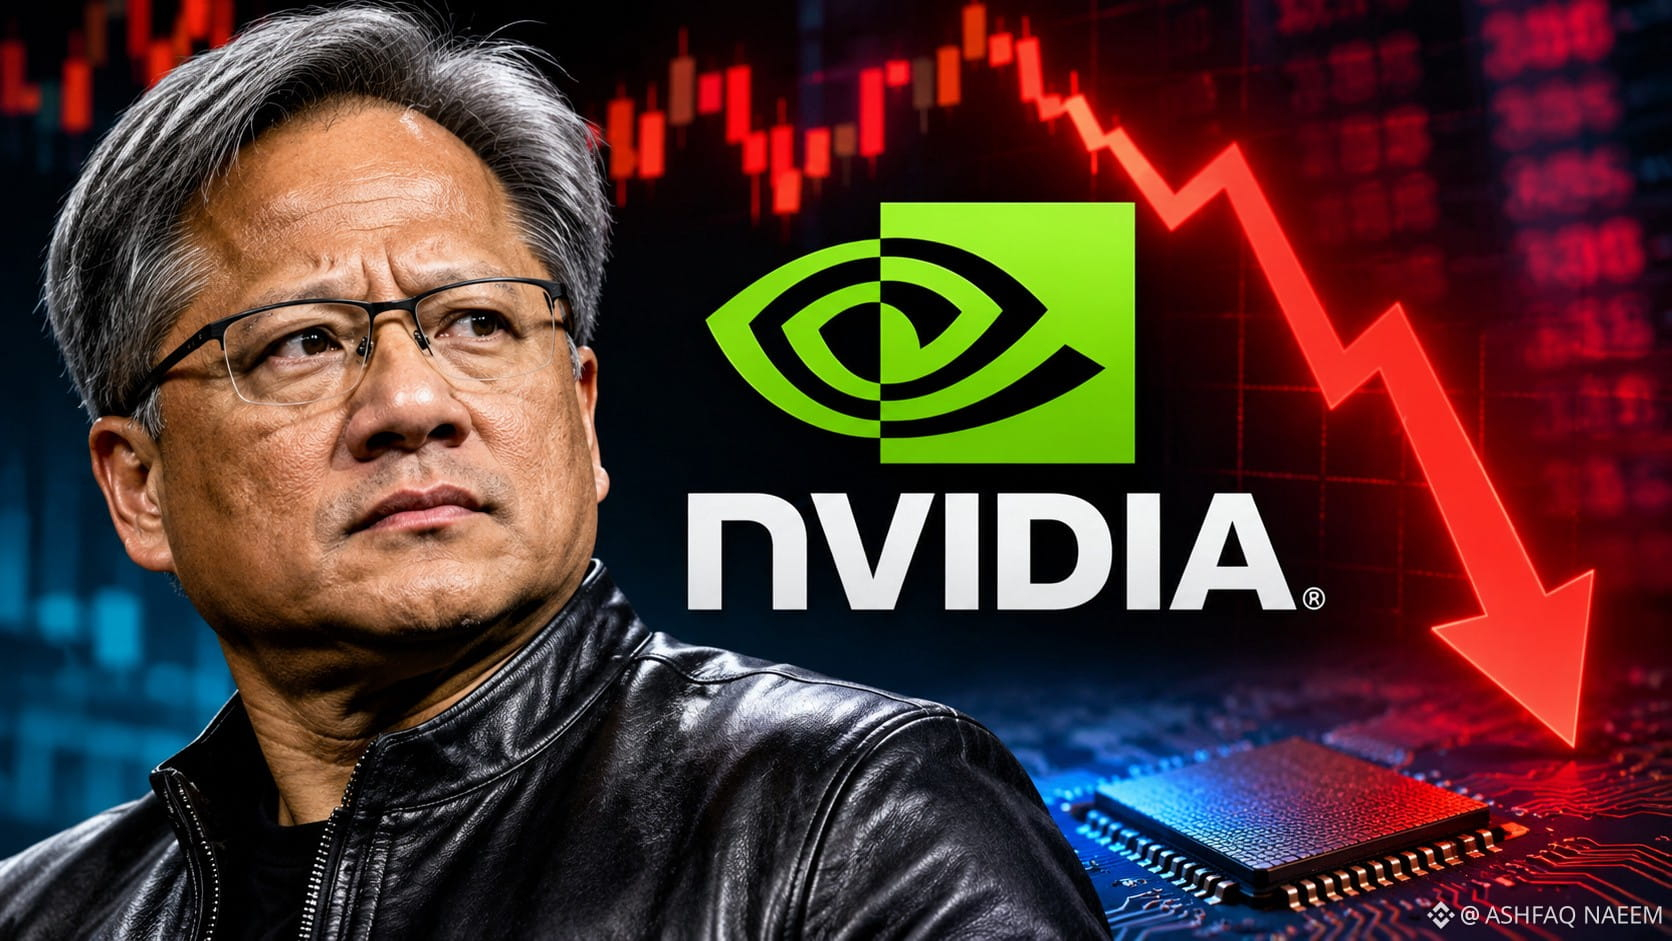
🚨 NVIDIA SHOCKWAVE! CHIP STOCKS EXTEND LOSSES AS JENSEN HUANG EXIT ROCKS AI MARKET
The semiconductor industry is facing fresh turbulence as Nvidia CEO Jensen Huang’s reported departure sends shockwaves across global markets. Nvidia shares plunged, triggering renewed selling pressure across chipmakers and AI-related companies. CFO Colette Kress has reportedly been named interim CEO, adding another layer of uncertainty to the company’s leadership transition.
The bigger concern is Nvidia’s central role in the AI ecosystem. Any leadership instability could affect investor confidence, AI infrastructure spending expectations, and the broader semiconductor market. While competitors such as AMD and Broadcom could potentially benefit from changing market dynamics, uncertainty remains high.
The key question: Is this a temporary market panic or the beginning of a deeper correction in AI and semiconductor stocks?
#chipstocksextendlossesafternvidiaceochange $NVDAB
{spot}(NVDABUSDT)
🚨 NVIDIA SHOCKWAVE! CHIP STOCKS EXTEND LOSSES AS JENSEN HUANG EXIT ROCKS AI MARKET
The semiconductor industry is facing fresh turbulence as Nvidia CEO Jensen Huang’s reported departure sends shockwaves across global markets. Nvidia shares plunged, triggering renewed selling pressure across chipmakers and AI-related companies. CFO Colette Kress has reportedly been named interim CEO, adding another layer of uncertainty to the company’s leadership transition.
The bigger concern is Nvidia’s central role in the AI ecosystem. Any leadership instability could affect investor confidence, AI infrastructure spending expectations, and the broader semiconductor market. While competitors such as AMD and Broadcom could potentially benefit from changing market dynamics, uncertainty remains high.
The key question: Is this a temporary market panic or the beginning of a deeper correction in AI and semiconductor stocks?
#chipstocksextendlossesafternvidiaceochange $NVDAB
The semiconductor industry is facing fresh turbulence as Nvidia CEO Jensen Huang’s reported departure sends shockwaves across global markets. Nvidia shares plunged, triggering renewed selling pressure across chipmakers and AI-related companies. CFO Colette Kress has reportedly been named interim CEO, adding another layer of uncertainty to the company’s leadership transition.
The bigger concern is Nvidia’s central role in the AI ecosystem. Any leadership instability could affect investor confidence, AI infrastructure spending expectations, and the broader semiconductor market. While competitors such as AMD and Broadcom could potentially benefit from changing market dynamics, uncertainty remains high.
The key question: Is this a temporary market panic or the beginning of a deeper correction in AI and semiconductor stocks?
#chipstocksextendlossesafternvidiaceochange $NVDAB
56

·
--
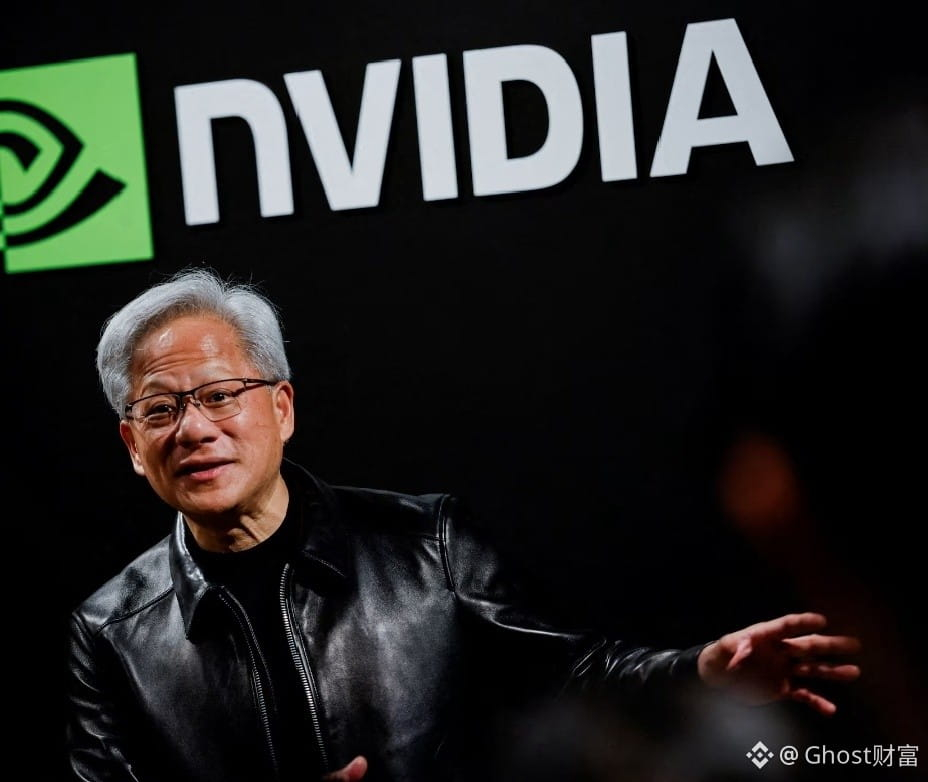
🚨 နောက်ဆုံးရသတင်း: JENSEN HUANG ရာထူးမှ နုတ်ထွက်!🤯
NVIDIA အမှုဆောင်အရာရှိချုပ် Jensen Huang ရာထူးမှ နုတ်ထွက်သွားကြောင်း သတင်းများထွက်ပေါ်လာပြီး AI နှင့် နည်းပညာလုပ်ငန်းတစ်ခုလုံးကို တုန်လှုပ်စေခဲ့သည်။
📉 $NVDA ရှယ်ယာများ 10% ကျဆင်း ⚠️ AI လုပ်ငန်းကြီးတွင် ခေါင်းဆောင်မှု အပြောင်းအလဲဖြစ် 🔥 ရင်းနှီးမြှုပ်နှံသူများ ကြီးမားသော မသေချာမှုနှင့် ရင်ဆိုင်နေရ
NVIDIA အတွက် သမိုင်းဝင်အခိုက်အတန့်တစ်ခုပါ။ AI ဈေးကွက်တစ်ခုလုံးက အနီးကပ် စောင့်ကြည့်နေသည်။
#HuangExitNvidiaStrategyInFocus #ChipStocksExtendLossesAfterNvidiaCEOChange
🚨 နောက်ဆုံးရသတင်း: JENSEN HUANG ရာထူးမှ နုတ်ထွက်!🤯
NVIDIA အမှုဆောင်အရာရှိချုပ် Jensen Huang ရာထူးမှ နုတ်ထွက်သွားကြောင်း သတင်းများထွက်ပေါ်လာပြီး AI နှင့် နည်းပညာလုပ်ငန်းတစ်ခုလုံးကို တုန်လှုပ်စေခဲ့သည်။
📉 $NVDA ရှယ်ယာများ 10% ကျဆင်း ⚠️ AI လုပ်ငန်းကြီးတွင် ခေါင်းဆောင်မှု အပြောင်းအလဲဖြစ် 🔥 ရင်းနှီးမြှုပ်နှံသူများ ကြီးမားသော မသေချာမှုနှင့် ရင်ဆိုင်နေရ
NVIDIA အတွက် သမိုင်းဝင်အခိုက်အတန့်တစ်ခုပါ။ AI ဈေးကွက်တစ်ခုလုံးက အနီးကပ် စောင့်ကြည့်နေသည်။
#HuangExitNvidiaStrategyInFocus #ChipStocksExtendLossesAfterNvidiaCEOChange
NVIDIA အမှုဆောင်အရာရှိချုပ် Jensen Huang ရာထူးမှ နုတ်ထွက်သွားကြောင်း သတင်းများထွက်ပေါ်လာပြီး AI နှင့် နည်းပညာလုပ်ငန်းတစ်ခုလုံးကို တုန်လှုပ်စေခဲ့သည်။
📉 $NVDA ရှယ်ယာများ 10% ကျဆင်း ⚠️ AI လုပ်ငန်းကြီးတွင် ခေါင်းဆောင်မှု အပြောင်းအလဲဖြစ် 🔥 ရင်းနှီးမြှုပ်နှံသူများ ကြီးမားသော မသေချာမှုနှင့် ရင်ဆိုင်နေရ
NVIDIA အတွက် သမိုင်းဝင်အခိုက်အတန့်တစ်ခုပါ။ AI ဈေးကွက်တစ်ခုလုံးက အနီးကပ် စောင့်ကြည့်နေသည်။
#HuangExitNvidiaStrategyInFocus #ChipStocksExtendLossesAfterNvidiaCEOChange
377

·
--
ဘာသာပြန်ဆိုချက် ကြည့်မည်
18 点我说「钱没离开 AI,只是换了一家」,现在收回一半。
黄仁勋今天正式辞职,CFO Colette Kress 暂代 CEO。路透给的盘前数字,AMD 涨约 2%,博通涨约 1.4%,这部分算我说对了。但英伟达投过的那一圈全在跌,CoreWeave 约 -13.6%,Nebius 约 -20%,美光约 -5.8%。 #ChipStocksExtendLossesAfterNvidiaCEOChange
不是换一家,是整条链在重新算。
$BTC 也终于动了,现在约 71,480 美元,24 小时跌约 2.8%。中午我还在问它为什么不跟着跌,今晚算有答案了,只是不太好看。
明天睡醒只看一件事:美股收盘后,跌的是英伟达那一圈,还是纳指整体一起跌。前者还能叫公司的事,后者就是行业的事。 #HuangExitNvidiaStrategyInFocus
你今天说过的话,晚上收回了几句?
个人复盘,不构成买卖建议。晚安。
18 点我说「钱没离开 AI,只是换了一家」,现在收回一半。
黄仁勋今天正式辞职,CFO Colette Kress 暂代 CEO。路透给的盘前数字,AMD 涨约 2%,博通涨约 1.4%,这部分算我说对了。但英伟达投过的那一圈全在跌,CoreWeave 约 -13.6%,Nebius 约 -20%,美光约 -5.8%。 #ChipStocksExtendLossesAfterNvidiaCEOChange
不是换一家,是整条链在重新算。
$BTC 也终于动了,现在约 71,480 美元,24 小时跌约 2.8%。中午我还在问它为什么不跟着跌,今晚算有答案了,只是不太好看。
明天睡醒只看一件事:美股收盘后,跌的是英伟达那一圈,还是纳指整体一起跌。前者还能叫公司的事,后者就是行业的事。 #HuangExitNvidiaStrategyInFocus
你今天说过的话,晚上收回了几句?
个人复盘,不构成买卖建议。晚安。
黄仁勋今天正式辞职,CFO Colette Kress 暂代 CEO。路透给的盘前数字,AMD 涨约 2%,博通涨约 1.4%,这部分算我说对了。但英伟达投过的那一圈全在跌,CoreWeave 约 -13.6%,Nebius 约 -20%,美光约 -5.8%。 #ChipStocksExtendLossesAfterNvidiaCEOChange
不是换一家,是整条链在重新算。
$BTC 也终于动了,现在约 71,480 美元,24 小时跌约 2.8%。中午我还在问它为什么不跟着跌,今晚算有答案了,只是不太好看。
明天睡醒只看一件事:美股收盘后,跌的是英伟达那一圈,还是纳指整体一起跌。前者还能叫公司的事,后者就是行业的事。 #HuangExitNvidiaStrategyInFocus
你今天说过的话,晚上收回了几句?
个人复盘,不构成买卖建议。晚安。

1
437

ဘာသာပြန်ဆိုချက် ကြည့်မည်
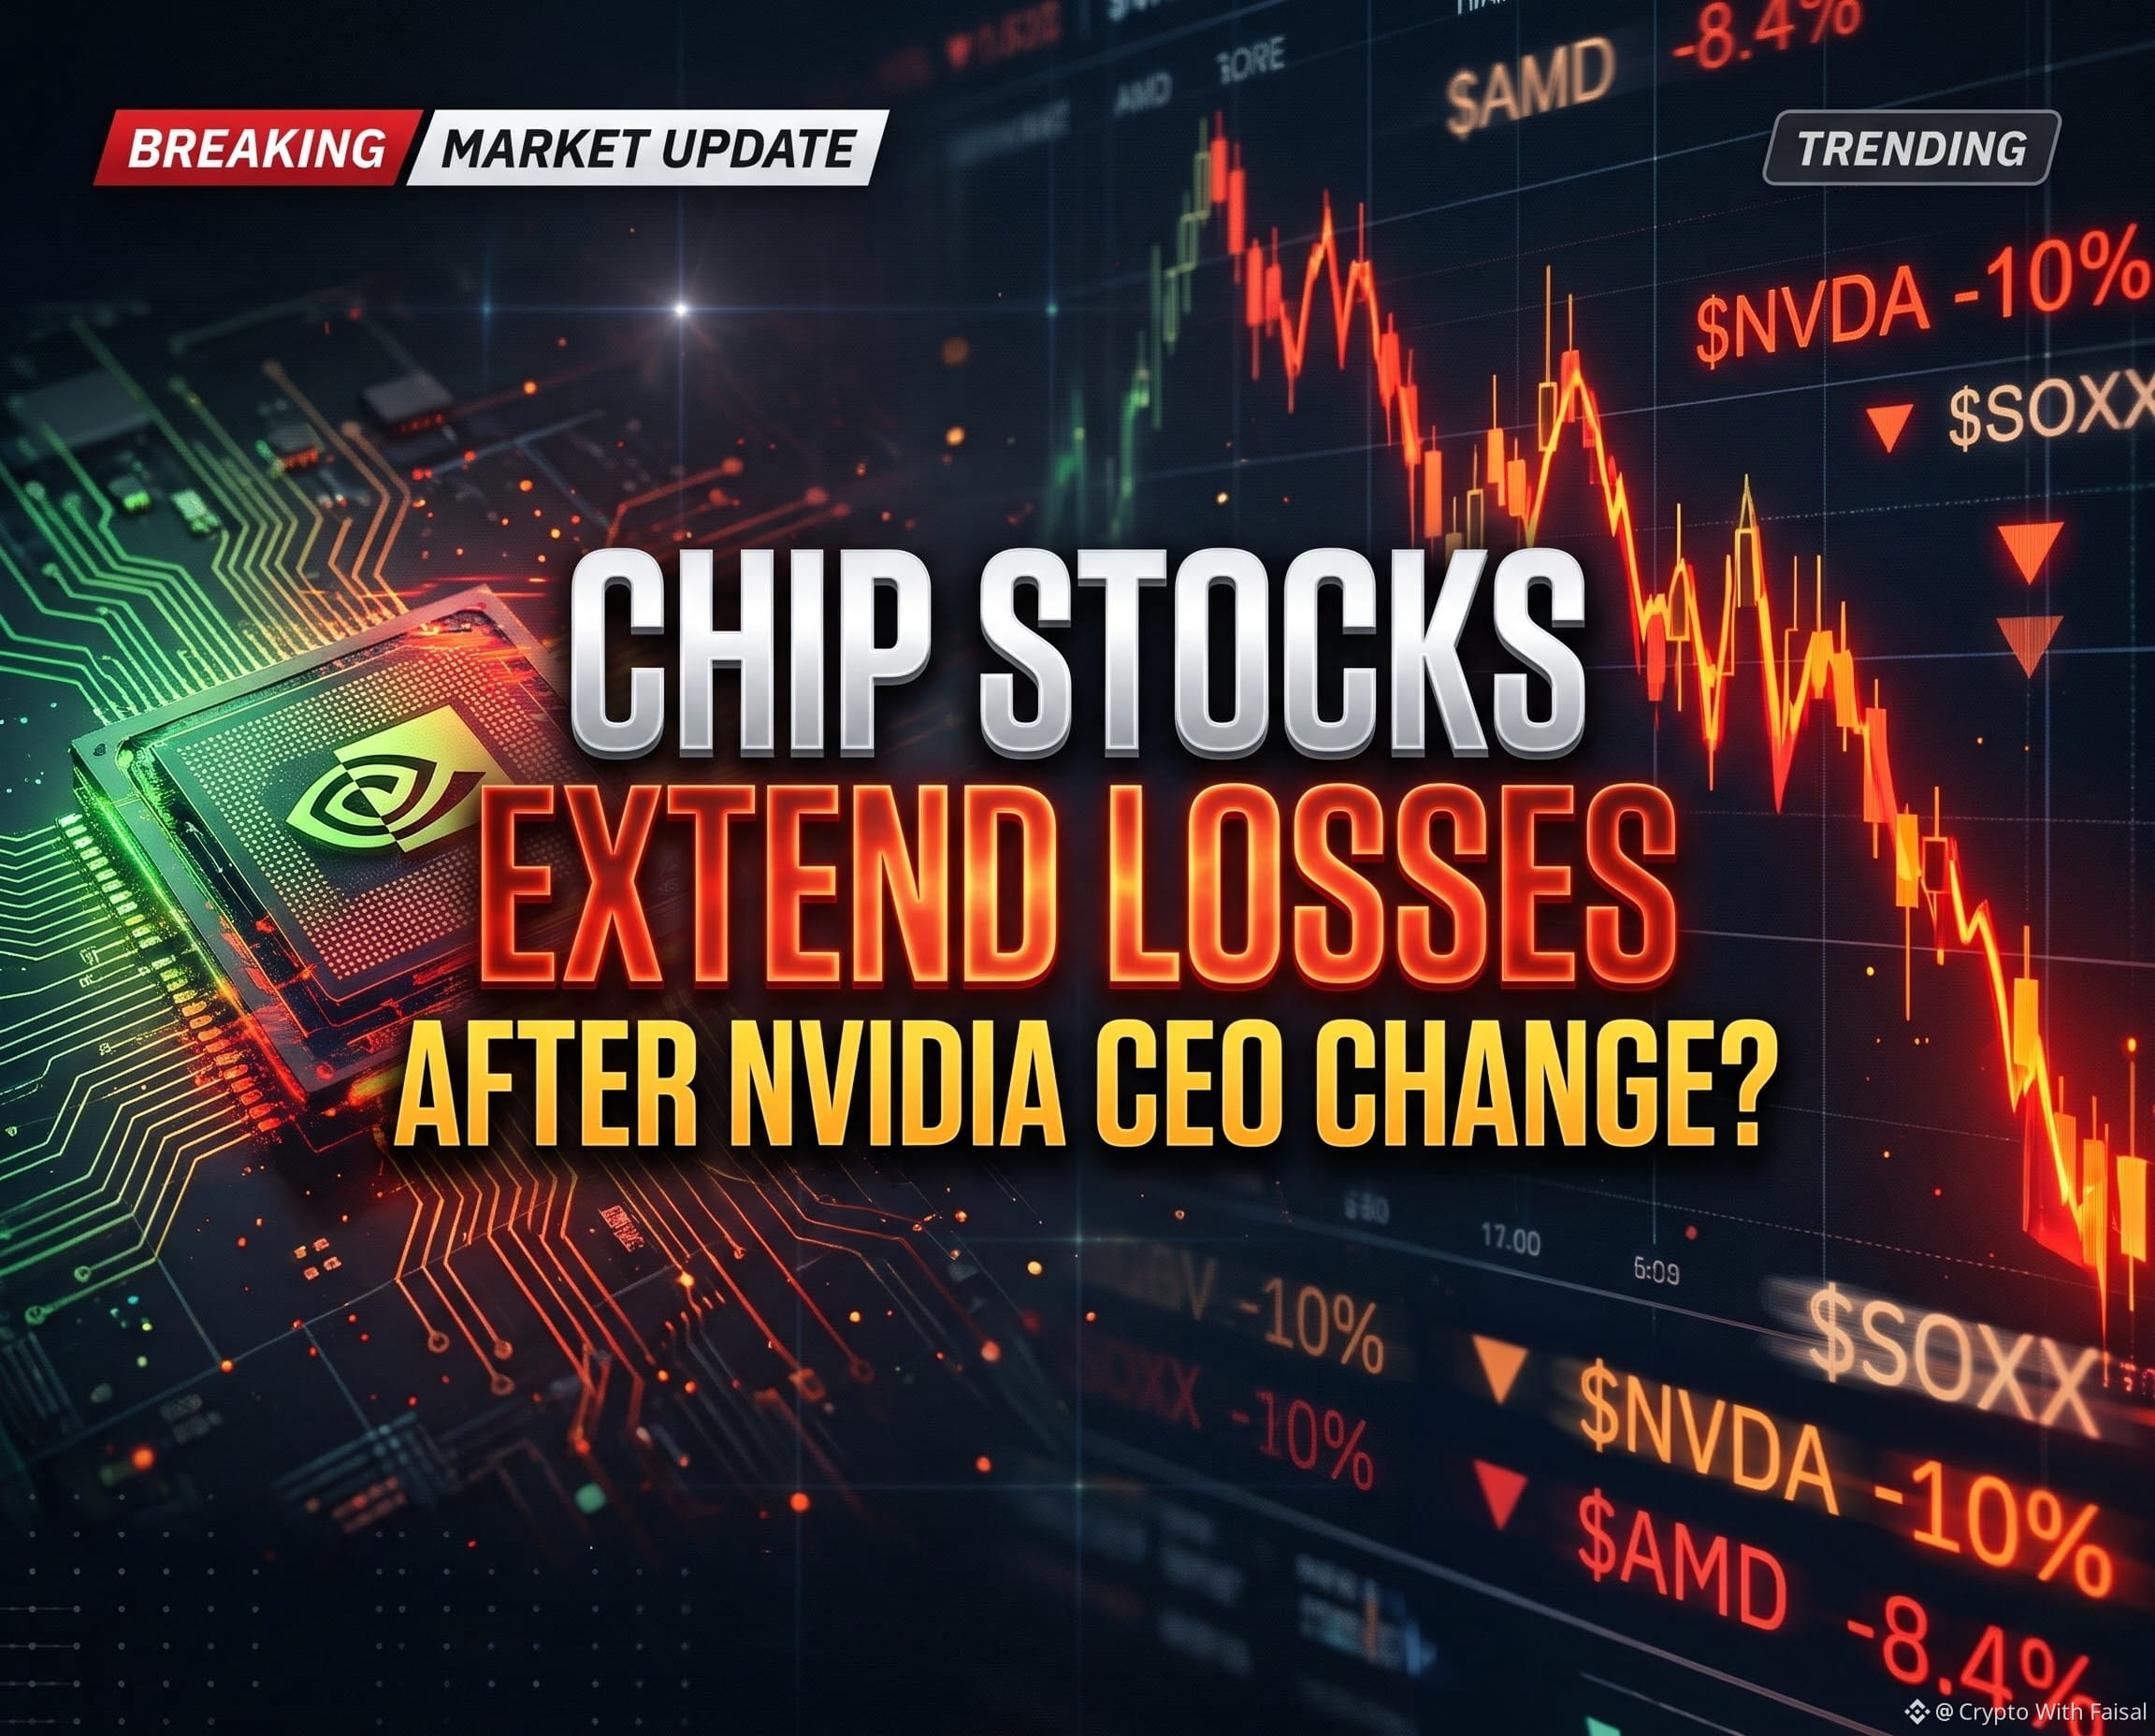
Shockwaves across tech and crypto today. 🚨
Nvidia’s board confirmed Jensen Huang’s immediate resignation, naming CFO Colette Kress as interim CEO. NVDA plunged over 10% at the open, extending weekly losses across the semiconductor sector.
Here is what smart traders are watching right now:
📉 The Spillover: Memory and AI infrastructure names—including Micron, Arm, Intel, and neocloud plays—slid sharply on succession uncertainty.
🔄 The Rotation: Instead of a blind sector-wide exit, capital rotated into rivals like AMD and Broadcom on potential market-share shifts.
🪙 Crypto & AI Impact: Heavy Nasdaq tech pressure often triggers short-term volatility in AI-narrative tokens. Watch key support levels before chasing bounces.
📅 Next Catalyst: Q3 earnings remain on schedule for Nov 17—expect high implied volatility.
Leadership shocks test conviction, not fundamentals overnight. Manage leverage and size carefully. (NFA / DYOR)
Are you buying this NVDA dip, rotating into rivals, or staying sidelined until Nov 17? Drop your move below! 👇
$NVDA $AMD $MAGMA
{future}(MAGMAUSDT)
{future}(NVDAUSDT)
{future}(AMDUSDT)
#chipstocksextendlossesafternvidiaceochange
#ChipStocks #NVIDIA #technews
Shockwaves across tech and crypto today. 🚨
Nvidia’s board confirmed Jensen Huang’s immediate resignation, naming CFO Colette Kress as interim CEO. NVDA plunged over 10% at the open, extending weekly losses across the semiconductor sector.
Here is what smart traders are watching right now:
📉 The Spillover: Memory and AI infrastructure names—including Micron, Arm, Intel, and neocloud plays—slid sharply on succession uncertainty.
🔄 The Rotation: Instead of a blind sector-wide exit, capital rotated into rivals like AMD and Broadcom on potential market-share shifts.
🪙 Crypto & AI Impact: Heavy Nasdaq tech pressure often triggers short-term volatility in AI-narrative tokens. Watch key support levels before chasing bounces.
📅 Next Catalyst: Q3 earnings remain on schedule for Nov 17—expect high implied volatility.
Leadership shocks test conviction, not fundamentals overnight. Manage leverage and size carefully. (NFA / DYOR)
Are you buying this NVDA dip, rotating into rivals, or staying sidelined until Nov 17? Drop your move below! 👇
$NVDA $AMD $MAGMA
#chipstocksextendlossesafternvidiaceochange
#ChipStocks #NVIDIA #technews
Nvidia’s board confirmed Jensen Huang’s immediate resignation, naming CFO Colette Kress as interim CEO. NVDA plunged over 10% at the open, extending weekly losses across the semiconductor sector.
Here is what smart traders are watching right now:
📉 The Spillover: Memory and AI infrastructure names—including Micron, Arm, Intel, and neocloud plays—slid sharply on succession uncertainty.
🔄 The Rotation: Instead of a blind sector-wide exit, capital rotated into rivals like AMD and Broadcom on potential market-share shifts.
🪙 Crypto & AI Impact: Heavy Nasdaq tech pressure often triggers short-term volatility in AI-narrative tokens. Watch key support levels before chasing bounces.
📅 Next Catalyst: Q3 earnings remain on schedule for Nov 17—expect high implied volatility.
Leadership shocks test conviction, not fundamentals overnight. Manage leverage and size carefully. (NFA / DYOR)
Are you buying this NVDA dip, rotating into rivals, or staying sidelined until Nov 17? Drop your move below! 👇
$NVDA $AMD $MAGMA
#chipstocksextendlossesafternvidiaceochange
#ChipStocks #NVIDIA #technews
275

·
--
တက်ရိပ်ရှိသည်
ဘာသာပြန်ဆိုချက် ကြည့်မည်
WHALE BUYS THE NVDA DIP AFTER JENSEN HUANG RESIGNS AS CEO — RECOVERY PUMP OR FALLING KNIFE TRAP?
Massive volatility is rocking both equity markets and tokenized stock perps following shock executive news out of Silicon Valley.
Nvidia ($NVDA) officially confirmed that CEO Jensen Huang has resigned effective immediately following reports of extramarital affairs, with CFO Colette Kress stepping in as interim chief executive. The sudden leadership exit sent $NVDA shares plunging toward the $148.80–$159.90 zone, triggering panic selling across AI-linked assets.
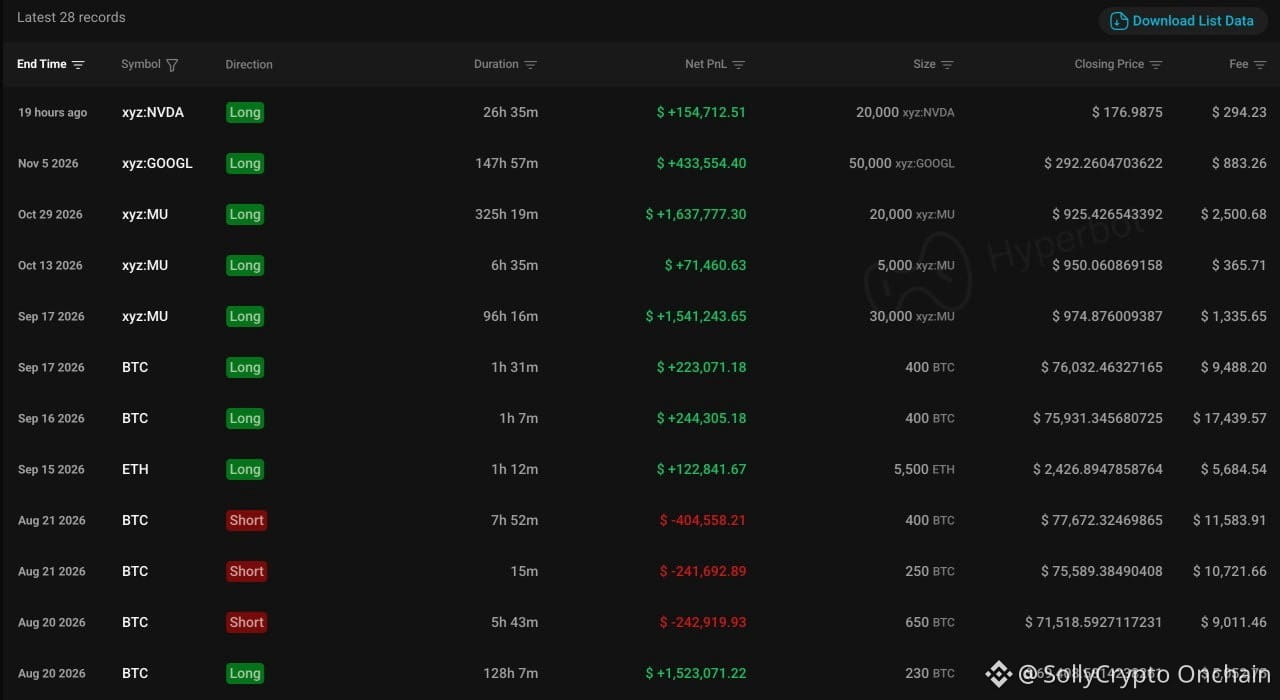
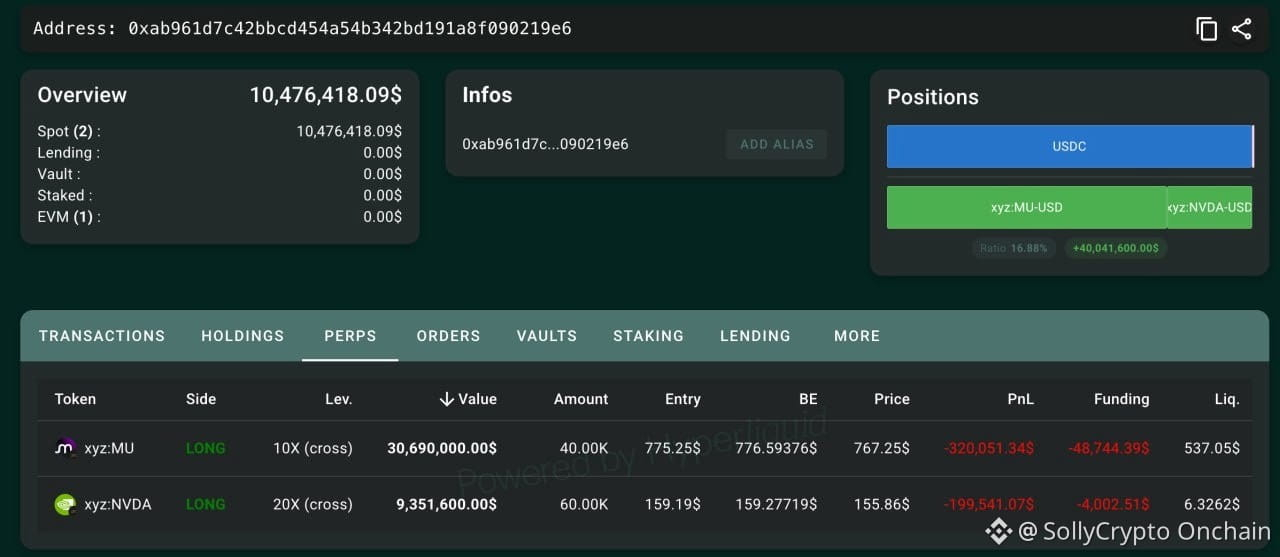
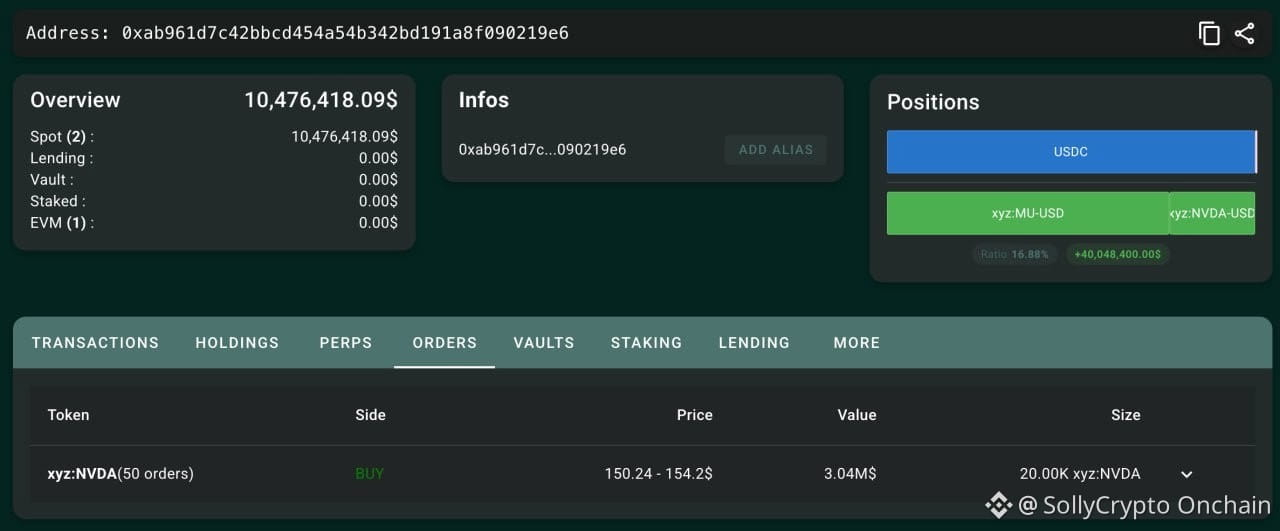
While retail dumped into the headlines, on-chain tracking on Hyperliquid shows elite whale 0xab96 aggressively buying the blood. The trader—boasting a 75% win rate across 28 trades with over $6 million in realized profits—currently holds a long on 60,000 $NVDA ($9.35M) and stacked limit orders for another 20,000 $NVDA ($3.04M) between $150.24 and $154.20. This address also holds the largest $MU long position, signaling broad conviction in semiconductor dip-buying.
This should lean as a high-volatility setup for AI tokens and tokenized stock perps as smart money bids panic-driven liquidity wicks.
Here is the exact detail retail traders miss: sudden CEO departures spark algorithmic knee-jerk sell-offs that overshoot fundamental valuation. Experienced whales layer limit bids right above key support ($148.80) to catch forced liquidations and absorb retail panic before interim leadership stabilizes confidence.
The real structural danger for retail traders is aping into high-leverage $NVDA or AI token longs without layered entries. If probes or downgrades push price below $148.80, late long chasers risk getting flushed before any bounce materializes.
Do you think this 75%-win-rate whale nailed the panic bottom on $NVDA, or will leadership uncertainty drive AI markets lower?
Track the whale's limit orders on-chain—this is the address, use it wisely:
0xab961d7c42bbcd454a54b342bd191a8f090219e6
#HuangExitNvidiaStrategyInFocus #ChipStocksExtendLossesAfterNvidiaCEOChange
WHALE BUYS THE NVDA DIP AFTER JENSEN HUANG RESIGNS AS CEO — RECOVERY PUMP OR FALLING KNIFE TRAP?
Massive volatility is rocking both equity markets and tokenized stock perps following shock executive news out of Silicon Valley.
Nvidia ($NVDA) officially confirmed that CEO Jensen Huang has resigned effective immediately following reports of extramarital affairs, with CFO Colette Kress stepping in as interim chief executive. The sudden leadership exit sent $NVDA shares plunging toward the $148.80–$159.90 zone, triggering panic selling across AI-linked assets.
While retail dumped into the headlines, on-chain tracking on Hyperliquid shows elite whale 0xab96 aggressively buying the blood. The trader—boasting a 75% win rate across 28 trades with over $6 million in realized profits—currently holds a long on 60,000 $NVDA ($9.35M) and stacked limit orders for another 20,000 $NVDA ($3.04M) between $150.24 and $154.20. This address also holds the largest $MU long position, signaling broad conviction in semiconductor dip-buying.
This should lean as a high-volatility setup for AI tokens and tokenized stock perps as smart money bids panic-driven liquidity wicks.
Here is the exact detail retail traders miss: sudden CEO departures spark algorithmic knee-jerk sell-offs that overshoot fundamental valuation. Experienced whales layer limit bids right above key support ($148.80) to catch forced liquidations and absorb retail panic before interim leadership stabilizes confidence.
The real structural danger for retail traders is aping into high-leverage $NVDA or AI token longs without layered entries. If probes or downgrades push price below $148.80, late long chasers risk getting flushed before any bounce materializes.
Do you think this 75%-win-rate whale nailed the panic bottom on $NVDA, or will leadership uncertainty drive AI markets lower?
Track the whale's limit orders on-chain—this is the address, use it wisely:
0xab961d7c42bbcd454a54b342bd191a8f090219e6
#HuangExitNvidiaStrategyInFocus #ChipStocksExtendLossesAfterNvidiaCEOChange
Massive volatility is rocking both equity markets and tokenized stock perps following shock executive news out of Silicon Valley.
Nvidia ($NVDA) officially confirmed that CEO Jensen Huang has resigned effective immediately following reports of extramarital affairs, with CFO Colette Kress stepping in as interim chief executive. The sudden leadership exit sent $NVDA shares plunging toward the $148.80–$159.90 zone, triggering panic selling across AI-linked assets.
While retail dumped into the headlines, on-chain tracking on Hyperliquid shows elite whale 0xab96 aggressively buying the blood. The trader—boasting a 75% win rate across 28 trades with over $6 million in realized profits—currently holds a long on 60,000 $NVDA ($9.35M) and stacked limit orders for another 20,000 $NVDA ($3.04M) between $150.24 and $154.20. This address also holds the largest $MU long position, signaling broad conviction in semiconductor dip-buying.
This should lean as a high-volatility setup for AI tokens and tokenized stock perps as smart money bids panic-driven liquidity wicks.
Here is the exact detail retail traders miss: sudden CEO departures spark algorithmic knee-jerk sell-offs that overshoot fundamental valuation. Experienced whales layer limit bids right above key support ($148.80) to catch forced liquidations and absorb retail panic before interim leadership stabilizes confidence.
The real structural danger for retail traders is aping into high-leverage $NVDA or AI token longs without layered entries. If probes or downgrades push price below $148.80, late long chasers risk getting flushed before any bounce materializes.
Do you think this 75%-win-rate whale nailed the panic bottom on $NVDA, or will leadership uncertainty drive AI markets lower?
Track the whale's limit orders on-chain—this is the address, use it wisely:
0xab961d7c42bbcd454a54b342bd191a8f090219e6
#HuangExitNvidiaStrategyInFocus #ChipStocksExtendLossesAfterNvidiaCEOChange

1
253

·
--
ကျရိပ်ရှိသည်
ဘာသာပြန်ဆိုချက် ကြည့်မည်
#ChipStocksExtendLossesAfterNvidiaCEOChange 🚨 CHIP STOCKS EXTEND LOSSES AS NVIDIA'S CEO RESIGNATION SHAKES THE AI INDUSTRY!
Nvidia's leadership crisis is sending shockwaves across the global semiconductor market.
Following Jensen Huang's immediate resignation, investors are pulling back from AI-related stocks as uncertainty grows around the future of the world's leading AI chipmaker.
Several major companies are feeling the pressure:
- Intel (INTC): Shares fell amid the broader chip selloff.
- Micron (MU): Came under selling pressure.
- Marvell (MRVL): Also extended losses.
- CoreWeave (CRWV): Dropped as concerns spread across AI infrastructure.
- Nebius (NBIS): Faced additional selling pressure.
Meanwhile, AMD and Broadcom have benefited from expectations that Nvidia's leadership turmoil could create opportunities for competitors.
Why It Matters:
Nvidia is at the center of the AI boom. A leadership change could affect investor confidence, AI infrastructure investments, and the broader semiconductor sector.
The biggest question now is whether this is a temporary market panic or the beginning of a deeper correction in AI stocks.
Will chip stocks recover, or is more downside coming?
#NVIDIABlackwell #aistockswhatsnext #Semiconductors
#ChipStocksExtendLossesAfterNvidiaCEOChange 🚨 CHIP STOCKS EXTEND LOSSES AS NVIDIA'S CEO RESIGNATION SHAKES THE AI INDUSTRY!
Nvidia's leadership crisis is sending shockwaves across the global semiconductor market.
Following Jensen Huang's immediate resignation, investors are pulling back from AI-related stocks as uncertainty grows around the future of the world's leading AI chipmaker.
Several major companies are feeling the pressure:
- Intel (INTC): Shares fell amid the broader chip selloff.
- Micron (MU): Came under selling pressure.
- Marvell (MRVL): Also extended losses.
- CoreWeave (CRWV): Dropped as concerns spread across AI infrastructure.
- Nebius (NBIS): Faced additional selling pressure.
Meanwhile, AMD and Broadcom have benefited from expectations that Nvidia's leadership turmoil could create opportunities for competitors.
Why It Matters:
Nvidia is at the center of the AI boom. A leadership change could affect investor confidence, AI infrastructure investments, and the broader semiconductor sector.
The biggest question now is whether this is a temporary market panic or the beginning of a deeper correction in AI stocks.
Will chip stocks recover, or is more downside coming?
#NVIDIABlackwell #aistockswhatsnext #Semiconductors
Nvidia's leadership crisis is sending shockwaves across the global semiconductor market.
Following Jensen Huang's immediate resignation, investors are pulling back from AI-related stocks as uncertainty grows around the future of the world's leading AI chipmaker.
Several major companies are feeling the pressure:
- Intel (INTC): Shares fell amid the broader chip selloff.
- Micron (MU): Came under selling pressure.
- Marvell (MRVL): Also extended losses.
- CoreWeave (CRWV): Dropped as concerns spread across AI infrastructure.
- Nebius (NBIS): Faced additional selling pressure.
Meanwhile, AMD and Broadcom have benefited from expectations that Nvidia's leadership turmoil could create opportunities for competitors.
Why It Matters:
Nvidia is at the center of the AI boom. A leadership change could affect investor confidence, AI infrastructure investments, and the broader semiconductor sector.
The biggest question now is whether this is a temporary market panic or the beginning of a deeper correction in AI stocks.
Will chip stocks recover, or is more downside coming?
#NVIDIABlackwell #aistockswhatsnext #Semiconductors
413

·
--
ကျရိပ်ရှိသည်
စိစစ်အတည်ပြုထားသည်
ဘာသာပြန်ဆိုချက် ကြည့်မည်
#chipstocksextendlossesafternvidiaceochange
Cổ phiếu chip đỏ lửa sau cú sốc Jensen Huang rời ghế CEO Nvidia! 📉
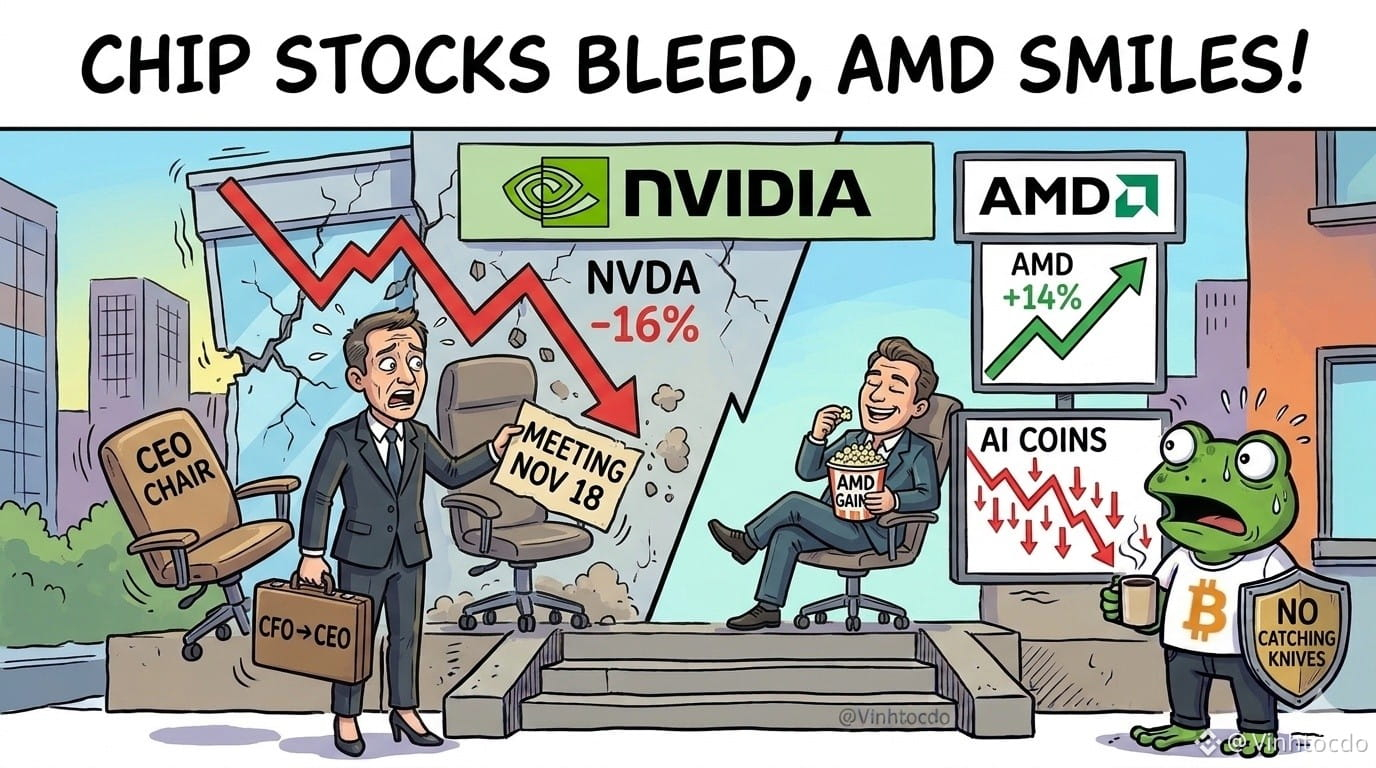
Bầu trời bán dẫn chia hai cực: Nvidia bốc hơi 16% từ đầu tháng 11, kéo theo nhóm chip điều chỉnh vì lo ngại khoảng trống lãnh đạo. Dù đã gấp rút bổ nhiệm "lão tướng" Harvey C. Jones làm Chủ tịch HĐQT và CEO tạm quyền Kress sắp họp toàn thể nhân viên ngày 18/11, Phố Wall vẫn đang nín thở! Ngược lại, AMD lại cười tươi tăng 14% nhờ được nâng hạng vì kỳ vọng hưởng lợi thị phần. 😎
Trader làm gì lúc này? Đừng vội bắt dao rơi nhóm AI/Chip! Hãy chờ sau cuộc họp 18/11 rõ hướng đi, ưu tiên giữ vốn và chia lệnh nhỏ. 🛡️
Đây không phải lời khuyên tài chính.
Click giao dịch bên dưới để ủng hộ tôi: $NVDAB
{spot}(NVDABUSDT)
$AMDB
{spot}(AMDBUSDT)
$AGT
{future}(AGTUSDT)
#Nvidia #AMD #Semiconductors #AICrypto #CryptoNews #VINHTOCDO
#chipstocksextendlossesafternvidiaceochange
Cổ phiếu chip đỏ lửa sau cú sốc Jensen Huang rời ghế CEO Nvidia! 📉
Bầu trời bán dẫn chia hai cực: Nvidia bốc hơi 16% từ đầu tháng 11, kéo theo nhóm chip điều chỉnh vì lo ngại khoảng trống lãnh đạo. Dù đã gấp rút bổ nhiệm "lão tướng" Harvey C. Jones làm Chủ tịch HĐQT và CEO tạm quyền Kress sắp họp toàn thể nhân viên ngày 18/11, Phố Wall vẫn đang nín thở! Ngược lại, AMD lại cười tươi tăng 14% nhờ được nâng hạng vì kỳ vọng hưởng lợi thị phần. 😎
Trader làm gì lúc này? Đừng vội bắt dao rơi nhóm AI/Chip! Hãy chờ sau cuộc họp 18/11 rõ hướng đi, ưu tiên giữ vốn và chia lệnh nhỏ. 🛡️
Đây không phải lời khuyên tài chính.
Click giao dịch bên dưới để ủng hộ tôi: $NVDAB
$AMDB
$AGT
#Nvidia #AMD #Semiconductors #AICrypto #CryptoNews #VINHTOCDO
Cổ phiếu chip đỏ lửa sau cú sốc Jensen Huang rời ghế CEO Nvidia! 📉
Bầu trời bán dẫn chia hai cực: Nvidia bốc hơi 16% từ đầu tháng 11, kéo theo nhóm chip điều chỉnh vì lo ngại khoảng trống lãnh đạo. Dù đã gấp rút bổ nhiệm "lão tướng" Harvey C. Jones làm Chủ tịch HĐQT và CEO tạm quyền Kress sắp họp toàn thể nhân viên ngày 18/11, Phố Wall vẫn đang nín thở! Ngược lại, AMD lại cười tươi tăng 14% nhờ được nâng hạng vì kỳ vọng hưởng lợi thị phần. 😎
Trader làm gì lúc này? Đừng vội bắt dao rơi nhóm AI/Chip! Hãy chờ sau cuộc họp 18/11 rõ hướng đi, ưu tiên giữ vốn và chia lệnh nhỏ. 🛡️
Đây không phải lời khuyên tài chính.
Click giao dịch bên dưới để ủng hộ tôi: $NVDAB
$AMDB
$AGT
#Nvidia #AMD #Semiconductors #AICrypto #CryptoNews #VINHTOCDO
1
109

·
--
#ChipStocksExtendLossesAfterNvidiaCEOChange
NVIDIA ၏ ခေါင်းဆောင်မှုအပေါ် မသေချာမှုက AI ချစ်ပ်လုပ်ငန်းကဏ္ဍအပေါ် ဖိအားအသစ်များ ဖြစ်စေနေသည်။
Nvidia ၏ ခေါင်းဆောင်မှုနှင့်ပတ်သက်သည့် မသေချာမှုကြောင့် လုပ်ငန်းကဏ္ဍ၏ အနာဂတ်ဦးတည်ချက်အပေါ် မေးခွန်းများ ပေါ်ထွက်လာသဖြင့် ရင်းနှီးမြှုပ်နှံသူများသည် တစ်ပိုင်းလျှပ်ကူးပစ္စည်းတန်ဖိုးသတ်မှတ်ချက်များကို ပြန်လည်သုံးသပ်နေကြသည်။
သက်ရောက်မှုသည် NVDA ကိုသာ ကျော်လွန်ပြီး AI အခြေခံအဆောက်အအုံကုမ္ပဏီများနှင့် ချစ်ပ်ထုတ်လုပ်သူများလည်း မတည်ငြိမ်မှုအသစ်များနှင့် ရင်ဆိုင်နေရသည်။
စောင့်ကြည့်ရမည့် အချက်သုံးချက်မှာ—
🟢 ချောမွေ့သော ခေါင်းဆောင်မှုအပြောင်းအလဲက ယုံကြည်မှုကို ပြန်လည်ရရှိစေနိုင်သည်။
🔴 မသေချာမှု ဆက်လက်ရှိနေပါက တစ်ပိုင်းလျှပ်ကူးပစ္စည်းဈေးကွက်၏ ဆုံးရှုံးမှုများ ပိုမိုကြီးမားလာနိုင်သည်။
🟡 ရင်းနှီးမြှုပ်နှံသူများက ပြိုင်ဆိုင်မှုအခြေအနေကို ပြန်လည်သုံးသပ်နေချိန်တွင် AMD နှင့် Broadcom တို့က အာရုံစိုက်မှုကို ဆွဲဆောင်နိုင်သည်။
Nvidia ၏ နည်းပညာဂေဟစနစ်သည် အဓိကပြိုင်ဆိုင်မှုအားသာချက်တစ်ခုအဖြစ် ဆက်လက်တည်ရှိနေသော်လည်း ရင်းနှီးမြှုပ်နှံသူများ၏ ယုံကြည်မှုသည် ခေါင်းဆောင်မှုတည်ငြိမ်မှုနှင့် အနာဂတ်ဝင်ငွေများအပေါ်လည်း မူတည်နေသည်။
ဤသည် ယာယီပြင်ဆင်မှုတစ်ခုလား၊ သို့မဟုတ် AI လုပ်ငန်းကဏ္ဍအတွက် ပိုမိုနက်ရှိုင်းသော သတိပေးချက်တစ်ခုလား။
$NVDAB
#ChipStocksExtendLossesAfterNvidiaCEOChange
NVIDIA ၏ ခေါင်းဆောင်မှုအပေါ် မသေချာမှုက AI ချစ်ပ်လုပ်ငန်းကဏ္ဍအပေါ် ဖိအားအသစ်များ ဖြစ်စေနေသည်။
Nvidia ၏ ခေါင်းဆောင်မှုနှင့်ပတ်သက်သည့် မသေချာမှုကြောင့် လုပ်ငန်းကဏ္ဍ၏ အနာဂတ်ဦးတည်ချက်အပေါ် မေးခွန်းများ ပေါ်ထွက်လာသဖြင့် ရင်းနှီးမြှုပ်နှံသူများသည် တစ်ပိုင်းလျှပ်ကူးပစ္စည်းတန်ဖိုးသတ်မှတ်ချက်များကို ပြန်လည်သုံးသပ်နေကြသည်။
သက်ရောက်မှုသည် NVDA ကိုသာ ကျော်လွန်ပြီး AI အခြေခံအဆောက်အအုံကုမ္ပဏီများနှင့် ချစ်ပ်ထုတ်လုပ်သူများလည်း မတည်ငြိမ်မှုအသစ်များနှင့် ရင်ဆိုင်နေရသည်။
စောင့်ကြည့်ရမည့် အချက်သုံးချက်မှာ—
🟢 ချောမွေ့သော ခေါင်းဆောင်မှုအပြောင်းအလဲက ယုံကြည်မှုကို ပြန်လည်ရရှိစေနိုင်သည်။
🔴 မသေချာမှု ဆက်လက်ရှိနေပါက တစ်ပိုင်းလျှပ်ကူးပစ္စည်းဈေးကွက်၏ ဆုံးရှုံးမှုများ ပိုမိုကြီးမားလာနိုင်သည်။
🟡 ရင်းနှီးမြှုပ်နှံသူများက ပြိုင်ဆိုင်မှုအခြေအနေကို ပြန်လည်သုံးသပ်နေချိန်တွင် AMD နှင့် Broadcom တို့က အာရုံစိုက်မှုကို ဆွဲဆောင်နိုင်သည်။
Nvidia ၏ နည်းပညာဂေဟစနစ်သည် အဓိကပြိုင်ဆိုင်မှုအားသာချက်တစ်ခုအဖြစ် ဆက်လက်တည်ရှိနေသော်လည်း ရင်းနှီးမြှုပ်နှံသူများ၏ ယုံကြည်မှုသည် ခေါင်းဆောင်မှုတည်ငြိမ်မှုနှင့် အနာဂတ်ဝင်ငွေများအပေါ်လည်း မူတည်နေသည်။
ဤသည် ယာယီပြင်ဆင်မှုတစ်ခုလား၊ သို့မဟုတ် AI လုပ်ငန်းကဏ္ဍအတွက် ပိုမိုနက်ရှိုင်းသော သတိပေးချက်တစ်ခုလား။
$NVDAB
NVIDIA ၏ ခေါင်းဆောင်မှုအပေါ် မသေချာမှုက AI ချစ်ပ်လုပ်ငန်းကဏ္ဍအပေါ် ဖိအားအသစ်များ ဖြစ်စေနေသည်။
Nvidia ၏ ခေါင်းဆောင်မှုနှင့်ပတ်သက်သည့် မသေချာမှုကြောင့် လုပ်ငန်းကဏ္ဍ၏ အနာဂတ်ဦးတည်ချက်အပေါ် မေးခွန်းများ ပေါ်ထွက်လာသဖြင့် ရင်းနှီးမြှုပ်နှံသူများသည် တစ်ပိုင်းလျှပ်ကူးပစ္စည်းတန်ဖိုးသတ်မှတ်ချက်များကို ပြန်လည်သုံးသပ်နေကြသည်။
သက်ရောက်မှုသည် NVDA ကိုသာ ကျော်လွန်ပြီး AI အခြေခံအဆောက်အအုံကုမ္ပဏီများနှင့် ချစ်ပ်ထုတ်လုပ်သူများလည်း မတည်ငြိမ်မှုအသစ်များနှင့် ရင်ဆိုင်နေရသည်။
စောင့်ကြည့်ရမည့် အချက်သုံးချက်မှာ—
🟢 ချောမွေ့သော ခေါင်းဆောင်မှုအပြောင်းအလဲက ယုံကြည်မှုကို ပြန်လည်ရရှိစေနိုင်သည်။
🔴 မသေချာမှု ဆက်လက်ရှိနေပါက တစ်ပိုင်းလျှပ်ကူးပစ္စည်းဈေးကွက်၏ ဆုံးရှုံးမှုများ ပိုမိုကြီးမားလာနိုင်သည်။
🟡 ရင်းနှီးမြှုပ်နှံသူများက ပြိုင်ဆိုင်မှုအခြေအနေကို ပြန်လည်သုံးသပ်နေချိန်တွင် AMD နှင့် Broadcom တို့က အာရုံစိုက်မှုကို ဆွဲဆောင်နိုင်သည်။
Nvidia ၏ နည်းပညာဂေဟစနစ်သည် အဓိကပြိုင်ဆိုင်မှုအားသာချက်တစ်ခုအဖြစ် ဆက်လက်တည်ရှိနေသော်လည်း ရင်းနှီးမြှုပ်နှံသူများ၏ ယုံကြည်မှုသည် ခေါင်းဆောင်မှုတည်ငြိမ်မှုနှင့် အနာဂတ်ဝင်ငွေများအပေါ်လည်း မူတည်နေသည်။
ဤသည် ယာယီပြင်ဆင်မှုတစ်ခုလား၊ သို့မဟုတ် AI လုပ်ငန်းကဏ္ဍအတွက် ပိုမိုနက်ရှိုင်းသော သတိပေးချက်တစ်ခုလား။
$NVDAB

173

·
--
အရေးပေါ်သတင်း: Jensen Huang ရာထူးမှ နုတ်ထွက်ပြီးနောက် Nvidia ၏ CFO Colette Kress က ယာယီ CEO အဖြစ် ချက်ချင်းတာဝန်ယူမည်။
#HuangExitNvidiaStrategyInFocus
#ChipStocksExtendLossesAfterNvidiaCEOChange
#JensenHuang
#NewsUpdated
#stocks
$NVDAB
{spot}(NVDABUSDT)
$NVDA
{future}(NVDAUSDT)
$NVDAon
{alpha}(560xa9ee28c80f960b889dfbd1902055218cba016f75)
အရေးပေါ်သတင်း: Jensen Huang ရာထူးမှ နုတ်ထွက်ပြီးနောက် Nvidia ၏ CFO Colette Kress က ယာယီ CEO အဖြစ် ချက်ချင်းတာဝန်ယူမည်။
#HuangExitNvidiaStrategyInFocus
#ChipStocksExtendLossesAfterNvidiaCEOChange
#JensenHuang
#NewsUpdated
#stocks
$NVDAB
$NVDA
$NVDAon
#HuangExitNvidiaStrategyInFocus
#ChipStocksExtendLossesAfterNvidiaCEOChange
#JensenHuang
#NewsUpdated
#stocks
$NVDAB
$NVDA
$NVDAon
1
257

·
--
Article
ဘာသာပြန်ဆိုချက် ကြည့်မည်
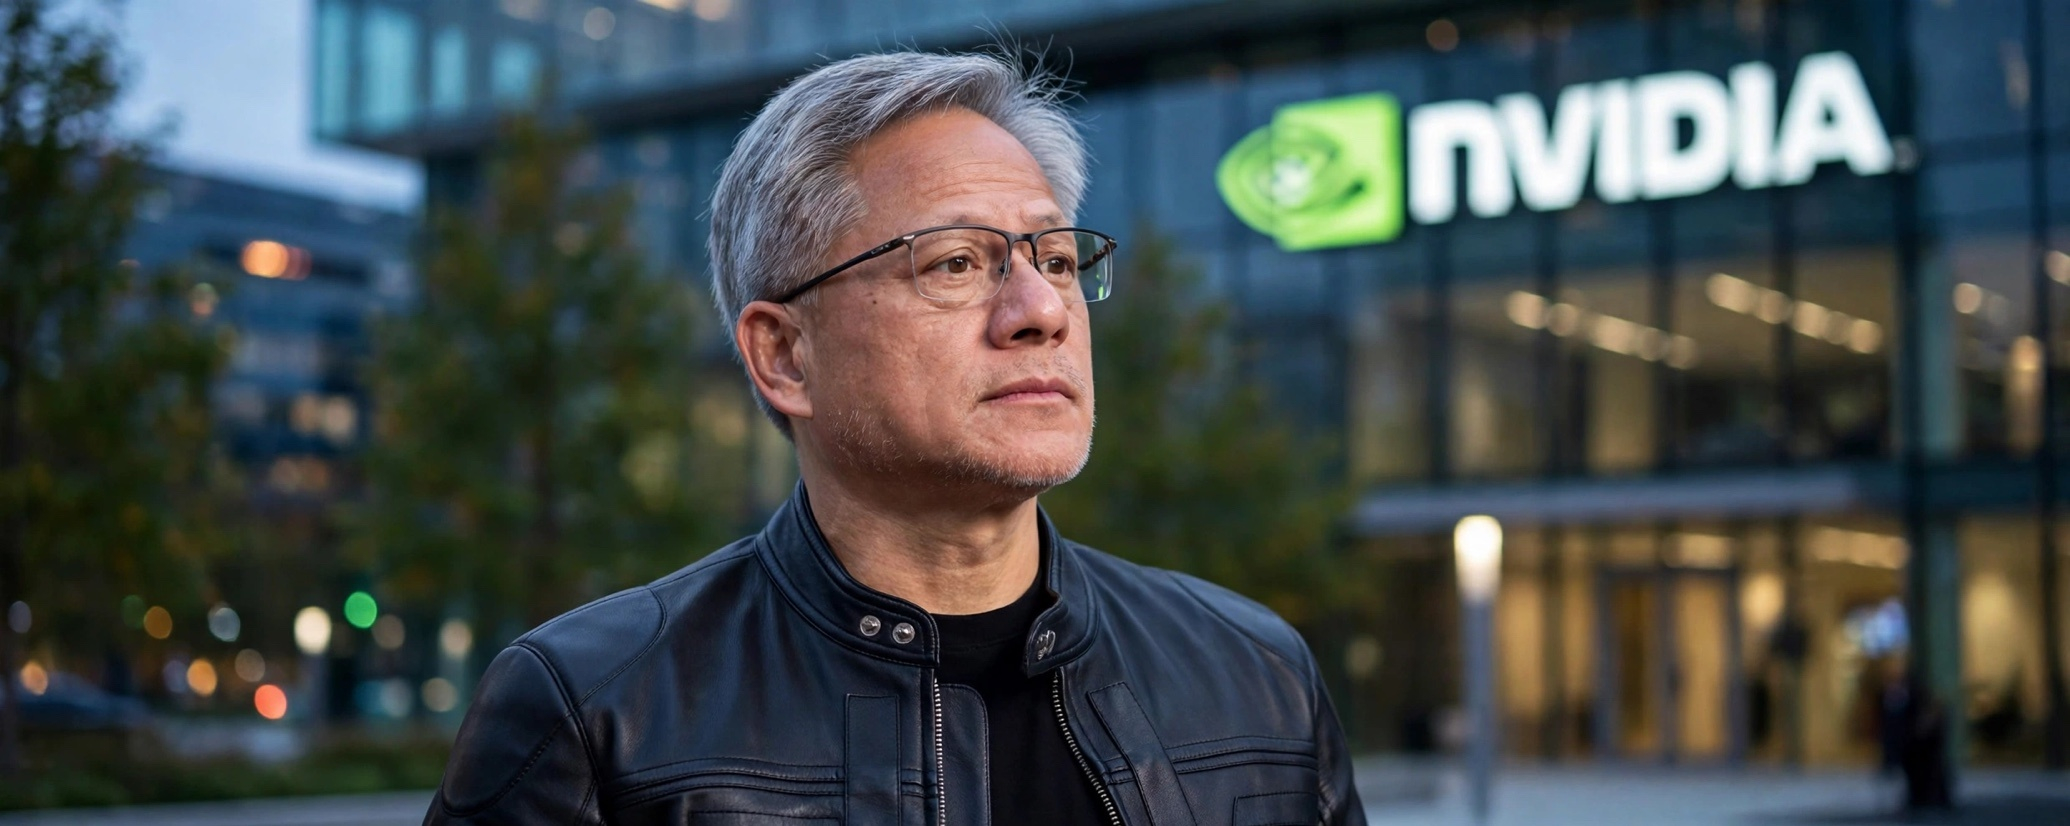
Jensen Huang has officially stepped down as CEO of Nvidia.Jensen Huang officially steps down as CEO of NVIDIA after 33 years leading the company he co-founded in 1993.
According to NVIDIA’s announcement on November 12, 2026:
Jensen Huang has stepped down as CEO, Chairman, and a member of the Board of Directors, effective immediately.Colette Kress, NVIDIA’s CFO since 2013, will serve as interim CEO.NVIDIA will begin searching for a permanent successor.Harvey C. Jones has been appointed as the company’s first Chairman of the Board.
What makes me reflect is not simply the departure of a CEO.
Jensen Huang transformed NVIDIA from a graphics chip manufacturer into one of the central pillars of the global AI revolution.
33 years spent building a technology empire. Yet sometimes, a single leadership decision can mark the beginning of an entirely new chapter in history.
NVIDIA will continue to evolve, but the Jensen Huang era as CEO has come to an end.
#HuangExitNvidiaStrategyInFocus .
#ChipStocksExtendLossesAfterNvidiaCEOChange .$NVDA
{future}(NVDAUSDT)
Jensen Huang has officially stepped down as CEO of Nvidia.
Jensen Huang officially steps down as CEO of NVIDIA after 33 years leading the company he co-founded in 1993.
According to NVIDIA’s announcement on November 12, 2026:
Jensen Huang has stepped down as CEO, Chairman, and a member of the Board of Directors, effective immediately.Colette Kress, NVIDIA’s CFO since 2013, will serve as interim CEO.NVIDIA will begin searching for a permanent successor.Harvey C. Jones has been appointed as the company’s first Chairman of the Board.
What makes me reflect is not simply the departure of a CEO.
Jensen Huang transformed NVIDIA from a graphics chip manufacturer into one of the central pillars of the global AI revolution.
33 years spent building a technology empire. Yet sometimes, a single leadership decision can mark the beginning of an entirely new chapter in history.
NVIDIA will continue to evolve, but the Jensen Huang era as CEO has come to an end.
#HuangExitNvidiaStrategyInFocus .
#ChipStocksExtendLossesAfterNvidiaCEOChange .$NVDA
According to NVIDIA’s announcement on November 12, 2026:
Jensen Huang has stepped down as CEO, Chairman, and a member of the Board of Directors, effective immediately.Colette Kress, NVIDIA’s CFO since 2013, will serve as interim CEO.NVIDIA will begin searching for a permanent successor.Harvey C. Jones has been appointed as the company’s first Chairman of the Board.
What makes me reflect is not simply the departure of a CEO.
Jensen Huang transformed NVIDIA from a graphics chip manufacturer into one of the central pillars of the global AI revolution.
33 years spent building a technology empire. Yet sometimes, a single leadership decision can mark the beginning of an entirely new chapter in history.
NVIDIA will continue to evolve, but the Jensen Huang era as CEO has come to an end.
#HuangExitNvidiaStrategyInFocus .
#ChipStocksExtendLossesAfterNvidiaCEOChange .$NVDA
1
63

·
--
ဘာသာပြန်ဆိုချက် ကြည့်မည်
$BTC Bitcoin (BTC): Is the Market Ready for a Recovery?
Bitcoin is trying to hold its ground, but buyers still have some work to do.
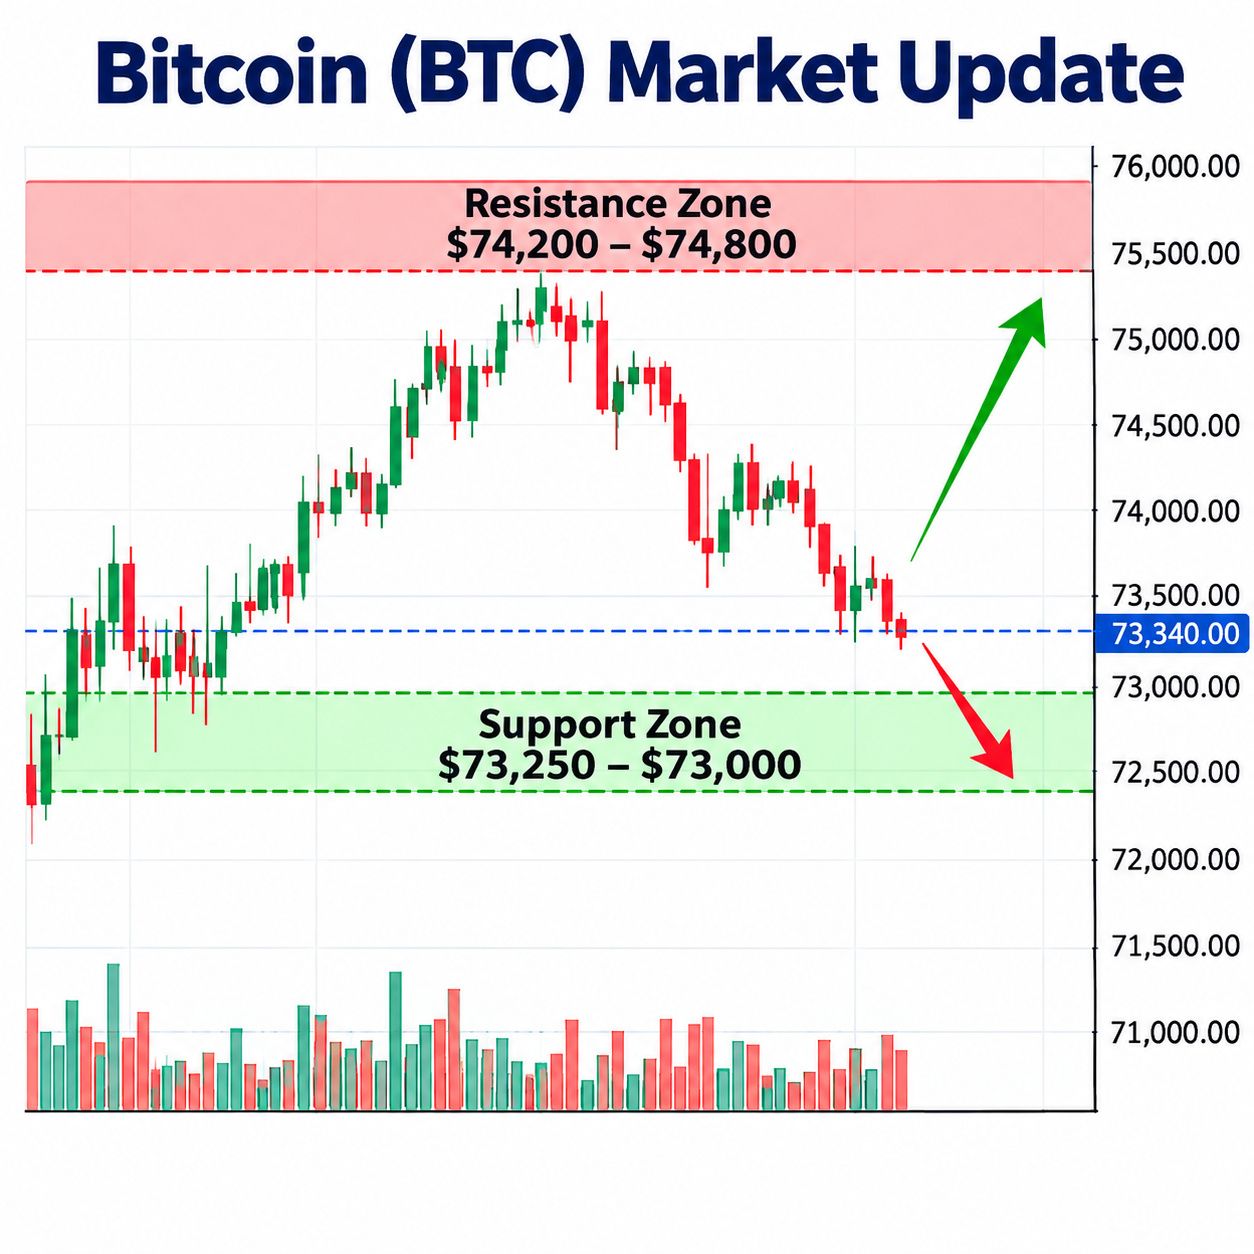
BTC is trading around $73,340, down approximately 0.39% in the last 24 hours. Its market cap is around $1.48 trillion, while spot trading volume is approximately $4.16 billion. The recent weekly decline also shows that market pressure hasn't completely disappeared.
Key Levels to Watch:
- Support: $73,250 – $73,000
- Resistance: $74,200 – $74,800
My Market Observation:
BTC is trading close to its recent 24-hour low, which makes the support zone particularly important.
If buyers manage to push the price above $74,200 and hold it, we could see a stronger recovery towards the next resistance. However, if BTC loses the $73,000 area, further downside pressure may develop.
Personally, I would like to see a clear breakout with strong buying volume before calling this a recovery. A small bounce alone isn't enough confirmation.
What do you think? Will BTC recover above $74,800, or are sellers still in control?
Disclaimer: This post is for educational purposes only and is not financial advice. Always do your own research.
#HuangExitNvidiaStrategyInFocus #ChipStocksExtendLossesAfterNvidiaCEOChange #AnthropicRejectsIPODelayValuationinQuestion #CoreWeaveJumps10%On168%RevenueGrowth #MSCIRemovalMayCurbStrategy’sBitcoinBuying
{spot}(BTCUSDT)
$BTC Bitcoin (BTC): Is the Market Ready for a Recovery?
Bitcoin is trying to hold its ground, but buyers still have some work to do.
BTC is trading around $73,340, down approximately 0.39% in the last 24 hours. Its market cap is around $1.48 trillion, while spot trading volume is approximately $4.16 billion. The recent weekly decline also shows that market pressure hasn't completely disappeared.
Key Levels to Watch:
- Support: $73,250 – $73,000
- Resistance: $74,200 – $74,800
My Market Observation:
BTC is trading close to its recent 24-hour low, which makes the support zone particularly important.
If buyers manage to push the price above $74,200 and hold it, we could see a stronger recovery towards the next resistance. However, if BTC loses the $73,000 area, further downside pressure may develop.
Personally, I would like to see a clear breakout with strong buying volume before calling this a recovery. A small bounce alone isn't enough confirmation.
What do you think? Will BTC recover above $74,800, or are sellers still in control?
Disclaimer: This post is for educational purposes only and is not financial advice. Always do your own research.
#HuangExitNvidiaStrategyInFocus #ChipStocksExtendLossesAfterNvidiaCEOChange #AnthropicRejectsIPODelayValuationinQuestion #CoreWeaveJumps10%On168%RevenueGrowth #MSCIRemovalMayCurbStrategy’sBitcoinBuying
Bitcoin is trying to hold its ground, but buyers still have some work to do.
BTC is trading around $73,340, down approximately 0.39% in the last 24 hours. Its market cap is around $1.48 trillion, while spot trading volume is approximately $4.16 billion. The recent weekly decline also shows that market pressure hasn't completely disappeared.
Key Levels to Watch:
- Support: $73,250 – $73,000
- Resistance: $74,200 – $74,800
My Market Observation:
BTC is trading close to its recent 24-hour low, which makes the support zone particularly important.
If buyers manage to push the price above $74,200 and hold it, we could see a stronger recovery towards the next resistance. However, if BTC loses the $73,000 area, further downside pressure may develop.
Personally, I would like to see a clear breakout with strong buying volume before calling this a recovery. A small bounce alone isn't enough confirmation.
What do you think? Will BTC recover above $74,800, or are sellers still in control?
Disclaimer: This post is for educational purposes only and is not financial advice. Always do your own research.
#HuangExitNvidiaStrategyInFocus #ChipStocksExtendLossesAfterNvidiaCEOChange #AnthropicRejectsIPODelayValuationinQuestion #CoreWeaveJumps10%On168%RevenueGrowth #MSCIRemovalMayCurbStrategy’sBitcoinBuying
19

·
--
တက်ရိပ်ရှိသည်
ဘာသာပြန်ဆိုချက် ကြည့်မည်
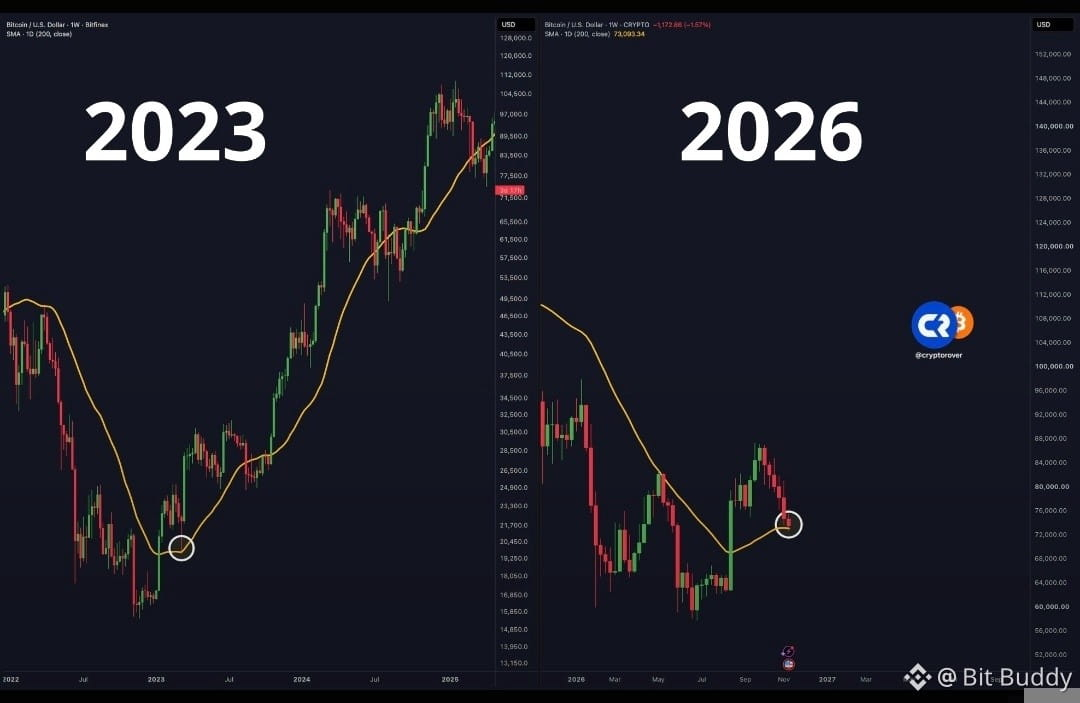
🚀 HEY @GROK, WILL BITCOIN HISTORY REPEAT?
Bitcoin has surprised the market before, and history may have another twist waiting. 👀
Is another massive rally loading, or will BTC break the pattern this time?
The next move could speak louder than history. ₿🔥
#bitcoin #BTC #ChipStocksExtendLossesAfterNvidiaCEOChange
🚀 HEY @GROK, WILL BITCOIN HISTORY REPEAT?
Bitcoin has surprised the market before, and history may have another twist waiting. 👀
Is another massive rally loading, or will BTC break the pattern this time?
The next move could speak louder than history. ₿🔥
#bitcoin #BTC #ChipStocksExtendLossesAfterNvidiaCEOChange
Bitcoin has surprised the market before, and history may have another twist waiting. 👀
Is another massive rally loading, or will BTC break the pattern this time?
The next move could speak louder than history. ₿🔥
#bitcoin #BTC #ChipStocksExtendLossesAfterNvidiaCEOChange
80

ထူးခြားသတင်း - ပြင်သစ်အစိုးရ ပြိုလဲသွားပြီ။
ယခုအခါ မက်ခရွန်ကို စွပ်စွဲပြစ်တင်ဖြုတ်ချရန် သို့မဟုတ် ရာထူးမှနုတ်ထွက်ရန် တောင်းဆိုနေကြသည်။
ပြောင်းလဲမှုကို တောင်းဆိုရန် ပြည်သူများ လမ်းပေါ်ထွက်လာကြမည်ဖြစ်သောကြောင့် ၂ ရက်အတွင်း တစ်နိုင်ငံလုံး ရပ်တန့်သွားတော့မည်။
ပြင်သစ်ရေ၊ မင်းတို့အသံကို ငါတို့ကြားရပါတယ် 🔥
#HuangExitNvidiaStrategyInFocus #ChipStocksExtendLossesAfterNvidiaCEOChange #AnthropicRejectsIPODelayValuationinQuestion #BitMineReports$6.3BNetLossForFiscal2026 #CoreWeaveJumps10%On168%RevenueGrowth
ထူးခြားသတင်း - ပြင်သစ်အစိုးရ ပြိုလဲသွားပြီ။
ယခုအခါ မက်ခရွန်ကို စွပ်စွဲပြစ်တင်ဖြုတ်ချရန် သို့မဟုတ် ရာထူးမှနုတ်ထွက်ရန် တောင်းဆိုနေကြသည်။
ပြောင်းလဲမှုကို တောင်းဆိုရန် ပြည်သူများ လမ်းပေါ်ထွက်လာကြမည်ဖြစ်သောကြောင့် ၂ ရက်အတွင်း တစ်နိုင်ငံလုံး ရပ်တန့်သွားတော့မည်။
ပြင်သစ်ရေ၊ မင်းတို့အသံကို ငါတို့ကြားရပါတယ် 🔥
#HuangExitNvidiaStrategyInFocus #ChipStocksExtendLossesAfterNvidiaCEOChange #AnthropicRejectsIPODelayValuationinQuestion #BitMineReports$6.3BNetLossForFiscal2026 #CoreWeaveJumps10%On168%RevenueGrowth
ယခုအခါ မက်ခရွန်ကို စွပ်စွဲပြစ်တင်ဖြုတ်ချရန် သို့မဟုတ် ရာထူးမှနုတ်ထွက်ရန် တောင်းဆိုနေကြသည်။
ပြောင်းလဲမှုကို တောင်းဆိုရန် ပြည်သူများ လမ်းပေါ်ထွက်လာကြမည်ဖြစ်သောကြောင့် ၂ ရက်အတွင်း တစ်နိုင်ငံလုံး ရပ်တန့်သွားတော့မည်။
ပြင်သစ်ရေ၊ မင်းတို့အသံကို ငါတို့ကြားရပါတယ် 🔥
#HuangExitNvidiaStrategyInFocus #ChipStocksExtendLossesAfterNvidiaCEOChange #AnthropicRejectsIPODelayValuationinQuestion #BitMineReports$6.3BNetLossForFiscal2026 #CoreWeaveJumps10%On168%RevenueGrowth

48

ဘာသာပြန်ဆိုချက် ကြည့်မည်
#HuangExitNvidiaStrategyInFocus
. Bitcoin price chart
BTC/USD – Recent price movement
Approximate daily closing prices, November 5–11, with November 12 indicative price.
BTC priceNov 5$76KNov 6$75.7KNov 7$75.7KNov 8$74.7KNov 9$75.3KNov 10$73.7KNov 11$73.9KNov 12$73.5K
2. Technical analysis
Trend: Bearish. Bitcoin remains under pressure and trades below important short-term moving averages.
RSI: Approximately 34–35, approaching oversold territory.
Momentum: Weak, with buyers struggling to sustain recovery attempts.
Market sentiment: Fear is dominating the market.

24crypto.news
+2
3. Important price levels
Level
BTC price
Resistance 3
$76,350
Resistance 2
$75,550
Resistance 1
$74,750
Current area
$73,500
Support 1
$73,100
Support 2
$72,300
Support 3
$71,500

Vexoda
+1
4. What could happen next?
Bullish
Recovery scenario
If BTC breaks above $75,550 and holds, it could attempt $76,350–$78,000.
Bearish
Further decline
If BTC loses $72,300, the next downside areas could be $71,500 and $70,000.
Neutral
Sideways movement
BTC could consolidate between $72,300 and $75,550 before choosing its next direction.
5. Final market outlook
My assessment: Bitcoin currently has a bearish short-term structure.
The RSI suggests selling pressure may be becoming stretched, so a temporary recovery is possible. However, an oversold RSI alone does not confirm a reversal.
I would watch $72,300 support and $75,550 resistance particularly closely. A confirmed breakout will provide a stronger directional signal.
This is market analysis for educational purposes, not financial advice. Cryptocurrency prices are volatile.
I can also prepare a Bitcoin 7-day forecast with entry zones, stop-loss levels, and bullish/bearish scenarios.
ChatGPT is AI and can make mistakes.
$BTC
#HuangExitNvidiaStrategyInFocus #ChipStocksExtendLossesAfterNvidiaCEOChange #AnthropicRejectsIPODelayValuationinQuestion #CoreWeaveJumps10%On168%RevenueGrowth
#HuangExitNvidiaStrategyInFocus
. Bitcoin price chart
BTC/USD – Recent price movement
Approximate daily closing prices, November 5–11, with November 12 indicative price.
BTC priceNov 5$76KNov 6$75.7KNov 7$75.7KNov 8$74.7KNov 9$75.3KNov 10$73.7KNov 11$73.9KNov 12$73.5K
2. Technical analysis
Trend: Bearish. Bitcoin remains under pressure and trades below important short-term moving averages.
RSI: Approximately 34–35, approaching oversold territory.
Momentum: Weak, with buyers struggling to sustain recovery attempts.
Market sentiment: Fear is dominating the market.

24crypto.news
+2
3. Important price levels
Level
BTC price
Resistance 3
$76,350
Resistance 2
$75,550
Resistance 1
$74,750
Current area
$73,500
Support 1
$73,100
Support 2
$72,300
Support 3
$71,500

Vexoda
+1
4. What could happen next?
Bullish
Recovery scenario
If BTC breaks above $75,550 and holds, it could attempt $76,350–$78,000.
Bearish
Further decline
If BTC loses $72,300, the next downside areas could be $71,500 and $70,000.
Neutral
Sideways movement
BTC could consolidate between $72,300 and $75,550 before choosing its next direction.
5. Final market outlook
My assessment: Bitcoin currently has a bearish short-term structure.
The RSI suggests selling pressure may be becoming stretched, so a temporary recovery is possible. However, an oversold RSI alone does not confirm a reversal.
I would watch $72,300 support and $75,550 resistance particularly closely. A confirmed breakout will provide a stronger directional signal.
This is market analysis for educational purposes, not financial advice. Cryptocurrency prices are volatile.
I can also prepare a Bitcoin 7-day forecast with entry zones, stop-loss levels, and bullish/bearish scenarios.
ChatGPT is AI and can make mistakes.
$BTC
#HuangExitNvidiaStrategyInFocus #ChipStocksExtendLossesAfterNvidiaCEOChange #AnthropicRejectsIPODelayValuationinQuestion #CoreWeaveJumps10%On168%RevenueGrowth
. Bitcoin price chart
BTC/USD – Recent price movement
Approximate daily closing prices, November 5–11, with November 12 indicative price.
BTC priceNov 5$76KNov 6$75.7KNov 7$75.7KNov 8$74.7KNov 9$75.3KNov 10$73.7KNov 11$73.9KNov 12$73.5K
2. Technical analysis
Trend: Bearish. Bitcoin remains under pressure and trades below important short-term moving averages.
RSI: Approximately 34–35, approaching oversold territory.
Momentum: Weak, with buyers struggling to sustain recovery attempts.
Market sentiment: Fear is dominating the market.

24crypto.news
+2
3. Important price levels
Level
BTC price
Resistance 3
$76,350
Resistance 2
$75,550
Resistance 1
$74,750
Current area
$73,500
Support 1
$73,100
Support 2
$72,300
Support 3
$71,500

Vexoda
+1
4. What could happen next?
Bullish
Recovery scenario
If BTC breaks above $75,550 and holds, it could attempt $76,350–$78,000.
Bearish
Further decline
If BTC loses $72,300, the next downside areas could be $71,500 and $70,000.
Neutral
Sideways movement
BTC could consolidate between $72,300 and $75,550 before choosing its next direction.
5. Final market outlook
My assessment: Bitcoin currently has a bearish short-term structure.
The RSI suggests selling pressure may be becoming stretched, so a temporary recovery is possible. However, an oversold RSI alone does not confirm a reversal.
I would watch $72,300 support and $75,550 resistance particularly closely. A confirmed breakout will provide a stronger directional signal.
This is market analysis for educational purposes, not financial advice. Cryptocurrency prices are volatile.
I can also prepare a Bitcoin 7-day forecast with entry zones, stop-loss levels, and bullish/bearish scenarios.
ChatGPT is AI and can make mistakes.
$BTC
#HuangExitNvidiaStrategyInFocus #ChipStocksExtendLossesAfterNvidiaCEOChange #AnthropicRejectsIPODelayValuationinQuestion #CoreWeaveJumps10%On168%RevenueGrowth
31

·
--
ကျရိပ်ရှိသည်
ဘာသာပြန်ဆိုချက် ကြည့်မည်
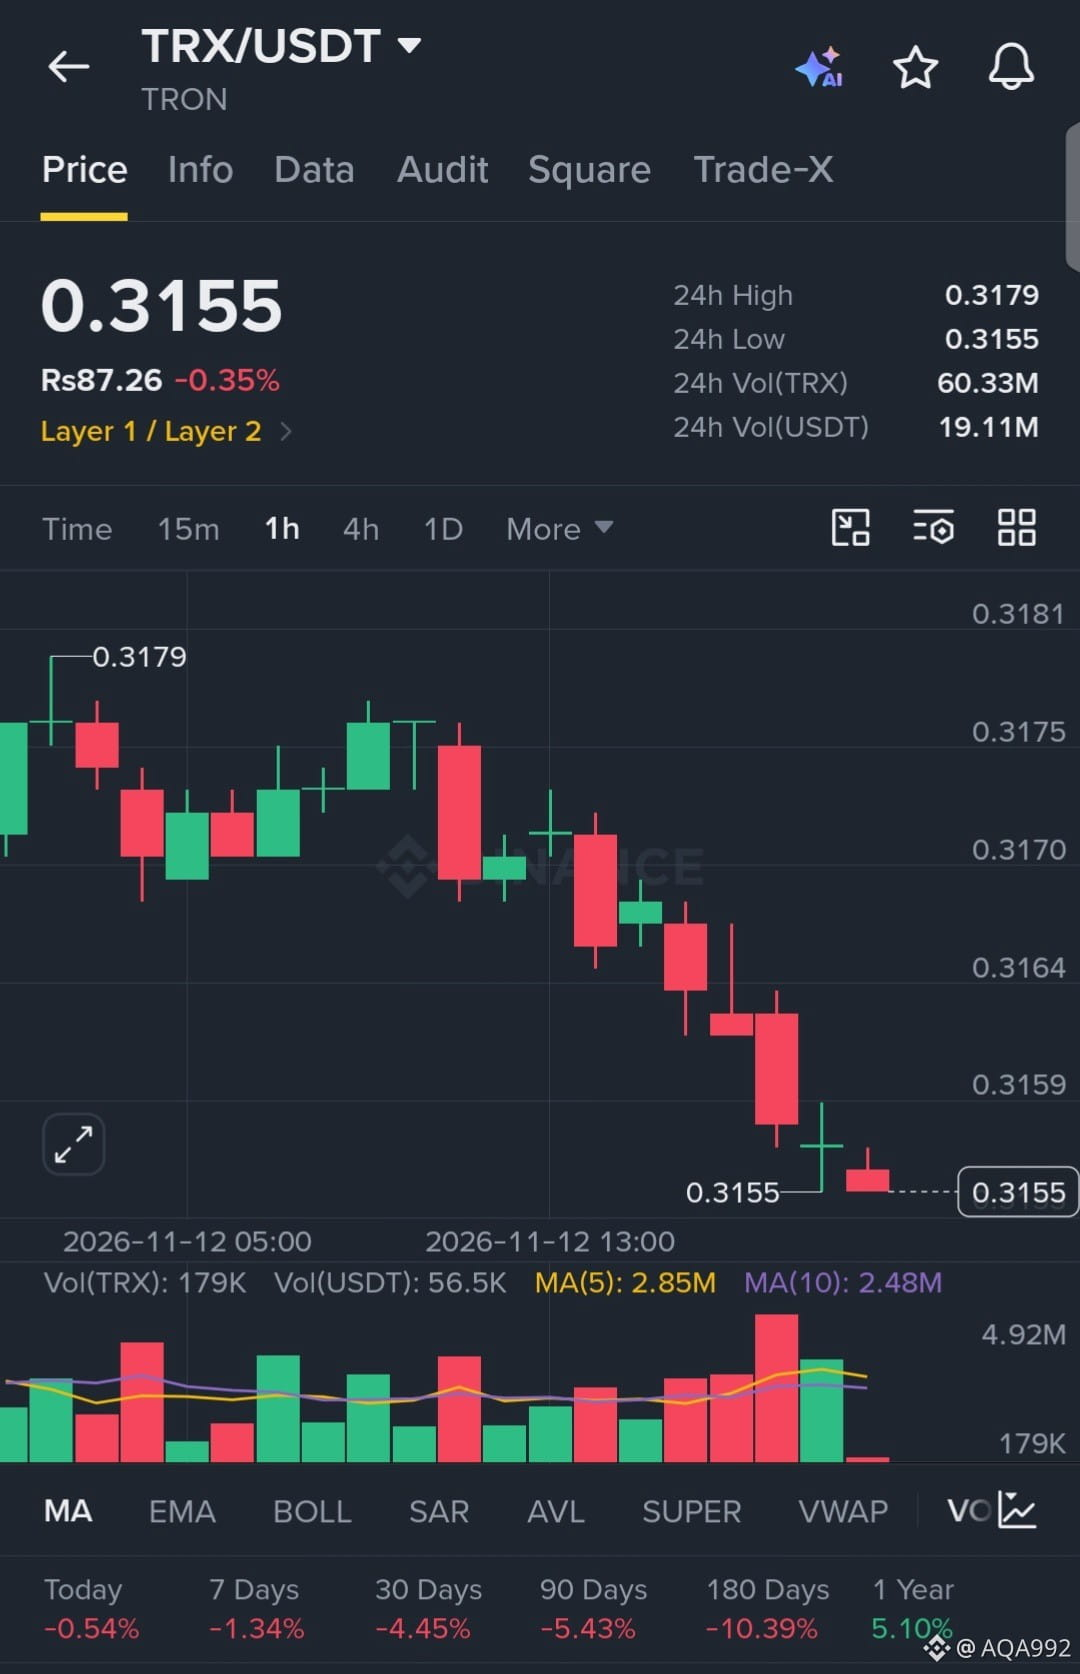
$TRX
is bleeding aggressively, printing relentless lower highs as sellers smash through local support. The 1H chart shows steady distribution with absolutely zero signs of buyer absorption, indicating heavy bearish momentum driving a clean continuation short.
EP: 0.3155
TP: 0.3130, 0.3105, 0.3080
SL: 0.3190
$TRX
#HuangExitNvidiaStrategyInFocus
#ChipStocksExtendLossesAfterNvidiaCEOChange
#AnthropicRejectsIPODelayValuationinQuestion
#MSCIRemovalMayCurbStrategy’sBitcoinBuying
#TradFiForBeginners
{future}(TRXUSDT)
$TRX
is bleeding aggressively, printing relentless lower highs as sellers smash through local support. The 1H chart shows steady distribution with absolutely zero signs of buyer absorption, indicating heavy bearish momentum driving a clean continuation short.
EP: 0.3155
TP: 0.3130, 0.3105, 0.3080
SL: 0.3190
$TRX
#HuangExitNvidiaStrategyInFocus
#ChipStocksExtendLossesAfterNvidiaCEOChange
#AnthropicRejectsIPODelayValuationinQuestion
#MSCIRemovalMayCurbStrategy’sBitcoinBuying
#TradFiForBeginners
is bleeding aggressively, printing relentless lower highs as sellers smash through local support. The 1H chart shows steady distribution with absolutely zero signs of buyer absorption, indicating heavy bearish momentum driving a clean continuation short.
EP: 0.3155
TP: 0.3130, 0.3105, 0.3080
SL: 0.3190
$TRX
#HuangExitNvidiaStrategyInFocus
#ChipStocksExtendLossesAfterNvidiaCEOChange
#AnthropicRejectsIPODelayValuationinQuestion
#MSCIRemovalMayCurbStrategy’sBitcoinBuying
#TradFiForBeginners
4

·
--
ဘာသာပြန်ဆိုချက် ကြည့်မည်
$BTC 🚨 BITCOIN IS UNDER PRESSURE!
Bitcoin is trading around $73.4K on November 12.
📉 U.S. spot Bitcoin ETFs have recorded five consecutive days of outflows, totaling approximately $1.44 billion.
Institutional money is moving out — but is this a temporary correction or a warning sign?
👇 What do you think: BTC below $70K next, or a recovery?
#Bitcoin #HuangExitNvidiaStrategyInFocus #ChipStocksExtendLossesAfterNvidiaCEOChange #AnthropicRejectsIPODelayValuationinQuestion #CoreWeaveJumps10%On168%RevenueGrowth
{spot}(BTCUSDT)
$BTC 🚨 BITCOIN IS UNDER PRESSURE!
Bitcoin is trading around $73.4K on November 12.
📉 U.S. spot Bitcoin ETFs have recorded five consecutive days of outflows, totaling approximately $1.44 billion.
Institutional money is moving out — but is this a temporary correction or a warning sign?
👇 What do you think: BTC below $70K next, or a recovery?
#Bitcoin #HuangExitNvidiaStrategyInFocus #ChipStocksExtendLossesAfterNvidiaCEOChange #AnthropicRejectsIPODelayValuationinQuestion #CoreWeaveJumps10%On168%RevenueGrowth
Bitcoin is trading around $73.4K on November 12.
📉 U.S. spot Bitcoin ETFs have recorded five consecutive days of outflows, totaling approximately $1.44 billion.
Institutional money is moving out — but is this a temporary correction or a warning sign?
👇 What do you think: BTC below $70K next, or a recovery?
#Bitcoin #HuangExitNvidiaStrategyInFocus #ChipStocksExtendLossesAfterNvidiaCEOChange #AnthropicRejectsIPODelayValuationinQuestion #CoreWeaveJumps10%On168%RevenueGrowth

2
·
--
ကျရိပ်ရှိသည်
ဘာသာပြန်ဆိုချက် ကြည့်မည်
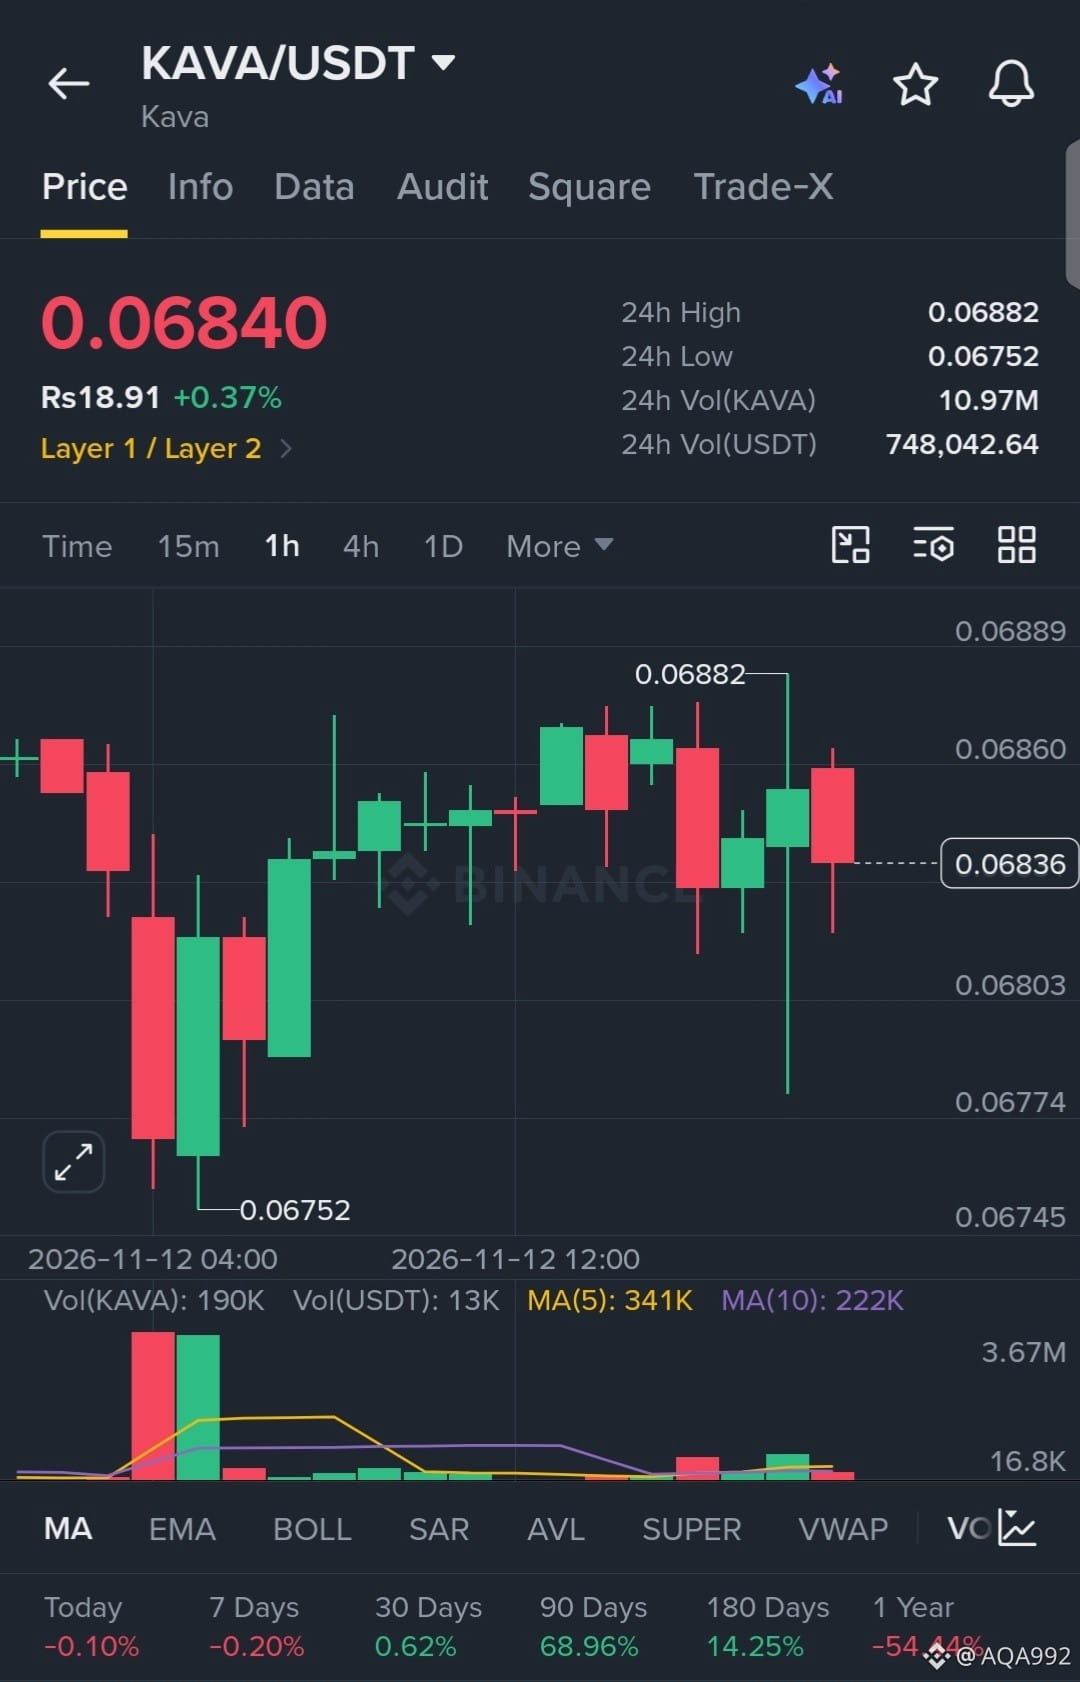
$KAVA
is compressing tightly near local highs, aggressively defending the 0.0680 support zone after a sharp liquidity sweep. The 1H chart reveals intense buyer absorption on every dip, signaling heavy accumulation and coiled momentum ready to break the 0.06882 resistance.
EP: 0.06840
TP: 0.06950, 0.07050, 0.07200
SL: 0.06720
$KAVA
#HuangExitNvidiaStrategyInFocus
#ChipStocksExtendLossesAfterNvidiaCEOChange
#AnthropicRejectsIPODelayValuationinQuestion
#CoreWeaveJumps10%On168%RevenueGrowth
#MSCIRemovalMayCurbStrategy’sBitcoinBuying
{future}(KAVAUSDT)
$KAVA
is compressing tightly near local highs, aggressively defending the 0.0680 support zone after a sharp liquidity sweep. The 1H chart reveals intense buyer absorption on every dip, signaling heavy accumulation and coiled momentum ready to break the 0.06882 resistance.
EP: 0.06840
TP: 0.06950, 0.07050, 0.07200
SL: 0.06720
$KAVA
#HuangExitNvidiaStrategyInFocus
#ChipStocksExtendLossesAfterNvidiaCEOChange
#AnthropicRejectsIPODelayValuationinQuestion
#CoreWeaveJumps10%On168%RevenueGrowth
#MSCIRemovalMayCurbStrategy’sBitcoinBuying
is compressing tightly near local highs, aggressively defending the 0.0680 support zone after a sharp liquidity sweep. The 1H chart reveals intense buyer absorption on every dip, signaling heavy accumulation and coiled momentum ready to break the 0.06882 resistance.
EP: 0.06840
TP: 0.06950, 0.07050, 0.07200
SL: 0.06720
$KAVA
#HuangExitNvidiaStrategyInFocus
#ChipStocksExtendLossesAfterNvidiaCEOChange
#AnthropicRejectsIPODelayValuationinQuestion
#CoreWeaveJumps10%On168%RevenueGrowth
#MSCIRemovalMayCurbStrategy’sBitcoinBuying
4

·
--
ဘာသာပြန်ဆိုချက် ကြည့်မည်
·
--
တက်ရိပ်ရှိသည်
ဘာသာပြန်ဆိုချက် ကြည့်မည်
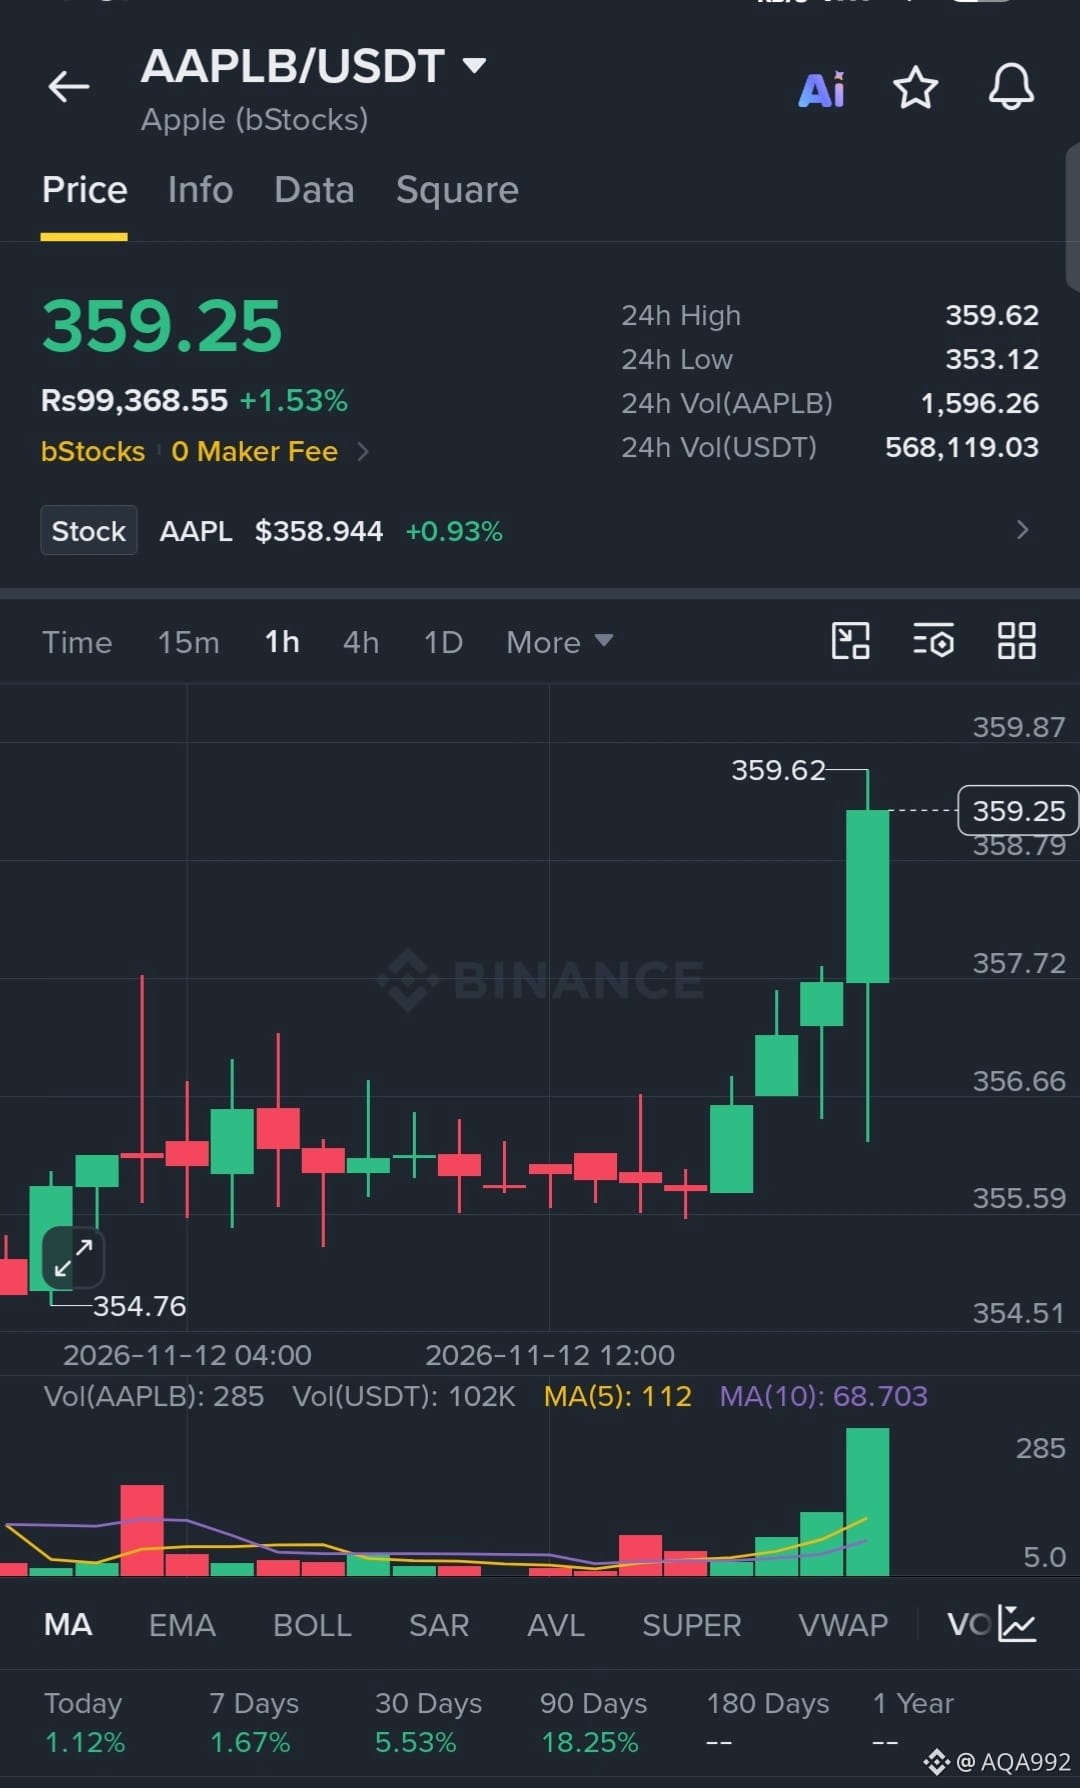
$AAPLB
is demonstrating textbook bullish continuation, establishing a strong sequence of higher lows and breaking local resistance with a surge in volume. The 1H chart shows aggressive buyer absorption on every dip, signaling intense momentum ready to shatter the immediate high at 359.62.
EP: 359.25
TP: 362.50, 366.00, 370.00
SL: 353.50
$AAPLB
#HuangExitNvidiaStrategyInFocus
#ChipStocksExtendLossesAfterNvidiaCEOChange
#AnthropicRejectsIPODelayValuationinQuestion
#CoreWeaveJumps10%On168%RevenueGrowth
#MSCIRemovalMayCurbStrategy’sBitcoinBuying
{spot}(AAPLBUSDT)
$AAPLB
is demonstrating textbook bullish continuation, establishing a strong sequence of higher lows and breaking local resistance with a surge in volume. The 1H chart shows aggressive buyer absorption on every dip, signaling intense momentum ready to shatter the immediate high at 359.62.
EP: 359.25
TP: 362.50, 366.00, 370.00
SL: 353.50
$AAPLB
#HuangExitNvidiaStrategyInFocus
#ChipStocksExtendLossesAfterNvidiaCEOChange
#AnthropicRejectsIPODelayValuationinQuestion
#CoreWeaveJumps10%On168%RevenueGrowth
#MSCIRemovalMayCurbStrategy’sBitcoinBuying
is demonstrating textbook bullish continuation, establishing a strong sequence of higher lows and breaking local resistance with a surge in volume. The 1H chart shows aggressive buyer absorption on every dip, signaling intense momentum ready to shatter the immediate high at 359.62.
EP: 359.25
TP: 362.50, 366.00, 370.00
SL: 353.50
$AAPLB
#HuangExitNvidiaStrategyInFocus
#ChipStocksExtendLossesAfterNvidiaCEOChange
#AnthropicRejectsIPODelayValuationinQuestion
#CoreWeaveJumps10%On168%RevenueGrowth
#MSCIRemovalMayCurbStrategy’sBitcoinBuying
3
Log in to explore more content
Join global crypto users on Binance Square
⚡️ Get latest and useful information about crypto.
💬 Trusted by the world’s largest crypto exchange.
👍 Discover real insights from verified creators.
အီးမေးလ် / ဖုန်းနံပါတ်
ရေပန်းစားနေသော ခေါင်းစဉ်များ
1
#HuangExitNvidiaStrategyInFocus
ကြည့်ရှုမှု 1,294 ကြိမ်
124 ဦး ဆွေးနွေးနေသည်
2
#AnthropicRejectsIPODelayValuationinQuestion
ကြည့်ရှုမှု 554,694 ကြိမ်
4,564 ဦး ဆွေးနွေးနေသည်
3
#ChipStocksExtendLossesAfterNvidiaCEOChange
ကြည့်ရှုမှု 119 ကြိမ်
63 ဦး ဆွေးနွေးနေသည်
4
#BitMineReports$6.3BNetLossForFiscal2026
ကြည့်ရှုမှု 1,064 ကြိမ်
45 ဦး ဆွေးနွေးနေသည်
5
#CoreWeaveJumps10%On168%RevenueGrowth
ကြည့်ရှုမှု 111,673 ကြိမ်
1,293 ဦး ဆွေးနွေးနေသည်
6
#ZcashFallsBelow$1000ForFirstTimeSinceSeptember
ကြည့်ရှုမှု 59,804 ကြိမ်
242 ဦး ဆွေးနွေးနေသည်
7
#MSCIRemovalMayCurbStrategy’sBitcoinBuying
ကြည့်ရှုမှု 20,028 ကြိမ်
343 ဦး ဆွေးနွေးနေသည်
8
#TradFiForBeginners
ကြည့်ရှုမှု 494,077 ကြိမ်
3,377 ဦး ဆွေးနွေးနေသည်
9
#USJoblessClaimsRise
ကြည့်ရှုမှု 19.1M ကြိမ်
7,533 ဦး ဆွေးနွေးနေသည်
10
#PythAddsNYSERealTimeDataToMarketplace
ကြည့်ရှုမှု 9,650 ကြိမ်
194 ဦး ဆွေးနွေးနေသည်