

#candlestickpatterns
candlestickpatterns
1.6M views
783 Discussing
ရေပန်းစားသော
နောက်ဆုံး

·
--
တက်ရိပ်ရှိသည်
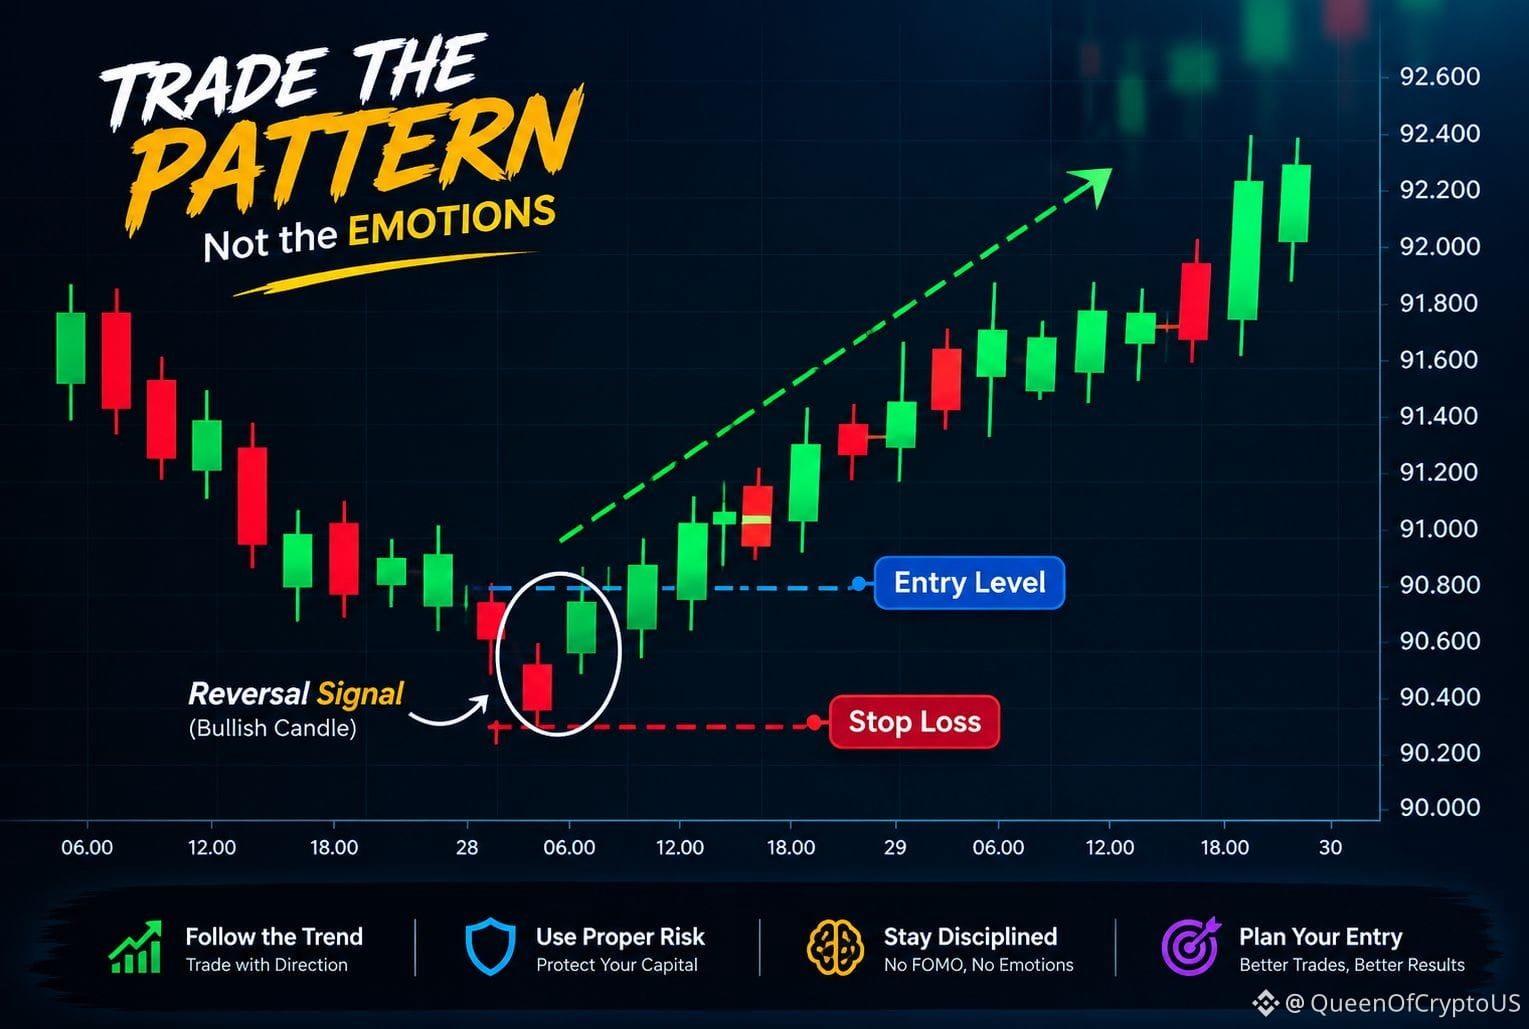
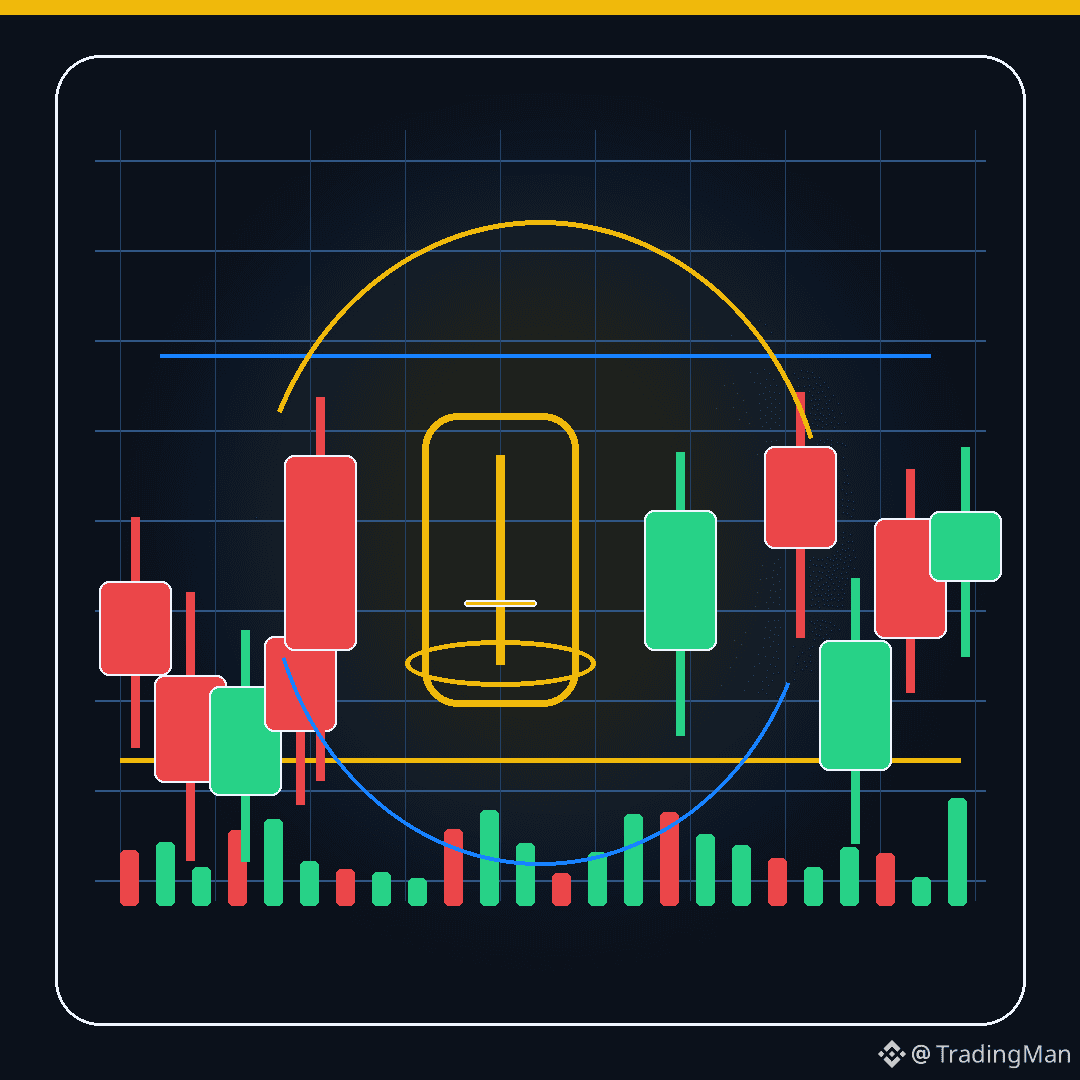
📈 Bullish Kicker — A Powerful Reversal Signal
The Bullish Kicker is a candlestick formation that can signal a potential shift from bearish momentum to bullish momentum.
🔴 First candle: Sellers remain in control with a strong bearish candle.
🟢 Second candle: Buyers suddenly take over with a strong bullish candle, showing a sharp change in market sentiment.
When this setup appears after a sustained decline, it can indicate that bullish momentum is entering the market. Traders may then look for confirmation before considering a trade in the direction of the new trend.
🎯 Key lesson: Don’t trade the pattern blindly. Confirm the trend, watch volume and structure, and always manage your risk.
Have you spotted a Bullish Kicker on a live chart? 👀📊
#BinanceSquare #cryptotrading #CandlestickPatterns #BullishKicker #PriceAction
📈 Bullish Kicker — A Powerful Reversal Signal
The Bullish Kicker is a candlestick formation that can signal a potential shift from bearish momentum to bullish momentum.
🔴 First candle: Sellers remain in control with a strong bearish candle.
🟢 Second candle: Buyers suddenly take over with a strong bullish candle, showing a sharp change in market sentiment.
When this setup appears after a sustained decline, it can indicate that bullish momentum is entering the market. Traders may then look for confirmation before considering a trade in the direction of the new trend.
🎯 Key lesson: Don’t trade the pattern blindly. Confirm the trend, watch volume and structure, and always manage your risk.
Have you spotted a Bullish Kicker on a live chart? 👀📊
#BinanceSquare #cryptotrading #CandlestickPatterns #BullishKicker #PriceAction
The Bullish Kicker is a candlestick formation that can signal a potential shift from bearish momentum to bullish momentum.
🔴 First candle: Sellers remain in control with a strong bearish candle.
🟢 Second candle: Buyers suddenly take over with a strong bullish candle, showing a sharp change in market sentiment.
When this setup appears after a sustained decline, it can indicate that bullish momentum is entering the market. Traders may then look for confirmation before considering a trade in the direction of the new trend.
🎯 Key lesson: Don’t trade the pattern blindly. Confirm the trend, watch volume and structure, and always manage your risk.
Have you spotted a Bullish Kicker on a live chart? 👀📊
#BinanceSquare #cryptotrading #CandlestickPatterns #BullishKicker #PriceAction
1
4

🐂 Bullish vs Bearish Candlesticks: Who Controls the Bitcoin Market?
The crypto market is all about momentum, and candlestick patterns help traders understand the battle between buyers and sellers.
📈 BULLISH: Bullish Engulfing, Hammer, Morning Star, Three White Soldiers.
📉 BEARISH: Bearish Engulfing, Shooting Star, Evening Star, Three Black Crows.
Watch support and resistance, volume, breakouts, and risk management. Never trade based on a single candle. Wait for confirmation and always manage your risk.
🐂 Are you Team BULLS or Team BEARS today? Drop your thoughts below!
Educational content only. Not financial advice.
#Bitcoin #BTC #Bullish #Bearish #CandlestickPatterns
🐂 Bullish vs Bearish Candlesticks: Who Controls the Bitcoin Market?
The crypto market is all about momentum, and candlestick patterns help traders understand the battle between buyers and sellers.
📈 BULLISH: Bullish Engulfing, Hammer, Morning Star, Three White Soldiers.
📉 BEARISH: Bearish Engulfing, Shooting Star, Evening Star, Three Black Crows.
Watch support and resistance, volume, breakouts, and risk management. Never trade based on a single candle. Wait for confirmation and always manage your risk.
🐂 Are you Team BULLS or Team BEARS today? Drop your thoughts below!
Educational content only. Not financial advice.
#Bitcoin #BTC #Bullish #Bearish #CandlestickPatterns
The crypto market is all about momentum, and candlestick patterns help traders understand the battle between buyers and sellers.
📈 BULLISH: Bullish Engulfing, Hammer, Morning Star, Three White Soldiers.
📉 BEARISH: Bearish Engulfing, Shooting Star, Evening Star, Three Black Crows.
Watch support and resistance, volume, breakouts, and risk management. Never trade based on a single candle. Wait for confirmation and always manage your risk.
🐂 Are you Team BULLS or Team BEARS today? Drop your thoughts below!
Educational content only. Not financial advice.
#Bitcoin #BTC #Bullish #Bearish #CandlestickPatterns

44

·
--
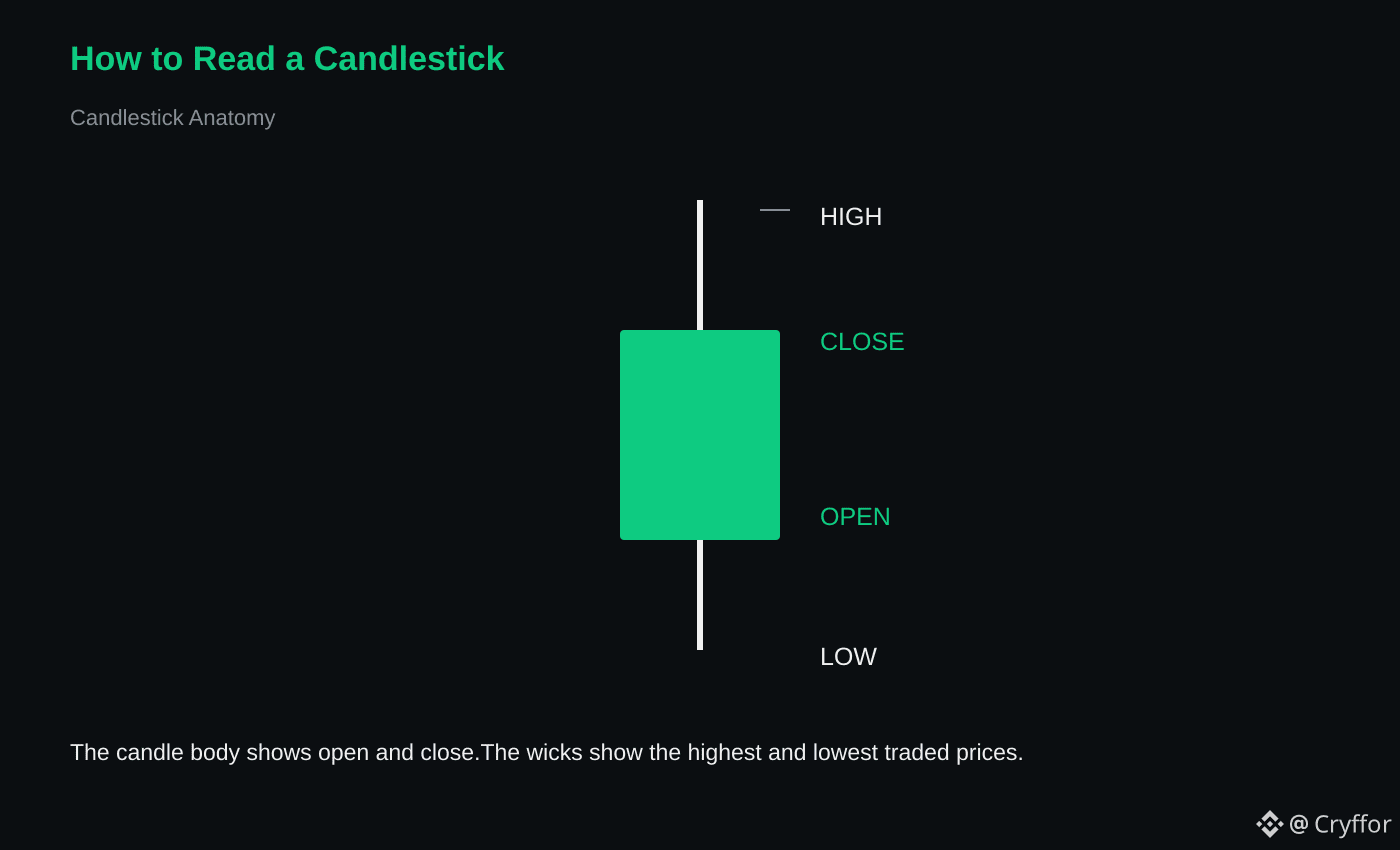
Are you treating every single candle on your chart like a guaranteed crystal ball? That’s a quick trap many traders fall into. 🕯️
At its core, a candlestick is simply a snapshot of market momentum. A bullish candle means buyers were in control during that period, while a bearish candle means sellers were in control. Those thin lines extending from the main body—known as the wick or shadow—reveal price levels that were reached but not held.
However, a single candle rarely tells the entire story. Candlestick reading becomes far more useful when combined with support and resistance levels, the broader trend, volume, and higher-timeframe structure, rather than being read in isolation.
Will you check the broader context before taking your next trade? 🧠
#CryptoTrading #TechnicalAnalysis #CandlestickPatterns #BinanceSquare
Are you treating every single candle on your chart like a guaranteed crystal ball? That’s a quick trap many traders fall into. 🕯️
At its core, a candlestick is simply a snapshot of market momentum. A bullish candle means buyers were in control during that period, while a bearish candle means sellers were in control. Those thin lines extending from the main body—known as the wick or shadow—reveal price levels that were reached but not held.
However, a single candle rarely tells the entire story. Candlestick reading becomes far more useful when combined with support and resistance levels, the broader trend, volume, and higher-timeframe structure, rather than being read in isolation.
Will you check the broader context before taking your next trade? 🧠
#CryptoTrading #TechnicalAnalysis #CandlestickPatterns #BinanceSquare
At its core, a candlestick is simply a snapshot of market momentum. A bullish candle means buyers were in control during that period, while a bearish candle means sellers were in control. Those thin lines extending from the main body—known as the wick or shadow—reveal price levels that were reached but not held.
However, a single candle rarely tells the entire story. Candlestick reading becomes far more useful when combined with support and resistance levels, the broader trend, volume, and higher-timeframe structure, rather than being read in isolation.
Will you check the broader context before taking your next trade? 🧠
#CryptoTrading #TechnicalAnalysis #CandlestickPatterns #BinanceSquare
2

·
--
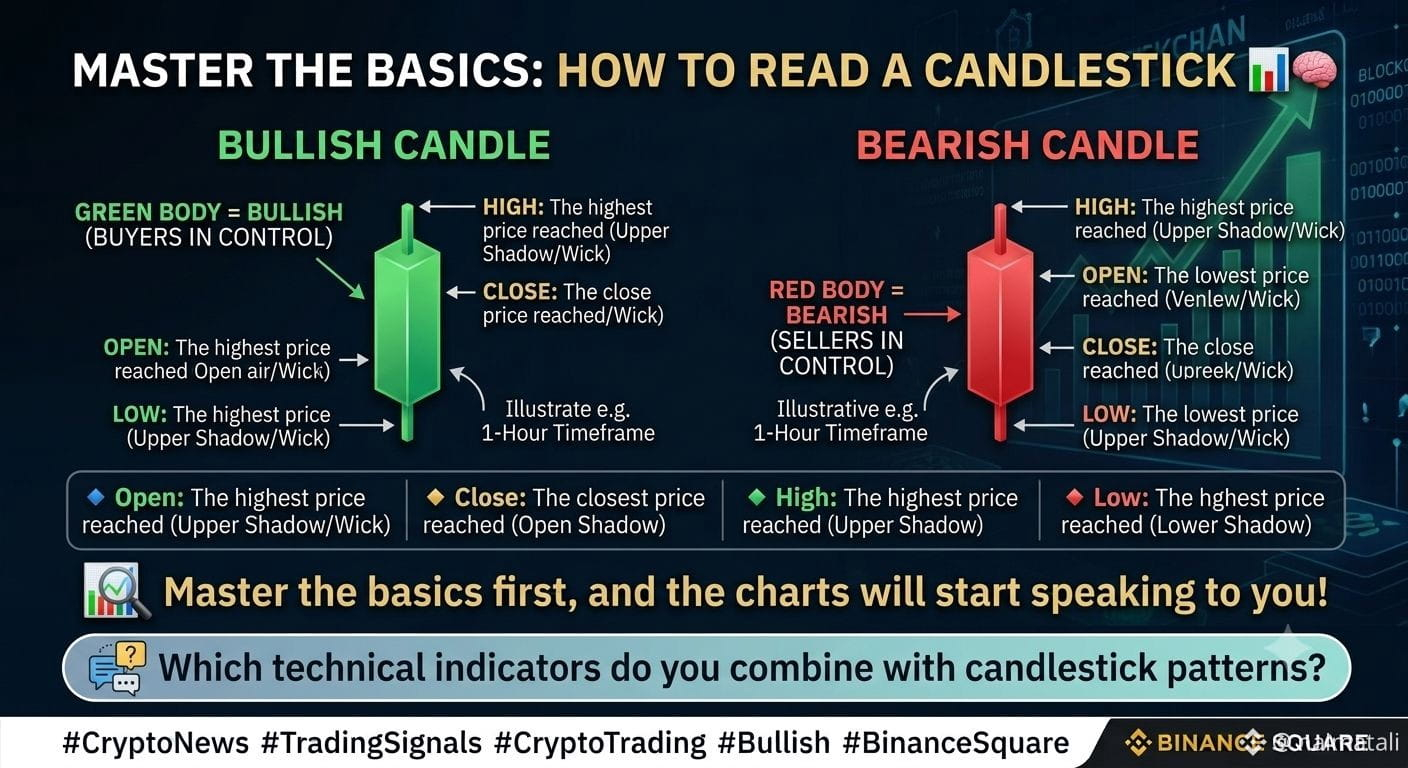
Headline: Master the Basics: How to Read a Candlestick 📊🧠
Every successful trader starts with the fundamentals. Every single candle on your chart tells a 4-part story:
🔹 Open: The price where the timeframe started
🔹 Close: The price where the timeframe ended
🔹 High: The highest price reached (Upper Shadow/Wick)
🔹 Low: The lowest price reached (Lower Shadow/Wick)
🟢 Bullish Candle: Closes HIGHER than it opened
🔴 Bearish Candle: Closes LOWER than it opened
Master the basics first, and the charts will start speaking to you! 🔍
💬 Which technical indicators do you combine with candlestick patterns?
#CryptoEdges #CandlestickPatterns #TechnicalAnalysis
#tradingtips
Headline: Master the Basics: How to Read a Candlestick 📊🧠
Every successful trader starts with the fundamentals. Every single candle on your chart tells a 4-part story:
🔹 Open: The price where the timeframe started
🔹 Close: The price where the timeframe ended
🔹 High: The highest price reached (Upper Shadow/Wick)
🔹 Low: The lowest price reached (Lower Shadow/Wick)
🟢 Bullish Candle: Closes HIGHER than it opened
🔴 Bearish Candle: Closes LOWER than it opened
Master the basics first, and the charts will start speaking to you! 🔍
💬 Which technical indicators do you combine with candlestick patterns?
#CryptoEdges #CandlestickPatterns #TechnicalAnalysis
#tradingtips
Every successful trader starts with the fundamentals. Every single candle on your chart tells a 4-part story:
🔹 Open: The price where the timeframe started
🔹 Close: The price where the timeframe ended
🔹 High: The highest price reached (Upper Shadow/Wick)
🔹 Low: The lowest price reached (Lower Shadow/Wick)
🟢 Bullish Candle: Closes HIGHER than it opened
🔴 Bearish Candle: Closes LOWER than it opened
Master the basics first, and the charts will start speaking to you! 🔍
💬 Which technical indicators do you combine with candlestick patterns?
#CryptoEdges #CandlestickPatterns #TechnicalAnalysis
#tradingtips
58

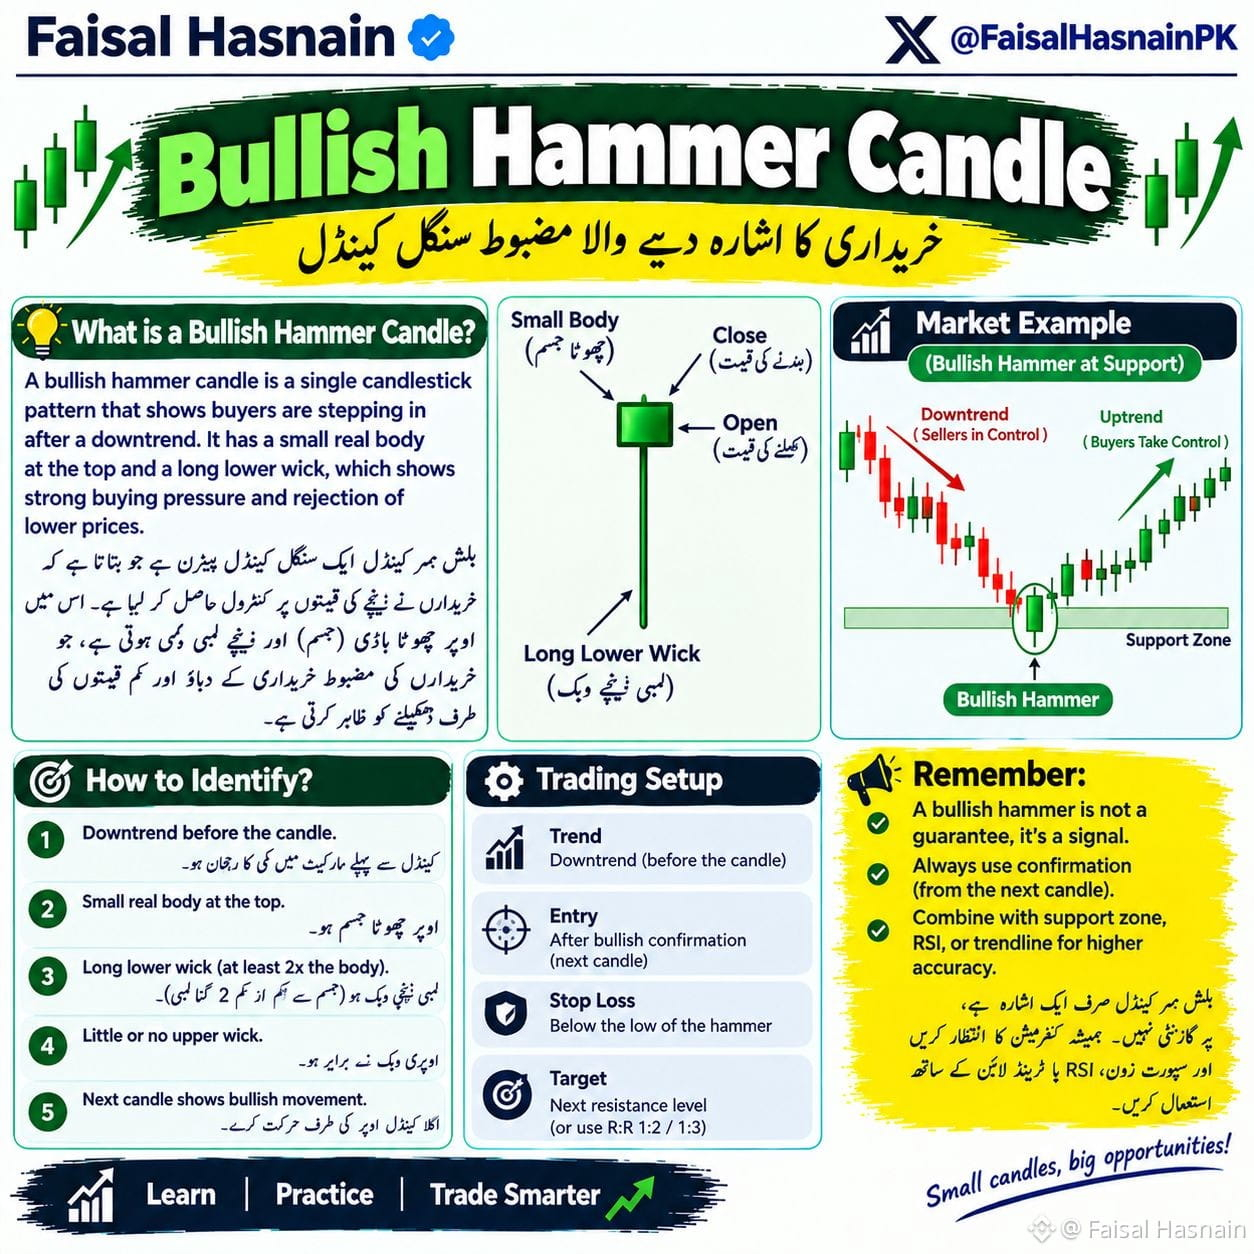
🔨Bullish Hammer Candle! 🟢
This one single candle can change the entire trend! If you see it at support, buyers are stepping in 💪
💡 What is a Bullish Hammer Candle?
A single candlestick pattern that appears after a DOWNTREND. It shows strong buying pressure and rejection of lower prices.
Structure:
Small Body at the top = Indecision
Long Lower Wick at least 2x of body = Buyers rejected low prices
Little to No Upper Wick = No selling pressure at top
📍 How to Identify?
1️⃣ Must appear after a Downtrend (Sellers in control) 🔴
2️⃣ Small real body at the top
3️⃣ Long lower wick - at least 2x the body size
4️⃣ Little or no upper wick
5️⃣ Next candle must show bullish movement for confirmation ✅
📈 Market Example - At Support Zone:
Downtrend (Sellers in Control) ➡️ Price falls to Support Zone ➡️ Bullish Hammer forms ➡️ Uptrend (Buyers Take Control) 🚀
This is exactly how reversals start!
🎯 Trading Setup:
Trend: Must be Downtrend before the hammer
Entry: After bullish confirmation (next green candle) 🟢
Stop Loss: Below the low of the hammer 🛑
⚠️ Remember:
✅ A bullish hammer is NOT a guarantee, it's a SIGNAL
✅ Always use confirmation from next candle
✅ Combine with Support Zone, RSI, or Trendline for higher accuracy 🎯
Small candles, big opportunities!
Save this cheat sheet for your next trade! 🔖
Learn | Practice | Trade Smarter
#priceaction #BullishHammer #CandlestickPatterns #TechnicalAnalysis
🔨Bullish Hammer Candle! 🟢
This one single candle can change the entire trend! If you see it at support, buyers are stepping in 💪
💡 What is a Bullish Hammer Candle?
A single candlestick pattern that appears after a DOWNTREND. It shows strong buying pressure and rejection of lower prices.
Structure:
Small Body at the top = Indecision
Long Lower Wick at least 2x of body = Buyers rejected low prices
Little to No Upper Wick = No selling pressure at top
📍 How to Identify?
1️⃣ Must appear after a Downtrend (Sellers in control) 🔴
2️⃣ Small real body at the top
3️⃣ Long lower wick - at least 2x the body size
4️⃣ Little or no upper wick
5️⃣ Next candle must show bullish movement for confirmation ✅
📈 Market Example - At Support Zone:
Downtrend (Sellers in Control) ➡️ Price falls to Support Zone ➡️ Bullish Hammer forms ➡️ Uptrend (Buyers Take Control) 🚀
This is exactly how reversals start!
🎯 Trading Setup:
Trend: Must be Downtrend before the hammer
Entry: After bullish confirmation (next green candle) 🟢
Stop Loss: Below the low of the hammer 🛑
⚠️ Remember:
✅ A bullish hammer is NOT a guarantee, it's a SIGNAL
✅ Always use confirmation from next candle
✅ Combine with Support Zone, RSI, or Trendline for higher accuracy 🎯
Small candles, big opportunities!
Save this cheat sheet for your next trade! 🔖
Learn | Practice | Trade Smarter
#priceaction #BullishHammer #CandlestickPatterns #TechnicalAnalysis
This one single candle can change the entire trend! If you see it at support, buyers are stepping in 💪
💡 What is a Bullish Hammer Candle?
A single candlestick pattern that appears after a DOWNTREND. It shows strong buying pressure and rejection of lower prices.
Structure:
Small Body at the top = Indecision
Long Lower Wick at least 2x of body = Buyers rejected low prices
Little to No Upper Wick = No selling pressure at top
📍 How to Identify?
1️⃣ Must appear after a Downtrend (Sellers in control) 🔴
2️⃣ Small real body at the top
3️⃣ Long lower wick - at least 2x the body size
4️⃣ Little or no upper wick
5️⃣ Next candle must show bullish movement for confirmation ✅
📈 Market Example - At Support Zone:
Downtrend (Sellers in Control) ➡️ Price falls to Support Zone ➡️ Bullish Hammer forms ➡️ Uptrend (Buyers Take Control) 🚀
This is exactly how reversals start!
🎯 Trading Setup:
Trend: Must be Downtrend before the hammer
Entry: After bullish confirmation (next green candle) 🟢
Stop Loss: Below the low of the hammer 🛑
⚠️ Remember:
✅ A bullish hammer is NOT a guarantee, it's a SIGNAL
✅ Always use confirmation from next candle
✅ Combine with Support Zone, RSI, or Trendline for higher accuracy 🎯
Small candles, big opportunities!
Save this cheat sheet for your next trade! 🔖
Learn | Practice | Trade Smarter
#priceaction #BullishHammer #CandlestickPatterns #TechnicalAnalysis
74


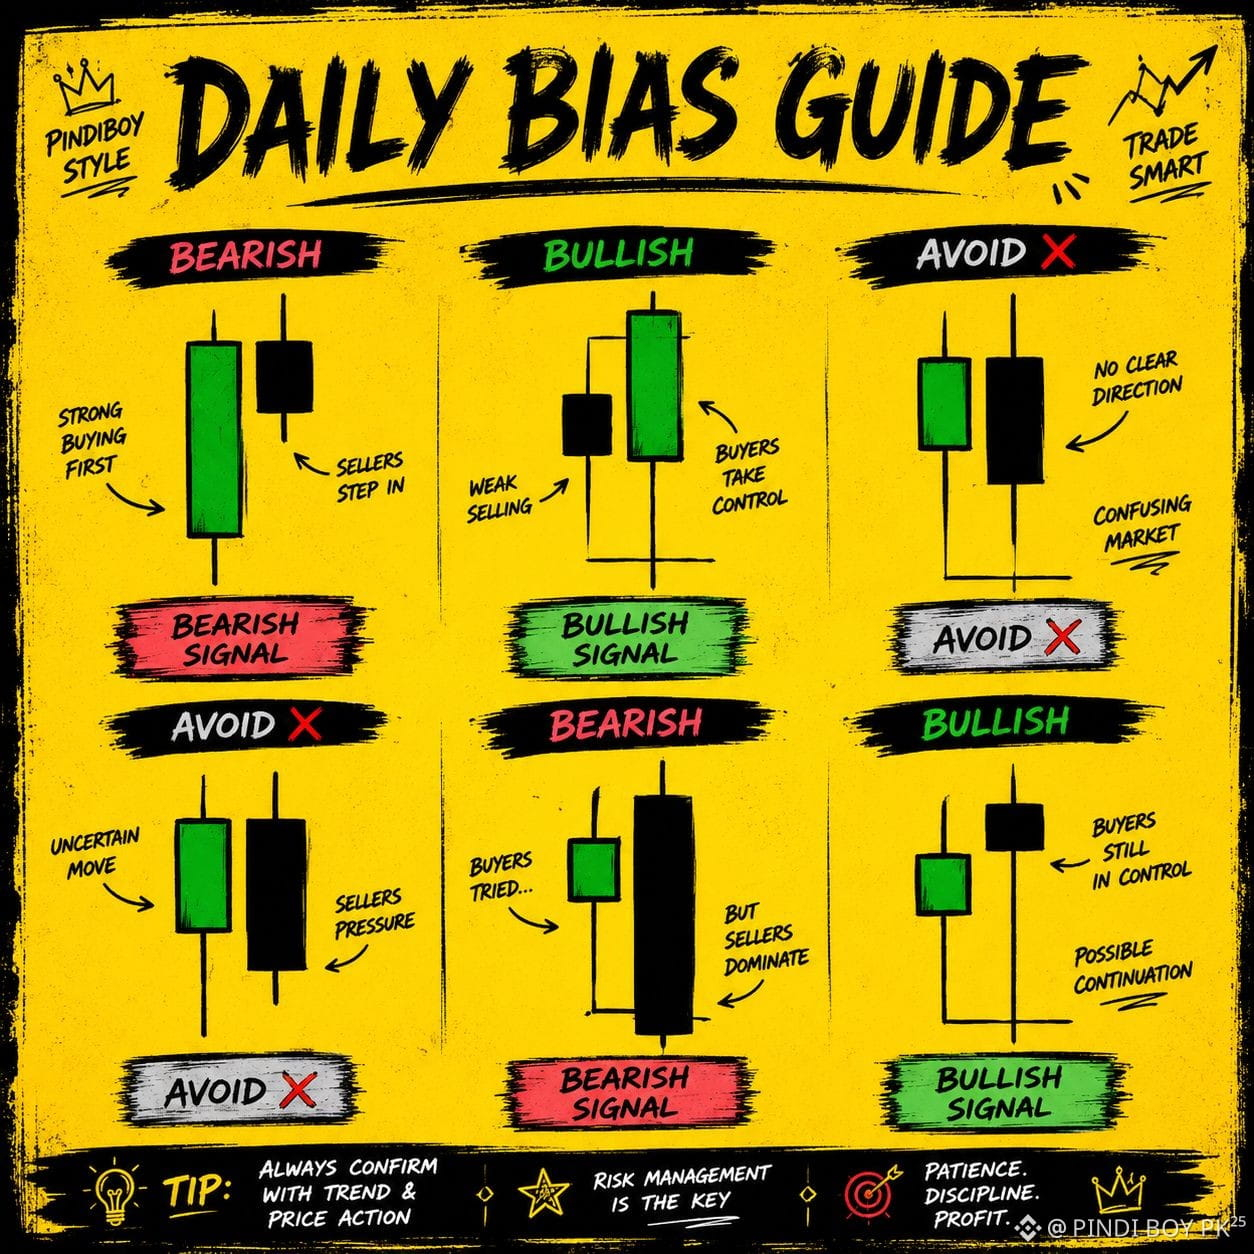
🚨 🚨 🚨 Educational Post 🚨🚨🚨
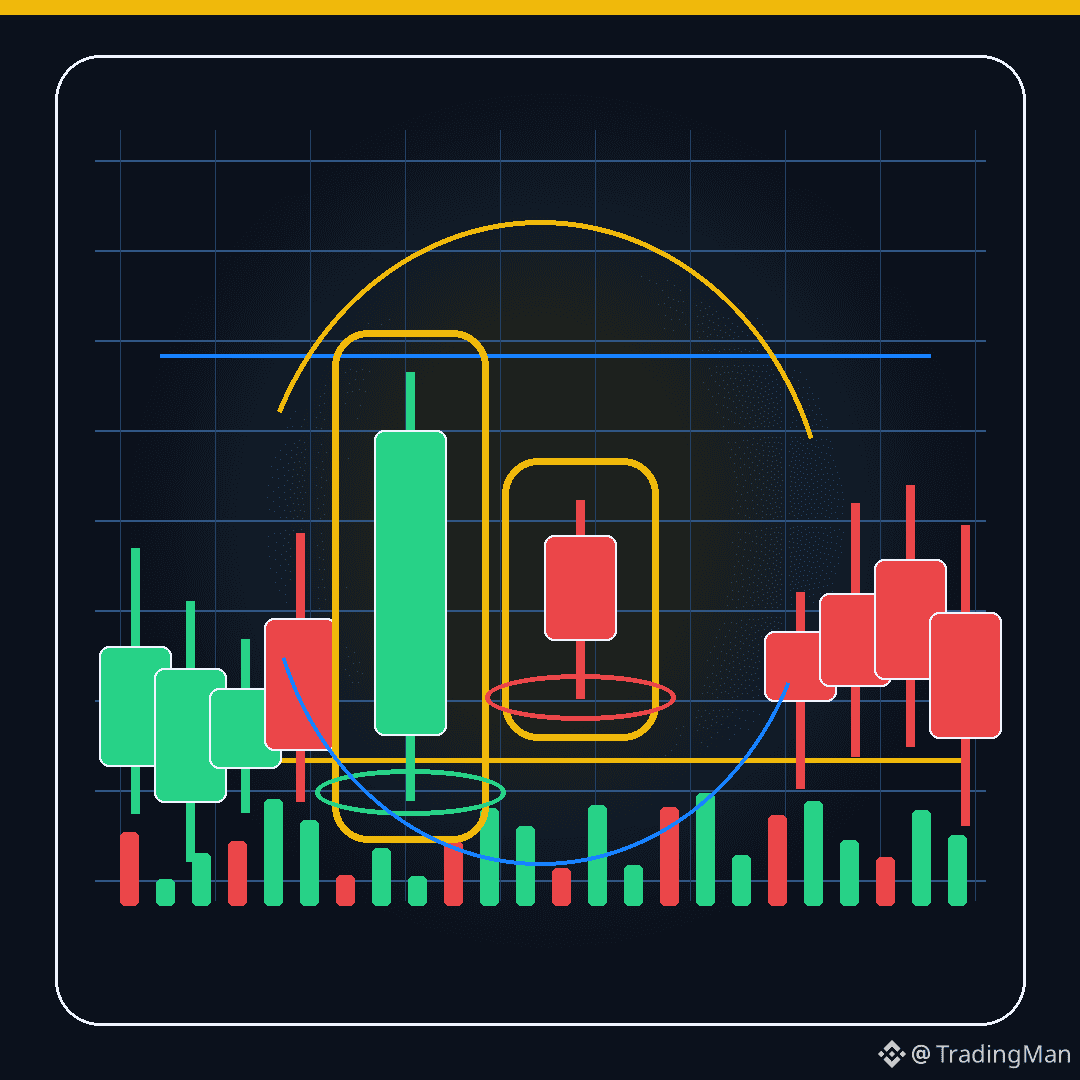
This image is a Daily Bias Guide that shows how to determine the likely market direction using the first two candles after a key level or session open.
1. Top Left – Bearish 🟥
First candle is a strong bullish candle.
Second candle is a small bearish candle that rejects higher prices.
Indicates buyers are losing momentum.
Bias: Look for SHORT opportunities.
2. Top Middle – Bullish 🟩
First candle is bearish.
Second candle is a strong bullish candle that engulfs/reclaims the move.
Buyers take control.
Bias: Look for LONG opportunities.
3. Top Right – Avoid ❌
Bullish candle followed by a bearish candle of similar strength.
No clear winner between buyers and sellers.
Bias: Stay out until a breakout.
4. Bottom Left – Avoid ❌
Small bullish candle followed by a strong bearish candle.
Market structure is unclear at this stage.
Bias: Wait for confirmation.
5. Bottom Middle – Bearish 🟥
Small bullish candle is completely overwhelmed by a large bearish candle.
Strong selling pressure.
Bias: Prefer SHORT trades.
6. Bottom Right – Bullish 🟩
Small bullish candle followed by a small bearish pullback.
Buyers still remain in control.
Bias: Look for LONG continuation.
Key takeaway
🟩 Bullish: Buy on pullbacks after confirmation.
🟥 Bearish: Sell on pullbacks after confirmation.
❌ Avoid: No clear edge—wait for a better setup.
This guide is useful as a bias filter, but it should be combined with market structure, support/resistance, volume, and liquidity rather than used as a standalone trading strategy.
#priceaction #CandlestickPatterns #tradingStrategy #cryptotrading #BinanceSquare
🚨 🚨 🚨 Educational Post 🚨🚨🚨
This image is a Daily Bias Guide that shows how to determine the likely market direction using the first two candles after a key level or session open.
1. Top Left – Bearish 🟥
First candle is a strong bullish candle.
Second candle is a small bearish candle that rejects higher prices.
Indicates buyers are losing momentum.
Bias: Look for SHORT opportunities.
2. Top Middle – Bullish 🟩
First candle is bearish.
Second candle is a strong bullish candle that engulfs/reclaims the move.
Buyers take control.
Bias: Look for LONG opportunities.
3. Top Right – Avoid ❌
Bullish candle followed by a bearish candle of similar strength.
No clear winner between buyers and sellers.
Bias: Stay out until a breakout.
4. Bottom Left – Avoid ❌
Small bullish candle followed by a strong bearish candle.
Market structure is unclear at this stage.
Bias: Wait for confirmation.
5. Bottom Middle – Bearish 🟥
Small bullish candle is completely overwhelmed by a large bearish candle.
Strong selling pressure.
Bias: Prefer SHORT trades.
6. Bottom Right – Bullish 🟩
Small bullish candle followed by a small bearish pullback.
Buyers still remain in control.
Bias: Look for LONG continuation.
Key takeaway
🟩 Bullish: Buy on pullbacks after confirmation.
🟥 Bearish: Sell on pullbacks after confirmation.
❌ Avoid: No clear edge—wait for a better setup.
This guide is useful as a bias filter, but it should be combined with market structure, support/resistance, volume, and liquidity rather than used as a standalone trading strategy.
#priceaction #CandlestickPatterns #tradingStrategy #cryptotrading #BinanceSquare
This image is a Daily Bias Guide that shows how to determine the likely market direction using the first two candles after a key level or session open.
1. Top Left – Bearish 🟥
First candle is a strong bullish candle.
Second candle is a small bearish candle that rejects higher prices.
Indicates buyers are losing momentum.
Bias: Look for SHORT opportunities.
2. Top Middle – Bullish 🟩
First candle is bearish.
Second candle is a strong bullish candle that engulfs/reclaims the move.
Buyers take control.
Bias: Look for LONG opportunities.
3. Top Right – Avoid ❌
Bullish candle followed by a bearish candle of similar strength.
No clear winner between buyers and sellers.
Bias: Stay out until a breakout.
4. Bottom Left – Avoid ❌
Small bullish candle followed by a strong bearish candle.
Market structure is unclear at this stage.
Bias: Wait for confirmation.
5. Bottom Middle – Bearish 🟥
Small bullish candle is completely overwhelmed by a large bearish candle.
Strong selling pressure.
Bias: Prefer SHORT trades.
6. Bottom Right – Bullish 🟩
Small bullish candle followed by a small bearish pullback.
Buyers still remain in control.
Bias: Look for LONG continuation.
Key takeaway
🟩 Bullish: Buy on pullbacks after confirmation.
🟥 Bearish: Sell on pullbacks after confirmation.
❌ Avoid: No clear edge—wait for a better setup.
This guide is useful as a bias filter, but it should be combined with market structure, support/resistance, volume, and liquidity rather than used as a standalone trading strategy.
#priceaction #CandlestickPatterns #tradingStrategy #cryptotrading #BinanceSquare
4
603

Learning Crypto Scalping: How Do You Trade a Hammer Candle? 📈🧐
I am currently on my journey to master crypto scalping, but as a beginner, understanding real-time candlestick movements can be quite challenging at times.
Today, I am studying the Hammer Candlestick pattern. From what I understand, when it forms at the bottom of a downtrend, it usually signals a potential bullish reversal because buyers are pushing the price back up.
However, when looking at a live scalping chart (like the 1m or 5m timeframe), it gets confusing to spot the right entry point.
To all the experienced traders and scalping experts on Binance Square:
👇 How do you personally validate a Hammer candle before jumping into a scalp? Do you wait for the next candle to close, or look at volume?
Please drop your advice in the comments—I would love to learn from your experience!
If you want to join me on this learning journey and grow together, make sure to LIKE, SHARE, and hit the FOLLOW button!
#BinanceSquare #TechnicalAnalysis #Scalping #CandlestickPatterns #CryptoCommunity
Learning Crypto Scalping: How Do You Trade a Hammer Candle? 📈🧐
I am currently on my journey to master crypto scalping, but as a beginner, understanding real-time candlestick movements can be quite challenging at times.
Today, I am studying the Hammer Candlestick pattern. From what I understand, when it forms at the bottom of a downtrend, it usually signals a potential bullish reversal because buyers are pushing the price back up.
However, when looking at a live scalping chart (like the 1m or 5m timeframe), it gets confusing to spot the right entry point.
To all the experienced traders and scalping experts on Binance Square:
👇 How do you personally validate a Hammer candle before jumping into a scalp? Do you wait for the next candle to close, or look at volume?
Please drop your advice in the comments—I would love to learn from your experience!
If you want to join me on this learning journey and grow together, make sure to LIKE, SHARE, and hit the FOLLOW button!
#BinanceSquare #TechnicalAnalysis #Scalping #CandlestickPatterns #CryptoCommunity
I am currently on my journey to master crypto scalping, but as a beginner, understanding real-time candlestick movements can be quite challenging at times.
Today, I am studying the Hammer Candlestick pattern. From what I understand, when it forms at the bottom of a downtrend, it usually signals a potential bullish reversal because buyers are pushing the price back up.
However, when looking at a live scalping chart (like the 1m or 5m timeframe), it gets confusing to spot the right entry point.
To all the experienced traders and scalping experts on Binance Square:
👇 How do you personally validate a Hammer candle before jumping into a scalp? Do you wait for the next candle to close, or look at volume?
Please drop your advice in the comments—I would love to learn from your experience!
If you want to join me on this learning journey and grow together, make sure to LIKE, SHARE, and hit the FOLLOW button!
#BinanceSquare #TechnicalAnalysis #Scalping #CandlestickPatterns #CryptoCommunity
101

دليل الشموع اليابانية #22
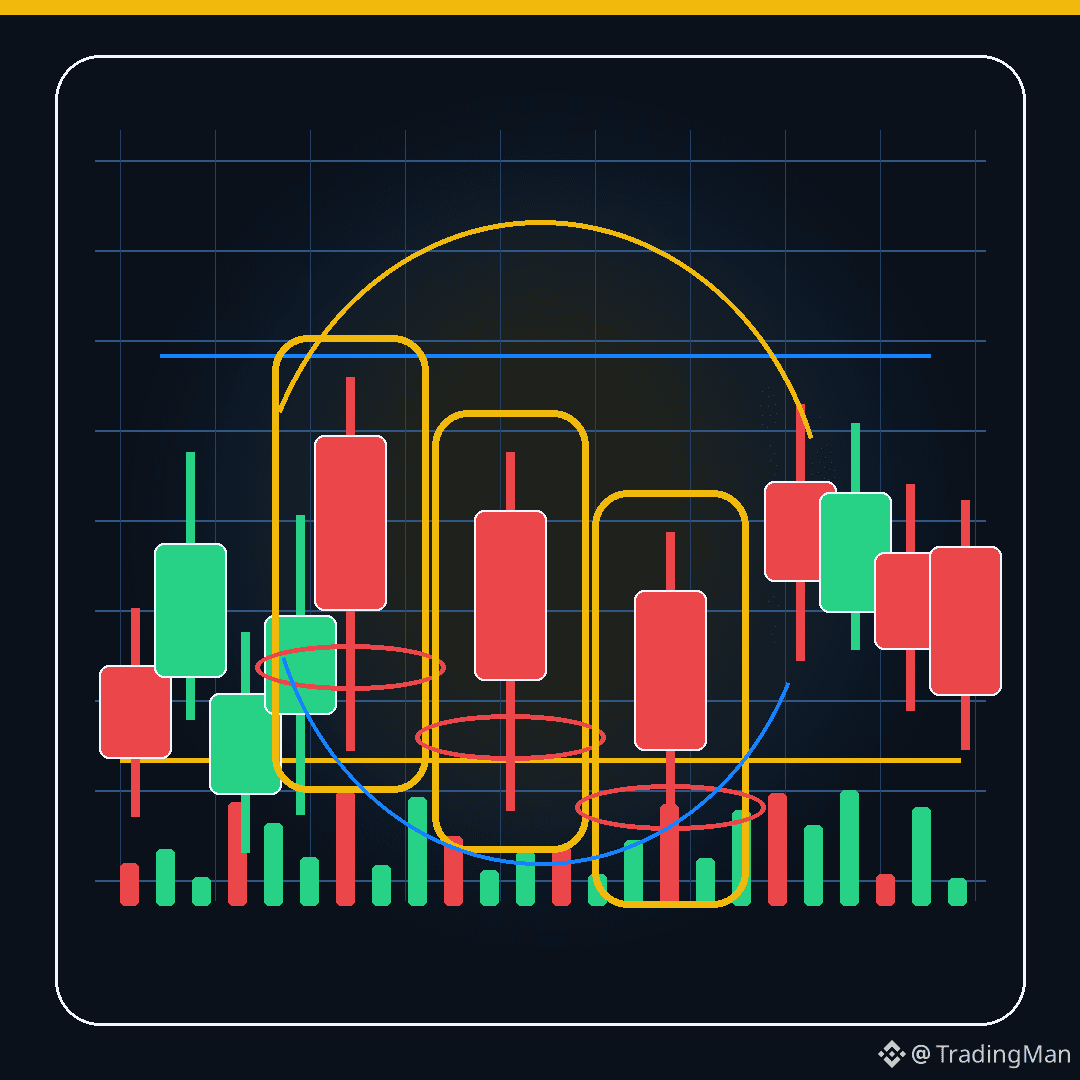
Three Black Crows
النموذج يتكون من 3 شموع هابطة متتالية، كل واحدة تغلق أقل من السابقة.
يظهر غالبا بعد صعود أو قرب مقاومة، ومعناه أن البائعين بدأوا يسيطرون تدريجيا.
قوته تزيد عندما تكون الشموع واضحة والإغلاقات ضعيفة.
لكن لا تطارد الهبوط بعد امتداد كبير. انتظر إعادة اختبار أو منطقة دخول محسوبة.
اعمل متابعة عشان يوصلك كل جديد في سلسلة تعليم التداول.
محتوى تعليمي وليس نصيحة مالية.
#CandlestickPatterns #TradingEducation #PriceAction
دليل الشموع اليابانية #22
Three Black Crows
النموذج يتكون من 3 شموع هابطة متتالية، كل واحدة تغلق أقل من السابقة.
يظهر غالبا بعد صعود أو قرب مقاومة، ومعناه أن البائعين بدأوا يسيطرون تدريجيا.
قوته تزيد عندما تكون الشموع واضحة والإغلاقات ضعيفة.
لكن لا تطارد الهبوط بعد امتداد كبير. انتظر إعادة اختبار أو منطقة دخول محسوبة.
اعمل متابعة عشان يوصلك كل جديد في سلسلة تعليم التداول.
محتوى تعليمي وليس نصيحة مالية.
#CandlestickPatterns #TradingEducation #PriceAction
Three Black Crows
النموذج يتكون من 3 شموع هابطة متتالية، كل واحدة تغلق أقل من السابقة.
يظهر غالبا بعد صعود أو قرب مقاومة، ومعناه أن البائعين بدأوا يسيطرون تدريجيا.
قوته تزيد عندما تكون الشموع واضحة والإغلاقات ضعيفة.
لكن لا تطارد الهبوط بعد امتداد كبير. انتظر إعادة اختبار أو منطقة دخول محسوبة.
اعمل متابعة عشان يوصلك كل جديد في سلسلة تعليم التداول.
محتوى تعليمي وليس نصيحة مالية.
#CandlestickPatterns #TradingEducation #PriceAction
100
دليل الشموع اليابانية #16
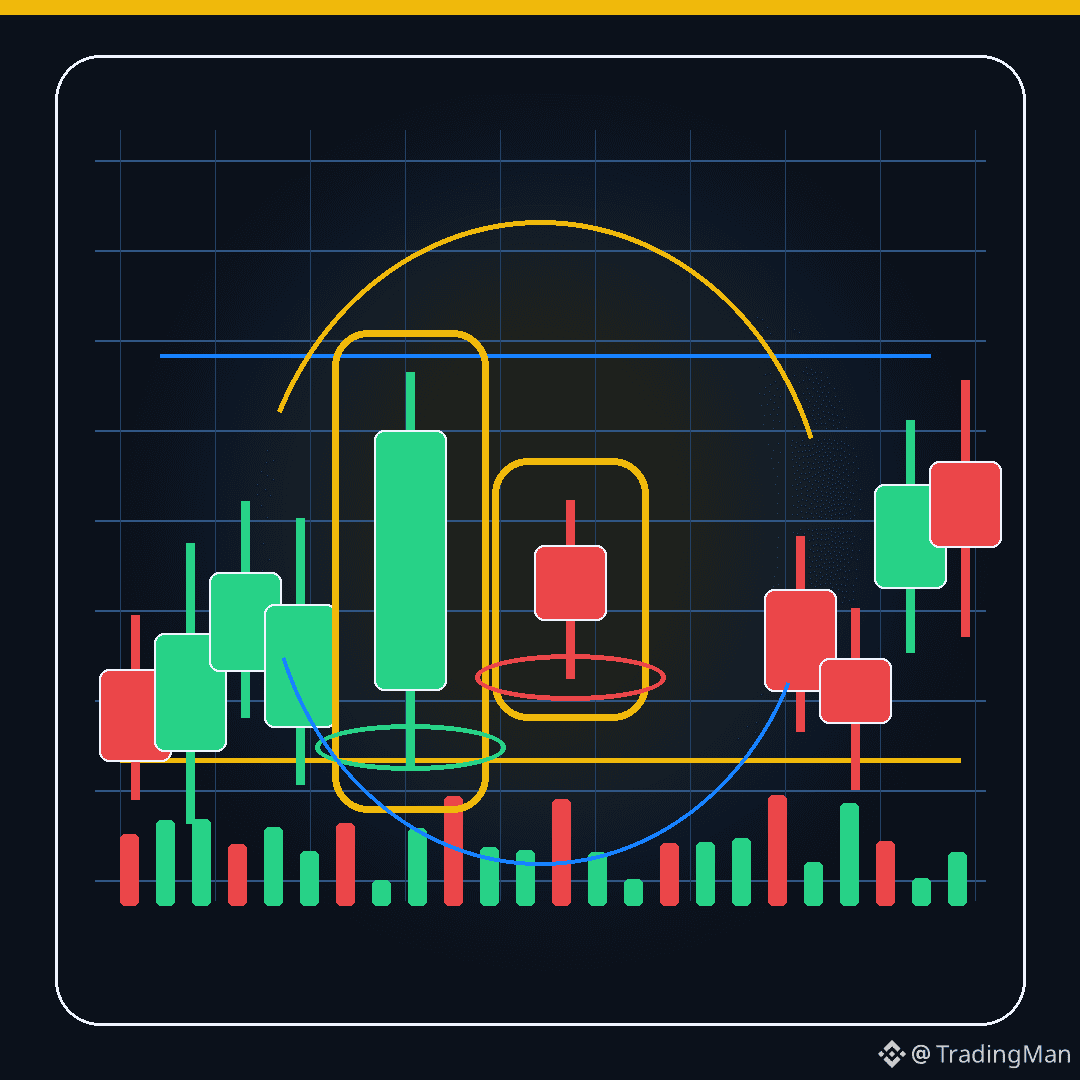
Bearish Harami
Bearish Harami يظهر غالبا بعد صعود.
يتكون من شمعة صاعدة كبيرة، ثم شمعة صغيرة داخل جسم الشمعة السابقة.
المعنى أن قوة الشراء بدأت تضعف، والسوق يدخل تردد قد يسبق هبوطا.
تأكيد النموذج يكون بكسر قاع الشمعة الصغيرة أو ظهور شمعة هابطة قوية بعدها.
اعمل متابعة عشان يوصلك كل جديد في سلسلة تعليم التداول.
محتوى تعليمي وليس نصيحة مالية.
#CandlestickPatterns #TradingEducation #PriceAction
دليل الشموع اليابانية #16
Bearish Harami
Bearish Harami يظهر غالبا بعد صعود.
يتكون من شمعة صاعدة كبيرة، ثم شمعة صغيرة داخل جسم الشمعة السابقة.
المعنى أن قوة الشراء بدأت تضعف، والسوق يدخل تردد قد يسبق هبوطا.
تأكيد النموذج يكون بكسر قاع الشمعة الصغيرة أو ظهور شمعة هابطة قوية بعدها.
اعمل متابعة عشان يوصلك كل جديد في سلسلة تعليم التداول.
محتوى تعليمي وليس نصيحة مالية.
#CandlestickPatterns #TradingEducation #PriceAction
Bearish Harami
Bearish Harami يظهر غالبا بعد صعود.
يتكون من شمعة صاعدة كبيرة، ثم شمعة صغيرة داخل جسم الشمعة السابقة.
المعنى أن قوة الشراء بدأت تضعف، والسوق يدخل تردد قد يسبق هبوطا.
تأكيد النموذج يكون بكسر قاع الشمعة الصغيرة أو ظهور شمعة هابطة قوية بعدها.
اعمل متابعة عشان يوصلك كل جديد في سلسلة تعليم التداول.
محتوى تعليمي وليس نصيحة مالية.
#CandlestickPatterns #TradingEducation #PriceAction
40
دليل الشموع اليابانية #19
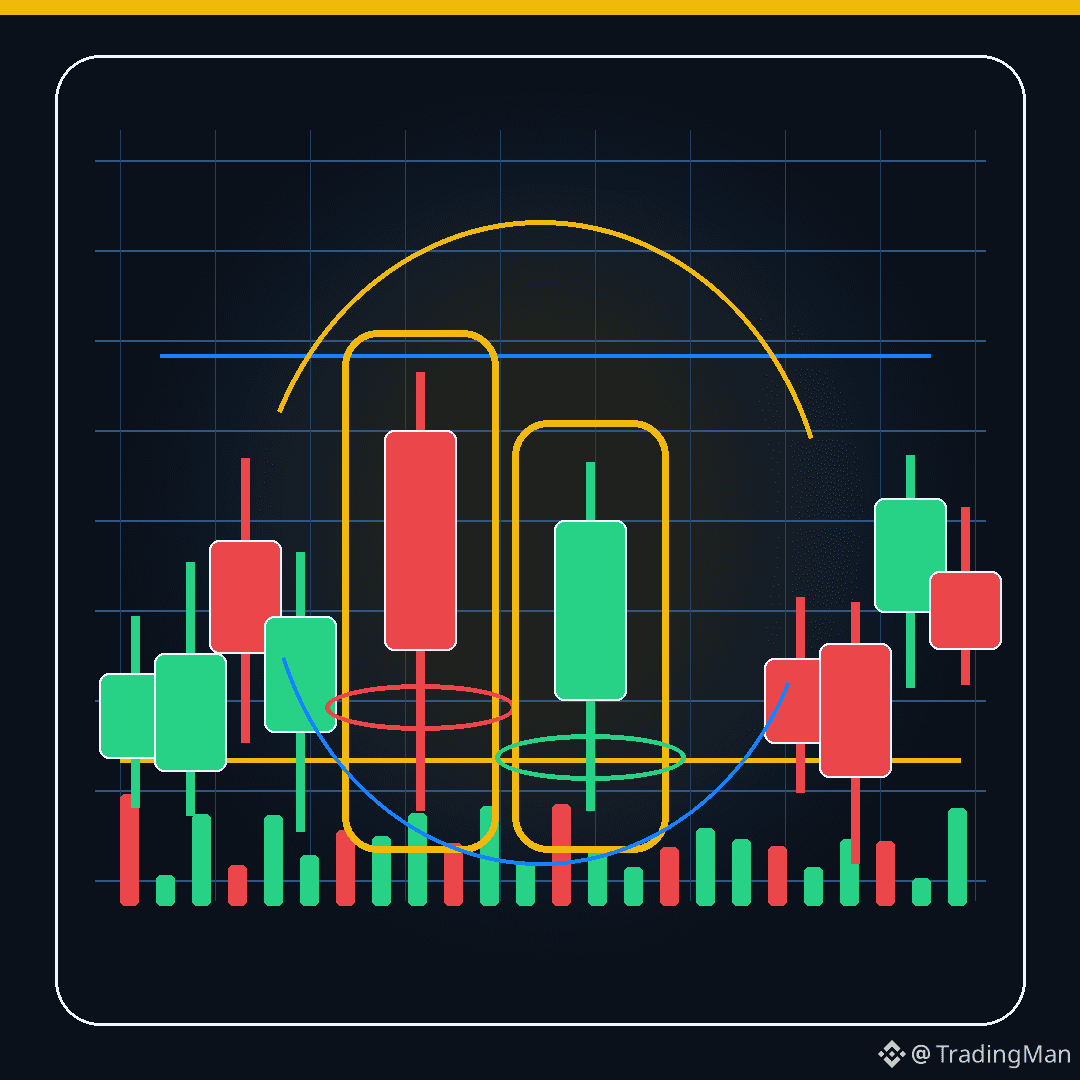
Tweezer Bottom
Tweezer Bottom يظهر غالبا بعد هبوط أو عند دعم.
يتكون من شمعتين أو أكثر تلامس تقريبا نفس القاع.
المعنى أن السعر حاول الهبوط أكثر من مرة، لكن منطقة معينة رفضت الهبوط.
يكون أقوى لو ظهر معه شمعة صاعدة أو كسر قمة صغيرة بعد النموذج.
اعمل متابعة عشان يوصلك كل جديد في سلسلة تعليم التداول.
محتوى تعليمي وليس نصيحة مالية.
#CandlestickPatterns #TradingEducation #PriceAction
دليل الشموع اليابانية #19
Tweezer Bottom
Tweezer Bottom يظهر غالبا بعد هبوط أو عند دعم.
يتكون من شمعتين أو أكثر تلامس تقريبا نفس القاع.
المعنى أن السعر حاول الهبوط أكثر من مرة، لكن منطقة معينة رفضت الهبوط.
يكون أقوى لو ظهر معه شمعة صاعدة أو كسر قمة صغيرة بعد النموذج.
اعمل متابعة عشان يوصلك كل جديد في سلسلة تعليم التداول.
محتوى تعليمي وليس نصيحة مالية.
#CandlestickPatterns #TradingEducation #PriceAction
Tweezer Bottom
Tweezer Bottom يظهر غالبا بعد هبوط أو عند دعم.
يتكون من شمعتين أو أكثر تلامس تقريبا نفس القاع.
المعنى أن السعر حاول الهبوط أكثر من مرة، لكن منطقة معينة رفضت الهبوط.
يكون أقوى لو ظهر معه شمعة صاعدة أو كسر قمة صغيرة بعد النموذج.
اعمل متابعة عشان يوصلك كل جديد في سلسلة تعليم التداول.
محتوى تعليمي وليس نصيحة مالية.
#CandlestickPatterns #TradingEducation #PriceAction
52
دليل الشموع اليابانية #4
شمعة Doji
شمعة Doji تظهر عندما يكون سعر الافتتاح قريب جدا من سعر الإغلاق.
معناها الأساسي: تردد بين المشترين والبائعين.
تظهر كثيرا في مناطق القرار مثل الدعم، المقاومة، نهاية ترند قوي، أو قبل حركة حادة.
لكن الـ Doji وحدها ليست إشارة دخول. قيمتها تظهر عندما تأتي بعد اتجاه واضح ومع تأكيد من الشمعة التالية.
اعمل متابعة عشان يوصلك كل جديد في سلسلة تعليم التداول.
محتوى تعليمي وليس نصيحة مالية.
#CandlestickPatterns #TradingEducation #PriceAction
دليل الشموع اليابانية #4
شمعة Doji
شمعة Doji تظهر عندما يكون سعر الافتتاح قريب جدا من سعر الإغلاق.
معناها الأساسي: تردد بين المشترين والبائعين.
تظهر كثيرا في مناطق القرار مثل الدعم، المقاومة، نهاية ترند قوي، أو قبل حركة حادة.
لكن الـ Doji وحدها ليست إشارة دخول. قيمتها تظهر عندما تأتي بعد اتجاه واضح ومع تأكيد من الشمعة التالية.
اعمل متابعة عشان يوصلك كل جديد في سلسلة تعليم التداول.
محتوى تعليمي وليس نصيحة مالية.
#CandlestickPatterns #TradingEducation #PriceAction
شمعة Doji
شمعة Doji تظهر عندما يكون سعر الافتتاح قريب جدا من سعر الإغلاق.
معناها الأساسي: تردد بين المشترين والبائعين.
تظهر كثيرا في مناطق القرار مثل الدعم، المقاومة، نهاية ترند قوي، أو قبل حركة حادة.
لكن الـ Doji وحدها ليست إشارة دخول. قيمتها تظهر عندما تأتي بعد اتجاه واضح ومع تأكيد من الشمعة التالية.
اعمل متابعة عشان يوصلك كل جديد في سلسلة تعليم التداول.
محتوى تعليمي وليس نصيحة مالية.
#CandlestickPatterns #TradingEducation #PriceAction
96
دليل الشموع اليابانية #25
Inside Bar
Inside Bar يعني شمعة بالكامل داخل نطاق الشمعة السابقة.
غالبا يدل على هدوء أو تجميع مؤقت قبل حركة جديدة.
يستخدمه بعض المتداولين مع كسر قمة أو قاع الشمعة الأم.
لكن احذر: في الأسواق الجانبية قد يعطي كسر كاذب بسهولة، لذلك مكانه والسياق أهم من الشكل.
اعمل متابعة عشان يوصلك كل جديد في سلسلة تعليم التداول.
محتوى تعليمي وليس نصيحة مالية.
#CandlestickPatterns #TradingEducation #PriceAction
دليل الشموع اليابانية #25
Inside Bar
Inside Bar يعني شمعة بالكامل داخل نطاق الشمعة السابقة.
غالبا يدل على هدوء أو تجميع مؤقت قبل حركة جديدة.
يستخدمه بعض المتداولين مع كسر قمة أو قاع الشمعة الأم.
لكن احذر: في الأسواق الجانبية قد يعطي كسر كاذب بسهولة، لذلك مكانه والسياق أهم من الشكل.
اعمل متابعة عشان يوصلك كل جديد في سلسلة تعليم التداول.
محتوى تعليمي وليس نصيحة مالية.
#CandlestickPatterns #TradingEducation #PriceAction
Inside Bar
Inside Bar يعني شمعة بالكامل داخل نطاق الشمعة السابقة.
غالبا يدل على هدوء أو تجميع مؤقت قبل حركة جديدة.
يستخدمه بعض المتداولين مع كسر قمة أو قاع الشمعة الأم.
لكن احذر: في الأسواق الجانبية قد يعطي كسر كاذب بسهولة، لذلك مكانه والسياق أهم من الشكل.
اعمل متابعة عشان يوصلك كل جديد في سلسلة تعليم التداول.
محتوى تعليمي وليس نصيحة مالية.
#CandlestickPatterns #TradingEducation #PriceAction
66

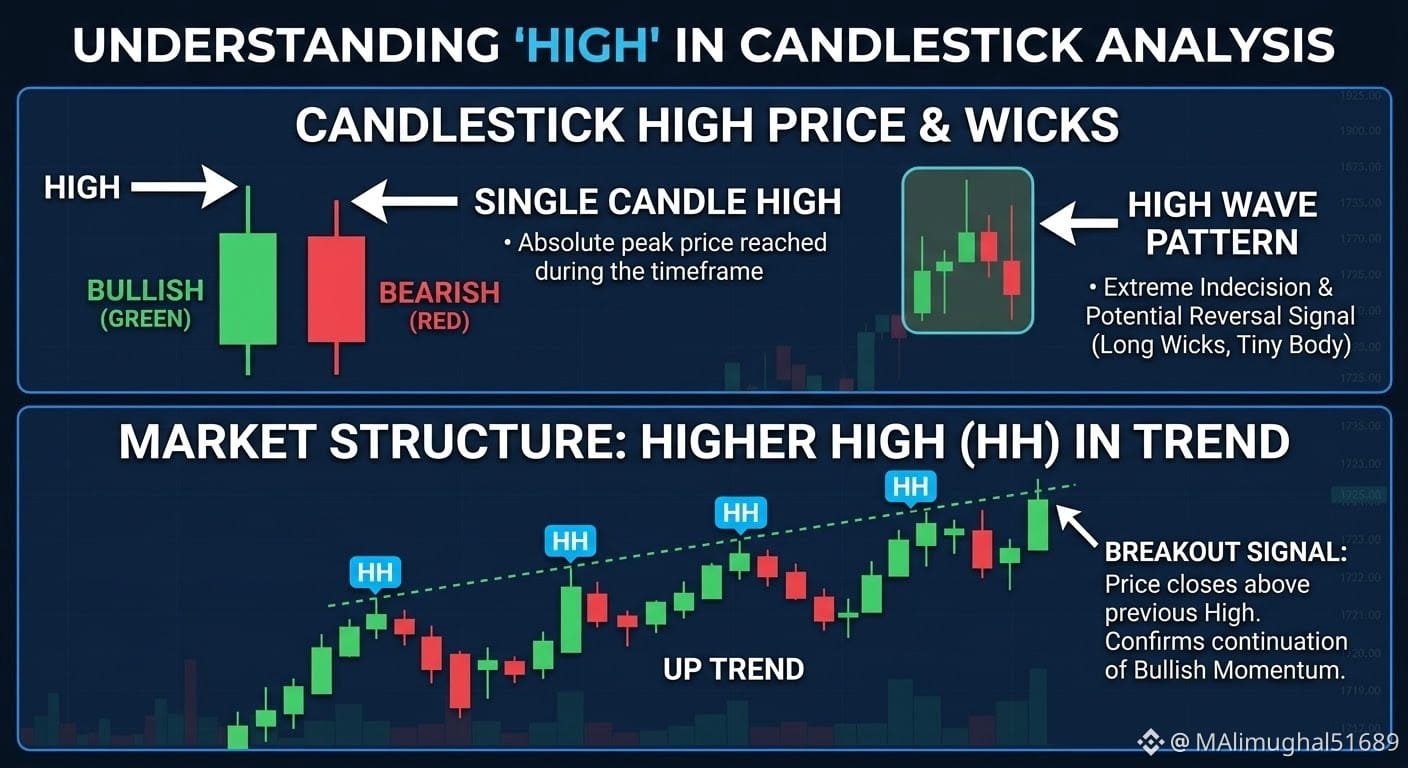
📈 Candlestick High & Trend Analysis: How to Understand Correct Market Signals?
When a High Wave Candle or Higher Highs (HH) start forming on the chart in trading, it clearly indicates that a major movement is coming to the market! ⚡
🔹 High Wave Candle: Signals market indecision and a potential Trend Reversal.
🔹 Higher High (HH): When the price breaks above the previous high, understand that the Bullish Trend is strengthening.
💡 Always trade with proper confirmation and risk management!
👉 What is your market prediction today — Bullish or Bearish? Let us know in the comments below! 👇
#CryptoTrading #Binance #TechnicalAnalysis #TradingTips #Bitcoin #CandlestickPatterns
📈 Candlestick High & Trend Analysis: How to Understand Correct Market Signals?
When a High Wave Candle or Higher Highs (HH) start forming on the chart in trading, it clearly indicates that a major movement is coming to the market! ⚡
🔹 High Wave Candle: Signals market indecision and a potential Trend Reversal.
🔹 Higher High (HH): When the price breaks above the previous high, understand that the Bullish Trend is strengthening.
💡 Always trade with proper confirmation and risk management!
👉 What is your market prediction today — Bullish or Bearish? Let us know in the comments below! 👇
#CryptoTrading #Binance #TechnicalAnalysis #TradingTips #Bitcoin #CandlestickPatterns
When a High Wave Candle or Higher Highs (HH) start forming on the chart in trading, it clearly indicates that a major movement is coming to the market! ⚡
🔹 High Wave Candle: Signals market indecision and a potential Trend Reversal.
🔹 Higher High (HH): When the price breaks above the previous high, understand that the Bullish Trend is strengthening.
💡 Always trade with proper confirmation and risk management!
👉 What is your market prediction today — Bullish or Bearish? Let us know in the comments below! 👇
#CryptoTrading #Binance #TechnicalAnalysis #TradingTips #Bitcoin #CandlestickPatterns
87

·
--
Article
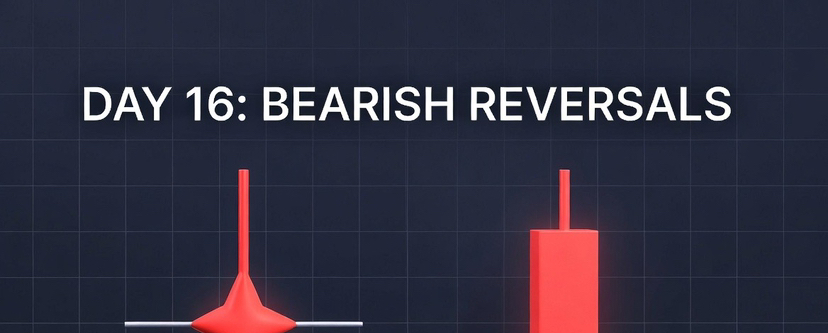
Introduction to Candlestick Patterns: Part 2Welcome to the sixteenth day of our educational series. Yesterday we explored how buyers assert their dominance at the bottom of a trend using the Hammer and Bullish Engulfing patterns. Today we are flipping the market script to study Bearish Reversal Patterns. Just as market floors give out signals, market tops drop clear visual clues when upward momentum is dying. Mastering these patterns allows you to lock in your profits at the absolute peak of a rally and protects your portfolio from devastating market crashes. Today we are breaking down two critical bearish signals: the Shooting Star and the Bearish Engulfing pattern.
The Shooting Star: Rejection at the Ceiling
The Shooting Star is a powerful single-candle bearish reversal pattern that forms at the peak of an aggressive uptrend. It serves as an immediate visual warning that a local price ceiling has been reached and that smart money is aggressively exiting the market.
* The Visual Structure: A Shooting Star features a very small real body at the absolute bottom of the candle, with little to no lower wick. The defining feature is an exceptionally long upper wick, which must be at least two to three times the size of the real body.
* The Market Psychology: When the session opens, buyers maintain total control and push the price rapidly upward, continuing the dominant bull trend. However, at the peak of the rally, a massive wave of institutional selling supply hits the order book. Sellers completely overwhelm the buyers, driving the price all the way back down to close near the absolute low of the session.
While the candle body can be either green or red, a red Shooting Star carries much higher bearish conviction because it proves that the session closed lower than it opened, marking a complete intraday victory for the sellers.
The Bearish Engulfing: Sellers Overwhelm the Market
The Bearish Engulfing is a two-candle reversal pattern that signals an abrupt, aggressive regime change from a bull market to a bear market. It represents a total structural takeover where selling pressure completely swallows the preceding upward momentum.
* The Visual Structure: This pattern consists of two consecutive candlesticks. The first candle is a small green bullish candle that continues the upward move. The second candle is a massive red bearish candle whose real body completely engulfs, or covers up, the entire real body of the first green candle from top to bottom.
* The Market Psychology: The session starts with an illusion of bullish continuity, but an explosive wave of distribution capital enters the market. Sellers force the price down so aggressively that the second candle closes significantly lower than the previous open, completely erasing the gains of the prior session.
When this pattern appears after a prolonged upward rally, it serves as a glaring warning sign that institutional distributors have taken the wheel and a major downward trend is about to begin.
Creator's Advice: Protect Your Gains at the Top
The single biggest mistake retail community members make is letting greed blind their risk management during a massive green rally. They see the price skyrocketing, ignore the structural patterns forming on the chart, and hold on indefinitely.
To utilize these bearish patterns effectively, look at them as exit triggers. If an asset you hold hits a major macro resistance ceiling, your RSI indicator shows an overbought reading above 70, and a prominent Shooting Star or Bearish Engulfing pattern prints on high volume, the market is telling you to step away. Do not hesitate or let emotion dictate your actions. Lock in your profits, tighten your stop-losses, or exit the market safely.
Tomorrow we will conclude our study of candlestick structures by looking at continuation patterns, teaching you how to identify when a trend is merely resting before blasting off again. For today, your practical task is to open your charting panel, find a prominent historical market peak on a 4-hour or 1-day chart, and identify whether a Shooting Star or a Bearish Engulfing candle marked the exact structural top before the downward trend began.
#TechnicalAnalysis #CandlestickPatterns #Shootingstar #day16
Introduction to Candlestick Patterns: Part 2
Welcome to the sixteenth day of our educational series. Yesterday we explored how buyers assert their dominance at the bottom of a trend using the Hammer and Bullish Engulfing patterns. Today we are flipping the market script to study Bearish Reversal Patterns. Just as market floors give out signals, market tops drop clear visual clues when upward momentum is dying. Mastering these patterns allows you to lock in your profits at the absolute peak of a rally and protects your portfolio from devastating market crashes. Today we are breaking down two critical bearish signals: the Shooting Star and the Bearish Engulfing pattern.
The Shooting Star: Rejection at the Ceiling
The Shooting Star is a powerful single-candle bearish reversal pattern that forms at the peak of an aggressive uptrend. It serves as an immediate visual warning that a local price ceiling has been reached and that smart money is aggressively exiting the market.
* The Visual Structure: A Shooting Star features a very small real body at the absolute bottom of the candle, with little to no lower wick. The defining feature is an exceptionally long upper wick, which must be at least two to three times the size of the real body.
* The Market Psychology: When the session opens, buyers maintain total control and push the price rapidly upward, continuing the dominant bull trend. However, at the peak of the rally, a massive wave of institutional selling supply hits the order book. Sellers completely overwhelm the buyers, driving the price all the way back down to close near the absolute low of the session.
While the candle body can be either green or red, a red Shooting Star carries much higher bearish conviction because it proves that the session closed lower than it opened, marking a complete intraday victory for the sellers.
The Bearish Engulfing: Sellers Overwhelm the Market
The Bearish Engulfing is a two-candle reversal pattern that signals an abrupt, aggressive regime change from a bull market to a bear market. It represents a total structural takeover where selling pressure completely swallows the preceding upward momentum.
* The Visual Structure: This pattern consists of two consecutive candlesticks. The first candle is a small green bullish candle that continues the upward move. The second candle is a massive red bearish candle whose real body completely engulfs, or covers up, the entire real body of the first green candle from top to bottom.
* The Market Psychology: The session starts with an illusion of bullish continuity, but an explosive wave of distribution capital enters the market. Sellers force the price down so aggressively that the second candle closes significantly lower than the previous open, completely erasing the gains of the prior session.
When this pattern appears after a prolonged upward rally, it serves as a glaring warning sign that institutional distributors have taken the wheel and a major downward trend is about to begin.
Creator's Advice: Protect Your Gains at the Top
The single biggest mistake retail community members make is letting greed blind their risk management during a massive green rally. They see the price skyrocketing, ignore the structural patterns forming on the chart, and hold on indefinitely.
To utilize these bearish patterns effectively, look at them as exit triggers. If an asset you hold hits a major macro resistance ceiling, your RSI indicator shows an overbought reading above 70, and a prominent Shooting Star or Bearish Engulfing pattern prints on high volume, the market is telling you to step away. Do not hesitate or let emotion dictate your actions. Lock in your profits, tighten your stop-losses, or exit the market safely.
Tomorrow we will conclude our study of candlestick structures by looking at continuation patterns, teaching you how to identify when a trend is merely resting before blasting off again. For today, your practical task is to open your charting panel, find a prominent historical market peak on a 4-hour or 1-day chart, and identify whether a Shooting Star or a Bearish Engulfing candle marked the exact structural top before the downward trend began.
#TechnicalAnalysis #CandlestickPatterns #Shootingstar #day16
The Shooting Star: Rejection at the Ceiling
The Shooting Star is a powerful single-candle bearish reversal pattern that forms at the peak of an aggressive uptrend. It serves as an immediate visual warning that a local price ceiling has been reached and that smart money is aggressively exiting the market.
* The Visual Structure: A Shooting Star features a very small real body at the absolute bottom of the candle, with little to no lower wick. The defining feature is an exceptionally long upper wick, which must be at least two to three times the size of the real body.
* The Market Psychology: When the session opens, buyers maintain total control and push the price rapidly upward, continuing the dominant bull trend. However, at the peak of the rally, a massive wave of institutional selling supply hits the order book. Sellers completely overwhelm the buyers, driving the price all the way back down to close near the absolute low of the session.
While the candle body can be either green or red, a red Shooting Star carries much higher bearish conviction because it proves that the session closed lower than it opened, marking a complete intraday victory for the sellers.
The Bearish Engulfing: Sellers Overwhelm the Market
The Bearish Engulfing is a two-candle reversal pattern that signals an abrupt, aggressive regime change from a bull market to a bear market. It represents a total structural takeover where selling pressure completely swallows the preceding upward momentum.
* The Visual Structure: This pattern consists of two consecutive candlesticks. The first candle is a small green bullish candle that continues the upward move. The second candle is a massive red bearish candle whose real body completely engulfs, or covers up, the entire real body of the first green candle from top to bottom.
* The Market Psychology: The session starts with an illusion of bullish continuity, but an explosive wave of distribution capital enters the market. Sellers force the price down so aggressively that the second candle closes significantly lower than the previous open, completely erasing the gains of the prior session.
When this pattern appears after a prolonged upward rally, it serves as a glaring warning sign that institutional distributors have taken the wheel and a major downward trend is about to begin.
Creator's Advice: Protect Your Gains at the Top
The single biggest mistake retail community members make is letting greed blind their risk management during a massive green rally. They see the price skyrocketing, ignore the structural patterns forming on the chart, and hold on indefinitely.
To utilize these bearish patterns effectively, look at them as exit triggers. If an asset you hold hits a major macro resistance ceiling, your RSI indicator shows an overbought reading above 70, and a prominent Shooting Star or Bearish Engulfing pattern prints on high volume, the market is telling you to step away. Do not hesitate or let emotion dictate your actions. Lock in your profits, tighten your stop-losses, or exit the market safely.
Tomorrow we will conclude our study of candlestick structures by looking at continuation patterns, teaching you how to identify when a trend is merely resting before blasting off again. For today, your practical task is to open your charting panel, find a prominent historical market peak on a 4-hour or 1-day chart, and identify whether a Shooting Star or a Bearish Engulfing candle marked the exact structural top before the downward trend began.
#TechnicalAnalysis #CandlestickPatterns #Shootingstar #day16
2
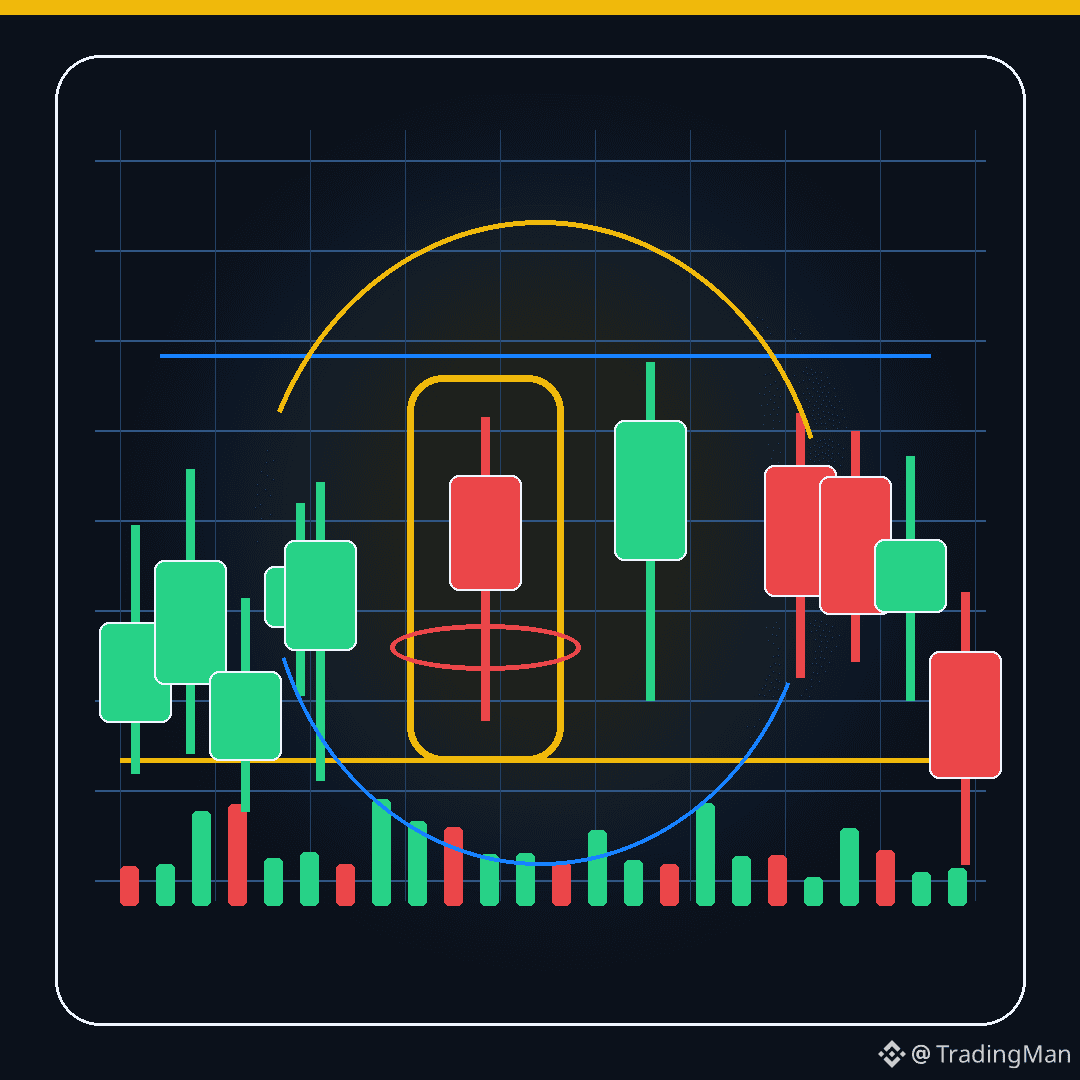
713
دليل الشموع اليابانية #28
الشموع مع حجم التداول
الشمعة القوية مع حجم تداول مرتفع تكون أهم من شمعة قوية بحجم ضعيف.
الفوليوم يساعدك تعرف هل الحركة مدعومة بمشاركة حقيقية أم مجرد حركة ضعيفة.
مثال: Bullish Engulfing عند دعم مع فوليوم عالي أقوى من نفس النموذج بدون فوليوم.
لا تجعل الفوليوم وحده قرارا، لكنه فلتر مهم جدا.
اعمل متابعة عشان يوصلك كل جديد في سلسلة تعليم التداول.
محتوى تعليمي وليس نصيحة مالية.
#CandlestickPatterns #TradingEducation #PriceAction
دليل الشموع اليابانية #28
الشموع مع حجم التداول
الشمعة القوية مع حجم تداول مرتفع تكون أهم من شمعة قوية بحجم ضعيف.
الفوليوم يساعدك تعرف هل الحركة مدعومة بمشاركة حقيقية أم مجرد حركة ضعيفة.
مثال: Bullish Engulfing عند دعم مع فوليوم عالي أقوى من نفس النموذج بدون فوليوم.
لا تجعل الفوليوم وحده قرارا، لكنه فلتر مهم جدا.
اعمل متابعة عشان يوصلك كل جديد في سلسلة تعليم التداول.
محتوى تعليمي وليس نصيحة مالية.
#CandlestickPatterns #TradingEducation #PriceAction
الشموع مع حجم التداول
الشمعة القوية مع حجم تداول مرتفع تكون أهم من شمعة قوية بحجم ضعيف.
الفوليوم يساعدك تعرف هل الحركة مدعومة بمشاركة حقيقية أم مجرد حركة ضعيفة.
مثال: Bullish Engulfing عند دعم مع فوليوم عالي أقوى من نفس النموذج بدون فوليوم.
لا تجعل الفوليوم وحده قرارا، لكنه فلتر مهم جدا.
اعمل متابعة عشان يوصلك كل جديد في سلسلة تعليم التداول.
محتوى تعليمي وليس نصيحة مالية.
#CandlestickPatterns #TradingEducation #PriceAction
119
·
--

Article
Introduction to Candlestick Patterns: Part 1Welcome to the fifteenth day of our educational series, marking the official start of our third week! Over the past week, we mastered individual technical indicators like moving averages, the RSI, and volume. Now, we are going to combine that knowledge with structural price action by studying Candlestick Patterns. While a single candlestick tells you the price story of a specific timeframe, certain combinations of candles create reliable visual shapes that signal exactly when a trend is losing power and a major reversal is about to begin. Today, we are focusing on two of the most powerful bullish reversal signals: the Hammer and the Bullish Engulfing pattern.
The Hammer: Hammering Out a Market Floor
The Hammer is a single-candle reversal pattern that forms at the bottom of a distinct downtrend. It is one of the most recognizable and heavily traded signals in technical market analysis because it provides a crystal clear map of institutional rejection.
* The Visual Structure: A Hammer has a very small real body at the absolute top of the candle, with little to no upper wick. The defining feature is its extremely long lower wick, which must be at least two to three times the size of the real body.
* The Market Psychology: When the candle opens, sellers aggressively push the market down, continuing the dominant downtrend and creating a long lower shadow. However, before the timeframe closes, a massive wave of buying demand steps in at a key support zone. These buyers completely overpower the sellers, forcing the price all the way back up to close near the opening level.
The color of the Hammer can be either red or green, but a green Hammer carries stronger bullish conviction because it proves that buyers didn't just reject the lows, they completely took over the session to close higher than where it started.
The Bullish Engulfing: Buyers Take Total Control
Unlike the Hammer, the Bullish Engulfing is a two-candle reversal pattern that signals a sudden, aggressive shift in market regime. It represents a total regime change where buyers completely overwhelm the preceding selling momentum.
* The Visual Structure: This pattern consists of two consecutive candlesticks. The first candle is a small red bearish candle continuing the downward trend. The second candle is a massive green bullish candle whose real body completely engulfs, or covers up, the entire real body of the first red candle from top to bottom.
* The Market Psychology: The session starts with sellers still in control, but an explosive influx of capital enters the order book. Buyers drive the price up so forcefully that the second candle opens lower than the previous close but closes significantly higher than the previous open.
This pattern is a glaring neon sign that the dominant bear trend has completely run out of gas, and aggressive buyers have stepped in to drive the next macro wave upward.
Creator's Advice: Never Trade Patterns in Isolation
The absolute biggest mistake a market participant can make is trading candlestick patterns blindly whenever they appear on a chart. If you buy every single Hammer or Engulfing pattern you spot in the middle of a chaotic, choppy sideways market, you will quickly deplete your trading capital.
To trade these patterns successfully, you must use them as confirmation tools at established areas of interest. A Hammer only carries high probability weight when it forms directly on a proven macro support floor, right as the RSI indicator hits an oversold reading below 30, and is backed by a rising trading volume bar. When multiple technical layers align at the exact same coordinate, your probability of execution success sky-rockets.
Tomorrow, we will flip the script and look at the exact opposite side of price action, mastering Bearish Reversal Patterns like the Shooting Star and the Bearish Engulfing to protect your portfolio from sudden market tops. For today, your practical task is to open your charting panel, find a historical market bottom on a 4-hour chart, and identify whether a Hammer or a Bullish Engulfing candle kicked off the upward reversal.
#TechnicalAnalysis #CandlestickPatterns
Introduction to Candlestick Patterns: Part 1
Welcome to the fifteenth day of our educational series, marking the official start of our third week! Over the past week, we mastered individual technical indicators like moving averages, the RSI, and volume. Now, we are going to combine that knowledge with structural price action by studying Candlestick Patterns. While a single candlestick tells you the price story of a specific timeframe, certain combinations of candles create reliable visual shapes that signal exactly when a trend is losing power and a major reversal is about to begin. Today, we are focusing on two of the most powerful bullish reversal signals: the Hammer and the Bullish Engulfing pattern.
The Hammer: Hammering Out a Market Floor
The Hammer is a single-candle reversal pattern that forms at the bottom of a distinct downtrend. It is one of the most recognizable and heavily traded signals in technical market analysis because it provides a crystal clear map of institutional rejection.
* The Visual Structure: A Hammer has a very small real body at the absolute top of the candle, with little to no upper wick. The defining feature is its extremely long lower wick, which must be at least two to three times the size of the real body.
* The Market Psychology: When the candle opens, sellers aggressively push the market down, continuing the dominant downtrend and creating a long lower shadow. However, before the timeframe closes, a massive wave of buying demand steps in at a key support zone. These buyers completely overpower the sellers, forcing the price all the way back up to close near the opening level.
The color of the Hammer can be either red or green, but a green Hammer carries stronger bullish conviction because it proves that buyers didn't just reject the lows, they completely took over the session to close higher than where it started.
The Bullish Engulfing: Buyers Take Total Control
Unlike the Hammer, the Bullish Engulfing is a two-candle reversal pattern that signals a sudden, aggressive shift in market regime. It represents a total regime change where buyers completely overwhelm the preceding selling momentum.
* The Visual Structure: This pattern consists of two consecutive candlesticks. The first candle is a small red bearish candle continuing the downward trend. The second candle is a massive green bullish candle whose real body completely engulfs, or covers up, the entire real body of the first red candle from top to bottom.
* The Market Psychology: The session starts with sellers still in control, but an explosive influx of capital enters the order book. Buyers drive the price up so forcefully that the second candle opens lower than the previous close but closes significantly higher than the previous open.
This pattern is a glaring neon sign that the dominant bear trend has completely run out of gas, and aggressive buyers have stepped in to drive the next macro wave upward.
Creator's Advice: Never Trade Patterns in Isolation
The absolute biggest mistake a market participant can make is trading candlestick patterns blindly whenever they appear on a chart. If you buy every single Hammer or Engulfing pattern you spot in the middle of a chaotic, choppy sideways market, you will quickly deplete your trading capital.
To trade these patterns successfully, you must use them as confirmation tools at established areas of interest. A Hammer only carries high probability weight when it forms directly on a proven macro support floor, right as the RSI indicator hits an oversold reading below 30, and is backed by a rising trading volume bar. When multiple technical layers align at the exact same coordinate, your probability of execution success sky-rockets.
Tomorrow, we will flip the script and look at the exact opposite side of price action, mastering Bearish Reversal Patterns like the Shooting Star and the Bearish Engulfing to protect your portfolio from sudden market tops. For today, your practical task is to open your charting panel, find a historical market bottom on a 4-hour chart, and identify whether a Hammer or a Bullish Engulfing candle kicked off the upward reversal.
#TechnicalAnalysis #CandlestickPatterns
The Hammer: Hammering Out a Market Floor
The Hammer is a single-candle reversal pattern that forms at the bottom of a distinct downtrend. It is one of the most recognizable and heavily traded signals in technical market analysis because it provides a crystal clear map of institutional rejection.
* The Visual Structure: A Hammer has a very small real body at the absolute top of the candle, with little to no upper wick. The defining feature is its extremely long lower wick, which must be at least two to three times the size of the real body.
* The Market Psychology: When the candle opens, sellers aggressively push the market down, continuing the dominant downtrend and creating a long lower shadow. However, before the timeframe closes, a massive wave of buying demand steps in at a key support zone. These buyers completely overpower the sellers, forcing the price all the way back up to close near the opening level.
The color of the Hammer can be either red or green, but a green Hammer carries stronger bullish conviction because it proves that buyers didn't just reject the lows, they completely took over the session to close higher than where it started.
The Bullish Engulfing: Buyers Take Total Control
Unlike the Hammer, the Bullish Engulfing is a two-candle reversal pattern that signals a sudden, aggressive shift in market regime. It represents a total regime change where buyers completely overwhelm the preceding selling momentum.
* The Visual Structure: This pattern consists of two consecutive candlesticks. The first candle is a small red bearish candle continuing the downward trend. The second candle is a massive green bullish candle whose real body completely engulfs, or covers up, the entire real body of the first red candle from top to bottom.
* The Market Psychology: The session starts with sellers still in control, but an explosive influx of capital enters the order book. Buyers drive the price up so forcefully that the second candle opens lower than the previous close but closes significantly higher than the previous open.
This pattern is a glaring neon sign that the dominant bear trend has completely run out of gas, and aggressive buyers have stepped in to drive the next macro wave upward.
Creator's Advice: Never Trade Patterns in Isolation
The absolute biggest mistake a market participant can make is trading candlestick patterns blindly whenever they appear on a chart. If you buy every single Hammer or Engulfing pattern you spot in the middle of a chaotic, choppy sideways market, you will quickly deplete your trading capital.
To trade these patterns successfully, you must use them as confirmation tools at established areas of interest. A Hammer only carries high probability weight when it forms directly on a proven macro support floor, right as the RSI indicator hits an oversold reading below 30, and is backed by a rising trading volume bar. When multiple technical layers align at the exact same coordinate, your probability of execution success sky-rockets.
Tomorrow, we will flip the script and look at the exact opposite side of price action, mastering Bearish Reversal Patterns like the Shooting Star and the Bearish Engulfing to protect your portfolio from sudden market tops. For today, your practical task is to open your charting panel, find a historical market bottom on a 4-hour chart, and identify whether a Hammer or a Bullish Engulfing candle kicked off the upward reversal.
#TechnicalAnalysis #CandlestickPatterns
6
8
797

·
--
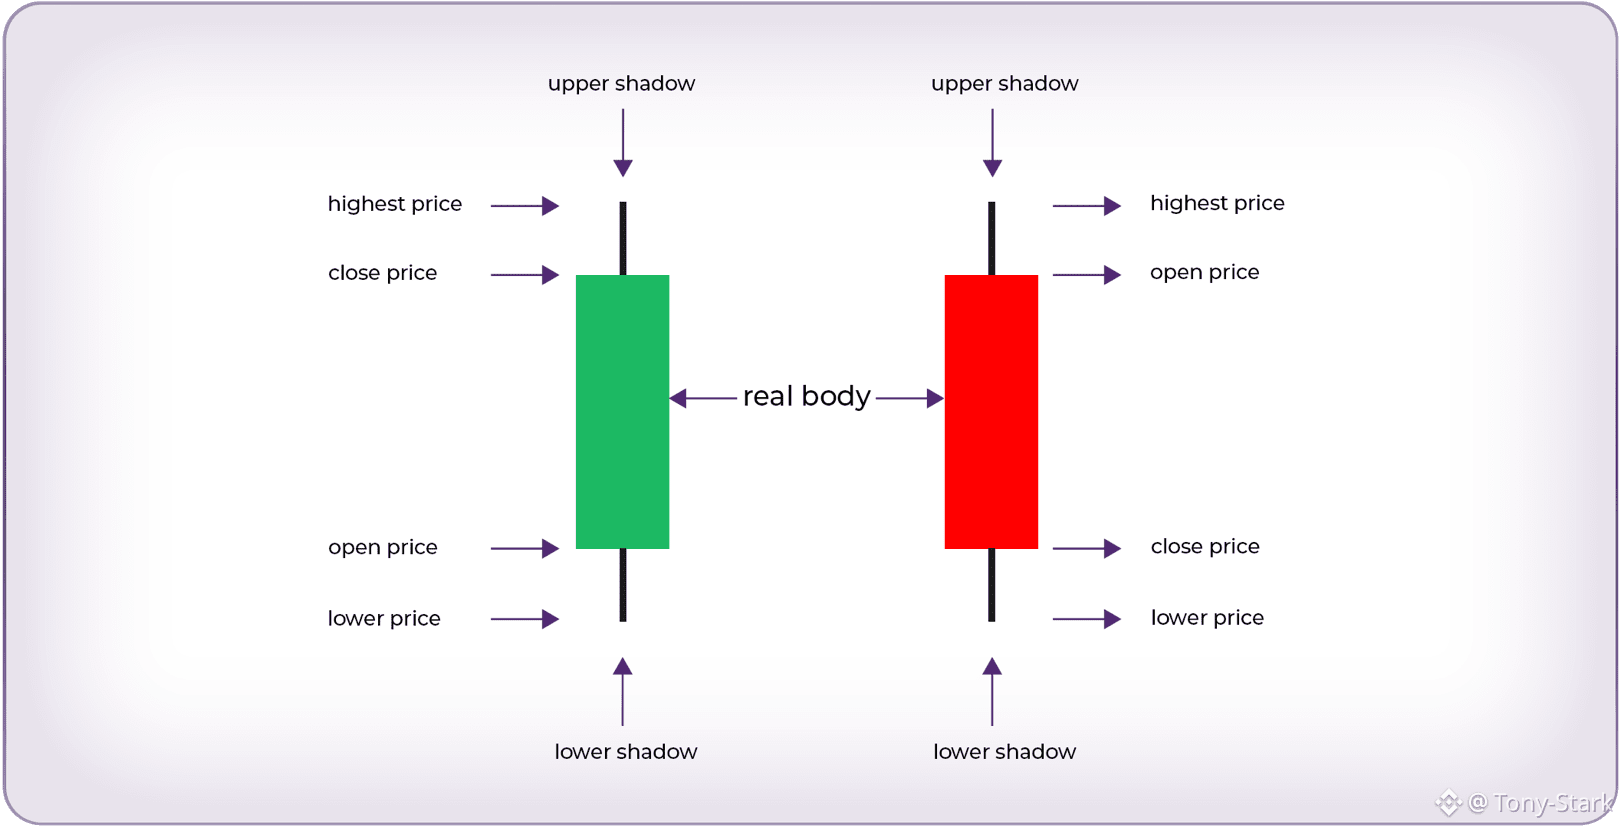
Master These 15 Candlestick Patterns & Trade Like a Pro!
In crypto trading, your edge isn’t signals or luck—it’s pattern recognition. The market always leaves clues, and candlesticks are one of the clearest ways to read price behavior.
Here are 15 key candlestick patterns every serious trader should know, split into bullish, bearish, and indecision:
🟢 Bullish (Reversal Up)
• Bullish Engulfing – Big green candle fully absorbs red = buyers in control
• Tweezer Bottom – Equal lows = strong support
• Morning Star – Red → small candle → green = reversal
• Hammer – Long lower wick = rejection of downside
• Inverted Hammer – Early reversal signal after drop
• Three Inside Up – Structured bullish reversal confirmation
• Three White Soldiers – Three strong green candles = momentum shift
🔴 Bearish (Reversal Down)
• Bearish Engulfing – Large red swallows green = sellers dominate
• Tweezer Top – Equal highs = strong resistance
• Evening Star – Uptrend fades into reversal
• Shooting Star – Long upper wick = failed breakout
• Three Black Crows – Three strong red candles = strong bearish pressure
• Three Inside Down – Breakdown confirmation after weakness
⚪ Indecision (Wait & Watch)
• Spinning Top – Market battle, no clear control
• Doji – Open ≈ close = total uncertainty
⚠️ Bonus Rule:
Candlestick patterns are NOT standalone signals. Always confirm with volume, support/resistance, or indicators like RSI/MACD.
Save this. Study it.
Because traders don’t guess—they read price.
#CandlestickPatterns #TradingEducation
Master These 15 Candlestick Patterns & Trade Like a Pro!
In crypto trading, your edge isn’t signals or luck—it’s pattern recognition. The market always leaves clues, and candlesticks are one of the clearest ways to read price behavior.
Here are 15 key candlestick patterns every serious trader should know, split into bullish, bearish, and indecision:
🟢 Bullish (Reversal Up)
• Bullish Engulfing – Big green candle fully absorbs red = buyers in control
• Tweezer Bottom – Equal lows = strong support
• Morning Star – Red → small candle → green = reversal
• Hammer – Long lower wick = rejection of downside
• Inverted Hammer – Early reversal signal after drop
• Three Inside Up – Structured bullish reversal confirmation
• Three White Soldiers – Three strong green candles = momentum shift
🔴 Bearish (Reversal Down)
• Bearish Engulfing – Large red swallows green = sellers dominate
• Tweezer Top – Equal highs = strong resistance
• Evening Star – Uptrend fades into reversal
• Shooting Star – Long upper wick = failed breakout
• Three Black Crows – Three strong red candles = strong bearish pressure
• Three Inside Down – Breakdown confirmation after weakness
⚪ Indecision (Wait & Watch)
• Spinning Top – Market battle, no clear control
• Doji – Open ≈ close = total uncertainty
⚠️ Bonus Rule:
Candlestick patterns are NOT standalone signals. Always confirm with volume, support/resistance, or indicators like RSI/MACD.
Save this. Study it.
Because traders don’t guess—they read price.
#CandlestickPatterns #TradingEducation
In crypto trading, your edge isn’t signals or luck—it’s pattern recognition. The market always leaves clues, and candlesticks are one of the clearest ways to read price behavior.
Here are 15 key candlestick patterns every serious trader should know, split into bullish, bearish, and indecision:
🟢 Bullish (Reversal Up)
• Bullish Engulfing – Big green candle fully absorbs red = buyers in control
• Tweezer Bottom – Equal lows = strong support
• Morning Star – Red → small candle → green = reversal
• Hammer – Long lower wick = rejection of downside
• Inverted Hammer – Early reversal signal after drop
• Three Inside Up – Structured bullish reversal confirmation
• Three White Soldiers – Three strong green candles = momentum shift
🔴 Bearish (Reversal Down)
• Bearish Engulfing – Large red swallows green = sellers dominate
• Tweezer Top – Equal highs = strong resistance
• Evening Star – Uptrend fades into reversal
• Shooting Star – Long upper wick = failed breakout
• Three Black Crows – Three strong red candles = strong bearish pressure
• Three Inside Down – Breakdown confirmation after weakness
⚪ Indecision (Wait & Watch)
• Spinning Top – Market battle, no clear control
• Doji – Open ≈ close = total uncertainty
⚠️ Bonus Rule:
Candlestick patterns are NOT standalone signals. Always confirm with volume, support/resistance, or indicators like RSI/MACD.
Save this. Study it.
Because traders don’t guess—they read price.
#CandlestickPatterns #TradingEducation
295

·
--
တက်ရိပ်ရှိသည်
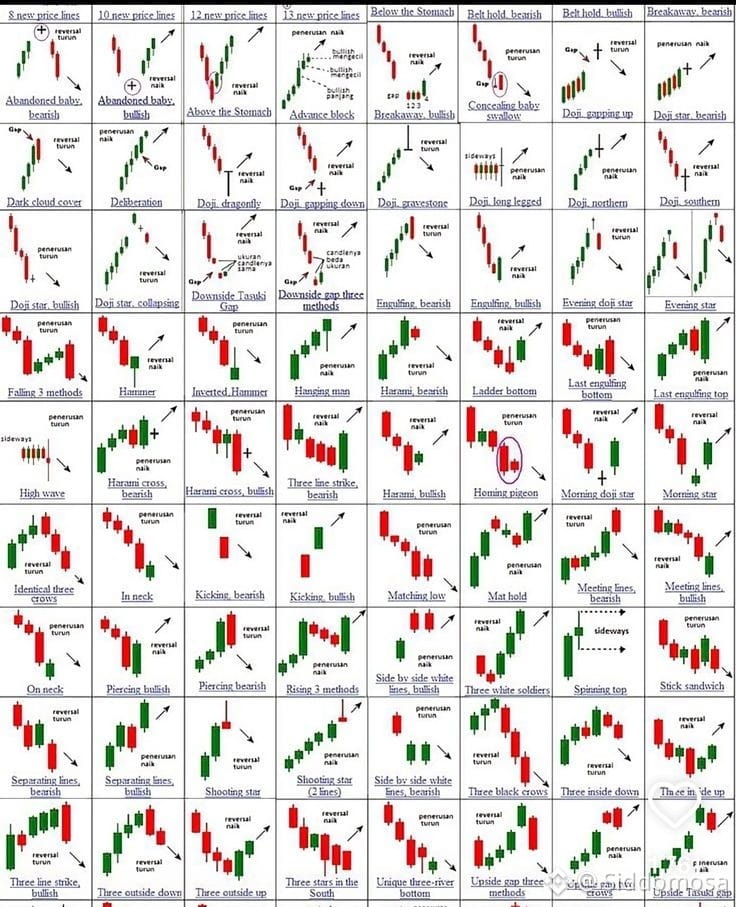
📊 MASTER $THE MARKET WITH CANDLESTICK PATTERNS 📈
Trading is not just about buying and selling — it’s about understanding the story behind every candle.
Learn the power of candlestick patterns and improve your market analysis like a pro trader. 🔥
✅ Identify Market Reversals
✅ Spot Bullish & Bearish Trends
✅ Improve Entry & Exit Points
✅ Trade with Confidence & Discipline
✅ Understand Price Action Better
✅ Build Smart Trading Strategies
✅ Reduce Emotional Trading Mistakes
✅ Learn Risk Management Techniques
✅ Follow the Trend, Not the Noise
✅ Patience + Strategy = Success 💹
📚 Every candle tells a story. Smart traders know how to read it.
🚀 Start learning, stay focused, and grow your trading journey one chart at a time.
#Forex #Trading #CandlestickPatterns #Crypto #StockMarket #TechnicalAnalysis #ForexTrading #DayTrading #PriceAction #Investing #TraderLife #CryptoTrading #Bullish #Bearish #Finance #MarketAnalysis #TradingStrategy #SmartMoney #FinancialFreedom #Charts
📊 MASTER $THE MARKET WITH CANDLESTICK PATTERNS 📈
Trading is not just about buying and selling — it’s about understanding the story behind every candle.
Learn the power of candlestick patterns and improve your market analysis like a pro trader. 🔥
✅ Identify Market Reversals
✅ Spot Bullish & Bearish Trends
✅ Improve Entry & Exit Points
✅ Trade with Confidence & Discipline
✅ Understand Price Action Better
✅ Build Smart Trading Strategies
✅ Reduce Emotional Trading Mistakes
✅ Learn Risk Management Techniques
✅ Follow the Trend, Not the Noise
✅ Patience + Strategy = Success 💹
📚 Every candle tells a story. Smart traders know how to read it.
🚀 Start learning, stay focused, and grow your trading journey one chart at a time.
#Forex #Trading #CandlestickPatterns #Crypto #StockMarket #TechnicalAnalysis #ForexTrading #DayTrading #PriceAction #Investing #TraderLife #CryptoTrading #Bullish #Bearish #Finance #MarketAnalysis #TradingStrategy #SmartMoney #FinancialFreedom #Charts
Trading is not just about buying and selling — it’s about understanding the story behind every candle.
Learn the power of candlestick patterns and improve your market analysis like a pro trader. 🔥
✅ Identify Market Reversals
✅ Spot Bullish & Bearish Trends
✅ Improve Entry & Exit Points
✅ Trade with Confidence & Discipline
✅ Understand Price Action Better
✅ Build Smart Trading Strategies
✅ Reduce Emotional Trading Mistakes
✅ Learn Risk Management Techniques
✅ Follow the Trend, Not the Noise
✅ Patience + Strategy = Success 💹
📚 Every candle tells a story. Smart traders know how to read it.
🚀 Start learning, stay focused, and grow your trading journey one chart at a time.
#Forex #Trading #CandlestickPatterns #Crypto #StockMarket #TechnicalAnalysis #ForexTrading #DayTrading #PriceAction #Investing #TraderLife #CryptoTrading #Bullish #Bearish #Finance #MarketAnalysis #TradingStrategy #SmartMoney #FinancialFreedom #Charts
248

·
--
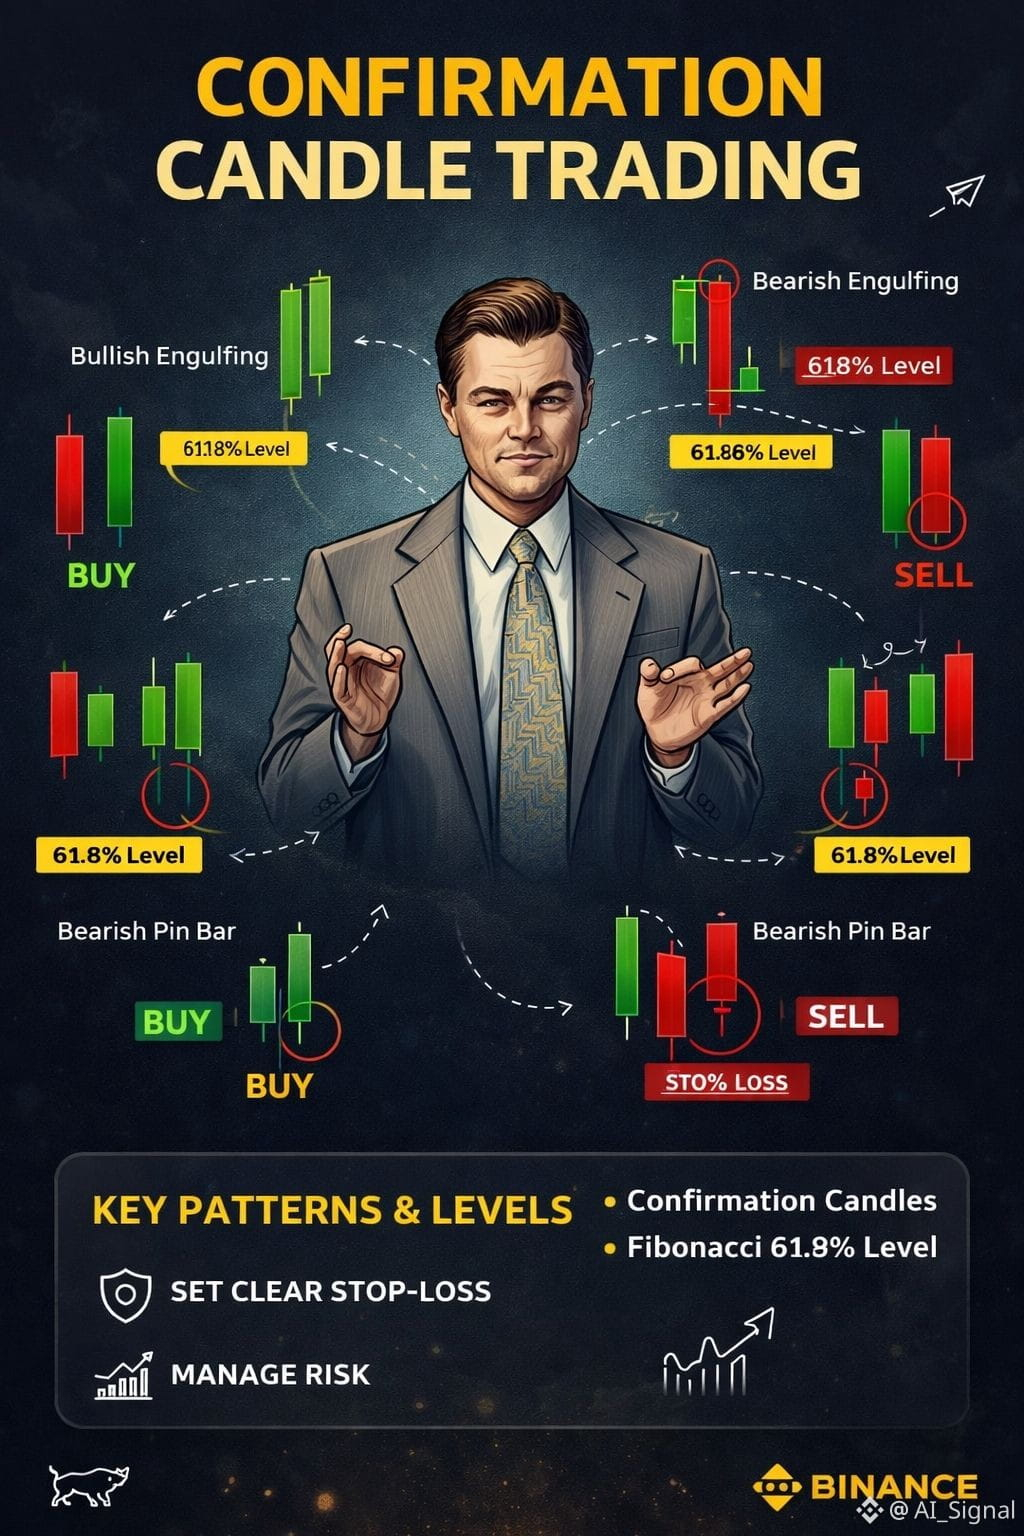
🔥 Master Confirmation Candles for Smarter Trades 🔥
Unlock the power of candlestick signals with this hand-drawn breakdown. From classic reversal patterns to key Fibonacci levels (like the golden 61.8%), these setups help refine your entries and exits with precision.
🛡️ Risk management is non‑negotiable: set clear stop‑losses, protect your capital, and let the charts work for you.
📈 Trade with discipline, not emotion.
#TradingEducation #CandlestickPatterns
#RiskManagement #BinanceSquare
$BTC $ETH $BNB
🔥 Master Confirmation Candles for Smarter Trades 🔥
Unlock the power of candlestick signals with this hand-drawn breakdown. From classic reversal patterns to key Fibonacci levels (like the golden 61.8%), these setups help refine your entries and exits with precision.
🛡️ Risk management is non‑negotiable: set clear stop‑losses, protect your capital, and let the charts work for you.
📈 Trade with discipline, not emotion.
#TradingEducation #CandlestickPatterns
#RiskManagement #BinanceSquare
$BTC $ETH $BNB
Unlock the power of candlestick signals with this hand-drawn breakdown. From classic reversal patterns to key Fibonacci levels (like the golden 61.8%), these setups help refine your entries and exits with precision.
🛡️ Risk management is non‑negotiable: set clear stop‑losses, protect your capital, and let the charts work for you.
📈 Trade with discipline, not emotion.
#TradingEducation #CandlestickPatterns
#RiskManagement #BinanceSquare
$BTC $ETH $BNB
1
2
67
·
--
ကျရိပ်ရှိသည်
How to Read a Simple Candlestick Chart (3 Patterns Every Beginner Should Know)
Candlestick charts look complicated at first, but they’re just a visual way to show price movement over time. Once you understand one candle, you can start reading the whole chart like a story: who is winning buyers or sellers and where price might go next.
This guide breaks candlesticks down in the simplest way and shows 3 beginner-friendly patterns you can spot on Binance charts.
1) What a candlestick actually shows
Each candlestick represents price movement during a specific time period (example: 1 minute, 15 minutes, 1 hour, 1 day).
A candle has 4 key prices:
Open: where price started in that time period
Close: where price ended
High: the highest price reached
Low: the lowest price reached
Candle parts
Body: the thick part between open and close
Wicks (shadows): the thin lines above/below the body showing highs/lows
Green vs Red (basic meaning)
Green candle: price closed higher than it opened (buyers stronger)
Red candle: price closed lower than it opened (sellers stronger)
Tip: A big body often means strong momentum. A small body often means indecision.
2) Timeframes matter (don’t mix signals)
A pattern on a 1-minute chart can fail quickly. A pattern on a 4-hour or daily chart is usually more meaningful.
If you’re a beginner, start with:
1H for short-term learning
4H / 1D for clearer signals and less noise
3) 3 candlestick patterns to know (beginner-friendly)
Pattern #1: Hammer (possible reversal up)
What it looks like:
Small body near the top
Long lower wick (tail)
Little or no upper wick
Meaning: Sellers pushed price down, but buyers bought strongly and pushed it back up before close. This can signal selling pressure is weakening.
Best place to use it: After a downtrend or at a support zone.
Beginner rule: Don’t buy just because you saw a hammer wait for the next candle to close green as confirmation
#Binance
#Crypto
#CryptoTrading
#TradingBasics
#CandlestickPatterns
How to Read a Simple Candlestick Chart (3 Patterns Every Beginner Should Know)
Candlestick charts look complicated at first, but they’re just a visual way to show price movement over time. Once you understand one candle, you can start reading the whole chart like a story: who is winning buyers or sellers and where price might go next.
This guide breaks candlesticks down in the simplest way and shows 3 beginner-friendly patterns you can spot on Binance charts.
1) What a candlestick actually shows
Each candlestick represents price movement during a specific time period (example: 1 minute, 15 minutes, 1 hour, 1 day).
A candle has 4 key prices:
Open: where price started in that time period
Close: where price ended
High: the highest price reached
Low: the lowest price reached
Candle parts
Body: the thick part between open and close
Wicks (shadows): the thin lines above/below the body showing highs/lows
Green vs Red (basic meaning)
Green candle: price closed higher than it opened (buyers stronger)
Red candle: price closed lower than it opened (sellers stronger)
Tip: A big body often means strong momentum. A small body often means indecision.
2) Timeframes matter (don’t mix signals)
A pattern on a 1-minute chart can fail quickly. A pattern on a 4-hour or daily chart is usually more meaningful.
If you’re a beginner, start with:
1H for short-term learning
4H / 1D for clearer signals and less noise
3) 3 candlestick patterns to know (beginner-friendly)
Pattern #1: Hammer (possible reversal up)
What it looks like:
Small body near the top
Long lower wick (tail)
Little or no upper wick
Meaning: Sellers pushed price down, but buyers bought strongly and pushed it back up before close. This can signal selling pressure is weakening.
Best place to use it: After a downtrend or at a support zone.
Beginner rule: Don’t buy just because you saw a hammer wait for the next candle to close green as confirmation
#Binance
#Crypto
#CryptoTrading
#TradingBasics
#CandlestickPatterns
Candlestick charts look complicated at first, but they’re just a visual way to show price movement over time. Once you understand one candle, you can start reading the whole chart like a story: who is winning buyers or sellers and where price might go next.
This guide breaks candlesticks down in the simplest way and shows 3 beginner-friendly patterns you can spot on Binance charts.
1) What a candlestick actually shows
Each candlestick represents price movement during a specific time period (example: 1 minute, 15 minutes, 1 hour, 1 day).
A candle has 4 key prices:
Open: where price started in that time period
Close: where price ended
High: the highest price reached
Low: the lowest price reached
Candle parts
Body: the thick part between open and close
Wicks (shadows): the thin lines above/below the body showing highs/lows
Green vs Red (basic meaning)
Green candle: price closed higher than it opened (buyers stronger)
Red candle: price closed lower than it opened (sellers stronger)
Tip: A big body often means strong momentum. A small body often means indecision.
2) Timeframes matter (don’t mix signals)
A pattern on a 1-minute chart can fail quickly. A pattern on a 4-hour or daily chart is usually more meaningful.
If you’re a beginner, start with:
1H for short-term learning
4H / 1D for clearer signals and less noise
3) 3 candlestick patterns to know (beginner-friendly)
Pattern #1: Hammer (possible reversal up)
What it looks like:
Small body near the top
Long lower wick (tail)
Little or no upper wick
Meaning: Sellers pushed price down, but buyers bought strongly and pushed it back up before close. This can signal selling pressure is weakening.
Best place to use it: After a downtrend or at a support zone.
Beginner rule: Don’t buy just because you saw a hammer wait for the next candle to close green as confirmation
#Binance
#Crypto
#CryptoTrading
#TradingBasics
#CandlestickPatterns
179
Log in to explore more content
Join global crypto users on Binance Square
⚡️ Get latest and useful information about crypto.
💬 Trusted by the world’s largest crypto exchange.
👍 Discover real insights from verified creators.
အီးမေးလ် / ဖုန်းနံပါတ်
ရေပန်းစားနေသော ခေါင်းစဉ်များ
1
#ZcashETFPostsFirstWeeklyOutflow$93.6M
10,134 views
44 Discussing
2
#GreekPoliceBustCryptoScamRingArrest17
13,854 views
232 Discussing
3
#BitcoinRejectedAt$87K
77,491 views
108 Discussing
4
#FedOctoberRateHikeOddsFallTo17%
45,550 views
630 Discussing
5
#NvidiaHitsRecordHighUp2.4%
25,489 views
429 Discussing
6
#CanaryFilesAmendedS1ForPEPEETF
10,177 views
283 Discussing
7
#USRussiaUkraineTalksReportedlyIncludeLukoilOilDeal
18,553 views
330 Discussing
8
#BitcoinParesGainsAfterRallyTo$86.5K
41,829 views
155 Discussing
9
#CerebrasSinksNearly20%OnReportNvidiaToPowerOpenAI
95,724 views
940 Discussing
10
#SECProposesCryptoCustodyRules
123,860 views
1,164 Discussing