

Dewy Candles
45 ໂພສ

Dewy Candles
ລາຍງານ
ບລັອກຜູ້ໃຊ້
3 ກໍາລັງຕິດຕາມ
224 ຜູ້ຕິດຕາມ
176 Liked
ໂພສ
ທັງໝົດ
ວົງຢືມ
·
--
What if I tell you $BTC will revisit $65k from now till January 2027?
What happens afterwards? Full-blown #BullRunAhead
I used #AI with my #smartmoney institutional in-depth market knowledge to run a #quantum cross-matrix research on the Top sectors that will take a huge leap along with the incoming bull run, and it came up with 7 sectors and 35 coins in total (top 5 in each sector).
In no particular order, here are 3 out of the 35.
1. $ARB
{spot}(ARBUSDT)
2. $PYTH
{spot}(PYTHUSDT)
React or comment to see the full list or how did the cross matrix analysis. 😊
What if I tell you $BTC will revisit $65k from now till January 2027?
What happens afterwards? Full-blown #BullRunAhead
I used #AI with my #smartmoney institutional in-depth market knowledge to run a #quantum cross-matrix research on the Top sectors that will take a huge leap along with the incoming bull run, and it came up with 7 sectors and 35 coins in total (top 5 in each sector).
In no particular order, here are 3 out of the 35.
1. $ARB
2. $PYTH
React or comment to see the full list or how did the cross matrix analysis. 😊
What happens afterwards? Full-blown #BullRunAhead
I used #AI with my #smartmoney institutional in-depth market knowledge to run a #quantum cross-matrix research on the Top sectors that will take a huge leap along with the incoming bull run, and it came up with 7 sectors and 35 coins in total (top 5 in each sector).
In no particular order, here are 3 out of the 35.
1. $ARB
2. $PYTH
React or comment to see the full list or how did the cross matrix analysis. 😊
1
213
·
--
Started testing out my algorithm, and here is one of the trades it has taken. No more manual trading; rather, automated trading based on an ultra-refined, cross-matrixed, quantum, institutional strategy tested on 3 - 4 walk-forward analyses.
Soon I'll launch my copy trading for selected few; you might be lucky to top the list.
Ever heard of Walk-Forward Analysis (WFA)? I bet the majority haven't. If you're among the few, leave your thoughts on your encounters
Started testing out my algorithm, and here is one of the trades it has taken. No more manual trading; rather, automated trading based on an ultra-refined, cross-matrixed, quantum, institutional strategy tested on 3 - 4 walk-forward analyses.
Soon I'll launch my copy trading for selected few; you might be lucky to top the list.
Ever heard of Walk-Forward Analysis (WFA)? I bet the majority haven't. If you're among the few, leave your thoughts on your encounters
Soon I'll launch my copy trading for selected few; you might be lucky to top the list.
Ever heard of Walk-Forward Analysis (WFA)? I bet the majority haven't. If you're among the few, leave your thoughts on your encounters
1
508
·
--
What's on your mind? Why only a 5% allocation to $$BTC ? Ask, and I'll tell you.
What's on your mind? Why only a 5% allocation to $$BTC ? Ask, and I'll tell you.
1
95
·
--
Binance has restricted me from posting for a long time because of my region. Hope it works now, because I've unpacked so many gems 💎 for this space.
So, if you see this, react to enable me to begin unpacking all the life-changing tips for your trading career.
Binance has restricted me from posting for a long time because of my region. Hope it works now, because I've unpacked so many gems 💎 for this space.
So, if you see this, react to enable me to begin unpacking all the life-changing tips for your trading career.
So, if you see this, react to enable me to begin unpacking all the life-changing tips for your trading career.
1
3
·
--
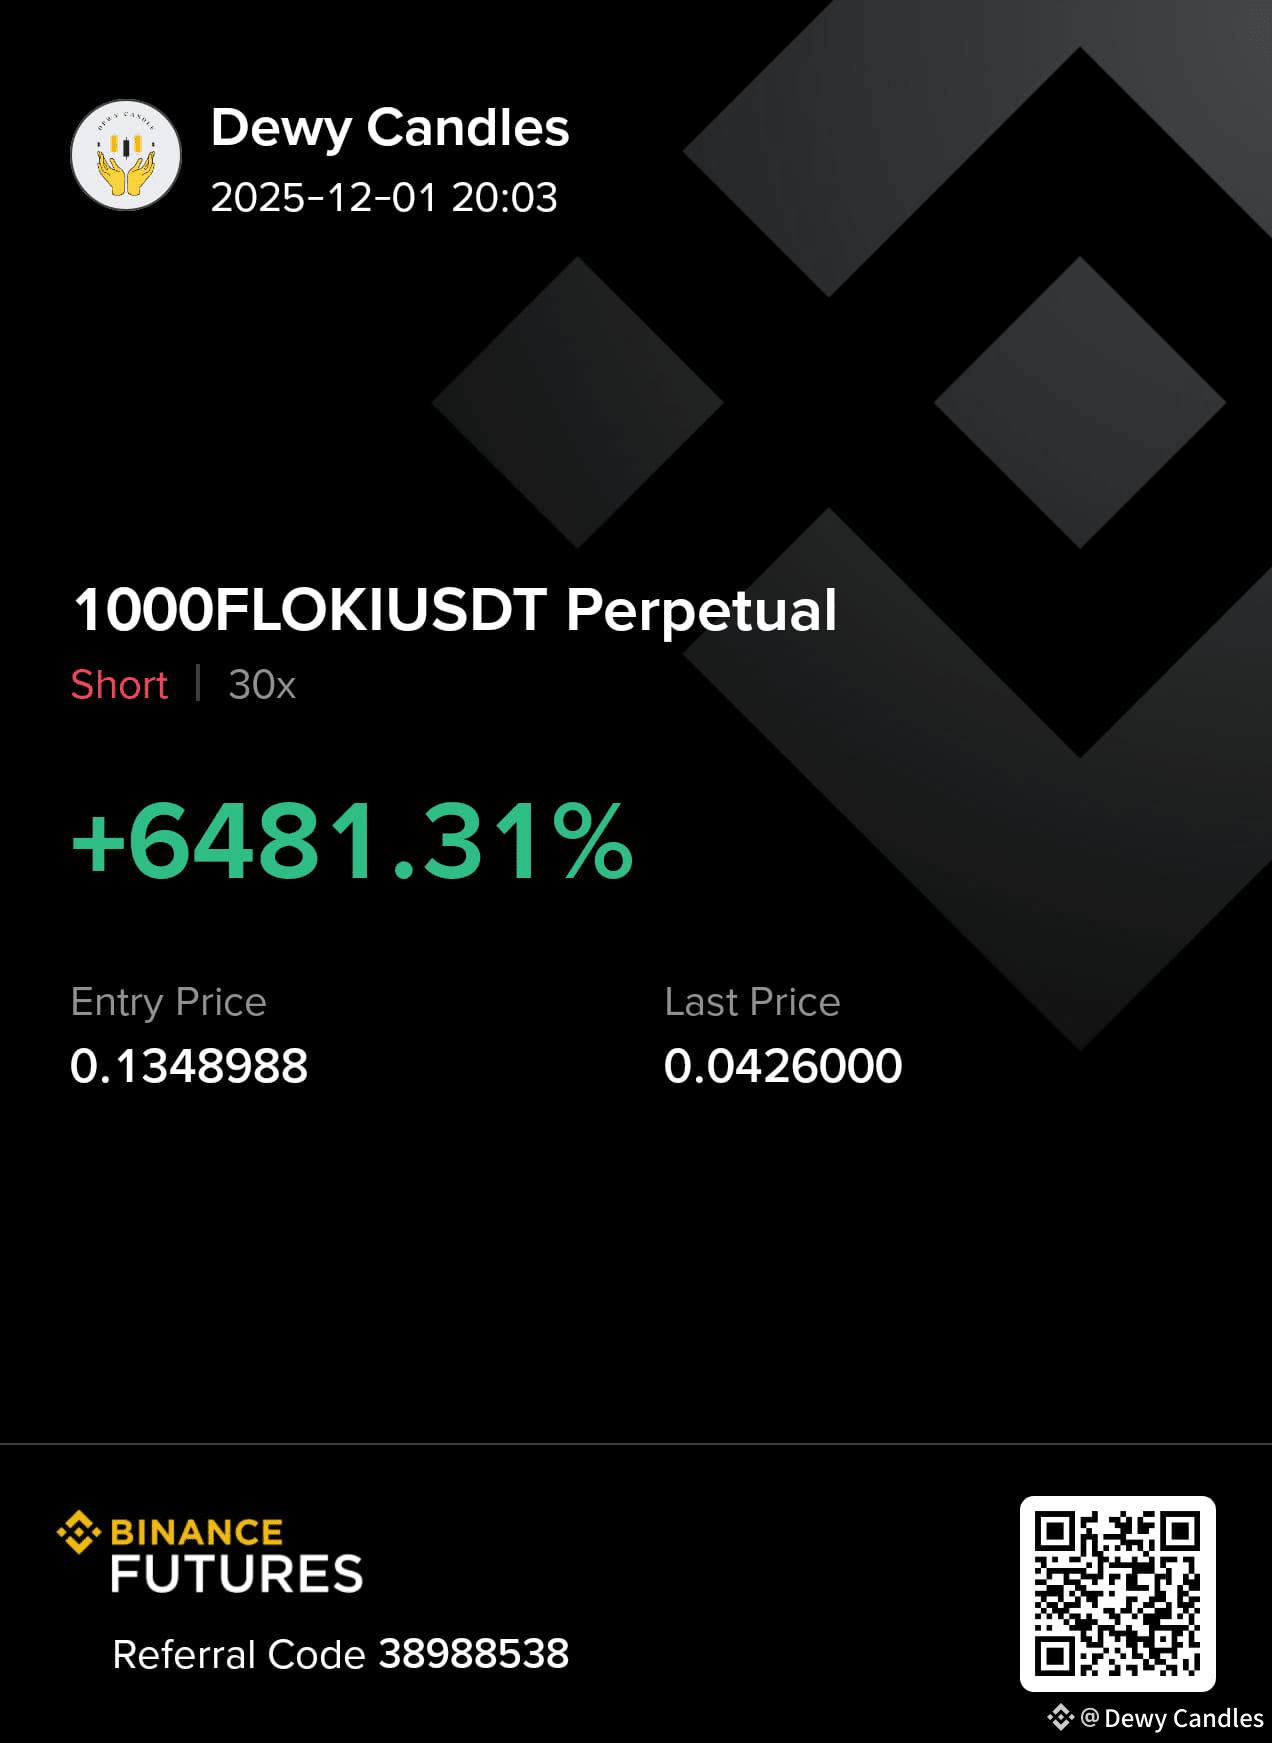
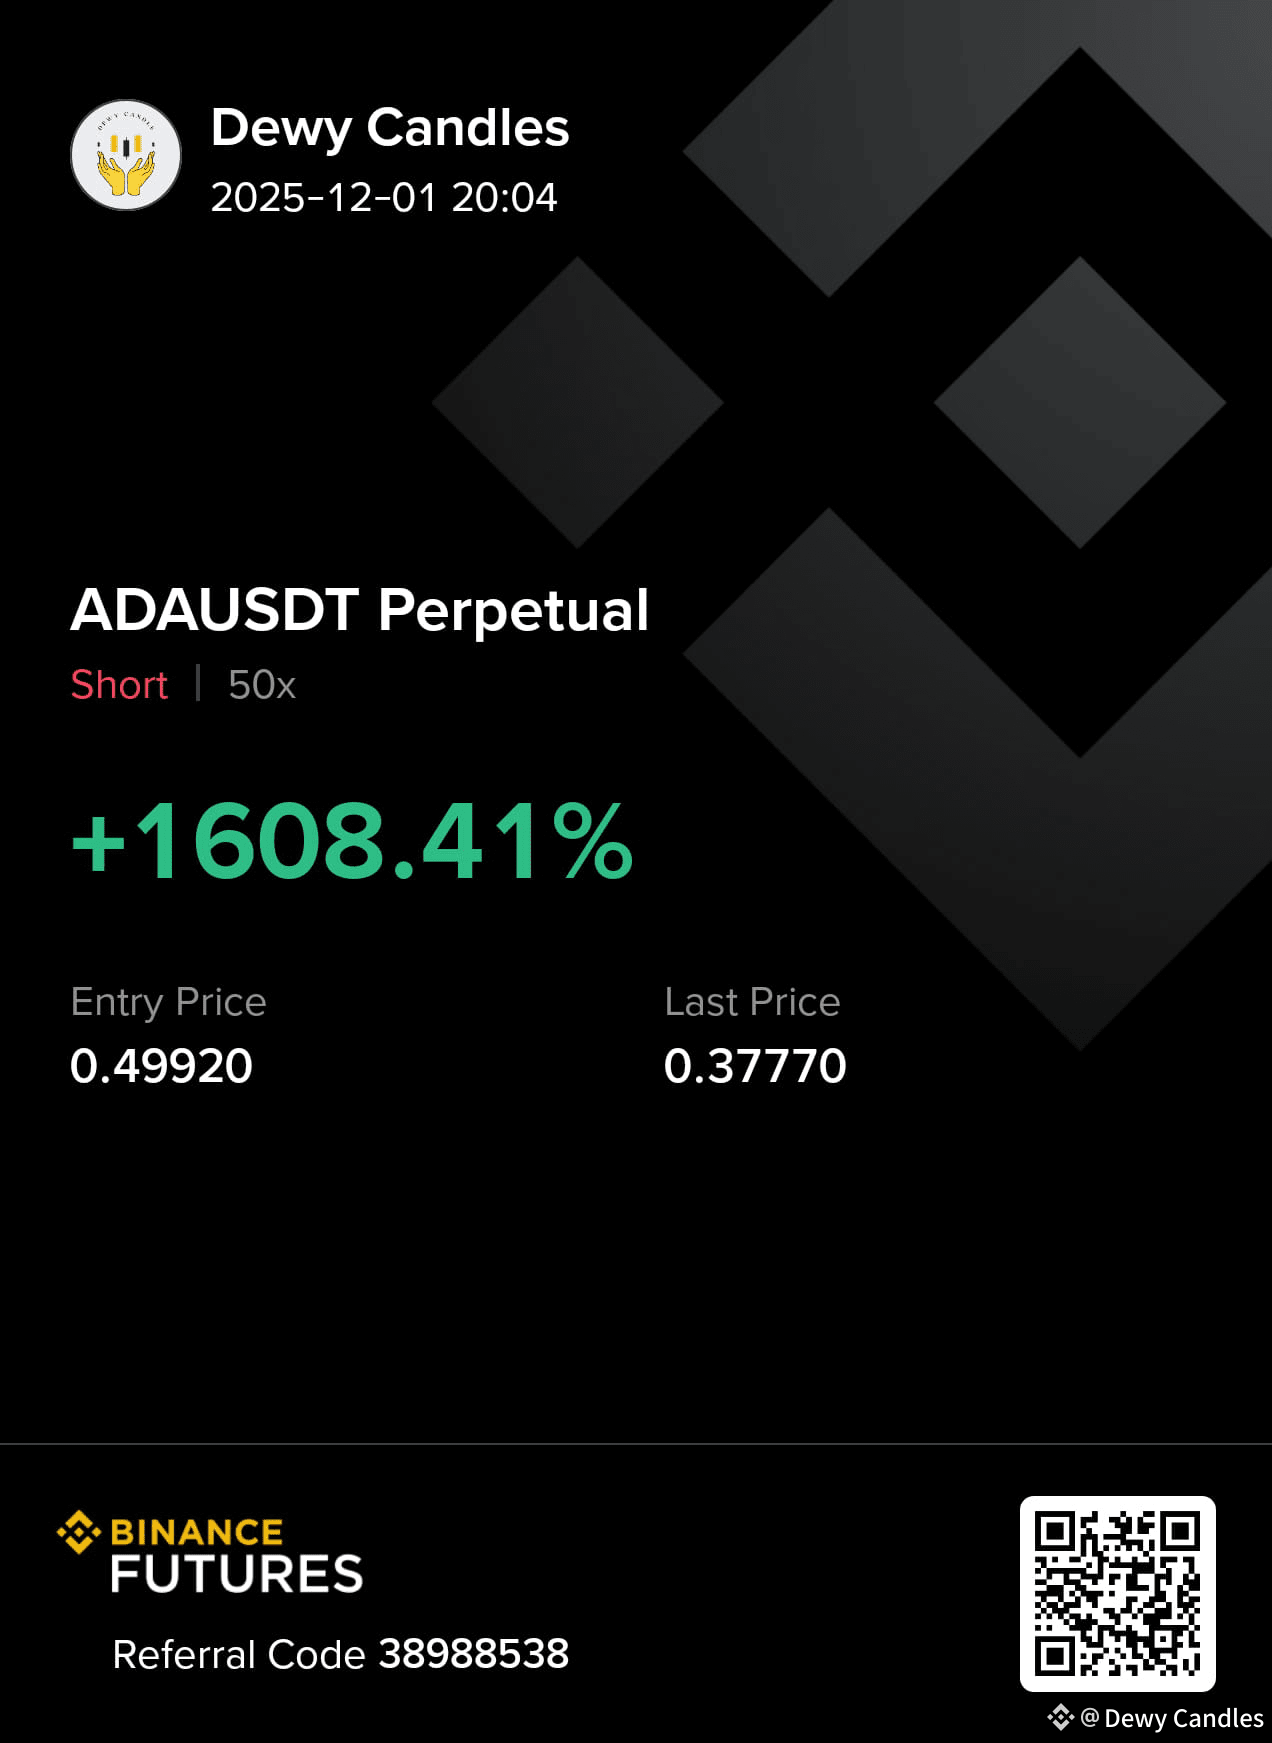
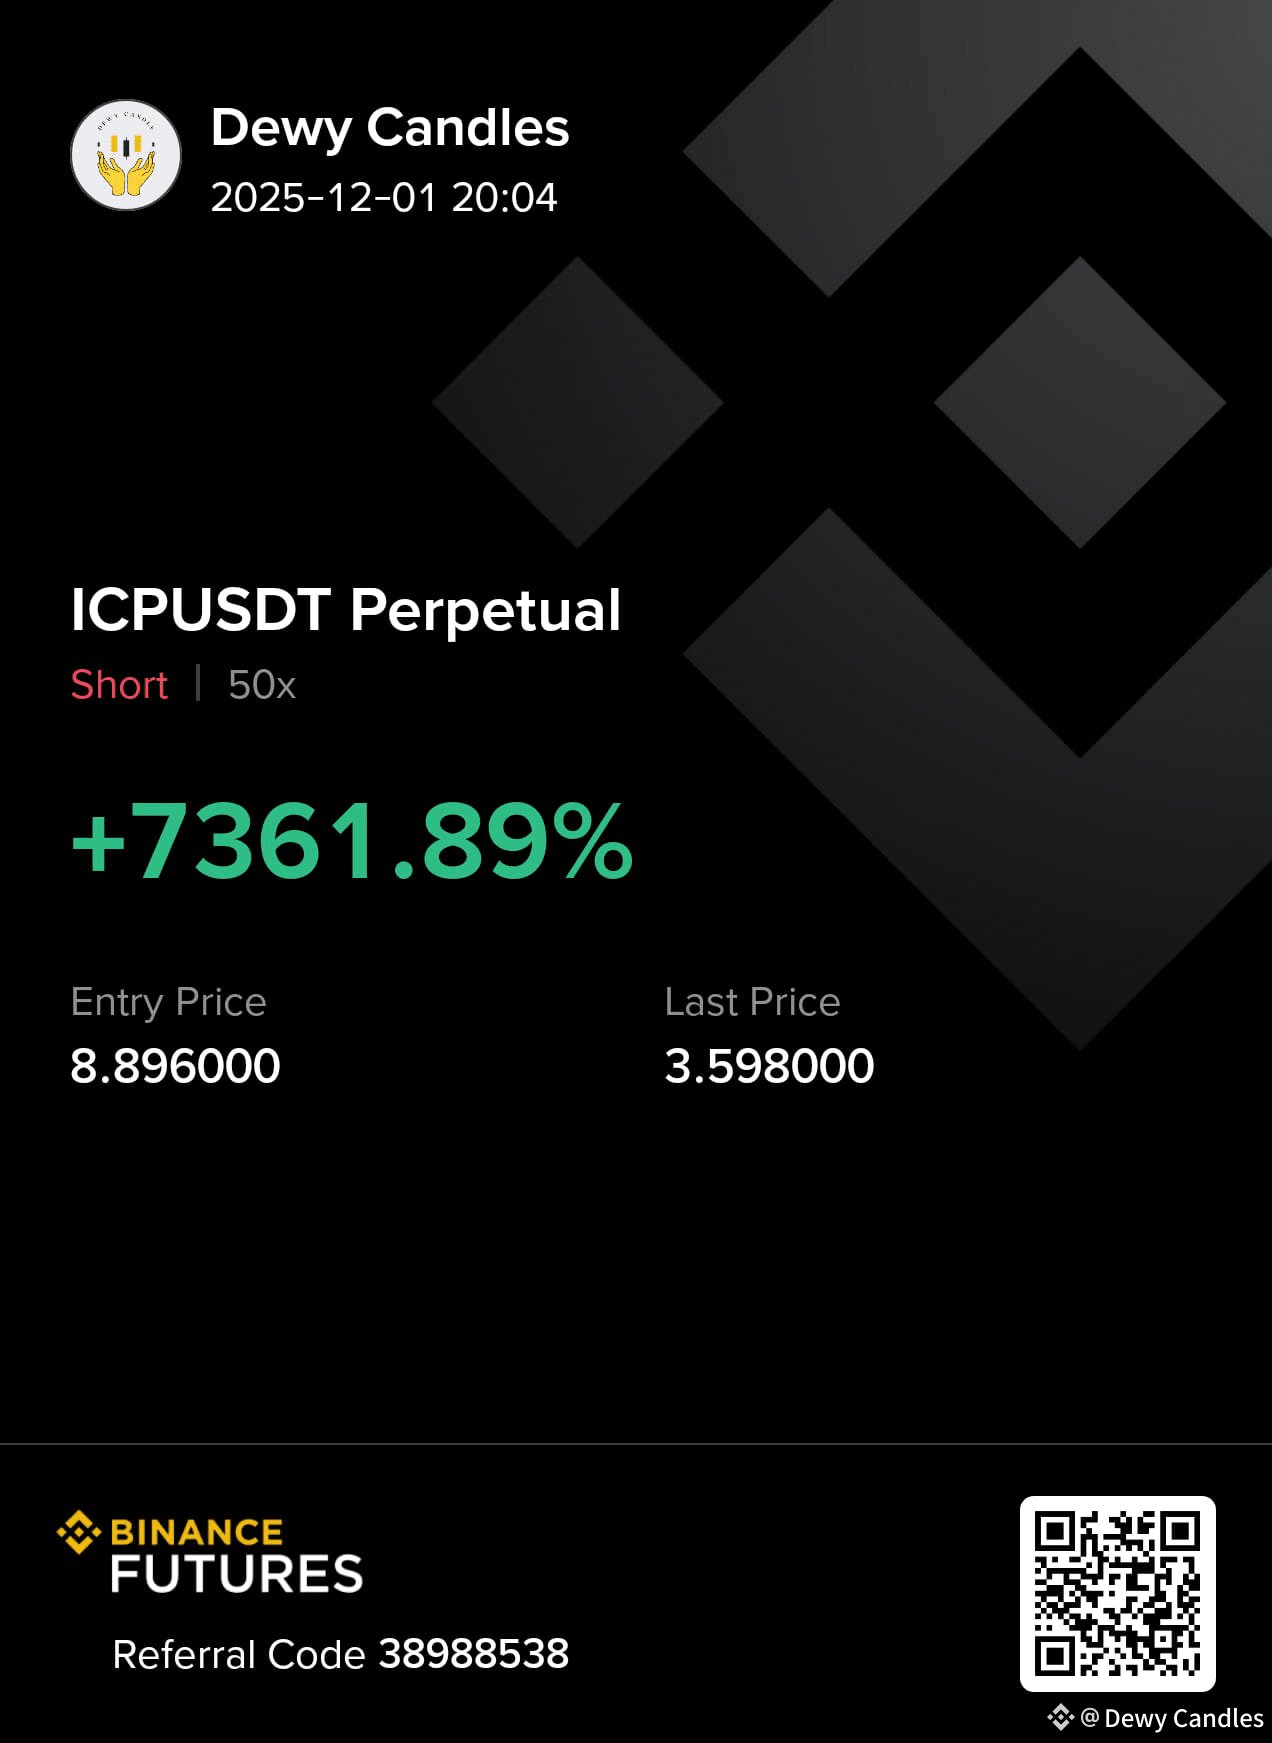
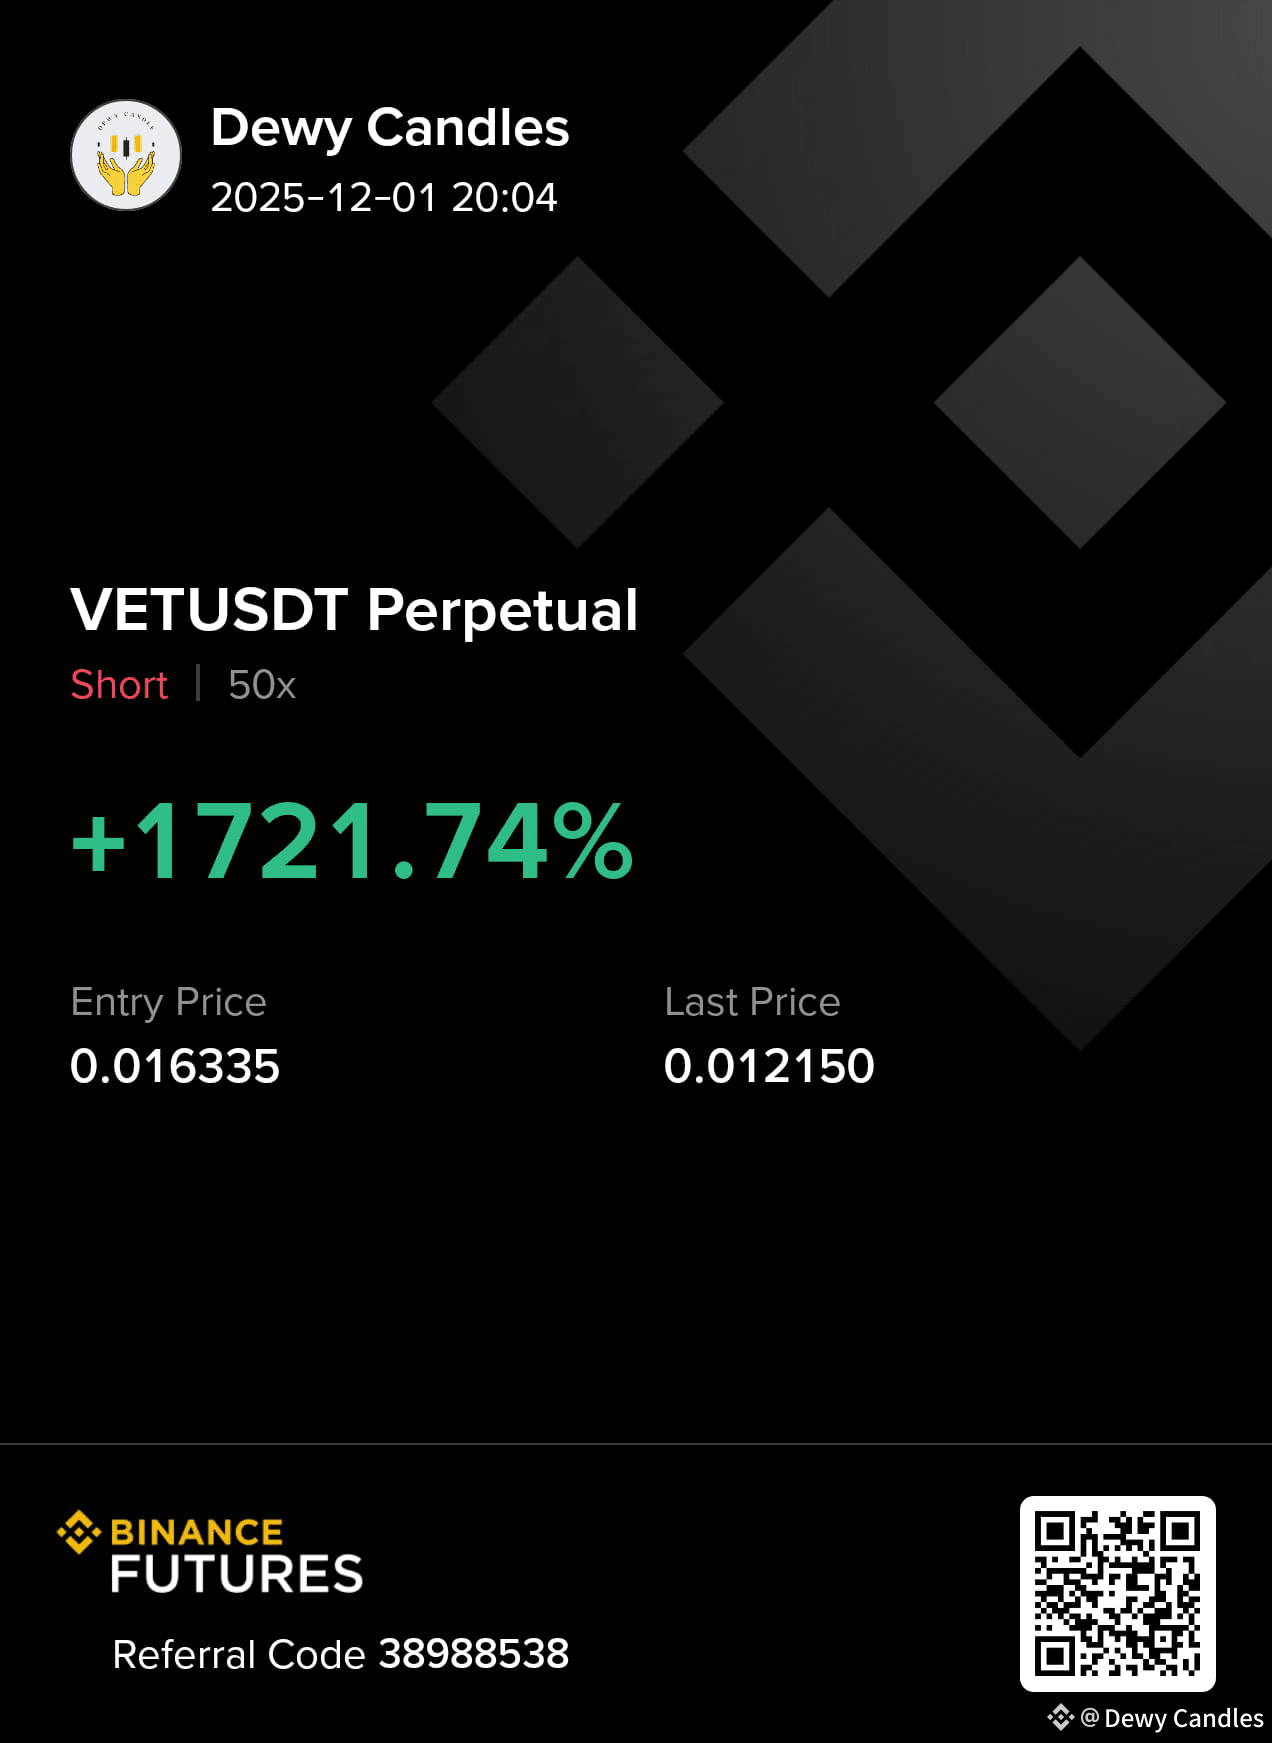
Yearly Trading Reflection - 2025After a full year of refining my edge, what I do now looks deceptively simple on a chart, yet it’s surprisingly hard to explain in words. It feels like I finally found the “cheat code” to the market: a repeatable process that just works, over and over, without forcing anything.The biggest milestones I’ve hit:
Complete removal of emotion from execution. The chart either meets my criteria or it doesn’t; there’s no hope, revenge, or FOMO left in the equation.Crystal-clear entry and exit rules that I follow blindly. No second-guessing, no “maybe this time it’s different.”Minimum 5:1 risk-reward on every setup (most are 8-15:1). If it doesn’t offer that, I simply don’t trade.I finally trust the process 100 %—even during inevitable drawdowns—because the math and historical edge are undeniable.Zero paralysis from social media noise. I muted 95 % of trading Twitter a long time ago and have never traded better.
The irony is that the method itself is now stupidly simple to apply in real time, yet when I try to write a full thread explaining every nuance, it turns into a novel. Some things are apparently easier done than said.One year ago I was still overcomplicating everything, hunting for new indicators, jumping on every “hot” narrative, and letting other people’s charts influence my plan. Today, the simplicity is the superpower. Less truly became more.Grateful for the journey, the losses that taught me, and the quiet confidence that finally replaced the noise. Here’s to keeping it simple and staying free in 2026.
Yearly Trading Reflection - 2025
After a full year of refining my edge, what I do now looks deceptively simple on a chart, yet it’s surprisingly hard to explain in words. It feels like I finally found the “cheat code” to the market: a repeatable process that just works, over and over, without forcing anything.The biggest milestones I’ve hit:
Complete removal of emotion from execution. The chart either meets my criteria or it doesn’t; there’s no hope, revenge, or FOMO left in the equation.Crystal-clear entry and exit rules that I follow blindly. No second-guessing, no “maybe this time it’s different.”Minimum 5:1 risk-reward on every setup (most are 8-15:1). If it doesn’t offer that, I simply don’t trade.I finally trust the process 100 %—even during inevitable drawdowns—because the math and historical edge are undeniable.Zero paralysis from social media noise. I muted 95 % of trading Twitter a long time ago and have never traded better.
The irony is that the method itself is now stupidly simple to apply in real time, yet when I try to write a full thread explaining every nuance, it turns into a novel. Some things are apparently easier done than said.One year ago I was still overcomplicating everything, hunting for new indicators, jumping on every “hot” narrative, and letting other people’s charts influence my plan. Today, the simplicity is the superpower. Less truly became more.Grateful for the journey, the losses that taught me, and the quiet confidence that finally replaced the noise. Here’s to keeping it simple and staying free in 2026.
Complete removal of emotion from execution. The chart either meets my criteria or it doesn’t; there’s no hope, revenge, or FOMO left in the equation.Crystal-clear entry and exit rules that I follow blindly. No second-guessing, no “maybe this time it’s different.”Minimum 5:1 risk-reward on every setup (most are 8-15:1). If it doesn’t offer that, I simply don’t trade.I finally trust the process 100 %—even during inevitable drawdowns—because the math and historical edge are undeniable.Zero paralysis from social media noise. I muted 95 % of trading Twitter a long time ago and have never traded better.
The irony is that the method itself is now stupidly simple to apply in real time, yet when I try to write a full thread explaining every nuance, it turns into a novel. Some things are apparently easier done than said.One year ago I was still overcomplicating everything, hunting for new indicators, jumping on every “hot” narrative, and letting other people’s charts influence my plan. Today, the simplicity is the superpower. Less truly became more.Grateful for the journey, the losses that taught me, and the quiet confidence that finally replaced the noise. Here’s to keeping it simple and staying free in 2026.
136
·
--
see my analysis on platform @Dewycandles
see my analysis on platform @Dewycandles

Mazie Tillett OIQN
·
--
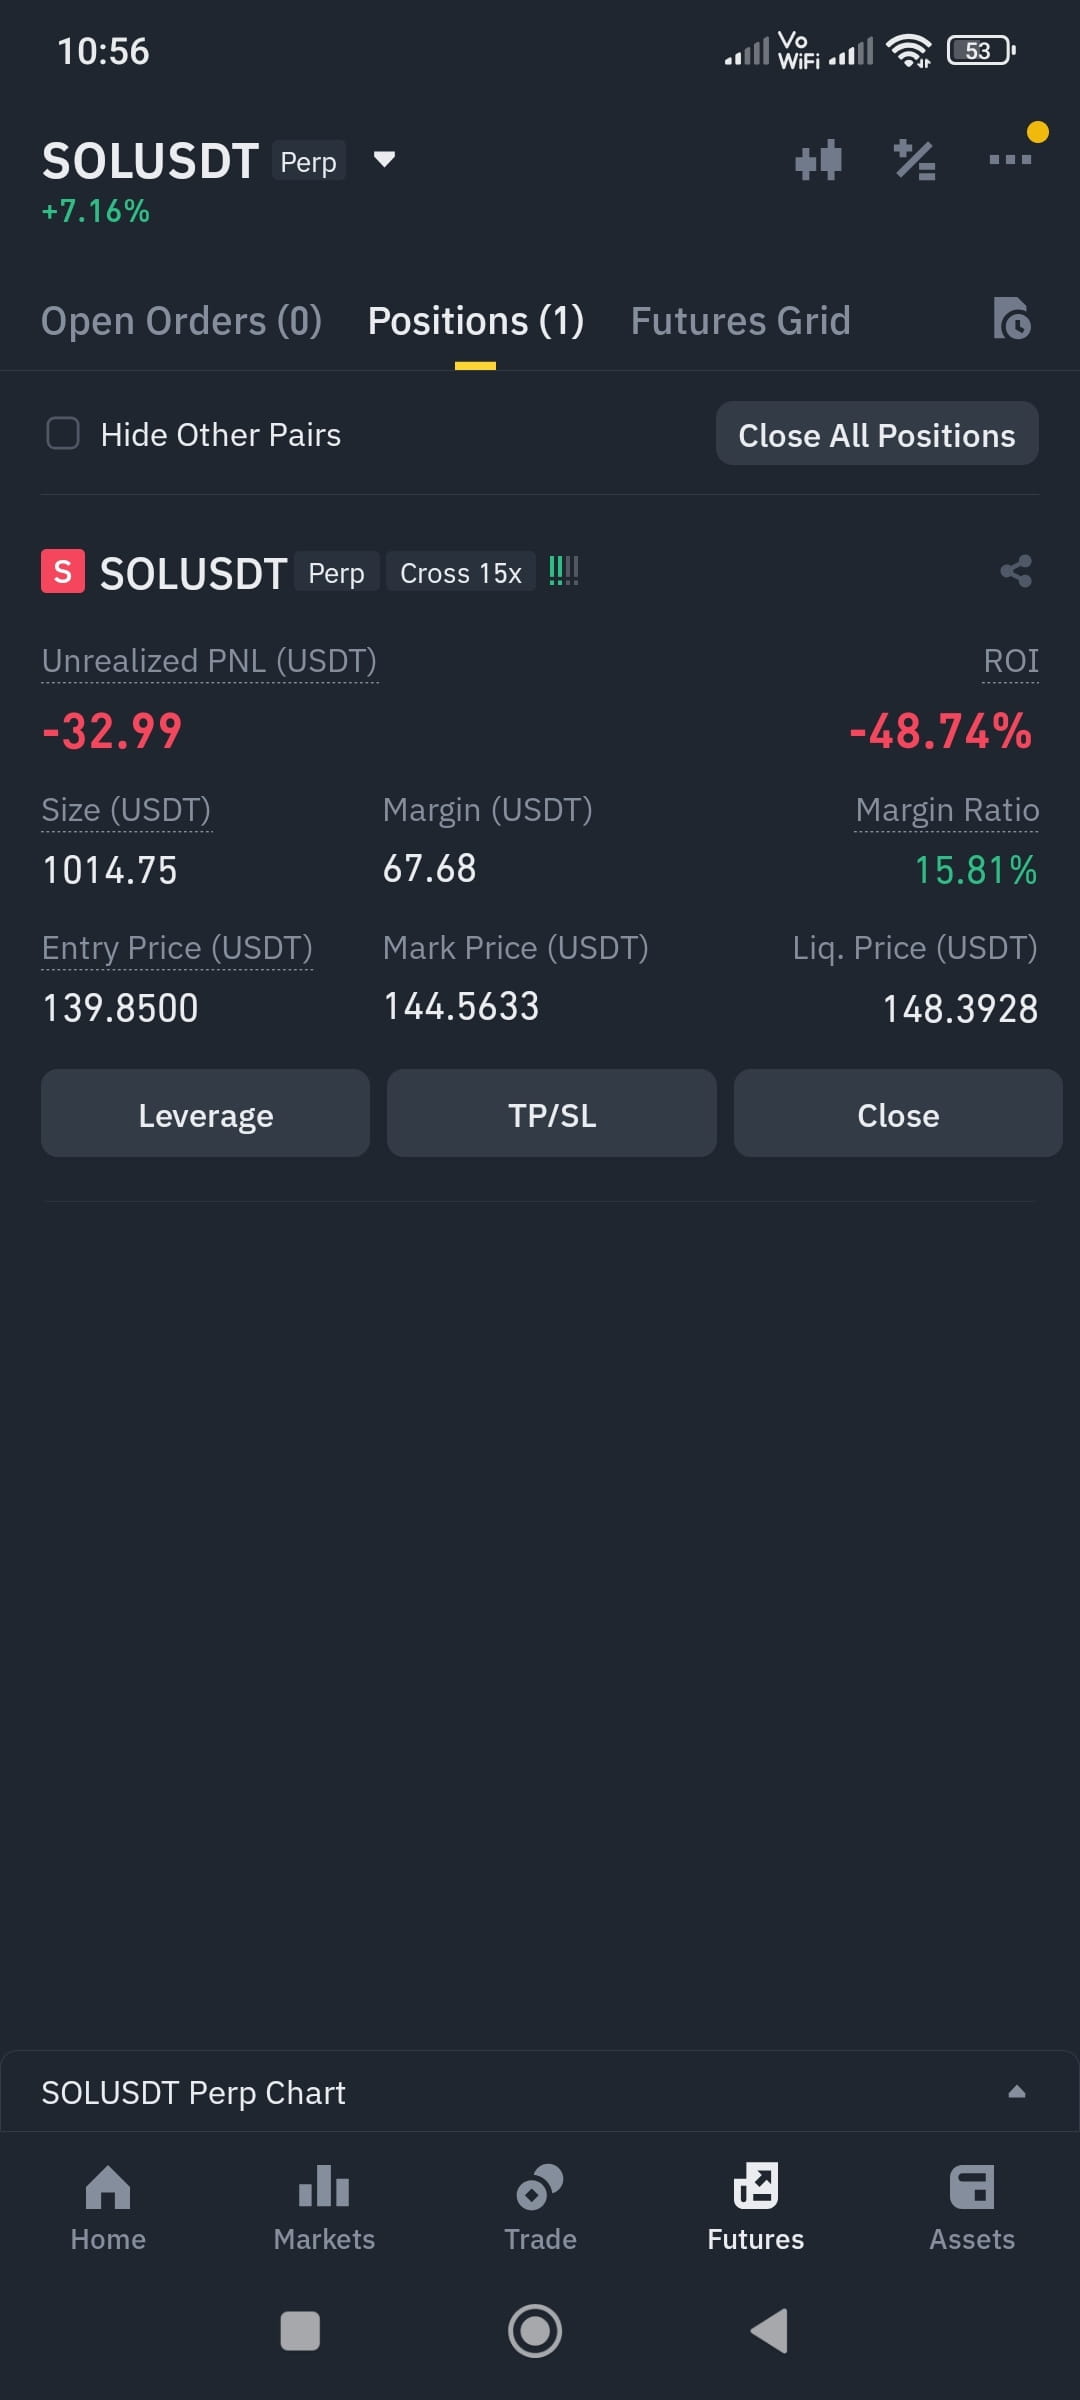
#Sol Sol has always disappointed me. Any expert opinion on this please 🥺
18
·
--
ສັນຍານກະທິງ
CYERCONNECT
The thing I love about this chart #cyber is it volatility and precise trend direction. I have two scenario and this is the first one. We are in some sort of Accumulation / capitulation Phase just like in $Apeusdt(see analysis on my socials).
You can either start buying partially or you simply wait for lower price if your patience won't run out.
The second scenario is very similar to the first, both bullish mid to long term the only difference is that the second scenario will keep going down from current price and keep ranging within the highlighted box till breakout.
CYERCONNECT
The thing I love about this chart #cyber is it volatility and precise trend direction. I have two scenario and this is the first one. We are in some sort of Accumulation / capitulation Phase just like in $Apeusdt(see analysis on my socials).
You can either start buying partially or you simply wait for lower price if your patience won't run out.
The second scenario is very similar to the first, both bullish mid to long term the only difference is that the second scenario will keep going down from current price and keep ranging within the highlighted box till breakout.
The thing I love about this chart #cyber is it volatility and precise trend direction. I have two scenario and this is the first one. We are in some sort of Accumulation / capitulation Phase just like in $Apeusdt(see analysis on my socials).
You can either start buying partially or you simply wait for lower price if your patience won't run out.
The second scenario is very similar to the first, both bullish mid to long term the only difference is that the second scenario will keep going down from current price and keep ranging within the highlighted box till breakout.

28
·
--

ບົດຄວາມ
CYERCONNECTThe thing I love about this chart is it volatility and precise trend direction. I have two scenario and this is the first one. We are in some sort of Accumulation / capitulation Phase just like in $Apeusdt (see my page on socials)
You can either start buying partially or you simply wait for lower price if your patience won't run out.
The second scenario is very similar to the first, both bullish mid to long term the only difference is that the second scenario will keep going down from current price and keep ranging within the highlighted box till breakout.
CYERCONNECT
The thing I love about this chart is it volatility and precise trend direction. I have two scenario and this is the first one. We are in some sort of Accumulation / capitulation Phase just like in $Apeusdt (see my page on socials)
You can either start buying partially or you simply wait for lower price if your patience won't run out.
The second scenario is very similar to the first, both bullish mid to long term the only difference is that the second scenario will keep going down from current price and keep ranging within the highlighted box till breakout.
You can either start buying partially or you simply wait for lower price if your patience won't run out.
The second scenario is very similar to the first, both bullish mid to long term the only difference is that the second scenario will keep going down from current price and keep ranging within the highlighted box till breakout.
4
5.9k
·
--
Remeber my call on #BITCOIN 2 months ago right? Finally we arrive
Remeber my call on #BITCOIN 2 months ago right? Finally we arrive

Dewy Candles
·
--
BITCOIN WHAT IS LEFT OF IT NOW
Not much to say here other than (first and most important point)
$BTC #BITCOIN #BULLRUN
is still bullish. Yes the bull run is not over yet but do not expect some ridiculous target. The most considerable target is between 80 - 90k while the extreme for me is within 91 - 120k.
Look at the RSI and you will fins some similarity where the previous double top printed a strong bearish divergence on the RSI at the overbought region and we are having the same thing happening now with the RSI at the overbought region waiting to test it again for the second time.
Look at the chart on the monthly timeframe and tell me what yo see. Overbought right? coupled with a strong bearish divergence. Yes that is your clue right there.
Short to mid term Bitcoin is bullish but on the long run it is bearish showing signs of exhaustion.
While I was away, I have been studying and improving my TECHNICAL ANALYSIS PROWESS. You will be seeing yet another improved and advance analysis from Dewy Candles.
That being said many calls went under like I predicted. In fact many nuked beyond my expectation but it is all good. I will be updating everything gradually with more clarity but I can assure you, don't expect to be spoon-feed, you still have to figure out some on your own to level up.
$Pepeusdt indeed reached that level (see pepe analysis on my page). those who FOMOed in at the top when I keep telling you it will go further down must have been under water now.
One of the good news I'll be bringing to you henceforth is to be as calm as a still water. If you follow along and also put in the time to study the chart, you will become an ELITE in this market. You won't be chasing price, you will learn to wait for price to come to you. Another thing is high RISK REWARD RATIO RRR. Losses are inevitable but what matters is that you gain exponentially compared to what you lose and the best way to get that is learning to wait for price to come to you, learning to lay low on the HIGH GROUND getting price at discount or premium discount to sell in good profit.
Another important thing to note is that you need to wipe your head off of those insane and ridiculous TARGETS. You don't want to be MOONBOYS or play it like the herd, you want to play it like the master of the game.
$BTC #BITCOIN #BULLRUN
is still bullish. Yes the bull run is not over yet but do not expect some ridiculous target. The most considerable target is between 80 - 90k while the extreme for me is within 91 - 120k.
Look at the RSI and you will fins some similarity where the previous double top printed a strong bearish divergence on the RSI at the overbought region and we are having the same thing happening now with the RSI at the overbought region waiting to test it again for the second time.
Look at the chart on the monthly timeframe and tell me what yo see. Overbought right? coupled with a strong bearish divergence. Yes that is your clue right there.
Short to mid term Bitcoin is bullish but on the long run it is bearish showing signs of exhaustion.
While I was away, I have been studying and improving my TECHNICAL ANALYSIS PROWESS. You will be seeing yet another improved and advance analysis from Dewy Candles.
That being said many calls went under like I predicted. In fact many nuked beyond my expectation but it is all good. I will be updating everything gradually with more clarity but I can assure you, don't expect to be spoon-feed, you still have to figure out some on your own to level up.
$Pepeusdt indeed reached that level (see pepe analysis on my page). those who FOMOed in at the top when I keep telling you it will go further down must have been under water now.
One of the good news I'll be bringing to you henceforth is to be as calm as a still water. If you follow along and also put in the time to study the chart, you will become an ELITE in this market. You won't be chasing price, you will learn to wait for price to come to you. Another thing is high RISK REWARD RATIO RRR. Losses are inevitable but what matters is that you gain exponentially compared to what you lose and the best way to get that is learning to wait for price to come to you, learning to lay low on the HIGH GROUND getting price at discount or premium discount to sell in good profit.
Another important thing to note is that you need to wipe your head off of those insane and ridiculous TARGETS. You don't want to be MOONBOYS or play it like the herd, you want to play it like the master of the game.
446
·
--

ບົດຄວາມ
TOTAL 2 🚀What is it with Quarter 4 and 1 synonymous to Bullish and Bearish.
If Q4 is Bullish most likely Q1 will be Bearish, vice-versa
Meanwhile what Altcoin are you holding because it is right about time. 🚀
TOTAL 2 🚀
What is it with Quarter 4 and 1 synonymous to Bullish and Bearish.
If Q4 is Bullish most likely Q1 will be Bearish, vice-versa
Meanwhile what Altcoin are you holding because it is right about time. 🚀
If Q4 is Bullish most likely Q1 will be Bearish, vice-versa
Meanwhile what Altcoin are you holding because it is right about time. 🚀
179
·
--

ບົດຄວາມ
$FLOKI - WHERE IS THE TOP?You also have to know how to check for correlation in various coins to have a clue on the direction of the trend in a particular timeframe. Such is the like of this $flokiusdt and $fetusdt but it doesn't stop here, there is more and I'll be showing them to you one after the other.
Presently $FLOKI is at the end of second phase of what I call EXPANSION, while some might call it WYCKOFF DISTRIBUTION, similar to the $ENSUSDT price action https://www.tradingview.com/chart/ENSUSDT/kzsQqLTk-ETHEREUM-NAME-SERVICE-BLUEPRINT/
Meanwhile, for the CLASSICAL ANALYST, you can get your confluence from the CHART PATTERN you're looking for which in this case is an INVERSE HEAD & SHOULDER
So what is the point exactly? the point is $flokiusdt is still bullish short to mid term but I must warn you, do not be like the SHEEP FLOCK (moon-boys) that herd for slaughter by setting ridiculous target because as usual, at the new expected high they will be singing their chorus again "too the moon" but that is the area ($0.0004 - 0.0005) where $flokiusdt will end it bullish journey and resume it mid term bear market which could even extend to long term.
For more confluence, we switch to the Elliott Wave Theory and as stated on the previous analysis (see my page for context) we are still on the 4th wave (yellow) and we have to finish a 5th wave which will take us to another new All Time High ($0.0004 - 0.0005).
Still more confluence, see the trendline price respected twice (red hammer icon). Now that same trend line is a good location for future re-visit plus the 110% Fibonacci Level rest perfectly well there.
In conclusion everything so much align with that area ($0.0004 - 0.0005). That is where I will exit all my position on FLOKI and start looking for a bearish setup that I will be riding to the Low - Mid Optimal Level.
Finally the invalidation level (stop loss) is at the red-dotted line.
$FLOKI - WHERE IS THE TOP?
You also have to know how to check for correlation in various coins to have a clue on the direction of the trend in a particular timeframe. Such is the like of this $flokiusdt and $fetusdt but it doesn't stop here, there is more and I'll be showing them to you one after the other.
Presently $FLOKI is at the end of second phase of what I call EXPANSION, while some might call it WYCKOFF DISTRIBUTION, similar to the $ENSUSDT price action https://www.tradingview.com/chart/ENSUSDT/kzsQqLTk-ETHEREUM-NAME-SERVICE-BLUEPRINT/
Meanwhile, for the CLASSICAL ANALYST, you can get your confluence from the CHART PATTERN you're looking for which in this case is an INVERSE HEAD & SHOULDER
So what is the point exactly? the point is $flokiusdt is still bullish short to mid term but I must warn you, do not be like the SHEEP FLOCK (moon-boys) that herd for slaughter by setting ridiculous target because as usual, at the new expected high they will be singing their chorus again "too the moon" but that is the area ($0.0004 - 0.0005) where $flokiusdt will end it bullish journey and resume it mid term bear market which could even extend to long term.
For more confluence, we switch to the Elliott Wave Theory and as stated on the previous analysis (see my page for context) we are still on the 4th wave (yellow) and we have to finish a 5th wave which will take us to another new All Time High ($0.0004 - 0.0005).
Still more confluence, see the trendline price respected twice (red hammer icon). Now that same trend line is a good location for future re-visit plus the 110% Fibonacci Level rest perfectly well there.
In conclusion everything so much align with that area ($0.0004 - 0.0005). That is where I will exit all my position on FLOKI and start looking for a bearish setup that I will be riding to the Low - Mid Optimal Level.
Finally the invalidation level (stop loss) is at the red-dotted line.
Presently $FLOKI is at the end of second phase of what I call EXPANSION, while some might call it WYCKOFF DISTRIBUTION, similar to the $ENSUSDT price action https://www.tradingview.com/chart/ENSUSDT/kzsQqLTk-ETHEREUM-NAME-SERVICE-BLUEPRINT/
Meanwhile, for the CLASSICAL ANALYST, you can get your confluence from the CHART PATTERN you're looking for which in this case is an INVERSE HEAD & SHOULDER
So what is the point exactly? the point is $flokiusdt is still bullish short to mid term but I must warn you, do not be like the SHEEP FLOCK (moon-boys) that herd for slaughter by setting ridiculous target because as usual, at the new expected high they will be singing their chorus again "too the moon" but that is the area ($0.0004 - 0.0005) where $flokiusdt will end it bullish journey and resume it mid term bear market which could even extend to long term.
For more confluence, we switch to the Elliott Wave Theory and as stated on the previous analysis (see my page for context) we are still on the 4th wave (yellow) and we have to finish a 5th wave which will take us to another new All Time High ($0.0004 - 0.0005).
Still more confluence, see the trendline price respected twice (red hammer icon). Now that same trend line is a good location for future re-visit plus the 110% Fibonacci Level rest perfectly well there.
In conclusion everything so much align with that area ($0.0004 - 0.0005). That is where I will exit all my position on FLOKI and start looking for a bearish setup that I will be riding to the Low - Mid Optimal Level.
Finally the invalidation level (stop loss) is at the red-dotted line.
34
·
--
ສັນຍານກະທິງ
$FLOKI - WHERE IS THE TOP?
You also have to know how to check for correlation in various coins to have a clue on the direction of the trend in a particular timeframe. Such is the like of this $flokiusdt and $fetusdt but it doesn't stop here, there is more and I'll be showing them to you one after the other.
Presently FLOKI is at the end of second phase of what I call EXPANSION, while some might call it WYCKOFF DISTRIBUTION, similar to the $ENSUSDT price action https://www.tradingview.com/chart/ENSUSDT/kzsQqLTk-ETHEREUM-NAME-SERVICE-BLUEPRINT/
Meanwhile, for the CLASSICAL ANALYST, you can get your confluence from the CHART PATTERN you're looking for which in this case is an INVERSE HEAD & SHOULDER
So what is the point exactly? the point is $flokiusdt is still bullish short to mid term but I must warn you, do not be like the SHEEP FLOCK (moon-boys) that herd for slaughter by setting ridiculous target because as usual, at the new expected high they will be singing their chorus again "too the moon" but that is the area ($0.0004 - 0.0005) where $flokiusdt will end it bullish journey and resume it mid term bear market which could even extend to long term.
For more confluence, we switch to the Elliott Wave Theory and as stated on the previous analysis (see my page for context) we are still on the 4th wave (yellow) and we have to finish a 5th wave which will take us to another new All Time High ($0.0004 - 0.0005).
Still more confluence, see the trendline price respected twice (red hammer icon). Now that same trend line is a good location for future re-visit plus the 110% Fibonacci Level rest perfectly well there.
In conclusion everything so much align with that area ($0.0004 - 0.0005). That is where I will exit all my position on FLOKI and start looking for a bearish setup that I will be riding to the Low - Mid Optimal Level.
Finally the invalidation level (stop loss) is at the red-dotted line.
$FLOKI - WHERE IS THE TOP?
You also have to know how to check for correlation in various coins to have a clue on the direction of the trend in a particular timeframe. Such is the like of this $flokiusdt and $fetusdt but it doesn't stop here, there is more and I'll be showing them to you one after the other.
Presently FLOKI is at the end of second phase of what I call EXPANSION, while some might call it WYCKOFF DISTRIBUTION, similar to the $ENSUSDT price action https://www.tradingview.com/chart/ENSUSDT/kzsQqLTk-ETHEREUM-NAME-SERVICE-BLUEPRINT/
Meanwhile, for the CLASSICAL ANALYST, you can get your confluence from the CHART PATTERN you're looking for which in this case is an INVERSE HEAD & SHOULDER
So what is the point exactly? the point is $flokiusdt is still bullish short to mid term but I must warn you, do not be like the SHEEP FLOCK (moon-boys) that herd for slaughter by setting ridiculous target because as usual, at the new expected high they will be singing their chorus again "too the moon" but that is the area ($0.0004 - 0.0005) where $flokiusdt will end it bullish journey and resume it mid term bear market which could even extend to long term.
For more confluence, we switch to the Elliott Wave Theory and as stated on the previous analysis (see my page for context) we are still on the 4th wave (yellow) and we have to finish a 5th wave which will take us to another new All Time High ($0.0004 - 0.0005).
Still more confluence, see the trendline price respected twice (red hammer icon). Now that same trend line is a good location for future re-visit plus the 110% Fibonacci Level rest perfectly well there.
In conclusion everything so much align with that area ($0.0004 - 0.0005). That is where I will exit all my position on FLOKI and start looking for a bearish setup that I will be riding to the Low - Mid Optimal Level.
Finally the invalidation level (stop loss) is at the red-dotted line.
You also have to know how to check for correlation in various coins to have a clue on the direction of the trend in a particular timeframe. Such is the like of this $flokiusdt and $fetusdt but it doesn't stop here, there is more and I'll be showing them to you one after the other.
Presently FLOKI is at the end of second phase of what I call EXPANSION, while some might call it WYCKOFF DISTRIBUTION, similar to the $ENSUSDT price action https://www.tradingview.com/chart/ENSUSDT/kzsQqLTk-ETHEREUM-NAME-SERVICE-BLUEPRINT/
Meanwhile, for the CLASSICAL ANALYST, you can get your confluence from the CHART PATTERN you're looking for which in this case is an INVERSE HEAD & SHOULDER
So what is the point exactly? the point is $flokiusdt is still bullish short to mid term but I must warn you, do not be like the SHEEP FLOCK (moon-boys) that herd for slaughter by setting ridiculous target because as usual, at the new expected high they will be singing their chorus again "too the moon" but that is the area ($0.0004 - 0.0005) where $flokiusdt will end it bullish journey and resume it mid term bear market which could even extend to long term.
For more confluence, we switch to the Elliott Wave Theory and as stated on the previous analysis (see my page for context) we are still on the 4th wave (yellow) and we have to finish a 5th wave which will take us to another new All Time High ($0.0004 - 0.0005).
Still more confluence, see the trendline price respected twice (red hammer icon). Now that same trend line is a good location for future re-visit plus the 110% Fibonacci Level rest perfectly well there.
In conclusion everything so much align with that area ($0.0004 - 0.0005). That is where I will exit all my position on FLOKI and start looking for a bearish setup that I will be riding to the Low - Mid Optimal Level.
Finally the invalidation level (stop loss) is at the red-dotted line.


509
·
--
ສັນຍານໝີ
ETHEREUM NAME SERVICE $ENS # - BLUEPRINT
I told you that the new technical analysis you will be getting is going to be top notch with a touch of SUPPLY & DEMAND, SMART MONEY CONTRACT, ICT (inner cycle trading), CLASSICAL analysis and of course ELLIOTT WAVE THEORY so it can go round to fit literally everybody's style.
My first detailed analysis is $ENSUSDT (Ethereum Name Service).
Let us start with the first phase where we see a BOS (break of structure), price created a HIGHER LOW since June, 2023. in the beginning of the second phase creating a bearish BOS then price action returned to grab the BSL (buy side liquidity) which marks the end of the second phase.
For the third phase, an important question is why should we be going lower for the SSL (sell side liquidity), and not BSL to create a new ATH (all time high)? Well, looking at the major indicator RSI (relative strength index) there is exhaustion creating a STRONG BEARISH HIDDEN DIVERGENCE. The second confluence is still on the RSI but this time looking at the RSI from the beginning of this year Jan 4, till March 5, there is a STRONG BEARISH DIVERGENCE and from 24th of May to July (All Time High) another STRONG BEARISH DIVERGENCE is created and finally the overall STRONG BEARISH DIVERGENCE to top it up all is created from Jan 4th up till this moment making it the third time the RSI is screaming a bearish reversal as it keeps printing a LOWER LOW since the beginning of this year (2024).
The third confluence is the CHoCH (change of character) where price creates a new swing low which sends price into the daily FVG (fair value gap) at the GOLDEN FIBONACCI ZONE 50%, setting the Stop Loss at the 618% (24.20. First ($13.02) and Second ($8.27) Take Profit too.
The fourth confluence is the third phase looking like an IMPULSE. Like we are in some kind of wave 5 of wave 3.
Do not take any chart I post likely as you will and should be learning from it to up your game too. I will be dropping a very detailed chart but filled with educational content. This is just the beginning.
ETHEREUM NAME SERVICE $ENS # - BLUEPRINT
I told you that the new technical analysis you will be getting is going to be top notch with a touch of SUPPLY & DEMAND, SMART MONEY CONTRACT, ICT (inner cycle trading), CLASSICAL analysis and of course ELLIOTT WAVE THEORY so it can go round to fit literally everybody's style.
My first detailed analysis is $ENSUSDT (Ethereum Name Service).
Let us start with the first phase where we see a BOS (break of structure), price created a HIGHER LOW since June, 2023. in the beginning of the second phase creating a bearish BOS then price action returned to grab the BSL (buy side liquidity) which marks the end of the second phase.
For the third phase, an important question is why should we be going lower for the SSL (sell side liquidity), and not BSL to create a new ATH (all time high)? Well, looking at the major indicator RSI (relative strength index) there is exhaustion creating a STRONG BEARISH HIDDEN DIVERGENCE. The second confluence is still on the RSI but this time looking at the RSI from the beginning of this year Jan 4, till March 5, there is a STRONG BEARISH DIVERGENCE and from 24th of May to July (All Time High) another STRONG BEARISH DIVERGENCE is created and finally the overall STRONG BEARISH DIVERGENCE to top it up all is created from Jan 4th up till this moment making it the third time the RSI is screaming a bearish reversal as it keeps printing a LOWER LOW since the beginning of this year (2024).
The third confluence is the CHoCH (change of character) where price creates a new swing low which sends price into the daily FVG (fair value gap) at the GOLDEN FIBONACCI ZONE 50%, setting the Stop Loss at the 618% (24.20. First ($13.02) and Second ($8.27) Take Profit too.
The fourth confluence is the third phase looking like an IMPULSE. Like we are in some kind of wave 5 of wave 3.
Do not take any chart I post likely as you will and should be learning from it to up your game too. I will be dropping a very detailed chart but filled with educational content. This is just the beginning.
I told you that the new technical analysis you will be getting is going to be top notch with a touch of SUPPLY & DEMAND, SMART MONEY CONTRACT, ICT (inner cycle trading), CLASSICAL analysis and of course ELLIOTT WAVE THEORY so it can go round to fit literally everybody's style.
My first detailed analysis is $ENSUSDT (Ethereum Name Service).
Let us start with the first phase where we see a BOS (break of structure), price created a HIGHER LOW since June, 2023. in the beginning of the second phase creating a bearish BOS then price action returned to grab the BSL (buy side liquidity) which marks the end of the second phase.
For the third phase, an important question is why should we be going lower for the SSL (sell side liquidity), and not BSL to create a new ATH (all time high)? Well, looking at the major indicator RSI (relative strength index) there is exhaustion creating a STRONG BEARISH HIDDEN DIVERGENCE. The second confluence is still on the RSI but this time looking at the RSI from the beginning of this year Jan 4, till March 5, there is a STRONG BEARISH DIVERGENCE and from 24th of May to July (All Time High) another STRONG BEARISH DIVERGENCE is created and finally the overall STRONG BEARISH DIVERGENCE to top it up all is created from Jan 4th up till this moment making it the third time the RSI is screaming a bearish reversal as it keeps printing a LOWER LOW since the beginning of this year (2024).
The third confluence is the CHoCH (change of character) where price creates a new swing low which sends price into the daily FVG (fair value gap) at the GOLDEN FIBONACCI ZONE 50%, setting the Stop Loss at the 618% (24.20. First ($13.02) and Second ($8.27) Take Profit too.
The fourth confluence is the third phase looking like an IMPULSE. Like we are in some kind of wave 5 of wave 3.
Do not take any chart I post likely as you will and should be learning from it to up your game too. I will be dropping a very detailed chart but filled with educational content. This is just the beginning.

1
28
·
--
$FET BLUEPRINT - ALL SETUP
$FETUSDT is still bullish on the higher timeframe but buying now is not advisable because of the risk reward. What you should wait for is the retracement to point 2 area after present price reaches point 1.
But if price fails to reach point 1 and starts to deep from current price then it is best to buy lower after price has taken the PSL (previous swing low) down to the WEEKLY ORDER BLOCK (W. OB) while the STOP LOSS is slightly below it. From there we will have a nice RISK REWARD RATIO.
While I expect price to bounce from the Weekly Order Block, there is no exception that the Stop Loss can't be taken because we have a huge WEEKLY FAIR VALUE GAP and depending on the volume of the bears price can surge down into that W. FVG and there is certainty that price will bounce HARD from there with a long wick after taking all the liquidity that rest beneath it.
So to summarize, there are three entry level where two of them are (W. OB & W. FVG) for BUY/LONG and two Stop Losses respectively while the third one is at POINT 2 with it Stop Loss at the PSL.
The POINT 2 entry level is mainly for those who are already in any FET position seeking to know where to trail profit while the other two entries is for those who are for those interesting in a good positioning for a nice RISK REWARD.
I will be updating this chart as every level unfolds so make sure to follow and turn on notification to stay updated.
$FET BLUEPRINT - ALL SETUP
$FETUSDT is still bullish on the higher timeframe but buying now is not advisable because of the risk reward. What you should wait for is the retracement to point 2 area after present price reaches point 1.
But if price fails to reach point 1 and starts to deep from current price then it is best to buy lower after price has taken the PSL (previous swing low) down to the WEEKLY ORDER BLOCK (W. OB) while the STOP LOSS is slightly below it. From there we will have a nice RISK REWARD RATIO.
While I expect price to bounce from the Weekly Order Block, there is no exception that the Stop Loss can't be taken because we have a huge WEEKLY FAIR VALUE GAP and depending on the volume of the bears price can surge down into that W. FVG and there is certainty that price will bounce HARD from there with a long wick after taking all the liquidity that rest beneath it.
So to summarize, there are three entry level where two of them are (W. OB & W. FVG) for BUY/LONG and two Stop Losses respectively while the third one is at POINT 2 with it Stop Loss at the PSL.
The POINT 2 entry level is mainly for those who are already in any FET position seeking to know where to trail profit while the other two entries is for those who are for those interesting in a good positioning for a nice RISK REWARD.
I will be updating this chart as every level unfolds so make sure to follow and turn on notification to stay updated.
$FETUSDT is still bullish on the higher timeframe but buying now is not advisable because of the risk reward. What you should wait for is the retracement to point 2 area after present price reaches point 1.
But if price fails to reach point 1 and starts to deep from current price then it is best to buy lower after price has taken the PSL (previous swing low) down to the WEEKLY ORDER BLOCK (W. OB) while the STOP LOSS is slightly below it. From there we will have a nice RISK REWARD RATIO.
While I expect price to bounce from the Weekly Order Block, there is no exception that the Stop Loss can't be taken because we have a huge WEEKLY FAIR VALUE GAP and depending on the volume of the bears price can surge down into that W. FVG and there is certainty that price will bounce HARD from there with a long wick after taking all the liquidity that rest beneath it.
So to summarize, there are three entry level where two of them are (W. OB & W. FVG) for BUY/LONG and two Stop Losses respectively while the third one is at POINT 2 with it Stop Loss at the PSL.
The POINT 2 entry level is mainly for those who are already in any FET position seeking to know where to trail profit while the other two entries is for those who are for those interesting in a good positioning for a nice RISK REWARD.
I will be updating this chart as every level unfolds so make sure to follow and turn on notification to stay updated.

3
25
·
--

ບົດຄວາມ
FET BLUEPRINT - ALL SETUP$FET is still bullish on the higher timeframe but buying now is not advisable because of the risk reward. What you should wait for is the retracement to point 2 area after present price reaches point 1.
But if price fails to reach point 1 and starts to deep from current price then it is best to buy lower after price has taken the PSL (previous swing low) down to the WEEKLY ORDER BLOCK (W. OB) while the STOP LOSS is slightly below it. From there we will have a nice RISK REWARD RATIO.
While I expect price to bounce from the Weekly Order Block, there is no exception that the Stop Loss can't be taken because we have a huge WEEKLY FAIR VALUE GAP and depending on the volume of the bears price can surge down into that W. FVG and there is certainty that price will bounce HARD from there with a long wick after taking all the liquidity that rest beneath it.
So to summarize, there are three entry level where two of them are (W. OB & W. FVG) for BUY/LONG and two Stop Losses respectively while the third one is at POINT 2 with it Stop Loss at the PSL.
The POINT 2 entry level is mainly for those who are already in any FET position seeking to know where to trail profit while the other two entries is for those who are for those interesting in a good positioning for a nice RISK REWARD.
I will be updating this chart as every level unfolds so make sure to follow and turn on notification to stay updated.
FET BLUEPRINT - ALL SETUP
$FET is still bullish on the higher timeframe but buying now is not advisable because of the risk reward. What you should wait for is the retracement to point 2 area after present price reaches point 1.
But if price fails to reach point 1 and starts to deep from current price then it is best to buy lower after price has taken the PSL (previous swing low) down to the WEEKLY ORDER BLOCK (W. OB) while the STOP LOSS is slightly below it. From there we will have a nice RISK REWARD RATIO.
While I expect price to bounce from the Weekly Order Block, there is no exception that the Stop Loss can't be taken because we have a huge WEEKLY FAIR VALUE GAP and depending on the volume of the bears price can surge down into that W. FVG and there is certainty that price will bounce HARD from there with a long wick after taking all the liquidity that rest beneath it.
So to summarize, there are three entry level where two of them are (W. OB & W. FVG) for BUY/LONG and two Stop Losses respectively while the third one is at POINT 2 with it Stop Loss at the PSL.
The POINT 2 entry level is mainly for those who are already in any FET position seeking to know where to trail profit while the other two entries is for those who are for those interesting in a good positioning for a nice RISK REWARD.
I will be updating this chart as every level unfolds so make sure to follow and turn on notification to stay updated.
But if price fails to reach point 1 and starts to deep from current price then it is best to buy lower after price has taken the PSL (previous swing low) down to the WEEKLY ORDER BLOCK (W. OB) while the STOP LOSS is slightly below it. From there we will have a nice RISK REWARD RATIO.
While I expect price to bounce from the Weekly Order Block, there is no exception that the Stop Loss can't be taken because we have a huge WEEKLY FAIR VALUE GAP and depending on the volume of the bears price can surge down into that W. FVG and there is certainty that price will bounce HARD from there with a long wick after taking all the liquidity that rest beneath it.
So to summarize, there are three entry level where two of them are (W. OB & W. FVG) for BUY/LONG and two Stop Losses respectively while the third one is at POINT 2 with it Stop Loss at the PSL.
The POINT 2 entry level is mainly for those who are already in any FET position seeking to know where to trail profit while the other two entries is for those who are for those interesting in a good positioning for a nice RISK REWARD.
I will be updating this chart as every level unfolds so make sure to follow and turn on notification to stay updated.
12
2
32
37.6k
·
--

ບົດຄວາມ
ETHEREUM NAME SERVICE - BLUEPRINTI told you that the new technical analysis you will be getting is going to be top notch with a touch of SUPPLY & DEMAND, SMART MONEY CONTRACT, ICT (inner cycle trading), CLASSICAL analysis and of course ELLIOTT WAVE THEORY so it can go round to fit literally everybody's style.
My first detailed analysis is $ENSUSDT (Ethereum Name Service).
Let us start with the first phase where we see a BOS (break of structure), price created a HIGHER LOW since June, 2023. in the beginning of the second phase creating a bearish BOS then price action returned to grab the BSL (buy side liquidity) which marks the end of the second phase.
For the third phase, an important question is why should we be going lower for the SSL (sell side liquidity), and not BSL to create a new ATH (all time high)? Well, looking at the major indicator RSI (relative strength index) there is exhaustion creating a STRONG BEARISH HIDDEN DIVERGENCE. The second confluence is still on the RSI but this time looking at the RSI from the beginning of this year Jan 4, till March 5, there is a STRONG BEARISH DIVERGENCE and from 24th of May to July (All Time High) another STRONG BEARISH DIVERGENCE is created and finally the overall STRONG BEARISH DIVERGENCE to top it up all is created from Jan 4th up till this moment making it the third time the RSI is screaming a bearish reversal as it keeps printing a LOWER LOW since the beginning of this year (2024).
The third confluence is the CHoCH (change of character) where price creates a new swing low which sends price into the daily FVG (fair value gap) at the GOLDEN FIBONACCI ZONE 50%, setting the Stop Loss at the 618% (24.20. First ($13.02) and Second ($8.27) Take Profit too.
The fourth confluence is the third phase looking like an IMPULSE. Like we are in some kind of wave 5 of wave 3.
Do not take any chart I post likely as you will and should be learning from it to up your game too. I will be dropping a very detailed chart but filled with educational content. This is just the beginning.
ETHEREUM NAME SERVICE - BLUEPRINT
I told you that the new technical analysis you will be getting is going to be top notch with a touch of SUPPLY & DEMAND, SMART MONEY CONTRACT, ICT (inner cycle trading), CLASSICAL analysis and of course ELLIOTT WAVE THEORY so it can go round to fit literally everybody's style.
My first detailed analysis is $ENSUSDT (Ethereum Name Service).
Let us start with the first phase where we see a BOS (break of structure), price created a HIGHER LOW since June, 2023. in the beginning of the second phase creating a bearish BOS then price action returned to grab the BSL (buy side liquidity) which marks the end of the second phase.
For the third phase, an important question is why should we be going lower for the SSL (sell side liquidity), and not BSL to create a new ATH (all time high)? Well, looking at the major indicator RSI (relative strength index) there is exhaustion creating a STRONG BEARISH HIDDEN DIVERGENCE. The second confluence is still on the RSI but this time looking at the RSI from the beginning of this year Jan 4, till March 5, there is a STRONG BEARISH DIVERGENCE and from 24th of May to July (All Time High) another STRONG BEARISH DIVERGENCE is created and finally the overall STRONG BEARISH DIVERGENCE to top it up all is created from Jan 4th up till this moment making it the third time the RSI is screaming a bearish reversal as it keeps printing a LOWER LOW since the beginning of this year (2024).
The third confluence is the CHoCH (change of character) where price creates a new swing low which sends price into the daily FVG (fair value gap) at the GOLDEN FIBONACCI ZONE 50%, setting the Stop Loss at the 618% (24.20. First ($13.02) and Second ($8.27) Take Profit too.
The fourth confluence is the third phase looking like an IMPULSE. Like we are in some kind of wave 5 of wave 3.
Do not take any chart I post likely as you will and should be learning from it to up your game too. I will be dropping a very detailed chart but filled with educational content. This is just the beginning.
My first detailed analysis is $ENSUSDT (Ethereum Name Service).
Let us start with the first phase where we see a BOS (break of structure), price created a HIGHER LOW since June, 2023. in the beginning of the second phase creating a bearish BOS then price action returned to grab the BSL (buy side liquidity) which marks the end of the second phase.
For the third phase, an important question is why should we be going lower for the SSL (sell side liquidity), and not BSL to create a new ATH (all time high)? Well, looking at the major indicator RSI (relative strength index) there is exhaustion creating a STRONG BEARISH HIDDEN DIVERGENCE. The second confluence is still on the RSI but this time looking at the RSI from the beginning of this year Jan 4, till March 5, there is a STRONG BEARISH DIVERGENCE and from 24th of May to July (All Time High) another STRONG BEARISH DIVERGENCE is created and finally the overall STRONG BEARISH DIVERGENCE to top it up all is created from Jan 4th up till this moment making it the third time the RSI is screaming a bearish reversal as it keeps printing a LOWER LOW since the beginning of this year (2024).
The third confluence is the CHoCH (change of character) where price creates a new swing low which sends price into the daily FVG (fair value gap) at the GOLDEN FIBONACCI ZONE 50%, setting the Stop Loss at the 618% (24.20. First ($13.02) and Second ($8.27) Take Profit too.
The fourth confluence is the third phase looking like an IMPULSE. Like we are in some kind of wave 5 of wave 3.
Do not take any chart I post likely as you will and should be learning from it to up your game too. I will be dropping a very detailed chart but filled with educational content. This is just the beginning.
5
7
2.9k
·
--
$CAKE KE is 100% away from this low. The TPs and invalidation level (stop loss) is clearly on the chart.
Update idea
$CAKE KE is 100% away from this low. The TPs and invalidation level (stop loss) is clearly on the chart.
Update idea
Update idea

4
1.2k
·
--

ບົດຄວາມ
BITCOIN WHAT IS LEFT OF IT NOWNot much to say here other than (first and most important point)
$BTC #BITCOIN #BULLRUN
is still bullish. Yes the bull run is not over yet but do not expect some ridiculous target. The most considerable target is between 80 - 90k while the extreme for me is within 91 - 120k.
Look at the RSI and you will fins some similarity where the previous double top printed a strong bearish divergence on the RSI at the overbought region and we are having the same thing happening now with the RSI at the overbought region waiting to test it again for the second time.
Look at the chart on the monthly timeframe and tell me what yo see. Overbought right? coupled with a strong bearish divergence. Yes that is your clue right there.
Short to mid term Bitcoin is bullish but on the long run it is bearish showing signs of exhaustion.
While I was away, I have been studying and improving my TECHNICAL ANALYSIS PROWESS. You will be seeing yet another improved and advance analysis from Dewy Candles.
That being said many calls went under like I predicted. In fact many nuked beyond my expectation but it is all good. I will be updating everything gradually with more clarity but I can assure you, don't expect to be spoon-feed, you still have to figure out some on your own to level up.
$Pepeusdt indeed reached that level (see pepe analysis on my page). those who FOMOed in at the top when I keep telling you it will go further down must have been under water now.
One of the good news I'll be bringing to you henceforth is to be as calm as a still water. If you follow along and also put in the time to study the chart, you will become an ELITE in this market. You won't be chasing price, you will learn to wait for price to come to you. Another thing is high RISK REWARD RATIO RRR. Losses are inevitable but what matters is that you gain exponentially compared to what you lose and the best way to get that is learning to wait for price to come to you, learning to lay low on the HIGH GROUND getting price at discount or premium discount to sell in good profit.
Another important thing to note is that you need to wipe your head off of those insane and ridiculous TARGETS. You don't want to be MOONBOYS or play it like the herd, you want to play it like the master of the game.
BITCOIN WHAT IS LEFT OF IT NOW
Not much to say here other than (first and most important point)
$BTC #BITCOIN #BULLRUN
is still bullish. Yes the bull run is not over yet but do not expect some ridiculous target. The most considerable target is between 80 - 90k while the extreme for me is within 91 - 120k.
Look at the RSI and you will fins some similarity where the previous double top printed a strong bearish divergence on the RSI at the overbought region and we are having the same thing happening now with the RSI at the overbought region waiting to test it again for the second time.
Look at the chart on the monthly timeframe and tell me what yo see. Overbought right? coupled with a strong bearish divergence. Yes that is your clue right there.
Short to mid term Bitcoin is bullish but on the long run it is bearish showing signs of exhaustion.
While I was away, I have been studying and improving my TECHNICAL ANALYSIS PROWESS. You will be seeing yet another improved and advance analysis from Dewy Candles.
That being said many calls went under like I predicted. In fact many nuked beyond my expectation but it is all good. I will be updating everything gradually with more clarity but I can assure you, don't expect to be spoon-feed, you still have to figure out some on your own to level up.
$Pepeusdt indeed reached that level (see pepe analysis on my page). those who FOMOed in at the top when I keep telling you it will go further down must have been under water now.
One of the good news I'll be bringing to you henceforth is to be as calm as a still water. If you follow along and also put in the time to study the chart, you will become an ELITE in this market. You won't be chasing price, you will learn to wait for price to come to you. Another thing is high RISK REWARD RATIO RRR. Losses are inevitable but what matters is that you gain exponentially compared to what you lose and the best way to get that is learning to wait for price to come to you, learning to lay low on the HIGH GROUND getting price at discount or premium discount to sell in good profit.
Another important thing to note is that you need to wipe your head off of those insane and ridiculous TARGETS. You don't want to be MOONBOYS or play it like the herd, you want to play it like the master of the game.
$BTC #BITCOIN #BULLRUN
is still bullish. Yes the bull run is not over yet but do not expect some ridiculous target. The most considerable target is between 80 - 90k while the extreme for me is within 91 - 120k.
Look at the RSI and you will fins some similarity where the previous double top printed a strong bearish divergence on the RSI at the overbought region and we are having the same thing happening now with the RSI at the overbought region waiting to test it again for the second time.
Look at the chart on the monthly timeframe and tell me what yo see. Overbought right? coupled with a strong bearish divergence. Yes that is your clue right there.
Short to mid term Bitcoin is bullish but on the long run it is bearish showing signs of exhaustion.
While I was away, I have been studying and improving my TECHNICAL ANALYSIS PROWESS. You will be seeing yet another improved and advance analysis from Dewy Candles.
That being said many calls went under like I predicted. In fact many nuked beyond my expectation but it is all good. I will be updating everything gradually with more clarity but I can assure you, don't expect to be spoon-feed, you still have to figure out some on your own to level up.
$Pepeusdt indeed reached that level (see pepe analysis on my page). those who FOMOed in at the top when I keep telling you it will go further down must have been under water now.
One of the good news I'll be bringing to you henceforth is to be as calm as a still water. If you follow along and also put in the time to study the chart, you will become an ELITE in this market. You won't be chasing price, you will learn to wait for price to come to you. Another thing is high RISK REWARD RATIO RRR. Losses are inevitable but what matters is that you gain exponentially compared to what you lose and the best way to get that is learning to wait for price to come to you, learning to lay low on the HIGH GROUND getting price at discount or premium discount to sell in good profit.
Another important thing to note is that you need to wipe your head off of those insane and ridiculous TARGETS. You don't want to be MOONBOYS or play it like the herd, you want to play it like the master of the game.
1
4
580
·
--
ສັນຍານໝີ
$JASMY BEARISH TRADE SETUP - 17/7/24
I have been printing on $jasmyusdt prior on the VIP channel and I think I should include you on this one. The past success rate and the confirmation bias on the higher timeframe boost my confidence on this one. It is a staggering 9.5 risk reward if played out.
$JASMY BEARISH TRADE SETUP - 17/7/24
I have been printing on $jasmyusdt prior on the VIP channel and I think I should include you on this one. The past success rate and the confirmation bias on the higher timeframe boost my confidence on this one. It is a staggering 9.5 risk reward if played out.
I have been printing on $jasmyusdt prior on the VIP channel and I think I should include you on this one. The past success rate and the confirmation bias on the higher timeframe boost my confidence on this one. It is a staggering 9.5 risk reward if played out.

1
747
ເຂົ້າສູ່ລະບົບເພື່ອສຳຫຼວດເນື້ອຫາເພີ່ມເຕີມ
ເຂົ້າຮ່ວມກຸ່ມຜູ້ໃຊ້ຄຣິບໂຕທົ່ວໂລກໃນ Binance Square.
⚡️ ໄດ້ຮັບຂໍ້ມູນຫຼ້າສຸດ ແລະ ທີ່ມີປະໂຫຍດກ່ຽວກັບຄຣິບໂຕ.
💬 ໄດ້ຮັບຄວາມໄວ້ວາງໃຈຈາກຕະຫຼາດແລກປ່ຽນຄຣິບໂຕທີ່ໃຫຍ່ທີ່ສຸດໃນໂລກ.
👍 ຄົ້ນຫາຂໍ້ມູນເຊີງເລິກທີ່ແທ້ຈາກນັກສ້າງທີ່ໄດ້ຮັບການຢືນຢັນ.
ອີເມວ / ເບີໂທລະສັບ
ຫົວຂໍ້ທີ່ກໍາລັງນິຍົມ
ZcashETFPostsFirstWeeklyOutflow$93.6M
32,083 views
95 ກຳລັງສົນທະນາ
#ZcashETFPostsFirstWeeklyOutflow$93.6M
🚨🚨🚨🚨🚨🚨🚨🚨🚨🚨🚨🚨🚨🚨✅ 🚨 ZCASH ETF FLOWS TURN NEGATIVE FOR THE FIRST TIME! 📉
$ZEC is facing a notable shift in institutional fund flows, with Zcash investment products recording their first weekly net outflow since launching in August.
According to fund-flow data, around $93.6M was withdrawn from Zcash products during the latest week, while ZEC price action also cooled significantly.
📊 WHAT HAPPENED?
• Weekly Zcash ETF outflow: $93.6M
• September 30 daily outflow: $30.25M
• ZCSH previously attracted around $98.2M in one week
• ZEC is trading near $1,300
• Recent high: around $1,690
• Weekly decline: roughly 17%+
🔍 LEVELS TO WATCH
🟢 Support: $1,280–$1,300
🔴 Resistance: $1,450–$1,500
The key question now is whether the $1,300 area can hold and attract fresh buyers.
Institutional flows will also be important. A return of consistent positive inflows could signal renewed confidence, while continued outflows may keep pressure on $ZEC .
👀 Is this simply profit-taking after ZEC’s huge rally, or could we see another deeper pullback before buyers return?
Share your view below. 👇
#Zcash #ZEC #ZcashETF #Crypto
#analysis
owhggwiohsjowve
·0 ຖືກໃຈ
·144 views
GreekPoliceBustCryptoScamRingArrest17
63,418 views
637 ກຳລັງສົນທະນາ
BitcoinRejectedAt$87K
115,711 views
152 ກຳລັງສົນທະນາ