
Crypto Insider Trader
2k ໂພສ

Crypto Insider Trader
ລາຍງານ
ບລັອກຜູ້ໃຊ້
Trading Expert || Informational Hub. Everything can see experience on top. Let's learn and earn together.
ເປີດການຊື້ຂາຍ
ຜູ້ຊື້ຂາຍປະຈໍາ
4.4 ປີ
67 ກໍາລັງຕິດຕາມ
281 ຜູ້ຕິດຕາມ
625 Liked
ໂພສ
Portfolio
ທັງໝົດ
ວົງຢືມ
ວີດີໂອ

ບົດຄວາມ
Why the Need to Be Right Can Become a Trader's Biggest Weakness━━━━━━━━━━━━━━━━━━━━
Let me start with a confession that almost every trader shares but few admit out loud.
You open a trade. It starts moving against you. Your analysis said it should work. So instead of closing it, you hold. Then you hold a little longer. Then you move your stop "just this once."
Sound familiar?
That moment has nothing to do with charts. It's about ego. And in trading, ego is one of the most expensive things you can carry.
Today we're looking at why the need to be right quietly destroys so many accounts, and what disciplined traders do differently.
━━━━━━━━━━━━━━━━━━━━
◆ THE TRAP: WINNING THE ARGUMENT, LOSING THE ACCOUNT
Most of us grew up being rewarded for being right. Good grades. Correct answers. Praise for getting it "right."
The market plays by different rules. It doesn't care about your opinion, your research, or how confident you felt. It only cares about what price does next.
The problem begins when being right becomes more important than making good decisions. At that point, you're no longer trading the market. You're defending your ego.
➤ A trader focused on being right asks: "How do I prove this trade was correct?"
➤ A trader focused on process asks: "What does the plan say I should do now?"
One mindset bleeds capital. The other protects it.
━━━━━━━━━━━━━━━━━━━━
◆ 5 WAYS THE NEED TO BE RIGHT SHOWS UP IN YOUR TRADING
① Moving or removing your stop-loss**
You set a stop for a reason. Moving it because "price will come back" is often your ego negotiating with your risk plan.
② Averaging down on a losing position**
Adding to a loser isn't always strategy. Sometimes it's a refusal to accept that the original idea didn't work.
③ Refusing to take a small loss**
A small, controlled loss feels like admitting defeat. So the loss grows until it's too big to ignore.
④ Revenge trading**
After a loss, the urge to "win it back" is really the urge to prove you were right all along. This is where bad days become terrible weeks. 😬
⑤ Ignoring information that disagrees with you**
You only read the bullish takes when you're long. You dismiss signals that challenge your view. That's confirmation bias in action.
━━━━━━━━━━━━━━━━━━━━
◆ WHY THIS IS SO HARD TO SEE
Here's the tricky part. The need to be right rarely feels like ego. It feels like conviction. It feels like "sticking to your analysis."
But there's a clear difference:
✔︎ **Conviction** is backed by your rules and a defined invalidation point.
✔︎ **Ego** is backed by emotion and a growing list of excuses.
If your reason for staying in a trade changes after it goes against you, that's a red flag worth paying attention to.
━━━━━━━━━━━━━━━━━━━━
◆ A SIMPLE 3-STEP FRAMEWORK TO BREAK THE HABIT
① Define your "I was wrong" point BEFORE you enter**
Decide in advance what price action tells you the idea is invalid. Write it down. When it's hit, the decision is already made. No debate needed.
② Judge trades by process, not outcome**
A trade that follows your plan and loses is still a good trade. A trade that breaks your rules and wins is still a bad one. Track whether you followed your process, not just your PnL.
③ Reframe losses as the cost of doing business**
Every professional business has expenses. Small losses are yours. When you stop seeing them as personal failures, they lose their emotional power.
━━━━━━━━━━━━━━━━━━━━
◆ WHAT EXPERIENCED TRADERS UNDERSTAND
Seasoned traders rarely talk about being right. They talk about managing risk, staying flexible, and surviving long enough for their edge to play out.
➜ They accept that even a strong strategy has losing trades.
➜ They exit without drama when the setup fails.
➜ They stay curious instead of defensive.
➜ They care more about consistency than about winning every single trade.
The goal was never to be right every time. The goal is to be disciplined every time.
━━━━━━━━━━━━━━━━━━━━
◆ QUICK SELF-CHECK
Ask yourself honestly after your next losing trade:
✔︎ Did I follow my plan?
✔︎ Did I respect my stop?
✔︎ Am I angry at the market, or at being wrong?
✔︎ Would I take this same trade again with a clear head?
Your answers might teach you more than any indicator ever will.
━━━━━━━━━━━━━━━━━━━━
◆ FINAL THOUGHTS
The market will humble everyone eventually. The traders who last aren't the ones who are right most often. They're the ones who can say "I was wrong" quickly, calmly, and without it shaking their confidence.
Letting go of the need to be right isn't weakness. It's one of the strongest edges you can build.
Next time a trade turns against you, pause and ask:
**"Am I protecting my capital, or protecting my ego?"**
That one question can change your trading journey.
━━━━━━━━━━━━━━━━━━━━
YOUR TURN
Which of the 5 signs above have you caught yourself doing? Tell me in the comments, I'd love to hear your experience.
If this helped, like and share it with a trader friend who needs to read it.
Follow for more trading psychology insights.
━━━━━━━━━━━━━━━━━━━━
⚠️ **Risk Disclosure:** This article is for educational purposes only and does not constitute financial or investment advice. Cryptocurrency trading involves significant risk, and you may lose some or all of your capital. Always do your own research and only trade with funds you can afford to lose.
#BinanceIncidentReport #BinanceReopensWithdrawalsForMoreAssets #USMidtermElections #USOctoberNFP-AreRateCutsStillPossible #Nasdaq100EntersCorrection $BTC
{future}(BTCUSDT)
$ETH
{future}(ETHUSDT)
$XRP
{future}(XRPUSDT)
Why the Need to Be Right Can Become a Trader's Biggest Weakness
━━━━━━━━━━━━━━━━━━━━
Let me start with a confession that almost every trader shares but few admit out loud.
You open a trade. It starts moving against you. Your analysis said it should work. So instead of closing it, you hold. Then you hold a little longer. Then you move your stop "just this once."
Sound familiar?
That moment has nothing to do with charts. It's about ego. And in trading, ego is one of the most expensive things you can carry.
Today we're looking at why the need to be right quietly destroys so many accounts, and what disciplined traders do differently.
━━━━━━━━━━━━━━━━━━━━
◆ THE TRAP: WINNING THE ARGUMENT, LOSING THE ACCOUNT
Most of us grew up being rewarded for being right. Good grades. Correct answers. Praise for getting it "right."
The market plays by different rules. It doesn't care about your opinion, your research, or how confident you felt. It only cares about what price does next.
The problem begins when being right becomes more important than making good decisions. At that point, you're no longer trading the market. You're defending your ego.
➤ A trader focused on being right asks: "How do I prove this trade was correct?"
➤ A trader focused on process asks: "What does the plan say I should do now?"
One mindset bleeds capital. The other protects it.
━━━━━━━━━━━━━━━━━━━━
◆ 5 WAYS THE NEED TO BE RIGHT SHOWS UP IN YOUR TRADING
① Moving or removing your stop-loss**
You set a stop for a reason. Moving it because "price will come back" is often your ego negotiating with your risk plan.
② Averaging down on a losing position**
Adding to a loser isn't always strategy. Sometimes it's a refusal to accept that the original idea didn't work.
③ Refusing to take a small loss**
A small, controlled loss feels like admitting defeat. So the loss grows until it's too big to ignore.
④ Revenge trading**
After a loss, the urge to "win it back" is really the urge to prove you were right all along. This is where bad days become terrible weeks. 😬
⑤ Ignoring information that disagrees with you**
You only read the bullish takes when you're long. You dismiss signals that challenge your view. That's confirmation bias in action.
━━━━━━━━━━━━━━━━━━━━
◆ WHY THIS IS SO HARD TO SEE
Here's the tricky part. The need to be right rarely feels like ego. It feels like conviction. It feels like "sticking to your analysis."
But there's a clear difference:
✔︎ **Conviction** is backed by your rules and a defined invalidation point.
✔︎ **Ego** is backed by emotion and a growing list of excuses.
If your reason for staying in a trade changes after it goes against you, that's a red flag worth paying attention to.
━━━━━━━━━━━━━━━━━━━━
◆ A SIMPLE 3-STEP FRAMEWORK TO BREAK THE HABIT
① Define your "I was wrong" point BEFORE you enter**
Decide in advance what price action tells you the idea is invalid. Write it down. When it's hit, the decision is already made. No debate needed.
② Judge trades by process, not outcome**
A trade that follows your plan and loses is still a good trade. A trade that breaks your rules and wins is still a bad one. Track whether you followed your process, not just your PnL.
③ Reframe losses as the cost of doing business**
Every professional business has expenses. Small losses are yours. When you stop seeing them as personal failures, they lose their emotional power.
━━━━━━━━━━━━━━━━━━━━
◆ WHAT EXPERIENCED TRADERS UNDERSTAND
Seasoned traders rarely talk about being right. They talk about managing risk, staying flexible, and surviving long enough for their edge to play out.
➜ They accept that even a strong strategy has losing trades.
➜ They exit without drama when the setup fails.
➜ They stay curious instead of defensive.
➜ They care more about consistency than about winning every single trade.
The goal was never to be right every time. The goal is to be disciplined every time.
━━━━━━━━━━━━━━━━━━━━
◆ QUICK SELF-CHECK
Ask yourself honestly after your next losing trade:
✔︎ Did I follow my plan?
✔︎ Did I respect my stop?
✔︎ Am I angry at the market, or at being wrong?
✔︎ Would I take this same trade again with a clear head?
Your answers might teach you more than any indicator ever will.
━━━━━━━━━━━━━━━━━━━━
◆ FINAL THOUGHTS
The market will humble everyone eventually. The traders who last aren't the ones who are right most often. They're the ones who can say "I was wrong" quickly, calmly, and without it shaking their confidence.
Letting go of the need to be right isn't weakness. It's one of the strongest edges you can build.
Next time a trade turns against you, pause and ask:
**"Am I protecting my capital, or protecting my ego?"**
That one question can change your trading journey.
━━━━━━━━━━━━━━━━━━━━
YOUR TURN
Which of the 5 signs above have you caught yourself doing? Tell me in the comments, I'd love to hear your experience.
If this helped, like and share it with a trader friend who needs to read it.
Follow for more trading psychology insights.
━━━━━━━━━━━━━━━━━━━━
⚠️ **Risk Disclosure:** This article is for educational purposes only and does not constitute financial or investment advice. Cryptocurrency trading involves significant risk, and you may lose some or all of your capital. Always do your own research and only trade with funds you can afford to lose.
#BinanceIncidentReport #BinanceReopensWithdrawalsForMoreAssets #USMidtermElections #USOctoberNFP-AreRateCutsStillPossible #Nasdaq100EntersCorrection $BTC
$ETH
$XRP
Let me start with a confession that almost every trader shares but few admit out loud.
You open a trade. It starts moving against you. Your analysis said it should work. So instead of closing it, you hold. Then you hold a little longer. Then you move your stop "just this once."
Sound familiar?
That moment has nothing to do with charts. It's about ego. And in trading, ego is one of the most expensive things you can carry.
Today we're looking at why the need to be right quietly destroys so many accounts, and what disciplined traders do differently.
━━━━━━━━━━━━━━━━━━━━
◆ THE TRAP: WINNING THE ARGUMENT, LOSING THE ACCOUNT
Most of us grew up being rewarded for being right. Good grades. Correct answers. Praise for getting it "right."
The market plays by different rules. It doesn't care about your opinion, your research, or how confident you felt. It only cares about what price does next.
The problem begins when being right becomes more important than making good decisions. At that point, you're no longer trading the market. You're defending your ego.
➤ A trader focused on being right asks: "How do I prove this trade was correct?"
➤ A trader focused on process asks: "What does the plan say I should do now?"
One mindset bleeds capital. The other protects it.
━━━━━━━━━━━━━━━━━━━━
◆ 5 WAYS THE NEED TO BE RIGHT SHOWS UP IN YOUR TRADING
① Moving or removing your stop-loss**
You set a stop for a reason. Moving it because "price will come back" is often your ego negotiating with your risk plan.
② Averaging down on a losing position**
Adding to a loser isn't always strategy. Sometimes it's a refusal to accept that the original idea didn't work.
③ Refusing to take a small loss**
A small, controlled loss feels like admitting defeat. So the loss grows until it's too big to ignore.
④ Revenge trading**
After a loss, the urge to "win it back" is really the urge to prove you were right all along. This is where bad days become terrible weeks. 😬
⑤ Ignoring information that disagrees with you**
You only read the bullish takes when you're long. You dismiss signals that challenge your view. That's confirmation bias in action.
━━━━━━━━━━━━━━━━━━━━
◆ WHY THIS IS SO HARD TO SEE
Here's the tricky part. The need to be right rarely feels like ego. It feels like conviction. It feels like "sticking to your analysis."
But there's a clear difference:
✔︎ **Conviction** is backed by your rules and a defined invalidation point.
✔︎ **Ego** is backed by emotion and a growing list of excuses.
If your reason for staying in a trade changes after it goes against you, that's a red flag worth paying attention to.
━━━━━━━━━━━━━━━━━━━━
◆ A SIMPLE 3-STEP FRAMEWORK TO BREAK THE HABIT
① Define your "I was wrong" point BEFORE you enter**
Decide in advance what price action tells you the idea is invalid. Write it down. When it's hit, the decision is already made. No debate needed.
② Judge trades by process, not outcome**
A trade that follows your plan and loses is still a good trade. A trade that breaks your rules and wins is still a bad one. Track whether you followed your process, not just your PnL.
③ Reframe losses as the cost of doing business**
Every professional business has expenses. Small losses are yours. When you stop seeing them as personal failures, they lose their emotional power.
━━━━━━━━━━━━━━━━━━━━
◆ WHAT EXPERIENCED TRADERS UNDERSTAND
Seasoned traders rarely talk about being right. They talk about managing risk, staying flexible, and surviving long enough for their edge to play out.
➜ They accept that even a strong strategy has losing trades.
➜ They exit without drama when the setup fails.
➜ They stay curious instead of defensive.
➜ They care more about consistency than about winning every single trade.
The goal was never to be right every time. The goal is to be disciplined every time.
━━━━━━━━━━━━━━━━━━━━
◆ QUICK SELF-CHECK
Ask yourself honestly after your next losing trade:
✔︎ Did I follow my plan?
✔︎ Did I respect my stop?
✔︎ Am I angry at the market, or at being wrong?
✔︎ Would I take this same trade again with a clear head?
Your answers might teach you more than any indicator ever will.
━━━━━━━━━━━━━━━━━━━━
◆ FINAL THOUGHTS
The market will humble everyone eventually. The traders who last aren't the ones who are right most often. They're the ones who can say "I was wrong" quickly, calmly, and without it shaking their confidence.
Letting go of the need to be right isn't weakness. It's one of the strongest edges you can build.
Next time a trade turns against you, pause and ask:
**"Am I protecting my capital, or protecting my ego?"**
That one question can change your trading journey.
━━━━━━━━━━━━━━━━━━━━
YOUR TURN
Which of the 5 signs above have you caught yourself doing? Tell me in the comments, I'd love to hear your experience.
If this helped, like and share it with a trader friend who needs to read it.
Follow for more trading psychology insights.
━━━━━━━━━━━━━━━━━━━━
⚠️ **Risk Disclosure:** This article is for educational purposes only and does not constitute financial or investment advice. Cryptocurrency trading involves significant risk, and you may lose some or all of your capital. Always do your own research and only trade with funds you can afford to lose.
#BinanceIncidentReport #BinanceReopensWithdrawalsForMoreAssets #USMidtermElections #USOctoberNFP-AreRateCutsStillPossible #Nasdaq100EntersCorrection $BTC
$ETH
$XRP
4
77
ບົດຄວາມ
DOGE Slips Below Support: Is $0.070 Next?◆━━━━━━━━━━━━━━━━━━━━
MARKET OVERVIEW
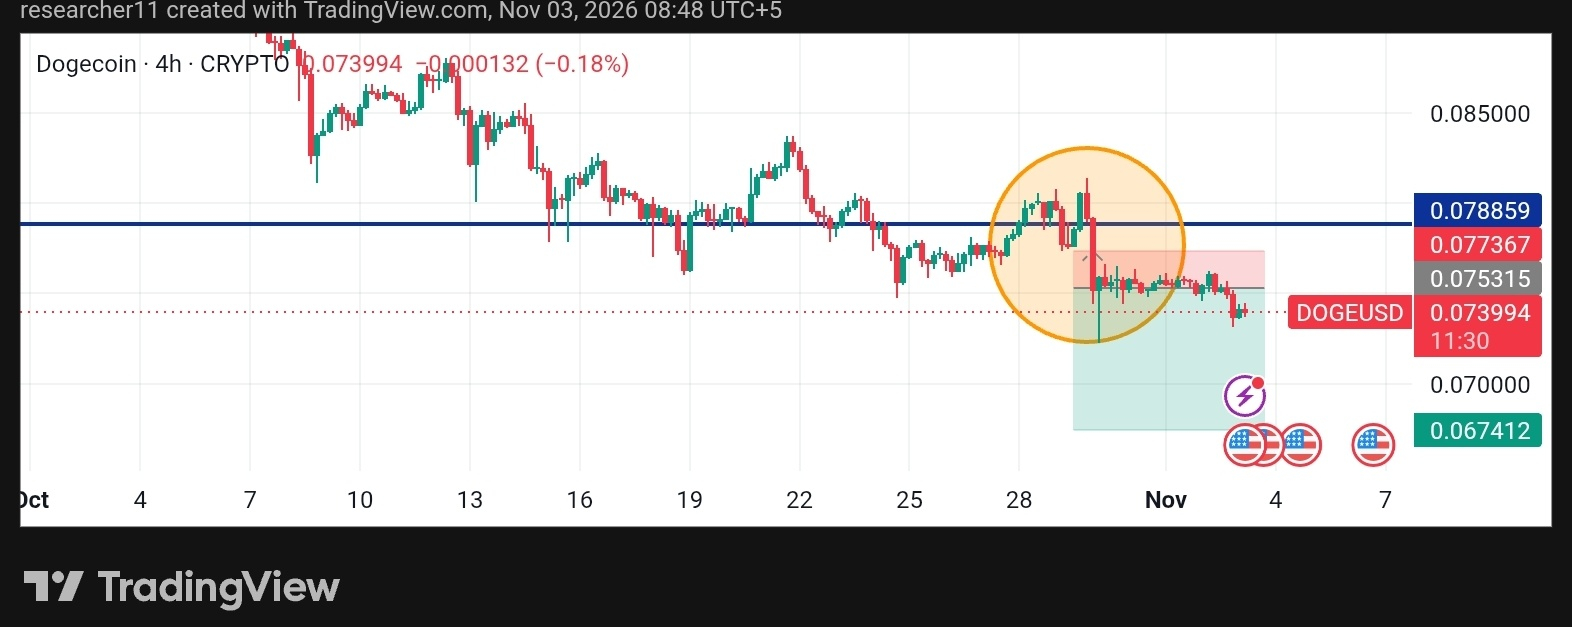
Dogecoin is trading near $0.0740 on the 4H chart, extending a gradual downtrend. After failing to hold the $0.0788 zone, DOGE lost its short-term range and printed a fresh lower low. Momentum remains weak and rallies are being sold.
◆━━━━━━━━━━━━━━━━━━━━
TECHNICAL ANALYSIS
The $0.0788 level acted as a strong resistance, and the highlighted rejection area shows where buyers failed to break higher. The sharp drop that followed shifted control to sellers.
After that drop, DOGE consolidated in a narrow range just below $0.0753. That range has now broken to the downside, and the former support zone is acting as resistance. Lower highs and lower lows keep the trend bearish.
The next area of interest is the psychological $0.0700 level. Below it, $0.0674 stands out as the next downside reference.
◆━━━━━━━━━━━━━━━━━━━━
SCENARIO ANALYSIS
🟢 Bullish Case: DOGE needs to reclaim $0.0753 and hold above it on a 4H close. A move through $0.0774 would add strength, and $0.0788 would be the major test of trend change.
🔴 Bearish Case: A 4H close below $0.0733 could pull price toward $0.0700. Losing that level may expose $0.0674.
⚪ Neutral Case: DOGE could range between $0.0700 and $0.0753 while momentum resets.
◆━━━━━━━━━━━━━━━━━━━━
KEY LEVELS
🔺 Resistance: R1 $0.0753 | R2 $0.0774 | R3 $0.0788
🔻 Support: S1 $0.0700 | S2 $0.0674
◆━━━━━━━━━━━━━━━━━━━━
MARKET CONTEXT
Meme coins tend to react strongly to overall market sentiment and Bitcoin moves. Cautious risk appetite usually weighs on DOGE, so watch BTC for direction.
◆━━━━━━━━━━━━━━━━━━━━
OUTLOOK
Watch how DOGE reacts near $0.0700 and whether it can recover $0.0753. Confirmation and risk management matter most in weak trends.
◆━━━━━━━━━━━━━━━━━━━━
⚠️ This is market analysis, not financial advice. Always do your own research.
#Dogecoin #doge⚡ #USMidtermElections #BinanceWithdrawalScamWarning $DOGE
{future}(DOGEUSDT)
DOGE Slips Below Support: Is $0.070 Next?
◆━━━━━━━━━━━━━━━━━━━━
MARKET OVERVIEW
Dogecoin is trading near $0.0740 on the 4H chart, extending a gradual downtrend. After failing to hold the $0.0788 zone, DOGE lost its short-term range and printed a fresh lower low. Momentum remains weak and rallies are being sold.
◆━━━━━━━━━━━━━━━━━━━━
TECHNICAL ANALYSIS
The $0.0788 level acted as a strong resistance, and the highlighted rejection area shows where buyers failed to break higher. The sharp drop that followed shifted control to sellers.
After that drop, DOGE consolidated in a narrow range just below $0.0753. That range has now broken to the downside, and the former support zone is acting as resistance. Lower highs and lower lows keep the trend bearish.
The next area of interest is the psychological $0.0700 level. Below it, $0.0674 stands out as the next downside reference.
◆━━━━━━━━━━━━━━━━━━━━
SCENARIO ANALYSIS
🟢 Bullish Case: DOGE needs to reclaim $0.0753 and hold above it on a 4H close. A move through $0.0774 would add strength, and $0.0788 would be the major test of trend change.
🔴 Bearish Case: A 4H close below $0.0733 could pull price toward $0.0700. Losing that level may expose $0.0674.
⚪ Neutral Case: DOGE could range between $0.0700 and $0.0753 while momentum resets.
◆━━━━━━━━━━━━━━━━━━━━
KEY LEVELS
🔺 Resistance: R1 $0.0753 | R2 $0.0774 | R3 $0.0788
🔻 Support: S1 $0.0700 | S2 $0.0674
◆━━━━━━━━━━━━━━━━━━━━
MARKET CONTEXT
Meme coins tend to react strongly to overall market sentiment and Bitcoin moves. Cautious risk appetite usually weighs on DOGE, so watch BTC for direction.
◆━━━━━━━━━━━━━━━━━━━━
OUTLOOK
Watch how DOGE reacts near $0.0700 and whether it can recover $0.0753. Confirmation and risk management matter most in weak trends.
◆━━━━━━━━━━━━━━━━━━━━
⚠️ This is market analysis, not financial advice. Always do your own research.
#Dogecoin #doge⚡ #USMidtermElections #BinanceWithdrawalScamWarning $DOGE
MARKET OVERVIEW
Dogecoin is trading near $0.0740 on the 4H chart, extending a gradual downtrend. After failing to hold the $0.0788 zone, DOGE lost its short-term range and printed a fresh lower low. Momentum remains weak and rallies are being sold.
◆━━━━━━━━━━━━━━━━━━━━
TECHNICAL ANALYSIS
The $0.0788 level acted as a strong resistance, and the highlighted rejection area shows where buyers failed to break higher. The sharp drop that followed shifted control to sellers.
After that drop, DOGE consolidated in a narrow range just below $0.0753. That range has now broken to the downside, and the former support zone is acting as resistance. Lower highs and lower lows keep the trend bearish.
The next area of interest is the psychological $0.0700 level. Below it, $0.0674 stands out as the next downside reference.
◆━━━━━━━━━━━━━━━━━━━━
SCENARIO ANALYSIS
🟢 Bullish Case: DOGE needs to reclaim $0.0753 and hold above it on a 4H close. A move through $0.0774 would add strength, and $0.0788 would be the major test of trend change.
🔴 Bearish Case: A 4H close below $0.0733 could pull price toward $0.0700. Losing that level may expose $0.0674.
⚪ Neutral Case: DOGE could range between $0.0700 and $0.0753 while momentum resets.
◆━━━━━━━━━━━━━━━━━━━━
KEY LEVELS
🔺 Resistance: R1 $0.0753 | R2 $0.0774 | R3 $0.0788
🔻 Support: S1 $0.0700 | S2 $0.0674
◆━━━━━━━━━━━━━━━━━━━━
MARKET CONTEXT
Meme coins tend to react strongly to overall market sentiment and Bitcoin moves. Cautious risk appetite usually weighs on DOGE, so watch BTC for direction.
◆━━━━━━━━━━━━━━━━━━━━
OUTLOOK
Watch how DOGE reacts near $0.0700 and whether it can recover $0.0753. Confirmation and risk management matter most in weak trends.
◆━━━━━━━━━━━━━━━━━━━━
⚠️ This is market analysis, not financial advice. Always do your own research.
#Dogecoin #doge⚡ #USMidtermElections #BinanceWithdrawalScamWarning $DOGE
1
75
ບົດຄວາມ
XRP Stuck in a Tight Range After Bearish Breakdown◆━━━━━━━━━━━━━━━━━━━━
MARKET OVERVIEW
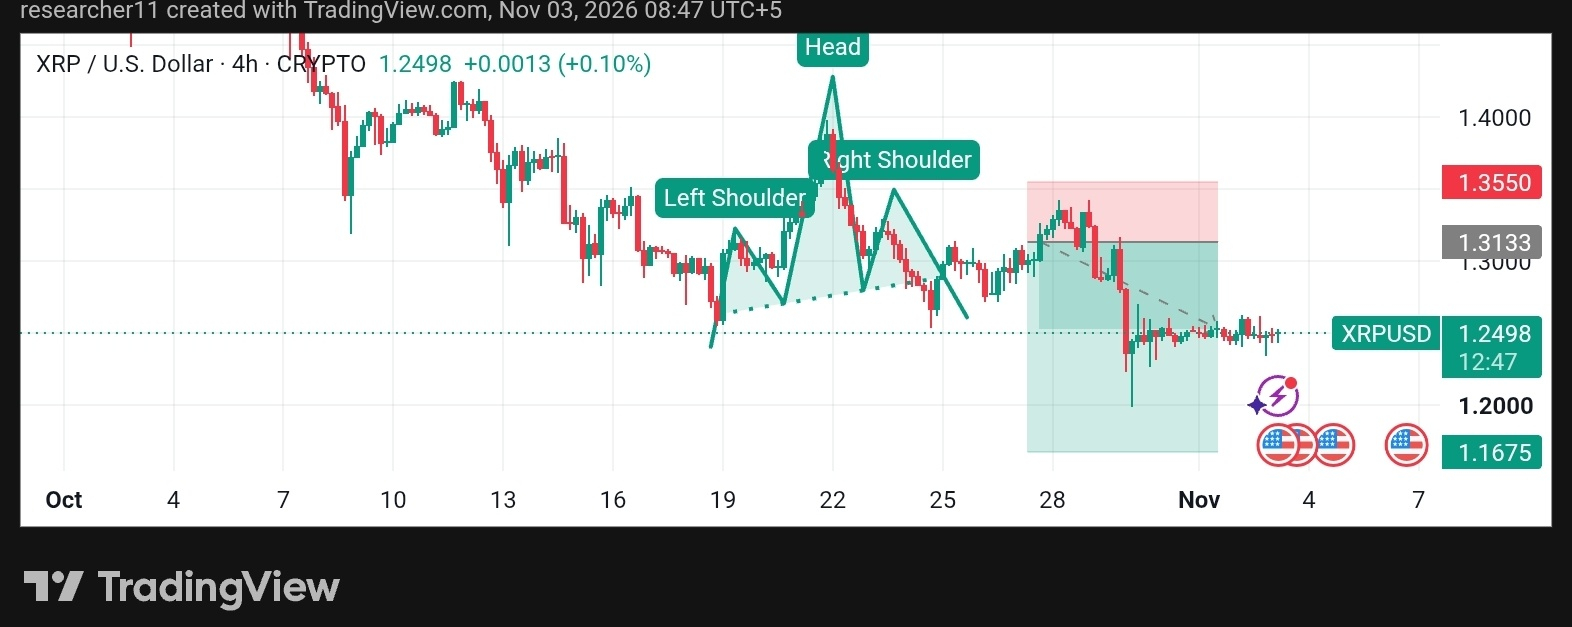
XRP is trading near $1.25 on the 4H chart, moving sideways after a sharp sell-off. Volatility has dropped sharply as price compresses just above the recent low. Compression often comes before a larger move, but the direction is not confirmed yet.
◆━━━━━━━━━━━━━━━━━━━━
TECHNICAL ANALYSIS
XRP built a Head and Shoulders structure through October, with the head near the $1.45 area. Price broke below the neckline around $1.31 and dropped quickly toward $1.20, where buyers stepped in with a long lower wick.
Since then, XRP has been trading in a narrow band between roughly $1.23 and $1.27. The former neckline near $1.31 now acts as resistance. The overall structure is bearish, but the market is pausing.
A tight range after a drop can be consolidation before continuation, or the base for a recovery. The breakout from this range is what matters.
◆━━━━━━━━━━━━━━━━━━━━
SCENARIO ANALYSIS
🟢 Bullish Case: A 4H close above $1.31 would reclaim the neckline and suggest the breakdown has failed. Above that, $1.355 is the next hurdle.
🔴 Bearish Case: A decisive 4H close below $1.20 would break the recent low and open the way toward $1.1675.
⚪ Neutral Case: Sideways movement between $1.20 and $1.31 can continue until a catalyst arrives.
◆━━━━━━━━━━━━━━━━━━━━
KEY LEVELS
🔺 Resistance: R1 $1.3133 | R2 $1.3550
🔻 Support: S1 $1.20 | S2 $1.1675
◆━━━━━━━━━━━━━━━━━━━━
MARKET CONTEXT
XRP is following the broader market tone. A stable Bitcoin could support a range-bound XRP, while a BTC breakdown may increase pressure here.
◆━━━━━━━━━━━━━━━━━━━━
OUTLOOK
Watch for a clean break of the $1.20–$1.31 range. Until then, patience is key, and traders should avoid chasing moves inside a tight range.
◆━━━━━━━━━━━━━━━━━━━━
⚠️ This is market analysis, not financial advice. Always do your own research.
#Xrp🔥🔥 #XRPPredictions #USMidtermElections #BinanceWithdrawalScamWarning #Verify1to1BinanceReserves $XRP
{future}(XRPUSDT)
XRP Stuck in a Tight Range After Bearish Breakdown
◆━━━━━━━━━━━━━━━━━━━━
MARKET OVERVIEW
XRP is trading near $1.25 on the 4H chart, moving sideways after a sharp sell-off. Volatility has dropped sharply as price compresses just above the recent low. Compression often comes before a larger move, but the direction is not confirmed yet.
◆━━━━━━━━━━━━━━━━━━━━
TECHNICAL ANALYSIS
XRP built a Head and Shoulders structure through October, with the head near the $1.45 area. Price broke below the neckline around $1.31 and dropped quickly toward $1.20, where buyers stepped in with a long lower wick.
Since then, XRP has been trading in a narrow band between roughly $1.23 and $1.27. The former neckline near $1.31 now acts as resistance. The overall structure is bearish, but the market is pausing.
A tight range after a drop can be consolidation before continuation, or the base for a recovery. The breakout from this range is what matters.
◆━━━━━━━━━━━━━━━━━━━━
SCENARIO ANALYSIS
🟢 Bullish Case: A 4H close above $1.31 would reclaim the neckline and suggest the breakdown has failed. Above that, $1.355 is the next hurdle.
🔴 Bearish Case: A decisive 4H close below $1.20 would break the recent low and open the way toward $1.1675.
⚪ Neutral Case: Sideways movement between $1.20 and $1.31 can continue until a catalyst arrives.
◆━━━━━━━━━━━━━━━━━━━━
KEY LEVELS
🔺 Resistance: R1 $1.3133 | R2 $1.3550
🔻 Support: S1 $1.20 | S2 $1.1675
◆━━━━━━━━━━━━━━━━━━━━
MARKET CONTEXT
XRP is following the broader market tone. A stable Bitcoin could support a range-bound XRP, while a BTC breakdown may increase pressure here.
◆━━━━━━━━━━━━━━━━━━━━
OUTLOOK
Watch for a clean break of the $1.20–$1.31 range. Until then, patience is key, and traders should avoid chasing moves inside a tight range.
◆━━━━━━━━━━━━━━━━━━━━
⚠️ This is market analysis, not financial advice. Always do your own research.
#Xrp🔥🔥 #XRPPredictions #USMidtermElections #BinanceWithdrawalScamWarning #Verify1to1BinanceReserves $XRP
MARKET OVERVIEW
XRP is trading near $1.25 on the 4H chart, moving sideways after a sharp sell-off. Volatility has dropped sharply as price compresses just above the recent low. Compression often comes before a larger move, but the direction is not confirmed yet.
◆━━━━━━━━━━━━━━━━━━━━
TECHNICAL ANALYSIS
XRP built a Head and Shoulders structure through October, with the head near the $1.45 area. Price broke below the neckline around $1.31 and dropped quickly toward $1.20, where buyers stepped in with a long lower wick.
Since then, XRP has been trading in a narrow band between roughly $1.23 and $1.27. The former neckline near $1.31 now acts as resistance. The overall structure is bearish, but the market is pausing.
A tight range after a drop can be consolidation before continuation, or the base for a recovery. The breakout from this range is what matters.
◆━━━━━━━━━━━━━━━━━━━━
SCENARIO ANALYSIS
🟢 Bullish Case: A 4H close above $1.31 would reclaim the neckline and suggest the breakdown has failed. Above that, $1.355 is the next hurdle.
🔴 Bearish Case: A decisive 4H close below $1.20 would break the recent low and open the way toward $1.1675.
⚪ Neutral Case: Sideways movement between $1.20 and $1.31 can continue until a catalyst arrives.
◆━━━━━━━━━━━━━━━━━━━━
KEY LEVELS
🔺 Resistance: R1 $1.3133 | R2 $1.3550
🔻 Support: S1 $1.20 | S2 $1.1675
◆━━━━━━━━━━━━━━━━━━━━
MARKET CONTEXT
XRP is following the broader market tone. A stable Bitcoin could support a range-bound XRP, while a BTC breakdown may increase pressure here.
◆━━━━━━━━━━━━━━━━━━━━
OUTLOOK
Watch for a clean break of the $1.20–$1.31 range. Until then, patience is key, and traders should avoid chasing moves inside a tight range.
◆━━━━━━━━━━━━━━━━━━━━
⚠️ This is market analysis, not financial advice. Always do your own research.
#Xrp🔥🔥 #XRPPredictions #USMidtermElections #BinanceWithdrawalScamWarning #Verify1to1BinanceReserves $XRP
1
909
ບົດຄວາມ
ETH Breaks Down: Head & Shoulders in Play◆━━━━━━━━━━━━━━━━━━━━
MARKET OVERVIEW
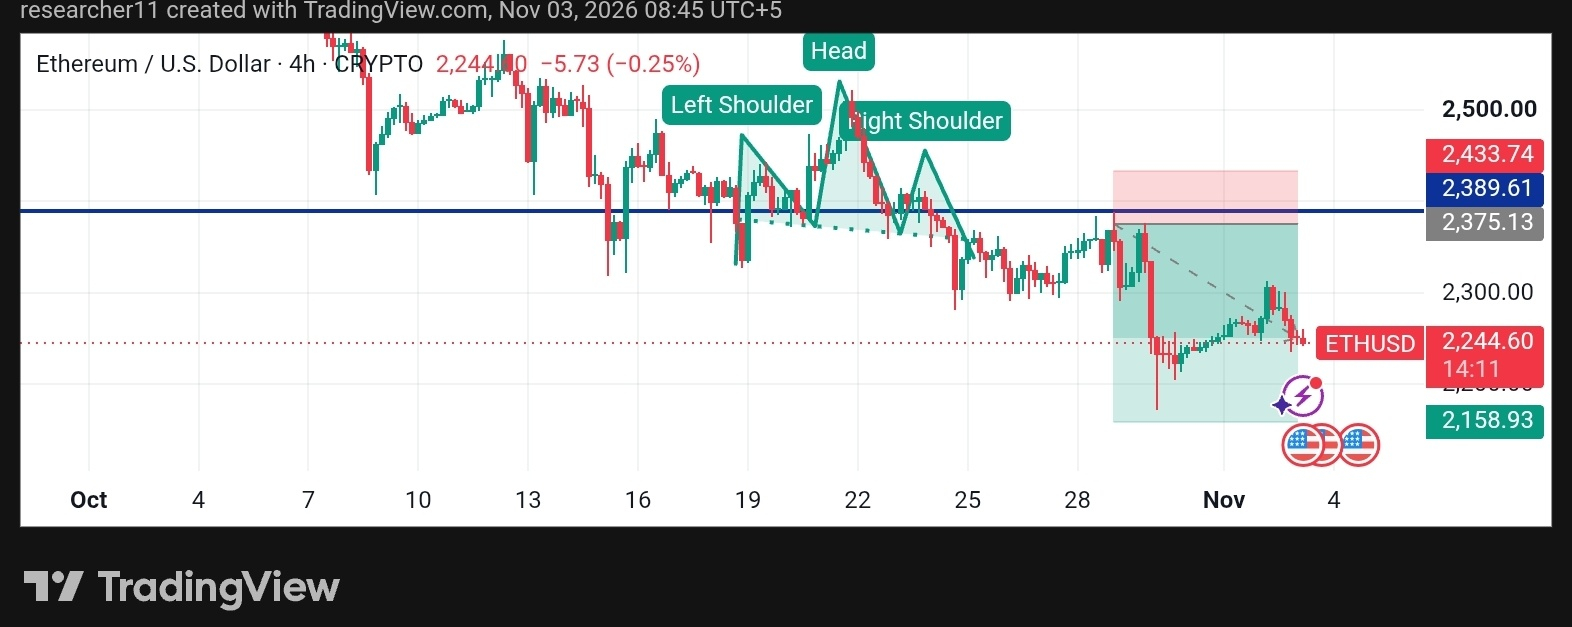
Ethereum is trading near $2,244 on the 4H chart, keeping a clear bearish tone. After failing to hold the $2,380 area, ETH dropped sharply and has since made only a modest recovery. Volatility has cooled, but sellers still have the upper hand.
◆━━━━━━━━━━━━━━━━━━━━
TECHNICAL ANALYSIS
ETH formed a visible Head and Shoulders pattern in October. The left shoulder, head and right shoulder built up around the $2,400–$2,500 zone, followed by a break below the neckline near $2,380.
Price retested that area, and the retest failed. The bounce stalled near $2,310 and rolled over, keeping the lower-high sequence intact. This kind of break-and-retest behavior is a typical confirmation of the pattern.
The $2,300 area has now turned into short-term resistance, while $2,160 is the key downside area, where the last sharp drop found buyers.
◆━━━━━━━━━━━━━━━━━━━━
SCENARIO ANALYSIS
🟢 Bullish Case: ETH needs to reclaim $2,300 and then push above the $2,375–$2,390 neckline zone on a 4H close. That would weaken the pattern and suggest a failed breakdown.
🔴 Bearish Case: A 4H close below $2,200 could bring $2,159 back into focus. Losing that level would extend the bearish structure.
⚪ Neutral Case: ETH may range between $2,160 and $2,310 while the market digests the move.
◆━━━━━━━━━━━━━━━━━━━━
KEY LEVELS
🔺 Resistance: R1 $2,300 | R2 $2,375 | R3 $2,434
🔻 Support: S1 $2,200 | S2 $2,159
◆━━━━━━━━━━━━━━━━━━━━
MARKET CONTEXT
ETH is moving in step with Bitcoin. If BTC loses its support, ETH could face extra pressure. A BTC recovery would likely help ETH test resistance.
◆━━━━━━━━━━━━━━━━━━━━
OUTLOOK
Traders should watch $2,300 as a resistance test and $2,159 as the key support. Patience and confirmation matter more than prediction here.
◆━━━━━━━━━━━━━━━━━━━━
⚠️ This is market analysis, not financial advice. Always do your own research.
#Ethereum #BinanceReopensWithdrawalsForMoreAssets #USMidtermElections #BinanceWithdrawalScamWarning $ETH
{future}(ETHUSDT)
ETH Breaks Down: Head & Shoulders in Play
◆━━━━━━━━━━━━━━━━━━━━
MARKET OVERVIEW
Ethereum is trading near $2,244 on the 4H chart, keeping a clear bearish tone. After failing to hold the $2,380 area, ETH dropped sharply and has since made only a modest recovery. Volatility has cooled, but sellers still have the upper hand.
◆━━━━━━━━━━━━━━━━━━━━
TECHNICAL ANALYSIS
ETH formed a visible Head and Shoulders pattern in October. The left shoulder, head and right shoulder built up around the $2,400–$2,500 zone, followed by a break below the neckline near $2,380.
Price retested that area, and the retest failed. The bounce stalled near $2,310 and rolled over, keeping the lower-high sequence intact. This kind of break-and-retest behavior is a typical confirmation of the pattern.
The $2,300 area has now turned into short-term resistance, while $2,160 is the key downside area, where the last sharp drop found buyers.
◆━━━━━━━━━━━━━━━━━━━━
SCENARIO ANALYSIS
🟢 Bullish Case: ETH needs to reclaim $2,300 and then push above the $2,375–$2,390 neckline zone on a 4H close. That would weaken the pattern and suggest a failed breakdown.
🔴 Bearish Case: A 4H close below $2,200 could bring $2,159 back into focus. Losing that level would extend the bearish structure.
⚪ Neutral Case: ETH may range between $2,160 and $2,310 while the market digests the move.
◆━━━━━━━━━━━━━━━━━━━━
KEY LEVELS
🔺 Resistance: R1 $2,300 | R2 $2,375 | R3 $2,434
🔻 Support: S1 $2,200 | S2 $2,159
◆━━━━━━━━━━━━━━━━━━━━
MARKET CONTEXT
ETH is moving in step with Bitcoin. If BTC loses its support, ETH could face extra pressure. A BTC recovery would likely help ETH test resistance.
◆━━━━━━━━━━━━━━━━━━━━
OUTLOOK
Traders should watch $2,300 as a resistance test and $2,159 as the key support. Patience and confirmation matter more than prediction here.
◆━━━━━━━━━━━━━━━━━━━━
⚠️ This is market analysis, not financial advice. Always do your own research.
#Ethereum #BinanceReopensWithdrawalsForMoreAssets #USMidtermElections #BinanceWithdrawalScamWarning $ETH
MARKET OVERVIEW
Ethereum is trading near $2,244 on the 4H chart, keeping a clear bearish tone. After failing to hold the $2,380 area, ETH dropped sharply and has since made only a modest recovery. Volatility has cooled, but sellers still have the upper hand.
◆━━━━━━━━━━━━━━━━━━━━
TECHNICAL ANALYSIS
ETH formed a visible Head and Shoulders pattern in October. The left shoulder, head and right shoulder built up around the $2,400–$2,500 zone, followed by a break below the neckline near $2,380.
Price retested that area, and the retest failed. The bounce stalled near $2,310 and rolled over, keeping the lower-high sequence intact. This kind of break-and-retest behavior is a typical confirmation of the pattern.
The $2,300 area has now turned into short-term resistance, while $2,160 is the key downside area, where the last sharp drop found buyers.
◆━━━━━━━━━━━━━━━━━━━━
SCENARIO ANALYSIS
🟢 Bullish Case: ETH needs to reclaim $2,300 and then push above the $2,375–$2,390 neckline zone on a 4H close. That would weaken the pattern and suggest a failed breakdown.
🔴 Bearish Case: A 4H close below $2,200 could bring $2,159 back into focus. Losing that level would extend the bearish structure.
⚪ Neutral Case: ETH may range between $2,160 and $2,310 while the market digests the move.
◆━━━━━━━━━━━━━━━━━━━━
KEY LEVELS
🔺 Resistance: R1 $2,300 | R2 $2,375 | R3 $2,434
🔻 Support: S1 $2,200 | S2 $2,159
◆━━━━━━━━━━━━━━━━━━━━
MARKET CONTEXT
ETH is moving in step with Bitcoin. If BTC loses its support, ETH could face extra pressure. A BTC recovery would likely help ETH test resistance.
◆━━━━━━━━━━━━━━━━━━━━
OUTLOOK
Traders should watch $2,300 as a resistance test and $2,159 as the key support. Patience and confirmation matter more than prediction here.
◆━━━━━━━━━━━━━━━━━━━━
⚠️ This is market analysis, not financial advice. Always do your own research.
#Ethereum #BinanceReopensWithdrawalsForMoreAssets #USMidtermElections #BinanceWithdrawalScamWarning $ETH
1
117
ບົດຄວາມ
BTC Under Pressure: Will $75.8K Hold?◆━━━━━━━━━━━━━━━━━━━━
MARKET OVERVIEW
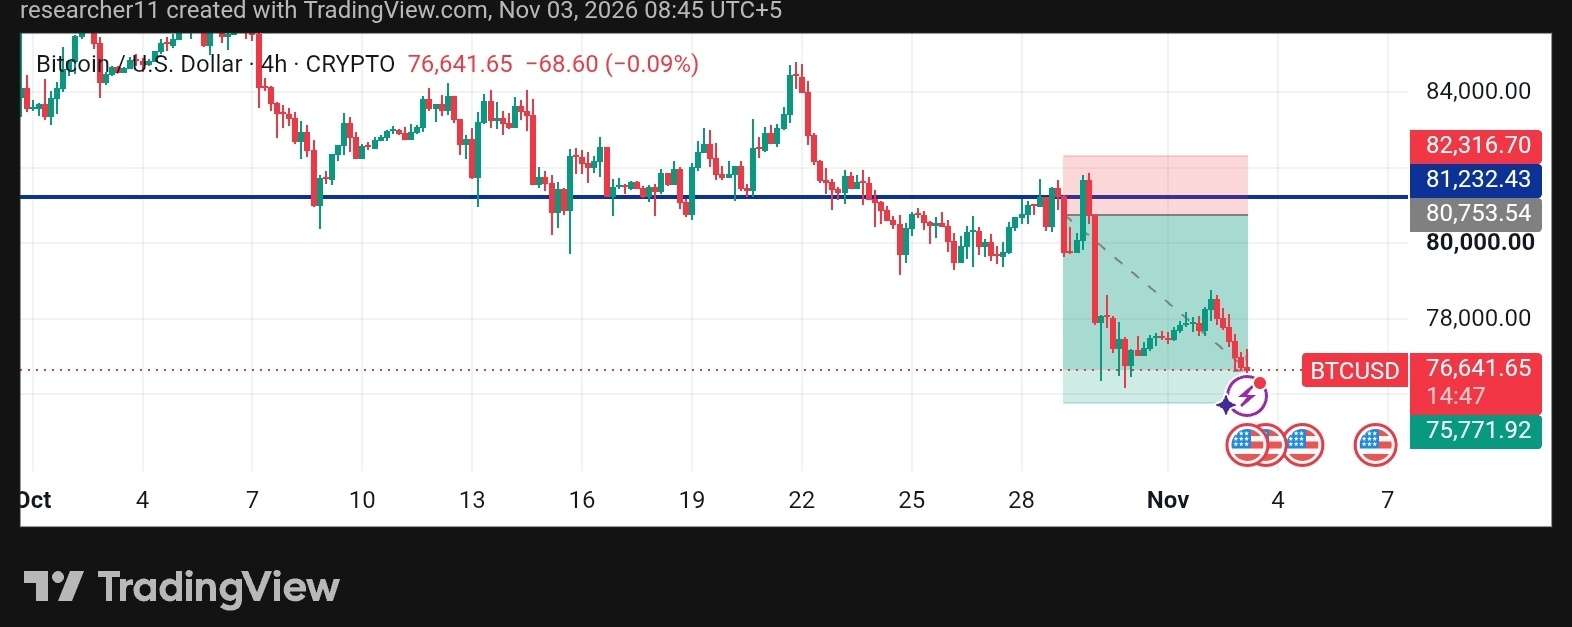
Bitcoin is trading near $76,640 on the 4H chart, almost 10% below its late-October high above $84K. After a sharp rejection from the $81K zone, sellers have stayed in control. The bounce toward $79K faded quickly, a sign that buyers are cautious.
◆━━━━━━━━━━━━━━━━━━━━
TECHNICAL ANALYSIS
The $81,232 level was the middle of a multi-week range. Once BTC lost it, it flipped from support to resistance. The retest around Oct 30 failed with a strong rejection candle, a classic break-and-retest structure.
Since then, BTC has made lower highs and lower lows. The recent recovery to about $79K was weak and ended in a fresh drop. Price is now back near the $75.8K–$76K area, where the last swing low formed.
The trend is bearish short term. Until BTC reclaims the broken range, rallies look more like relief bounces than reversals.
◆━━━━━━━━━━━━━━━━━━━━
SCENARIO ANALYSIS
🟢 Bullish Case: A strong 4H close above $78,000, then a push back above $80,000, would show buyers regaining control. A reclaim of $81,232 would put the bearish structure in doubt.
🔴 Bearish Case: A clean 4H close below $75,770 could open the way to deeper lows, since there is little structure beneath this zone.
⚪ Neutral Case: BTC may chop between $75,800 and $78,000 while the market waits for a catalyst.
◆━━━━━━━━━━━━━━━━━━━━
KEY LEVELS
🔺 Resistance: R1 $78,000 | R2 $80,750 | R3 $81,232
🔻 Support: S1 $75,770 | S2 below this level, price discovery on the downside
◆━━━━━━━━━━━━━━━━━━━━
MARKET CONTEXT
Bitcoin leads the market. Weakness in BTC has pulled major altcoins lower, so its reaction at this support will likely set the tone for the rest of the market.
◆━━━━━━━━━━━━━━━━━━━━
OUTLOOK
Watch the $75.8K support closely. Reactions at $78K and $81K will show whether this is a pause or a continuation. Wait for confirmation and manage risk carefully.
◆━━━━━━━━━━━━━━━━━━━━
This is market analysis, not financial advice. Always do your own research.
#USMidtermElections #btc70k #bitcoin #BinanceRestores28FiatWithdrawals $BTC
{future}(BTCUSDT)
BTC Under Pressure: Will $75.8K Hold?
◆━━━━━━━━━━━━━━━━━━━━
MARKET OVERVIEW
Bitcoin is trading near $76,640 on the 4H chart, almost 10% below its late-October high above $84K. After a sharp rejection from the $81K zone, sellers have stayed in control. The bounce toward $79K faded quickly, a sign that buyers are cautious.
◆━━━━━━━━━━━━━━━━━━━━
TECHNICAL ANALYSIS
The $81,232 level was the middle of a multi-week range. Once BTC lost it, it flipped from support to resistance. The retest around Oct 30 failed with a strong rejection candle, a classic break-and-retest structure.
Since then, BTC has made lower highs and lower lows. The recent recovery to about $79K was weak and ended in a fresh drop. Price is now back near the $75.8K–$76K area, where the last swing low formed.
The trend is bearish short term. Until BTC reclaims the broken range, rallies look more like relief bounces than reversals.
◆━━━━━━━━━━━━━━━━━━━━
SCENARIO ANALYSIS
🟢 Bullish Case: A strong 4H close above $78,000, then a push back above $80,000, would show buyers regaining control. A reclaim of $81,232 would put the bearish structure in doubt.
🔴 Bearish Case: A clean 4H close below $75,770 could open the way to deeper lows, since there is little structure beneath this zone.
⚪ Neutral Case: BTC may chop between $75,800 and $78,000 while the market waits for a catalyst.
◆━━━━━━━━━━━━━━━━━━━━
KEY LEVELS
🔺 Resistance: R1 $78,000 | R2 $80,750 | R3 $81,232
🔻 Support: S1 $75,770 | S2 below this level, price discovery on the downside
◆━━━━━━━━━━━━━━━━━━━━
MARKET CONTEXT
Bitcoin leads the market. Weakness in BTC has pulled major altcoins lower, so its reaction at this support will likely set the tone for the rest of the market.
◆━━━━━━━━━━━━━━━━━━━━
OUTLOOK
Watch the $75.8K support closely. Reactions at $78K and $81K will show whether this is a pause or a continuation. Wait for confirmation and manage risk carefully.
◆━━━━━━━━━━━━━━━━━━━━
This is market analysis, not financial advice. Always do your own research.
#USMidtermElections #btc70k #bitcoin #BinanceRestores28FiatWithdrawals $BTC
MARKET OVERVIEW
Bitcoin is trading near $76,640 on the 4H chart, almost 10% below its late-October high above $84K. After a sharp rejection from the $81K zone, sellers have stayed in control. The bounce toward $79K faded quickly, a sign that buyers are cautious.
◆━━━━━━━━━━━━━━━━━━━━
TECHNICAL ANALYSIS
The $81,232 level was the middle of a multi-week range. Once BTC lost it, it flipped from support to resistance. The retest around Oct 30 failed with a strong rejection candle, a classic break-and-retest structure.
Since then, BTC has made lower highs and lower lows. The recent recovery to about $79K was weak and ended in a fresh drop. Price is now back near the $75.8K–$76K area, where the last swing low formed.
The trend is bearish short term. Until BTC reclaims the broken range, rallies look more like relief bounces than reversals.
◆━━━━━━━━━━━━━━━━━━━━
SCENARIO ANALYSIS
🟢 Bullish Case: A strong 4H close above $78,000, then a push back above $80,000, would show buyers regaining control. A reclaim of $81,232 would put the bearish structure in doubt.
🔴 Bearish Case: A clean 4H close below $75,770 could open the way to deeper lows, since there is little structure beneath this zone.
⚪ Neutral Case: BTC may chop between $75,800 and $78,000 while the market waits for a catalyst.
◆━━━━━━━━━━━━━━━━━━━━
KEY LEVELS
🔺 Resistance: R1 $78,000 | R2 $80,750 | R3 $81,232
🔻 Support: S1 $75,770 | S2 below this level, price discovery on the downside
◆━━━━━━━━━━━━━━━━━━━━
MARKET CONTEXT
Bitcoin leads the market. Weakness in BTC has pulled major altcoins lower, so its reaction at this support will likely set the tone for the rest of the market.
◆━━━━━━━━━━━━━━━━━━━━
OUTLOOK
Watch the $75.8K support closely. Reactions at $78K and $81K will show whether this is a pause or a continuation. Wait for confirmation and manage risk carefully.
◆━━━━━━━━━━━━━━━━━━━━
This is market analysis, not financial advice. Always do your own research.
#USMidtermElections #btc70k #bitcoin #BinanceRestores28FiatWithdrawals $BTC
1
77

ບົດຄວາມ
You Know More, But Why Are You Trading Worse?━━━━━━━━━━━━━━━━━━━━
Remember your first month in the markets?
You knew almost nothing. A green candle meant "buy," a red candle meant "sell," and you moved fast. Then you started learning. Support and resistance. RSI divergence. Funding rates. Order flow. On-chain data. Macro cycles.
And somewhere along the way, something strange happened.
**Trading got harder, not easier.**
Welcome to the Confidence Paradox. The more you know, the more reasons you find to doubt, delay, overthink, or overtrade. Knowledge is supposed to build confidence. In trading, it often builds hesitation instead.
Let's break down why this happens and what experienced traders do about it.
━━━━━━━━━━━━━━━━━━━━
◆ WHAT IS THE CONFIDENCE PARADOX?
The Confidence Paradox is the gap between how much you know and how clearly you can act on it.
Beginners have low knowledge but high certainty. Intermediate traders have high knowledge but shaky certainty. Experienced traders have high knowledge and calm, simple execution.
Most people get stuck in the middle stage. That is where learning turns into noise.
━━━━━━━━━━━━━━━━━━━━
◆ 5 WAYS KNOWLEDGE QUIETLY MAKES TRADING HARDER
① Analysis Paralysis
You check five timeframes, three indicators, and two news sources. Every one tells a slightly different story. Instead of clarity, you get a fog of conflicting signals, and the moment passes.
➤ **More inputs do not equal better decisions.**
② Seeing Every Risk (Even the Unlikely Ones)
The more you learn, the more ways you can imagine a setup failing. Liquidity traps, fakeouts, sudden news, whale moves. Awareness is useful, but without a framework it turns into fear.
➤ **A trader who can imagine every outcome often acts on none.**
③ The Confirmation Chase ✔︎
Instead of asking "Is my plan valid?" you start asking "Can I find one more reason?" You wait for a fourth confirmation, then a fifth, and the entry slips away. Then you feel regret, and regret leads to impulsive trades.
➤ **Confirmation can become procrastination in disguise.**
④ Overcomplicated Systems
Many traders keep adding tools to a strategy. Each addition feels smart on its own. Together they create a system so complex that nobody, including you, can follow it under pressure.
➤ **If you can't explain your setup in two sentences, it may be too heavy.**
⑤ Ego and the "I Should Know Better" Trap
Once you've studied a lot, a losing trade feels personal. You think, "I know this stuff. How did I get it wrong?" That feeling pushes people toward revenge trading, moving stops, or skipping their own rules.
➤ **Losses are part of the process, not proof you've failed.**
━━━━━━━━━━━━━━━━━━━━
◆ A SIMPLE FRAMEWORK TO BREAK THE PARADOX
Here's a practical way to turn knowledge into calm execution.
**➜ STEP 1: Define Your Edge in One Sentence**
Write down what you look for and why. If it takes a paragraph, simplify it.
**➜ STEP 2: Limit Your Toolkit**
Pick a small set of tools you understand deeply. Depth beats variety.
**➜ STEP 3: Set Your Rules Before the Trade**
Decide your entry conditions, risk per trade, and exit logic in advance. Decisions made in calm moments are almost always better than decisions made in the heat of one.
**➜ STEP 4: Accept Uncertainty**
No amount of knowledge removes it. Professionals don't eliminate uncertainty; they manage it through position sizing and discipline.
**➜ STEP 5: Review, Don't Ruminate 📓**
Keep a journal. Look at your process, not just your results. Ask: "Did I follow my plan?" That question matters more than "Did I win?"
━━━━━━━━━━━━━━━━━━━━
◆ QUICK CHECKLIST BEFORE ANY DECISION
✔︎ Is my plan written down?
✔︎ Do I know my maximum acceptable loss?
✔︎ Am I acting on my rules, or chasing one more signal?
✔︎ Am I calm, or reacting to emotion?
✔︎ Can I accept either outcome?
If any answer feels shaky, pause. A pause is a decision too.
━━━━━━━━━━━━━━━━━━━━
◆ THE MINDSET SHIFT THAT CHANGES EVERYTHING
The goal was never to know everything. The goal is to know enough, then act with discipline and manage risk when you're wrong.
Confidence in trading doesn't come from predicting the market. It comes from trusting your process, whatever the market does next.
**Simplicity isn't a step backward in your learning. It's often the result of it.**
━━━━━━━━━━━━━━━━━━━━
◆ CONCLUSION
Knowing more is never the problem. Letting information replace a clear process is.
Learn deeply, then simplify. Build rules, then follow them. Stay humble, stay consistent, and treat every trade as practice for the next one.
That is how the paradox fades: not by learning less, but by organizing what you know into something you can act on.
━━━━━━━━━━━━━━━━━━━━
◆ YOUR TURN
➤ Which one hit home for you: analysis paralysis, the confirmation chase, or overcomplicated systems? Drop it in the comments. I read them all.
➤ If this helped, give it a like and share it with a trader who's drowning in indicators.
➤ Follow for more trading psychology and mindset content.
━━━━━━━━━━━━━━━━━━━━
⚠️ **Risk Disclosure:** This article is for educational and informational purposes only and does not constitute financial or investment advice. Trading cryptocurrencies carries a high level of risk, including the potential loss of your entire capital. Market conditions can change quickly. Always do your own research and only trade with funds you can afford to lose.
#BinanceWithdrawalScamWarning #USMidtermElections #USOctoberNFP-AreRateCutsStillPossible #AppleEarningsAhead-CanStockHitNewHigh #Verify1to1BinanceReserves $BTC
{future}(BTCUSDT)
$ETH
{future}(ETHUSDT)
$XRP
{future}(XRPUSDT)
You Know More, But Why Are You Trading Worse?
━━━━━━━━━━━━━━━━━━━━
Remember your first month in the markets?
You knew almost nothing. A green candle meant "buy," a red candle meant "sell," and you moved fast. Then you started learning. Support and resistance. RSI divergence. Funding rates. Order flow. On-chain data. Macro cycles.
And somewhere along the way, something strange happened.
**Trading got harder, not easier.**
Welcome to the Confidence Paradox. The more you know, the more reasons you find to doubt, delay, overthink, or overtrade. Knowledge is supposed to build confidence. In trading, it often builds hesitation instead.
Let's break down why this happens and what experienced traders do about it.
━━━━━━━━━━━━━━━━━━━━
◆ WHAT IS THE CONFIDENCE PARADOX?
The Confidence Paradox is the gap between how much you know and how clearly you can act on it.
Beginners have low knowledge but high certainty. Intermediate traders have high knowledge but shaky certainty. Experienced traders have high knowledge and calm, simple execution.
Most people get stuck in the middle stage. That is where learning turns into noise.
━━━━━━━━━━━━━━━━━━━━
◆ 5 WAYS KNOWLEDGE QUIETLY MAKES TRADING HARDER
① Analysis Paralysis
You check five timeframes, three indicators, and two news sources. Every one tells a slightly different story. Instead of clarity, you get a fog of conflicting signals, and the moment passes.
➤ **More inputs do not equal better decisions.**
② Seeing Every Risk (Even the Unlikely Ones)
The more you learn, the more ways you can imagine a setup failing. Liquidity traps, fakeouts, sudden news, whale moves. Awareness is useful, but without a framework it turns into fear.
➤ **A trader who can imagine every outcome often acts on none.**
③ The Confirmation Chase ✔︎
Instead of asking "Is my plan valid?" you start asking "Can I find one more reason?" You wait for a fourth confirmation, then a fifth, and the entry slips away. Then you feel regret, and regret leads to impulsive trades.
➤ **Confirmation can become procrastination in disguise.**
④ Overcomplicated Systems
Many traders keep adding tools to a strategy. Each addition feels smart on its own. Together they create a system so complex that nobody, including you, can follow it under pressure.
➤ **If you can't explain your setup in two sentences, it may be too heavy.**
⑤ Ego and the "I Should Know Better" Trap
Once you've studied a lot, a losing trade feels personal. You think, "I know this stuff. How did I get it wrong?" That feeling pushes people toward revenge trading, moving stops, or skipping their own rules.
➤ **Losses are part of the process, not proof you've failed.**
━━━━━━━━━━━━━━━━━━━━
◆ A SIMPLE FRAMEWORK TO BREAK THE PARADOX
Here's a practical way to turn knowledge into calm execution.
**➜ STEP 1: Define Your Edge in One Sentence**
Write down what you look for and why. If it takes a paragraph, simplify it.
**➜ STEP 2: Limit Your Toolkit**
Pick a small set of tools you understand deeply. Depth beats variety.
**➜ STEP 3: Set Your Rules Before the Trade**
Decide your entry conditions, risk per trade, and exit logic in advance. Decisions made in calm moments are almost always better than decisions made in the heat of one.
**➜ STEP 4: Accept Uncertainty**
No amount of knowledge removes it. Professionals don't eliminate uncertainty; they manage it through position sizing and discipline.
**➜ STEP 5: Review, Don't Ruminate 📓**
Keep a journal. Look at your process, not just your results. Ask: "Did I follow my plan?" That question matters more than "Did I win?"
━━━━━━━━━━━━━━━━━━━━
◆ QUICK CHECKLIST BEFORE ANY DECISION
✔︎ Is my plan written down?
✔︎ Do I know my maximum acceptable loss?
✔︎ Am I acting on my rules, or chasing one more signal?
✔︎ Am I calm, or reacting to emotion?
✔︎ Can I accept either outcome?
If any answer feels shaky, pause. A pause is a decision too.
━━━━━━━━━━━━━━━━━━━━
◆ THE MINDSET SHIFT THAT CHANGES EVERYTHING
The goal was never to know everything. The goal is to know enough, then act with discipline and manage risk when you're wrong.
Confidence in trading doesn't come from predicting the market. It comes from trusting your process, whatever the market does next.
**Simplicity isn't a step backward in your learning. It's often the result of it.**
━━━━━━━━━━━━━━━━━━━━
◆ CONCLUSION
Knowing more is never the problem. Letting information replace a clear process is.
Learn deeply, then simplify. Build rules, then follow them. Stay humble, stay consistent, and treat every trade as practice for the next one.
That is how the paradox fades: not by learning less, but by organizing what you know into something you can act on.
━━━━━━━━━━━━━━━━━━━━
◆ YOUR TURN
➤ Which one hit home for you: analysis paralysis, the confirmation chase, or overcomplicated systems? Drop it in the comments. I read them all.
➤ If this helped, give it a like and share it with a trader who's drowning in indicators.
➤ Follow for more trading psychology and mindset content.
━━━━━━━━━━━━━━━━━━━━
⚠️ **Risk Disclosure:** This article is for educational and informational purposes only and does not constitute financial or investment advice. Trading cryptocurrencies carries a high level of risk, including the potential loss of your entire capital. Market conditions can change quickly. Always do your own research and only trade with funds you can afford to lose.
#BinanceWithdrawalScamWarning #USMidtermElections #USOctoberNFP-AreRateCutsStillPossible #AppleEarningsAhead-CanStockHitNewHigh #Verify1to1BinanceReserves $BTC
$ETH
$XRP
Remember your first month in the markets?
You knew almost nothing. A green candle meant "buy," a red candle meant "sell," and you moved fast. Then you started learning. Support and resistance. RSI divergence. Funding rates. Order flow. On-chain data. Macro cycles.
And somewhere along the way, something strange happened.
**Trading got harder, not easier.**
Welcome to the Confidence Paradox. The more you know, the more reasons you find to doubt, delay, overthink, or overtrade. Knowledge is supposed to build confidence. In trading, it often builds hesitation instead.
Let's break down why this happens and what experienced traders do about it.
━━━━━━━━━━━━━━━━━━━━
◆ WHAT IS THE CONFIDENCE PARADOX?
The Confidence Paradox is the gap between how much you know and how clearly you can act on it.
Beginners have low knowledge but high certainty. Intermediate traders have high knowledge but shaky certainty. Experienced traders have high knowledge and calm, simple execution.
Most people get stuck in the middle stage. That is where learning turns into noise.
━━━━━━━━━━━━━━━━━━━━
◆ 5 WAYS KNOWLEDGE QUIETLY MAKES TRADING HARDER
① Analysis Paralysis
You check five timeframes, three indicators, and two news sources. Every one tells a slightly different story. Instead of clarity, you get a fog of conflicting signals, and the moment passes.
➤ **More inputs do not equal better decisions.**
② Seeing Every Risk (Even the Unlikely Ones)
The more you learn, the more ways you can imagine a setup failing. Liquidity traps, fakeouts, sudden news, whale moves. Awareness is useful, but without a framework it turns into fear.
➤ **A trader who can imagine every outcome often acts on none.**
③ The Confirmation Chase ✔︎
Instead of asking "Is my plan valid?" you start asking "Can I find one more reason?" You wait for a fourth confirmation, then a fifth, and the entry slips away. Then you feel regret, and regret leads to impulsive trades.
➤ **Confirmation can become procrastination in disguise.**
④ Overcomplicated Systems
Many traders keep adding tools to a strategy. Each addition feels smart on its own. Together they create a system so complex that nobody, including you, can follow it under pressure.
➤ **If you can't explain your setup in two sentences, it may be too heavy.**
⑤ Ego and the "I Should Know Better" Trap
Once you've studied a lot, a losing trade feels personal. You think, "I know this stuff. How did I get it wrong?" That feeling pushes people toward revenge trading, moving stops, or skipping their own rules.
➤ **Losses are part of the process, not proof you've failed.**
━━━━━━━━━━━━━━━━━━━━
◆ A SIMPLE FRAMEWORK TO BREAK THE PARADOX
Here's a practical way to turn knowledge into calm execution.
**➜ STEP 1: Define Your Edge in One Sentence**
Write down what you look for and why. If it takes a paragraph, simplify it.
**➜ STEP 2: Limit Your Toolkit**
Pick a small set of tools you understand deeply. Depth beats variety.
**➜ STEP 3: Set Your Rules Before the Trade**
Decide your entry conditions, risk per trade, and exit logic in advance. Decisions made in calm moments are almost always better than decisions made in the heat of one.
**➜ STEP 4: Accept Uncertainty**
No amount of knowledge removes it. Professionals don't eliminate uncertainty; they manage it through position sizing and discipline.
**➜ STEP 5: Review, Don't Ruminate 📓**
Keep a journal. Look at your process, not just your results. Ask: "Did I follow my plan?" That question matters more than "Did I win?"
━━━━━━━━━━━━━━━━━━━━
◆ QUICK CHECKLIST BEFORE ANY DECISION
✔︎ Is my plan written down?
✔︎ Do I know my maximum acceptable loss?
✔︎ Am I acting on my rules, or chasing one more signal?
✔︎ Am I calm, or reacting to emotion?
✔︎ Can I accept either outcome?
If any answer feels shaky, pause. A pause is a decision too.
━━━━━━━━━━━━━━━━━━━━
◆ THE MINDSET SHIFT THAT CHANGES EVERYTHING
The goal was never to know everything. The goal is to know enough, then act with discipline and manage risk when you're wrong.
Confidence in trading doesn't come from predicting the market. It comes from trusting your process, whatever the market does next.
**Simplicity isn't a step backward in your learning. It's often the result of it.**
━━━━━━━━━━━━━━━━━━━━
◆ CONCLUSION
Knowing more is never the problem. Letting information replace a clear process is.
Learn deeply, then simplify. Build rules, then follow them. Stay humble, stay consistent, and treat every trade as practice for the next one.
That is how the paradox fades: not by learning less, but by organizing what you know into something you can act on.
━━━━━━━━━━━━━━━━━━━━
◆ YOUR TURN
➤ Which one hit home for you: analysis paralysis, the confirmation chase, or overcomplicated systems? Drop it in the comments. I read them all.
➤ If this helped, give it a like and share it with a trader who's drowning in indicators.
➤ Follow for more trading psychology and mindset content.
━━━━━━━━━━━━━━━━━━━━
⚠️ **Risk Disclosure:** This article is for educational and informational purposes only and does not constitute financial or investment advice. Trading cryptocurrencies carries a high level of risk, including the potential loss of your entire capital. Market conditions can change quickly. Always do your own research and only trade with funds you can afford to lose.
#BinanceWithdrawalScamWarning #USMidtermElections #USOctoberNFP-AreRateCutsStillPossible #AppleEarningsAhead-CanStockHitNewHigh #Verify1to1BinanceReserves $BTC
$ETH
$XRP
3
428
ບົດຄວາມ
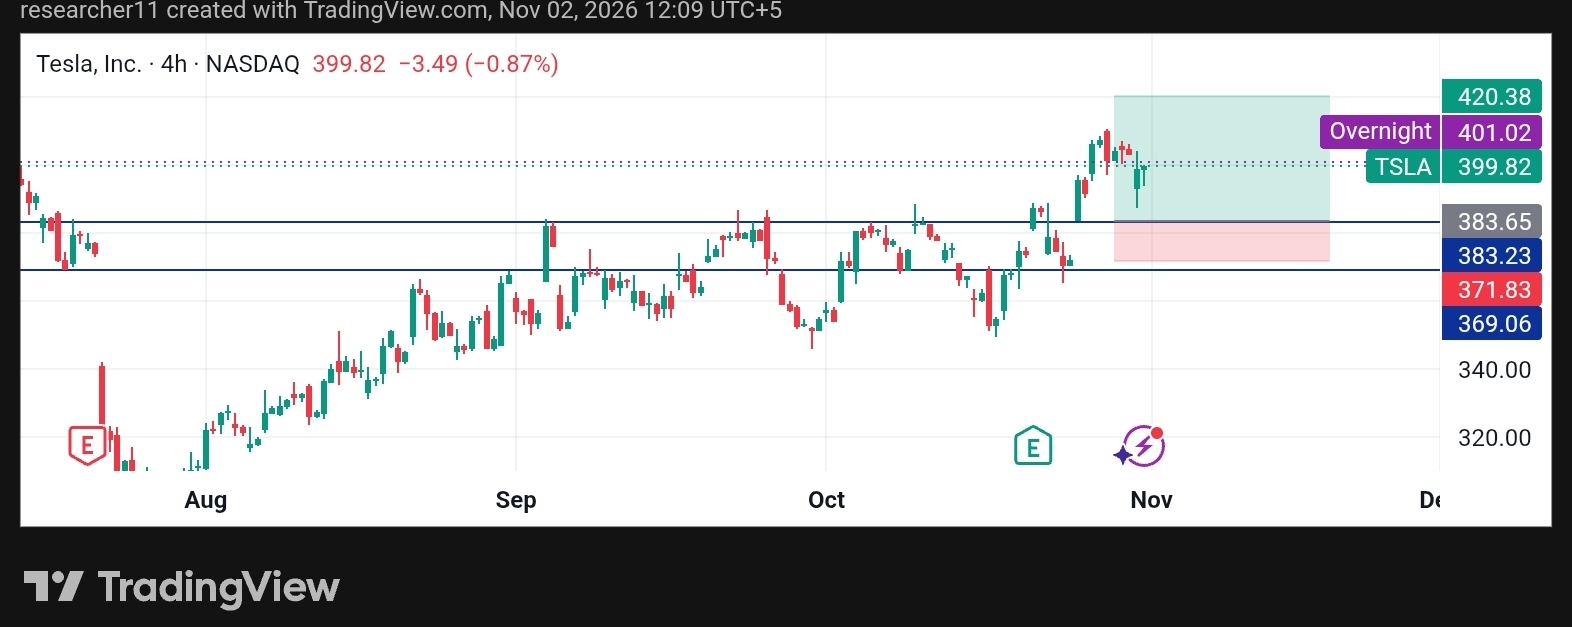
TSLA Holds Above Breakout: Momentum Still Alive?$TSLA
━━━━━━━━━━━━━━━━━━━━
MARKET OVERVIEW
Tesla (TSLA) is trading around $399.82 on the 4H chart, down about 0.9% on the day. After a strong multi-week climb, price broke above the $383 resistance zone and pushed to the $400+ area. The latest candles show a small pullback with a long lower wick, hinting at dip-buying interest.
◆━━━━━━━━━━━━━━━━━━━━
TECHNICAL ANALYSIS
➤ Trend: Bullish, with higher highs and higher lows since August.
➤ Structure: The $383.23–$383.65 zone was a major ceiling for weeks. Price has broken above it, so it may now act as support if retested.
➤ Behavior: The breakout candles were strong and large-bodied, which shows real momentum. The current pullback is shallow, which is healthy after a fast move.
➤ Overnight price near $401.02 sits just above the current price, keeping the $400 psychological level in play.
◆━━━━━━━━━━━━━━━━━━━━
SCENARIO ANALYSIS
🟢 Bullish Case: Holding above $400 or retesting $383 and bouncing would keep the breakout valid. A move higher could target $420.38.
🔴 Bearish Case: A 4H close back below $383 would signal a failed breakout. Deeper support sits near $369–$372.
⚪ Neutral Case: Consolidation between $383 and $401 would suggest the market is cooling before the next leg.
◆━━━━━━━━━━━━━━━━━━━━
KEY LEVELS
🔺 Resistance:
- R1: $401–$405
- R2: $420.38
🔻 Support:
- S1: $383.23–$383.65
- S2: $369.06–$371.83
◆━━━━━━━━━━━━━━━━━━━━
MARKET CONTEXT
TSLA is known for sharp moves driven by sentiment and headlines. Fast rallies can reverse quickly, so confirmation matters.
◆━━━━━━━━━━━━━━━━━━━━
FINAL OUTLOOK
TSLA remains structurally bullish while above $383. Watch whether buyers defend that zone on any pullback and whether price can clear $400 with volume. Stay flexible and manage risk carefully.
This content is for informational purposes only and is not financial advice.
━━━━━━━━━━━━━━━━━━━━
#TSLA #BrazilVirtualAssetLicenseDeadlineDrawsAbout40Firms #BitcoinSpotETFsPost$203MWeeklyOutflow #EthereumSurpasses$2300 #WithdrawalsBack: 15 networks live
{future}(TSLAUSDT)
TSLA Holds Above Breakout: Momentum Still Alive?
$TSLA
━━━━━━━━━━━━━━━━━━━━
MARKET OVERVIEW
Tesla (TSLA) is trading around $399.82 on the 4H chart, down about 0.9% on the day. After a strong multi-week climb, price broke above the $383 resistance zone and pushed to the $400+ area. The latest candles show a small pullback with a long lower wick, hinting at dip-buying interest.
◆━━━━━━━━━━━━━━━━━━━━
TECHNICAL ANALYSIS
➤ Trend: Bullish, with higher highs and higher lows since August.
➤ Structure: The $383.23–$383.65 zone was a major ceiling for weeks. Price has broken above it, so it may now act as support if retested.
➤ Behavior: The breakout candles were strong and large-bodied, which shows real momentum. The current pullback is shallow, which is healthy after a fast move.
➤ Overnight price near $401.02 sits just above the current price, keeping the $400 psychological level in play.
◆━━━━━━━━━━━━━━━━━━━━
SCENARIO ANALYSIS
🟢 Bullish Case: Holding above $400 or retesting $383 and bouncing would keep the breakout valid. A move higher could target $420.38.
🔴 Bearish Case: A 4H close back below $383 would signal a failed breakout. Deeper support sits near $369–$372.
⚪ Neutral Case: Consolidation between $383 and $401 would suggest the market is cooling before the next leg.
◆━━━━━━━━━━━━━━━━━━━━
KEY LEVELS
🔺 Resistance:
- R1: $401–$405
- R2: $420.38
🔻 Support:
- S1: $383.23–$383.65
- S2: $369.06–$371.83
◆━━━━━━━━━━━━━━━━━━━━
MARKET CONTEXT
TSLA is known for sharp moves driven by sentiment and headlines. Fast rallies can reverse quickly, so confirmation matters.
◆━━━━━━━━━━━━━━━━━━━━
FINAL OUTLOOK
TSLA remains structurally bullish while above $383. Watch whether buyers defend that zone on any pullback and whether price can clear $400 with volume. Stay flexible and manage risk carefully.
This content is for informational purposes only and is not financial advice.
━━━━━━━━━━━━━━━━━━━━
#TSLA #BrazilVirtualAssetLicenseDeadlineDrawsAbout40Firms #BitcoinSpotETFsPost$203MWeeklyOutflow #EthereumSurpasses$2300 #WithdrawalsBack: 15 networks live
━━━━━━━━━━━━━━━━━━━━
MARKET OVERVIEW
Tesla (TSLA) is trading around $399.82 on the 4H chart, down about 0.9% on the day. After a strong multi-week climb, price broke above the $383 resistance zone and pushed to the $400+ area. The latest candles show a small pullback with a long lower wick, hinting at dip-buying interest.
◆━━━━━━━━━━━━━━━━━━━━
TECHNICAL ANALYSIS
➤ Trend: Bullish, with higher highs and higher lows since August.
➤ Structure: The $383.23–$383.65 zone was a major ceiling for weeks. Price has broken above it, so it may now act as support if retested.
➤ Behavior: The breakout candles were strong and large-bodied, which shows real momentum. The current pullback is shallow, which is healthy after a fast move.
➤ Overnight price near $401.02 sits just above the current price, keeping the $400 psychological level in play.
◆━━━━━━━━━━━━━━━━━━━━
SCENARIO ANALYSIS
🟢 Bullish Case: Holding above $400 or retesting $383 and bouncing would keep the breakout valid. A move higher could target $420.38.
🔴 Bearish Case: A 4H close back below $383 would signal a failed breakout. Deeper support sits near $369–$372.
⚪ Neutral Case: Consolidation between $383 and $401 would suggest the market is cooling before the next leg.
◆━━━━━━━━━━━━━━━━━━━━
KEY LEVELS
🔺 Resistance:
- R1: $401–$405
- R2: $420.38
🔻 Support:
- S1: $383.23–$383.65
- S2: $369.06–$371.83
◆━━━━━━━━━━━━━━━━━━━━
MARKET CONTEXT
TSLA is known for sharp moves driven by sentiment and headlines. Fast rallies can reverse quickly, so confirmation matters.
◆━━━━━━━━━━━━━━━━━━━━
FINAL OUTLOOK
TSLA remains structurally bullish while above $383. Watch whether buyers defend that zone on any pullback and whether price can clear $400 with volume. Stay flexible and manage risk carefully.
This content is for informational purposes only and is not financial advice.
━━━━━━━━━━━━━━━━━━━━
#TSLA #BrazilVirtualAssetLicenseDeadlineDrawsAbout40Firms #BitcoinSpotETFsPost$203MWeeklyOutflow #EthereumSurpasses$2300 #WithdrawalsBack: 15 networks live
269
ບົດຄວາມ
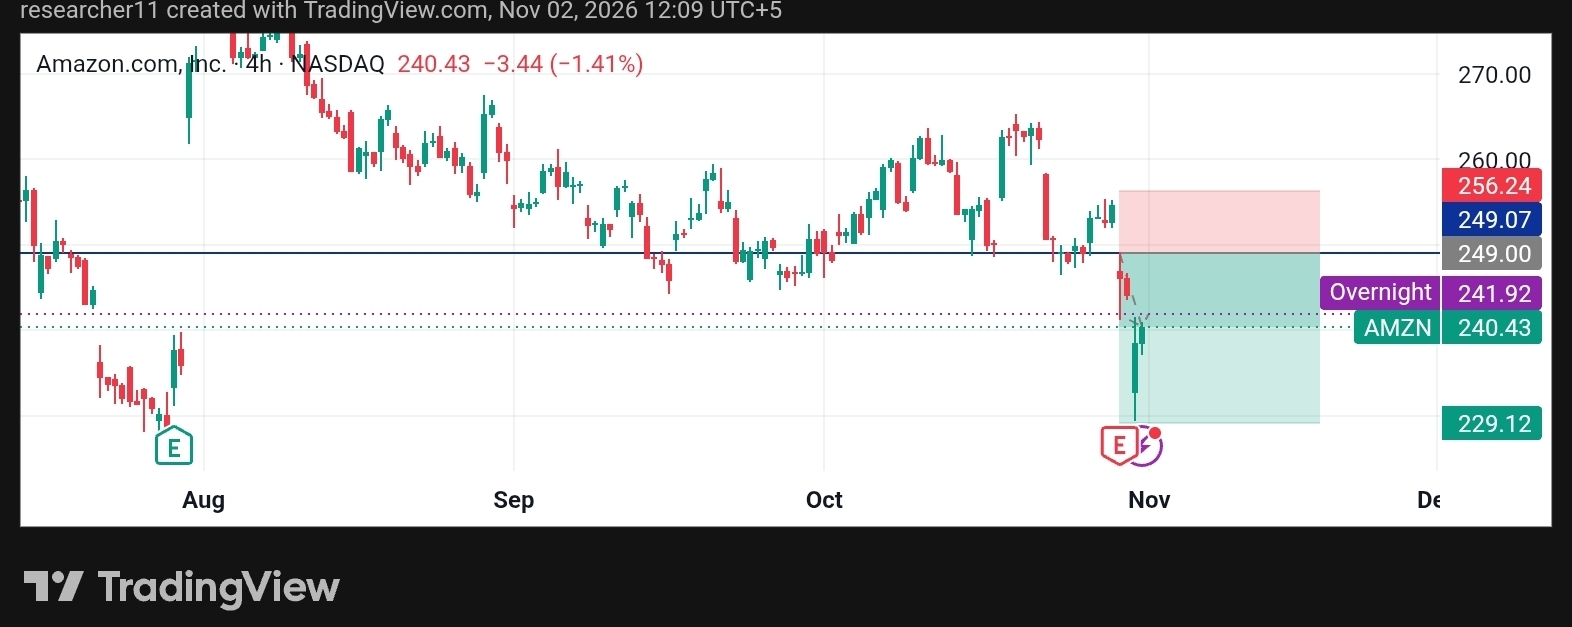
AMZN Rebounds After Sharp Flush: Is $249 the Wall?$AMZN
━━━━━━━━━━━━━━━━━━━━
MARKET OVERVIEW
Amazon (AMZN) is trading near $240.43 on the 4H chart, down about 1.4% on the day. Price gapped sharply lower, wicked down to the $229 area, then bounced quickly. The long lower wick shows buyers defending the lows, but the recovery is still unfinished.
◆━━━━━━━━━━━━━━━━━━━━
TECHNICAL ANALYSIS
➤ Trend: Mixed. The October rally faded, and price is now below a major horizontal level.
➤ Structure: The $249 zone supported price multiple times from September to October. After the gap down, it has flipped into resistance, a common pattern after a breakdown.
➤ Behavior: The sharp wick near $229.12 signals strong demand at the lows. However, the bounce is stalling below resistance, so bulls still need to prove strength.
➤ Overnight price near $241.92 is slightly above the current price, showing a cautious tone.
◆━━━━━━━━━━━━━━━━━━━━
SCENARIO ANALYSIS
🟢 Bullish Case: A 4H close above $249 with strong volume would reclaim the lost level. That would open the door toward $256.24.
🔴 Bearish Case: A rejection at $249 followed by a break below $240 could send price back to retest $229.12. A close under that low would extend the downtrend.
⚪ Neutral Case: Price may range between $230 and $249 as buyers and sellers balance out.
◆━━━━━━━━━━━━━━━━━━━━
KEY LEVELS
🔺 Resistance:
- R1: $249.00
- R2: $256.24
🔻 Support:
- S1: $240
- S2: $229.12
◆━━━━━━━━━━━━━━━━━━━━
MARKET CONTEXT
Earnings-driven gaps often leave volatile aftermath. Expect wider swings while the market digests recent news.
◆━━━━━━━━━━━━━━━━━━━━
FINAL OUTLOOK
AMZN is caught between a strong demand wick and a heavy resistance level. The $249 reaction will likely define the next move, so watch for confirmation before drawing conclusions.
This content is for informational purposes only and is not financial advice.
━━━━━━━━━━━━━━━━━━━━
#AMZNB #EthereumSurpasses$2300 #BitcoinSpotETFsPost$203MWeeklyOutflow #BrazilVirtualAssetLicenseDeadlineDrawsAbout40Firms #StudyFindsCircleAIAgentWalletLimitsCanBeBypassed
{future}(AMZNUSDT)
AMZN Rebounds After Sharp Flush: Is $249 the Wall?
$AMZN
━━━━━━━━━━━━━━━━━━━━
MARKET OVERVIEW
Amazon (AMZN) is trading near $240.43 on the 4H chart, down about 1.4% on the day. Price gapped sharply lower, wicked down to the $229 area, then bounced quickly. The long lower wick shows buyers defending the lows, but the recovery is still unfinished.
◆━━━━━━━━━━━━━━━━━━━━
TECHNICAL ANALYSIS
➤ Trend: Mixed. The October rally faded, and price is now below a major horizontal level.
➤ Structure: The $249 zone supported price multiple times from September to October. After the gap down, it has flipped into resistance, a common pattern after a breakdown.
➤ Behavior: The sharp wick near $229.12 signals strong demand at the lows. However, the bounce is stalling below resistance, so bulls still need to prove strength.
➤ Overnight price near $241.92 is slightly above the current price, showing a cautious tone.
◆━━━━━━━━━━━━━━━━━━━━
SCENARIO ANALYSIS
🟢 Bullish Case: A 4H close above $249 with strong volume would reclaim the lost level. That would open the door toward $256.24.
🔴 Bearish Case: A rejection at $249 followed by a break below $240 could send price back to retest $229.12. A close under that low would extend the downtrend.
⚪ Neutral Case: Price may range between $230 and $249 as buyers and sellers balance out.
◆━━━━━━━━━━━━━━━━━━━━
KEY LEVELS
🔺 Resistance:
- R1: $249.00
- R2: $256.24
🔻 Support:
- S1: $240
- S2: $229.12
◆━━━━━━━━━━━━━━━━━━━━
MARKET CONTEXT
Earnings-driven gaps often leave volatile aftermath. Expect wider swings while the market digests recent news.
◆━━━━━━━━━━━━━━━━━━━━
FINAL OUTLOOK
AMZN is caught between a strong demand wick and a heavy resistance level. The $249 reaction will likely define the next move, so watch for confirmation before drawing conclusions.
This content is for informational purposes only and is not financial advice.
━━━━━━━━━━━━━━━━━━━━
#AMZNB #EthereumSurpasses$2300 #BitcoinSpotETFsPost$203MWeeklyOutflow #BrazilVirtualAssetLicenseDeadlineDrawsAbout40Firms #StudyFindsCircleAIAgentWalletLimitsCanBeBypassed
━━━━━━━━━━━━━━━━━━━━
MARKET OVERVIEW
Amazon (AMZN) is trading near $240.43 on the 4H chart, down about 1.4% on the day. Price gapped sharply lower, wicked down to the $229 area, then bounced quickly. The long lower wick shows buyers defending the lows, but the recovery is still unfinished.
◆━━━━━━━━━━━━━━━━━━━━
TECHNICAL ANALYSIS
➤ Trend: Mixed. The October rally faded, and price is now below a major horizontal level.
➤ Structure: The $249 zone supported price multiple times from September to October. After the gap down, it has flipped into resistance, a common pattern after a breakdown.
➤ Behavior: The sharp wick near $229.12 signals strong demand at the lows. However, the bounce is stalling below resistance, so bulls still need to prove strength.
➤ Overnight price near $241.92 is slightly above the current price, showing a cautious tone.
◆━━━━━━━━━━━━━━━━━━━━
SCENARIO ANALYSIS
🟢 Bullish Case: A 4H close above $249 with strong volume would reclaim the lost level. That would open the door toward $256.24.
🔴 Bearish Case: A rejection at $249 followed by a break below $240 could send price back to retest $229.12. A close under that low would extend the downtrend.
⚪ Neutral Case: Price may range between $230 and $249 as buyers and sellers balance out.
◆━━━━━━━━━━━━━━━━━━━━
KEY LEVELS
🔺 Resistance:
- R1: $249.00
- R2: $256.24
🔻 Support:
- S1: $240
- S2: $229.12
◆━━━━━━━━━━━━━━━━━━━━
MARKET CONTEXT
Earnings-driven gaps often leave volatile aftermath. Expect wider swings while the market digests recent news.
◆━━━━━━━━━━━━━━━━━━━━
FINAL OUTLOOK
AMZN is caught between a strong demand wick and a heavy resistance level. The $249 reaction will likely define the next move, so watch for confirmation before drawing conclusions.
This content is for informational purposes only and is not financial advice.
━━━━━━━━━━━━━━━━━━━━
#AMZNB #EthereumSurpasses$2300 #BitcoinSpotETFsPost$203MWeeklyOutflow #BrazilVirtualAssetLicenseDeadlineDrawsAbout40Firms #StudyFindsCircleAIAgentWalletLimitsCanBeBypassed
2
ບົດຄວາມ
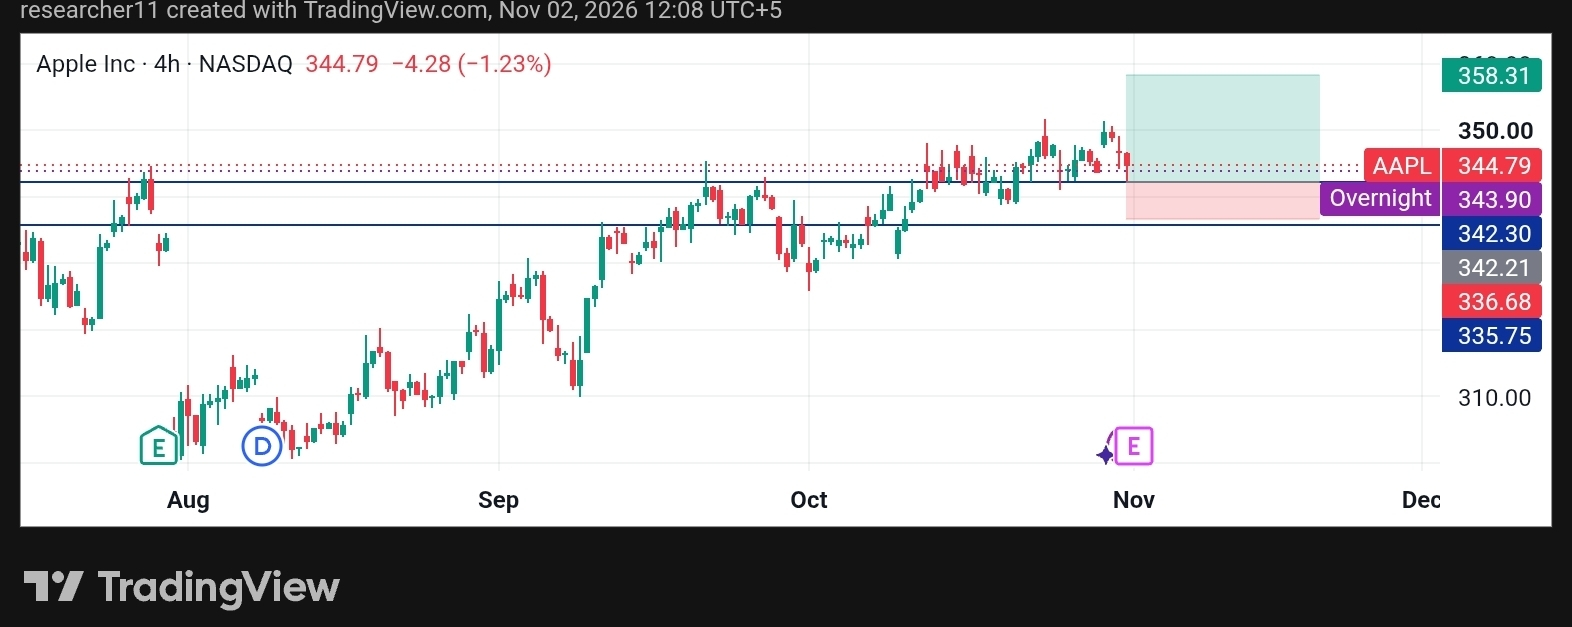
AAPL Testing Support: Will the Uptrend Hold?$AAPL
━━━━━━━━━━━━━━━━━━━━
MARKET OVERVIEW
Apple (AAPL) is trading around $344.79 on the 4H chart, down roughly 1.2% on the day. The broader structure since August has been a steady climb, with higher highs and higher lows. The recent pullback from the $350+ area is mild and looks like a cooldown within a larger uptrend.
◆━━━━━━━━━━━━━━━━━━━━
TECHNICAL ANALYSIS
➤ Trend: Bullish on the higher timeframe, with a short-term pullback underway.
➤ Structure: Price has dipped back toward the $342.21–$343.90 zone, which acted as a pivot earlier in the move. This is a classic retest area where buyers often step in.
➤ Behavior: Selling candles are small and controlled, with no panic-style breakdown. That suggests profit-taking, not aggressive distribution.
➤ Below, the $335.75–$336.68 zone is the deeper support to watch if the pullback extends.
◆━━━━━━━━━━━━━━━━━━━━
SCENARIO ANALYSIS
🟢 Bullish Case: Price holds above $342 and forms higher-low candles. A push back through $350 would put $358.31 in focus.
🔴 Bearish Case: A clean 4H close below $342.21 weakens the structure. A drop under $335.75 would break the trend of higher lows.
⚪ Neutral Case: Sideways movement between $342 and $350 would signal consolidation before the next directional move.
◆━━━━━━━━━━━━━━━━━━━━
KEY LEVELS
🔺 Resistance:
- R1: $350
- R2: $358.31
🔻 Support:
- S1: $342.21–$342.30
- S2: $335.75–$336.68
◆━━━━━━━━━━━━━━━━━━━━
MARKET CONTEXT
Mega-cap stocks often follow overall Nasdaq momentum. Strength or weakness in the broader index can influence how this level holds.
◆━━━━━━━━━━━━━━━━━━━━
FINAL OUTLOOK
AAPL is pulling back into a key support zone inside an uptrend. The reaction at $342 is the main signal to watch. Strong buying interest would support continuation, while a loss of this level shifts focus to $336.
This content is for informational purposes only and is not financial advice.
━━━━━━━━━━━━━━━━━━━━
#AAPL #BinanceProcesses$4.65BWithdrawals #EthereumSurpasses$2300 #BitcoinSpotETFsPost$203MWeeklyOutflow #SouthKoreanLawmakerProposesReviewOfAllListedDigitalAssets
{future}(AAPLUSDT)
AAPL Testing Support: Will the Uptrend Hold?
$AAPL
━━━━━━━━━━━━━━━━━━━━
MARKET OVERVIEW
Apple (AAPL) is trading around $344.79 on the 4H chart, down roughly 1.2% on the day. The broader structure since August has been a steady climb, with higher highs and higher lows. The recent pullback from the $350+ area is mild and looks like a cooldown within a larger uptrend.
◆━━━━━━━━━━━━━━━━━━━━
TECHNICAL ANALYSIS
➤ Trend: Bullish on the higher timeframe, with a short-term pullback underway.
➤ Structure: Price has dipped back toward the $342.21–$343.90 zone, which acted as a pivot earlier in the move. This is a classic retest area where buyers often step in.
➤ Behavior: Selling candles are small and controlled, with no panic-style breakdown. That suggests profit-taking, not aggressive distribution.
➤ Below, the $335.75–$336.68 zone is the deeper support to watch if the pullback extends.
◆━━━━━━━━━━━━━━━━━━━━
SCENARIO ANALYSIS
🟢 Bullish Case: Price holds above $342 and forms higher-low candles. A push back through $350 would put $358.31 in focus.
🔴 Bearish Case: A clean 4H close below $342.21 weakens the structure. A drop under $335.75 would break the trend of higher lows.
⚪ Neutral Case: Sideways movement between $342 and $350 would signal consolidation before the next directional move.
◆━━━━━━━━━━━━━━━━━━━━
KEY LEVELS
🔺 Resistance:
- R1: $350
- R2: $358.31
🔻 Support:
- S1: $342.21–$342.30
- S2: $335.75–$336.68
◆━━━━━━━━━━━━━━━━━━━━
MARKET CONTEXT
Mega-cap stocks often follow overall Nasdaq momentum. Strength or weakness in the broader index can influence how this level holds.
◆━━━━━━━━━━━━━━━━━━━━
FINAL OUTLOOK
AAPL is pulling back into a key support zone inside an uptrend. The reaction at $342 is the main signal to watch. Strong buying interest would support continuation, while a loss of this level shifts focus to $336.
This content is for informational purposes only and is not financial advice.
━━━━━━━━━━━━━━━━━━━━
#AAPL #BinanceProcesses$4.65BWithdrawals #EthereumSurpasses$2300 #BitcoinSpotETFsPost$203MWeeklyOutflow #SouthKoreanLawmakerProposesReviewOfAllListedDigitalAssets
━━━━━━━━━━━━━━━━━━━━
MARKET OVERVIEW
Apple (AAPL) is trading around $344.79 on the 4H chart, down roughly 1.2% on the day. The broader structure since August has been a steady climb, with higher highs and higher lows. The recent pullback from the $350+ area is mild and looks like a cooldown within a larger uptrend.
◆━━━━━━━━━━━━━━━━━━━━
TECHNICAL ANALYSIS
➤ Trend: Bullish on the higher timeframe, with a short-term pullback underway.
➤ Structure: Price has dipped back toward the $342.21–$343.90 zone, which acted as a pivot earlier in the move. This is a classic retest area where buyers often step in.
➤ Behavior: Selling candles are small and controlled, with no panic-style breakdown. That suggests profit-taking, not aggressive distribution.
➤ Below, the $335.75–$336.68 zone is the deeper support to watch if the pullback extends.
◆━━━━━━━━━━━━━━━━━━━━
SCENARIO ANALYSIS
🟢 Bullish Case: Price holds above $342 and forms higher-low candles. A push back through $350 would put $358.31 in focus.
🔴 Bearish Case: A clean 4H close below $342.21 weakens the structure. A drop under $335.75 would break the trend of higher lows.
⚪ Neutral Case: Sideways movement between $342 and $350 would signal consolidation before the next directional move.
◆━━━━━━━━━━━━━━━━━━━━
KEY LEVELS
🔺 Resistance:
- R1: $350
- R2: $358.31
🔻 Support:
- S1: $342.21–$342.30
- S2: $335.75–$336.68
◆━━━━━━━━━━━━━━━━━━━━
MARKET CONTEXT
Mega-cap stocks often follow overall Nasdaq momentum. Strength or weakness in the broader index can influence how this level holds.
◆━━━━━━━━━━━━━━━━━━━━
FINAL OUTLOOK
AAPL is pulling back into a key support zone inside an uptrend. The reaction at $342 is the main signal to watch. Strong buying interest would support continuation, while a loss of this level shifts focus to $336.
This content is for informational purposes only and is not financial advice.
━━━━━━━━━━━━━━━━━━━━
#AAPL #BinanceProcesses$4.65BWithdrawals #EthereumSurpasses$2300 #BitcoinSpotETFsPost$203MWeeklyOutflow #SouthKoreanLawmakerProposesReviewOfAllListedDigitalAssets
193
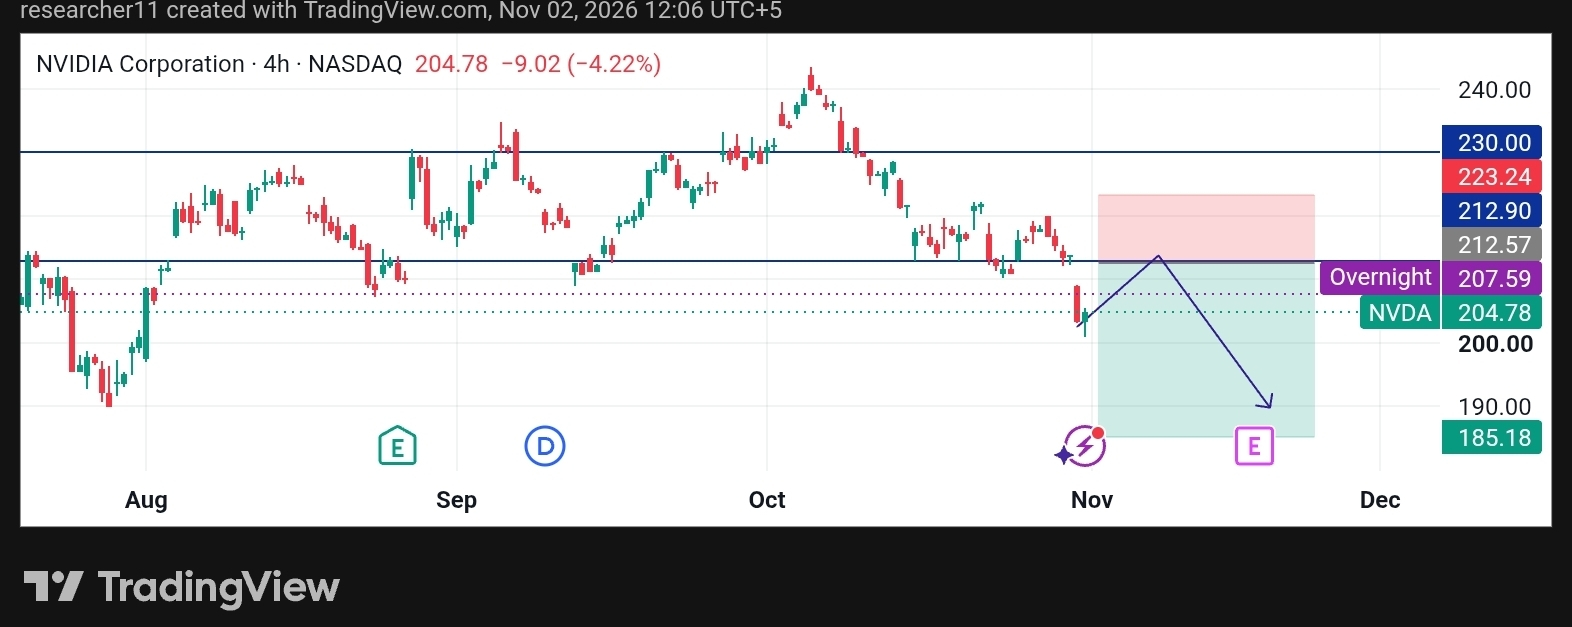
ບົດຄວາມ
NVDA Under Pressure: Can Bulls Reclaim $212?$NVDAB
━━━━━━━━━━━━━━━━━━━━
MARKET OVERVIEW
NVIDIA (NVDA) is trading near $204.78 on the 4H chart, down about 4.2% on the day. After peaking in the $240s in October, price has printed lower highs and just broke a key support zone with a sharp gap-down candle. Volatility is rising and short-term momentum has turned bearish.
◆━━━━━━━━━━━━━━━━━━━━
TECHNICAL ANALYSIS
➤ Trend: Short-term bearish, with lower highs since the October top.
➤ Structure: The $212.57–$212.90 zone held for weeks and has now been lost. It is the first area to watch as resistance.
➤ Behavior: The drop came as a large red candle, followed by a small bounce. That bounce looks like a retest attempt, not a confirmed reversal.
➤ Overnight price near $207.59 shows sellers were still active after hours.
◆━━━━━━━━━━━━━━━━━━━━
SCENARIO ANALYSIS
🟢 Bullish Case: A 4H close back above $212.90 with strong volume would suggest the breakdown was a false move. That could open the path toward $223.24 and $230.
🔴 Bearish Case: A rejection at $212.57–$212.90 followed by a break below $200 would confirm continuation. Next downside areas are $190 and $185.18.
⚪ Neutral Case: Between $200 and $212, price may chop sideways while the market digests the drop.
◆━━━━━━━━━━━━━━━━━━━━
KEY LEVELS
🔺 Resistance:
- R1: $212.57–$212.90
- R2: $223.24
- Extended: $230
🔻 Support:
- S1: $200
- S2: $190
- Extended: $185.18
◆━━━━━━━━━━━━━━━━━━━━
MARKET CONTEXT
Large-cap tech is sensitive to Nasdaq sentiment and earnings headlines, so broader market tone matters here.
◆━━━━━━━━━━━━━━━━━━━━
FINAL OUTLOOK
NVDA is at a decision point. Watch how price reacts around $212. Acceptance above it favors recovery, while rejection keeps sellers in control. Patience and risk management matter more than prediction.
This content is for informational purposes only and is not financial advice.
━━━━━━━━━━━━━━━━━━━━
$NVDA
{future}(NVDAUSDT)
$NVDAB
{spot}(NVDABUSDT)
#nvda #BinanceProcesses$4.65BWithdrawals #WithdrawalsBack: 15 networks live #EthereumSurpasses$2300 #BitcoinSpotETFsPost$203MWeeklyOutflow
NVDA Under Pressure: Can Bulls Reclaim $212?
$NVDAB
━━━━━━━━━━━━━━━━━━━━
MARKET OVERVIEW
NVIDIA (NVDA) is trading near $204.78 on the 4H chart, down about 4.2% on the day. After peaking in the $240s in October, price has printed lower highs and just broke a key support zone with a sharp gap-down candle. Volatility is rising and short-term momentum has turned bearish.
◆━━━━━━━━━━━━━━━━━━━━
TECHNICAL ANALYSIS
➤ Trend: Short-term bearish, with lower highs since the October top.
➤ Structure: The $212.57–$212.90 zone held for weeks and has now been lost. It is the first area to watch as resistance.
➤ Behavior: The drop came as a large red candle, followed by a small bounce. That bounce looks like a retest attempt, not a confirmed reversal.
➤ Overnight price near $207.59 shows sellers were still active after hours.
◆━━━━━━━━━━━━━━━━━━━━
SCENARIO ANALYSIS
🟢 Bullish Case: A 4H close back above $212.90 with strong volume would suggest the breakdown was a false move. That could open the path toward $223.24 and $230.
🔴 Bearish Case: A rejection at $212.57–$212.90 followed by a break below $200 would confirm continuation. Next downside areas are $190 and $185.18.
⚪ Neutral Case: Between $200 and $212, price may chop sideways while the market digests the drop.
◆━━━━━━━━━━━━━━━━━━━━
KEY LEVELS
🔺 Resistance:
- R1: $212.57–$212.90
- R2: $223.24
- Extended: $230
🔻 Support:
- S1: $200
- S2: $190
- Extended: $185.18
◆━━━━━━━━━━━━━━━━━━━━
MARKET CONTEXT
Large-cap tech is sensitive to Nasdaq sentiment and earnings headlines, so broader market tone matters here.
◆━━━━━━━━━━━━━━━━━━━━
FINAL OUTLOOK
NVDA is at a decision point. Watch how price reacts around $212. Acceptance above it favors recovery, while rejection keeps sellers in control. Patience and risk management matter more than prediction.
This content is for informational purposes only and is not financial advice.
━━━━━━━━━━━━━━━━━━━━
$NVDA
$NVDAB
#nvda #BinanceProcesses$4.65BWithdrawals #WithdrawalsBack: 15 networks live #EthereumSurpasses$2300 #BitcoinSpotETFsPost$203MWeeklyOutflow
━━━━━━━━━━━━━━━━━━━━
MARKET OVERVIEW
NVIDIA (NVDA) is trading near $204.78 on the 4H chart, down about 4.2% on the day. After peaking in the $240s in October, price has printed lower highs and just broke a key support zone with a sharp gap-down candle. Volatility is rising and short-term momentum has turned bearish.
◆━━━━━━━━━━━━━━━━━━━━
TECHNICAL ANALYSIS
➤ Trend: Short-term bearish, with lower highs since the October top.
➤ Structure: The $212.57–$212.90 zone held for weeks and has now been lost. It is the first area to watch as resistance.
➤ Behavior: The drop came as a large red candle, followed by a small bounce. That bounce looks like a retest attempt, not a confirmed reversal.
➤ Overnight price near $207.59 shows sellers were still active after hours.
◆━━━━━━━━━━━━━━━━━━━━
SCENARIO ANALYSIS
🟢 Bullish Case: A 4H close back above $212.90 with strong volume would suggest the breakdown was a false move. That could open the path toward $223.24 and $230.
🔴 Bearish Case: A rejection at $212.57–$212.90 followed by a break below $200 would confirm continuation. Next downside areas are $190 and $185.18.
⚪ Neutral Case: Between $200 and $212, price may chop sideways while the market digests the drop.
◆━━━━━━━━━━━━━━━━━━━━
KEY LEVELS
🔺 Resistance:
- R1: $212.57–$212.90
- R2: $223.24
- Extended: $230
🔻 Support:
- S1: $200
- S2: $190
- Extended: $185.18
◆━━━━━━━━━━━━━━━━━━━━
MARKET CONTEXT
Large-cap tech is sensitive to Nasdaq sentiment and earnings headlines, so broader market tone matters here.
◆━━━━━━━━━━━━━━━━━━━━
FINAL OUTLOOK
NVDA is at a decision point. Watch how price reacts around $212. Acceptance above it favors recovery, while rejection keeps sellers in control. Patience and risk management matter more than prediction.
This content is for informational purposes only and is not financial advice.
━━━━━━━━━━━━━━━━━━━━
$NVDA
$NVDAB
#nvda #BinanceProcesses$4.65BWithdrawals #WithdrawalsBack: 15 networks live #EthereumSurpasses$2300 #BitcoinSpotETFsPost$203MWeeklyOutflow
175

ບົດຄວາມ
Big Tech Free Cash Flow Under Pressure — AI Trade Retreats Together━━━━━━━━━━━━━━━━━━━━
The numbers just dropped, and the market didn’t like what it saw.
Amazon, Alphabet (Google), Meta and Microsoft just reported a combined quarterly free cash flow swing from a healthy +$61.7 billion a year ago to roughly –$26.4 billion.
Amazon, Google and Meta all flipped negative. Only Microsoft stayed in the black.
CapEx exploded. AI data-center and chip spending surged so hard that even these cash-printing machines are temporarily burning cash.
The reaction was immediate: Big Tech shed nearly $900 billion in market value in days, and the broader AI trade sold off hard.
➤ Here’s the clear picture right now.
━━━━━━━━━━━━━━━━━━━━
① The Cash Flow Reality Check
- Amazon: Posted the biggest burn — trailing 12-month free cash flow deep in negative territory while guiding for even higher 2026–2027 spend.
- Alphabet: Its free cash flow swung negative for the second straight quarter as CapEx more than doubled.
- Meta: Joined the negative club.
- Microsoft: Remains the only one still generating solid free cash flow, though even its number cooled.
These companies are still growing revenue, and cloud AI demand is real.
But the market is now asking a simple question:
How long can they keep spending like this before the returns show up?
━━━━━━━━━━━━━━━━━━━━
② Why the AI Trade Is Retreating Together
When the hyperscalers blink on cash flow, everything connected to the AI narrative feels it:
➤ NVIDIA and the semiconductor complex get hit.
➤ AI software and infrastructure names get hit.
➤ Risk appetite across growth assets drops.
Crypto is not immune.
AI-related tokens (NEAR, TAO, RENDER, VIRTUAL, FET and the broader AI agent / DePIN basket) have been moving more tightly with Big Tech risk sentiment.
When the Mag 7 / hyperscaler trade wobbles, AI coins often follow.
Total AI crypto market cap is currently in the low-to-mid teens of billions — still a small slice of the overall crypto market, but highly sensitive to the same “will the spending pay off?” narrative.
━━━━━━━━━━━━━━━━━━━━
③ Two Ways to Read This
✔︎ Defense view:
Cash-flow pressure + higher rates for longer + elevated CapEx guidance = higher risk of further multiple compression.
Traders who want to stay defensive can reduce pure AI beta, raise cash, or rotate into higher-quality names that are still FCF positive (Microsoft-style) or into less CapEx-intensive themes.
➜ Buy-the-dip view:
These companies are building the infrastructure that will power the next decade of AI.
Temporary negative free cash flow is the cost of winning the platform race (just like AWS and Azure in the early cloud days).
If demand for AI inference and training stays strong, today’s spending becomes tomorrow’s moat.
Selective dips in quality AI infrastructure and related crypto plays can be opportunities for those with longer time horizons.
━━━━━━━━━━━━━━━━━━━━
④ What Traders Should Watch Next
Here are the key things to monitor:
① Guidance language on 2027 CapEx
② Actual utilization rates and AI revenue growth in the next couple of quarters
③ Whether Microsoft’s discipline becomes the template others try to follow
④ Correlation between Big Tech moves and AI-token performance
━━━━━━━━━━━━━━━━━━━━
The AI trade is not dead. It is simply being forced to prove that the enormous checks being written will eventually turn into durable free cash flow and returns on capital.
Big Tech’s free cash flow is under real pressure.
The AI trade is retreating in sympathy.
This is the classic moment where conviction gets tested.
Are you still bullish on the AI trade and buying the dip… or moving into defense mode? 🤔
━━━━━━━━━━━━━━━━━━━━
Drop your view in the comments — defense or offense? Let’s discuss.
If this helped clarify the current setup, share it with someone still trying to make sense of the sell-off.
Stay sharp out there.
#BinanceRestoresWithdrawalsForMultipleNetworksAndAssets #BinanceToResumePhaseOneOfWithdrawals #FBIConfirmsNorthKoreaIsResponsibleForBinanceCryptoHack #YiHe:ProofOfReserves:10TokensAt100%Backing #CZDismissesClaimsBinanceHackWasPredicted $BTC
{future}(BTCUSDT)
$ETH
{future}(ETHUSDT)
$XRP
{future}(XRPUSDT)
Big Tech Free Cash Flow Under Pressure — AI Trade Retreats Together
━━━━━━━━━━━━━━━━━━━━
The numbers just dropped, and the market didn’t like what it saw.
Amazon, Alphabet (Google), Meta and Microsoft just reported a combined quarterly free cash flow swing from a healthy +$61.7 billion a year ago to roughly –$26.4 billion.
Amazon, Google and Meta all flipped negative. Only Microsoft stayed in the black.
CapEx exploded. AI data-center and chip spending surged so hard that even these cash-printing machines are temporarily burning cash.
The reaction was immediate: Big Tech shed nearly $900 billion in market value in days, and the broader AI trade sold off hard.
➤ Here’s the clear picture right now.
━━━━━━━━━━━━━━━━━━━━
① The Cash Flow Reality Check
- Amazon: Posted the biggest burn — trailing 12-month free cash flow deep in negative territory while guiding for even higher 2026–2027 spend.
- Alphabet: Its free cash flow swung negative for the second straight quarter as CapEx more than doubled.
- Meta: Joined the negative club.
- Microsoft: Remains the only one still generating solid free cash flow, though even its number cooled.
These companies are still growing revenue, and cloud AI demand is real.
But the market is now asking a simple question:
How long can they keep spending like this before the returns show up?
━━━━━━━━━━━━━━━━━━━━
② Why the AI Trade Is Retreating Together
When the hyperscalers blink on cash flow, everything connected to the AI narrative feels it:
➤ NVIDIA and the semiconductor complex get hit.
➤ AI software and infrastructure names get hit.
➤ Risk appetite across growth assets drops.
Crypto is not immune.
AI-related tokens (NEAR, TAO, RENDER, VIRTUAL, FET and the broader AI agent / DePIN basket) have been moving more tightly with Big Tech risk sentiment.
When the Mag 7 / hyperscaler trade wobbles, AI coins often follow.
Total AI crypto market cap is currently in the low-to-mid teens of billions — still a small slice of the overall crypto market, but highly sensitive to the same “will the spending pay off?” narrative.
━━━━━━━━━━━━━━━━━━━━
③ Two Ways to Read This
✔︎ Defense view:
Cash-flow pressure + higher rates for longer + elevated CapEx guidance = higher risk of further multiple compression.
Traders who want to stay defensive can reduce pure AI beta, raise cash, or rotate into higher-quality names that are still FCF positive (Microsoft-style) or into less CapEx-intensive themes.
➜ Buy-the-dip view:
These companies are building the infrastructure that will power the next decade of AI.
Temporary negative free cash flow is the cost of winning the platform race (just like AWS and Azure in the early cloud days).
If demand for AI inference and training stays strong, today’s spending becomes tomorrow’s moat.
Selective dips in quality AI infrastructure and related crypto plays can be opportunities for those with longer time horizons.
━━━━━━━━━━━━━━━━━━━━
④ What Traders Should Watch Next
Here are the key things to monitor:
① Guidance language on 2027 CapEx
② Actual utilization rates and AI revenue growth in the next couple of quarters
③ Whether Microsoft’s discipline becomes the template others try to follow
④ Correlation between Big Tech moves and AI-token performance
━━━━━━━━━━━━━━━━━━━━
The AI trade is not dead. It is simply being forced to prove that the enormous checks being written will eventually turn into durable free cash flow and returns on capital.
Big Tech’s free cash flow is under real pressure.
The AI trade is retreating in sympathy.
This is the classic moment where conviction gets tested.
Are you still bullish on the AI trade and buying the dip… or moving into defense mode? 🤔
━━━━━━━━━━━━━━━━━━━━
Drop your view in the comments — defense or offense? Let’s discuss.
If this helped clarify the current setup, share it with someone still trying to make sense of the sell-off.
Stay sharp out there.
#BinanceRestoresWithdrawalsForMultipleNetworksAndAssets #BinanceToResumePhaseOneOfWithdrawals #FBIConfirmsNorthKoreaIsResponsibleForBinanceCryptoHack #YiHe:ProofOfReserves:10TokensAt100%Backing #CZDismissesClaimsBinanceHackWasPredicted $BTC
$ETH
$XRP
The numbers just dropped, and the market didn’t like what it saw.
Amazon, Alphabet (Google), Meta and Microsoft just reported a combined quarterly free cash flow swing from a healthy +$61.7 billion a year ago to roughly –$26.4 billion.
Amazon, Google and Meta all flipped negative. Only Microsoft stayed in the black.
CapEx exploded. AI data-center and chip spending surged so hard that even these cash-printing machines are temporarily burning cash.
The reaction was immediate: Big Tech shed nearly $900 billion in market value in days, and the broader AI trade sold off hard.
➤ Here’s the clear picture right now.
━━━━━━━━━━━━━━━━━━━━
① The Cash Flow Reality Check
- Amazon: Posted the biggest burn — trailing 12-month free cash flow deep in negative territory while guiding for even higher 2026–2027 spend.
- Alphabet: Its free cash flow swung negative for the second straight quarter as CapEx more than doubled.
- Meta: Joined the negative club.
- Microsoft: Remains the only one still generating solid free cash flow, though even its number cooled.
These companies are still growing revenue, and cloud AI demand is real.
But the market is now asking a simple question:
How long can they keep spending like this before the returns show up?
━━━━━━━━━━━━━━━━━━━━
② Why the AI Trade Is Retreating Together
When the hyperscalers blink on cash flow, everything connected to the AI narrative feels it:
➤ NVIDIA and the semiconductor complex get hit.
➤ AI software and infrastructure names get hit.
➤ Risk appetite across growth assets drops.
Crypto is not immune.
AI-related tokens (NEAR, TAO, RENDER, VIRTUAL, FET and the broader AI agent / DePIN basket) have been moving more tightly with Big Tech risk sentiment.
When the Mag 7 / hyperscaler trade wobbles, AI coins often follow.
Total AI crypto market cap is currently in the low-to-mid teens of billions — still a small slice of the overall crypto market, but highly sensitive to the same “will the spending pay off?” narrative.
━━━━━━━━━━━━━━━━━━━━
③ Two Ways to Read This
✔︎ Defense view:
Cash-flow pressure + higher rates for longer + elevated CapEx guidance = higher risk of further multiple compression.
Traders who want to stay defensive can reduce pure AI beta, raise cash, or rotate into higher-quality names that are still FCF positive (Microsoft-style) or into less CapEx-intensive themes.
➜ Buy-the-dip view:
These companies are building the infrastructure that will power the next decade of AI.
Temporary negative free cash flow is the cost of winning the platform race (just like AWS and Azure in the early cloud days).
If demand for AI inference and training stays strong, today’s spending becomes tomorrow’s moat.
Selective dips in quality AI infrastructure and related crypto plays can be opportunities for those with longer time horizons.
━━━━━━━━━━━━━━━━━━━━
④ What Traders Should Watch Next
Here are the key things to monitor:
① Guidance language on 2027 CapEx
② Actual utilization rates and AI revenue growth in the next couple of quarters
③ Whether Microsoft’s discipline becomes the template others try to follow
④ Correlation between Big Tech moves and AI-token performance
━━━━━━━━━━━━━━━━━━━━
The AI trade is not dead. It is simply being forced to prove that the enormous checks being written will eventually turn into durable free cash flow and returns on capital.
Big Tech’s free cash flow is under real pressure.
The AI trade is retreating in sympathy.
This is the classic moment where conviction gets tested.
Are you still bullish on the AI trade and buying the dip… or moving into defense mode? 🤔
━━━━━━━━━━━━━━━━━━━━
Drop your view in the comments — defense or offense? Let’s discuss.
If this helped clarify the current setup, share it with someone still trying to make sense of the sell-off.
Stay sharp out there.
#BinanceRestoresWithdrawalsForMultipleNetworksAndAssets #BinanceToResumePhaseOneOfWithdrawals #FBIConfirmsNorthKoreaIsResponsibleForBinanceCryptoHack #YiHe:ProofOfReserves:10TokensAt100%Backing #CZDismissesClaimsBinanceHackWasPredicted $BTC
$ETH
$XRP
2
2

ບົດຄວາມ
📚 The Long Game: How Every Market Cycle Can Become a Classroom for Traders━━━━━━━━━━━━━━━━━━━━
Most traders remember the green days. The traders who last remember the red ones too, because that's where the real lessons were hiding.
Every cycle has a personality. Bull runs make everyone feel like a genius. Bear markets make everyone feel like a beginner again. Sideways chop tests whether you actually have patience or just say you do.
Here's the truth that doesn't get said enough 👇
**Markets don't just reward or punish you. They teach you.** Every single cycle is a classroom, and the traders who show up as students tend to outlast the ones who show up as predictors.
Let's walk through what each phase can teach you. 🎓
━━━━━━━━━━━━━━━━━━━━
◆ PART 1: THE BULL PHASE — The Lesson of Humility ◆
When prices climb and everything works, confidence grows fast. Sometimes too fast.
**➤ What this phase teaches:**
① Winning streaks are not proof of skill. A rising tide lifts almost every boat, including the leaky ones.
② Position size matters more when you feel invincible, not less.
③ Having an exit plan while things feel great is a sign of maturity, not pessimism.
**✔︎ Ask yourself:** "Would my results look the same if the market was flat?"
If the honest answer is no, that's useful information, not a failure. It simply shows where your edge ends and market momentum begins.
━━━━━━━━━━━━━━━━━━━━
◆ PART 2: THE BEAR PHASE — The Lesson of Survival ◆
Downtrends strip away the noise. Hype fades, timelines go quiet, and only discipline remains.
**➤ What this phase teaches:**
① Capital preservation is a skill, not a consolation prize.
② Emotional decisions cost more in drawdowns than in rallies.
③ Patience is an active choice. Sitting out can be a position too.
✔︎ Many experienced traders say their biggest improvements came during difficult conditions, because that's when weak habits become impossible to ignore.
Think of a bear market as a free (well, not exactly free) masterclass in risk management.
━━━━━━━━━━━━━━━━━━━━
◆ PART 3: THE SIDEWAYS PHASE — The Lesson of Patience ◆
Nobody posts screenshots of range-bound markets. But this is where character gets built.
**➤ What this phase teaches:**
① Not every day needs a trade. Boredom is a hidden cost for many traders.
② Overtrading often comes from discomfort with waiting, not from opportunity.
③ Process beats prediction when direction is unclear.
✔︎ Quiet markets reveal whether you follow a plan or simply follow your impulses.
━━━━━━━━━━━━━━━━━━━━
◆ THE 3-STEP CYCLE REVIEW FRAMEWORK ◆
Want to turn any market phase into real learning? Try this simple routine:
➜ Step ① — RECORD:** Keep a trade journal. Log your reasoning, emotions, and outcome, not just entries and exits.
➜ Step ② — REVIEW:** Once a week, look for patterns. Are you rushing entries? Ignoring your own rules?
➜ Step ③ — REFINE:** Change one thing at a time. Small, consistent adjustments compound like capital does.
This takes ten minutes a week. The traders who stick with it tend to build a clear picture of their own behavior over time.
━━━━━━━━━━━━━━━━━━━━
◆ COMMON MISTAKES THAT WASTE A MARKET CYCLE ◆
✔︎ Blaming "the market" instead of reviewing your process
✔︎ Changing strategy after every loss
✔︎ Copying others without understanding their risk profile
✔︎ Confusing activity with progress
✔︎ Skipping the review because "it's too painful to look at"
Each of these keeps you repeating the same lesson at a higher price. 😅
━━━━━━━━━━━━━━━━━━━━
◆ THE LONG GAME MINDSET ◆
Short-term traders chase the next candle. Long-game traders build the next version of themselves.
Your edge isn't a single indicator or a perfect call. It's a combination of:
➤ Consistency
➤ Emotional control
➤ Risk awareness
➤ A willingness to keep learning
Prices move in cycles. So does experience. The difference is that experience, once earned, stays with you.
━━━━━━━━━━━━━━━━━━━━
Every cycle will eventually end, and a new one will begin. What matters is who you've become by the time it does.
If you treat each phase as a classroom, you stop fearing the market's mood swings and start learning from them. That's the long game. 🌱
━━━━━━━━━━━━━━━━━━━━
YOUR TURN:
**Which market phase taught you the most: bull, bear, or sideways?**
Share your biggest lesson in the comments. Real stories help the whole community learn.
If this article added value, share it with a fellow trader who's still in the learning phase, and follow for more trading psychology insights.
━━━━━━━━━━━━━━━━━━━━
⚠️ Risk Disclaimer: This article is for educational and informational purposes only and does not constitute financial, investment, or trading advice. Cryptocurrency trading involves substantial risk, including the possible loss of capital. Market conditions can change quickly. Always do your own research and only trade with funds you can afford to lose.
$BTC
{future}(BTCUSDT)
$ETH
{future}(ETHUSDT)
$XRP
{future}(XRPUSDT)
#BinanceSAFUFundTransferCompleted7499BTC #BinanceRecovery90% of stolen assets #YiHe:ProofOfReserves:10TokensAt100%Backing #CZSaysCompensationIsinPlaceUsersAreProtected #USDCCirculationFallsAbout800MInSevenDays
📚 The Long Game: How Every Market Cycle Can Become a Classroom for Traders
━━━━━━━━━━━━━━━━━━━━
Most traders remember the green days. The traders who last remember the red ones too, because that's where the real lessons were hiding.
Every cycle has a personality. Bull runs make everyone feel like a genius. Bear markets make everyone feel like a beginner again. Sideways chop tests whether you actually have patience or just say you do.
Here's the truth that doesn't get said enough 👇
**Markets don't just reward or punish you. They teach you.** Every single cycle is a classroom, and the traders who show up as students tend to outlast the ones who show up as predictors.
Let's walk through what each phase can teach you. 🎓
━━━━━━━━━━━━━━━━━━━━
◆ PART 1: THE BULL PHASE — The Lesson of Humility ◆
When prices climb and everything works, confidence grows fast. Sometimes too fast.
**➤ What this phase teaches:**
① Winning streaks are not proof of skill. A rising tide lifts almost every boat, including the leaky ones.
② Position size matters more when you feel invincible, not less.
③ Having an exit plan while things feel great is a sign of maturity, not pessimism.
**✔︎ Ask yourself:** "Would my results look the same if the market was flat?"
If the honest answer is no, that's useful information, not a failure. It simply shows where your edge ends and market momentum begins.
━━━━━━━━━━━━━━━━━━━━
◆ PART 2: THE BEAR PHASE — The Lesson of Survival ◆
Downtrends strip away the noise. Hype fades, timelines go quiet, and only discipline remains.
**➤ What this phase teaches:**
① Capital preservation is a skill, not a consolation prize.
② Emotional decisions cost more in drawdowns than in rallies.
③ Patience is an active choice. Sitting out can be a position too.
✔︎ Many experienced traders say their biggest improvements came during difficult conditions, because that's when weak habits become impossible to ignore.
Think of a bear market as a free (well, not exactly free) masterclass in risk management.
━━━━━━━━━━━━━━━━━━━━
◆ PART 3: THE SIDEWAYS PHASE — The Lesson of Patience ◆
Nobody posts screenshots of range-bound markets. But this is where character gets built.
**➤ What this phase teaches:**
① Not every day needs a trade. Boredom is a hidden cost for many traders.
② Overtrading often comes from discomfort with waiting, not from opportunity.
③ Process beats prediction when direction is unclear.
✔︎ Quiet markets reveal whether you follow a plan or simply follow your impulses.
━━━━━━━━━━━━━━━━━━━━
◆ THE 3-STEP CYCLE REVIEW FRAMEWORK ◆
Want to turn any market phase into real learning? Try this simple routine:
➜ Step ① — RECORD:** Keep a trade journal. Log your reasoning, emotions, and outcome, not just entries and exits.
➜ Step ② — REVIEW:** Once a week, look for patterns. Are you rushing entries? Ignoring your own rules?
➜ Step ③ — REFINE:** Change one thing at a time. Small, consistent adjustments compound like capital does.
This takes ten minutes a week. The traders who stick with it tend to build a clear picture of their own behavior over time.
━━━━━━━━━━━━━━━━━━━━
◆ COMMON MISTAKES THAT WASTE A MARKET CYCLE ◆
✔︎ Blaming "the market" instead of reviewing your process
✔︎ Changing strategy after every loss
✔︎ Copying others without understanding their risk profile
✔︎ Confusing activity with progress
✔︎ Skipping the review because "it's too painful to look at"
Each of these keeps you repeating the same lesson at a higher price. 😅
━━━━━━━━━━━━━━━━━━━━
◆ THE LONG GAME MINDSET ◆
Short-term traders chase the next candle. Long-game traders build the next version of themselves.
Your edge isn't a single indicator or a perfect call. It's a combination of:
➤ Consistency
➤ Emotional control
➤ Risk awareness
➤ A willingness to keep learning
Prices move in cycles. So does experience. The difference is that experience, once earned, stays with you.
━━━━━━━━━━━━━━━━━━━━
Every cycle will eventually end, and a new one will begin. What matters is who you've become by the time it does.
If you treat each phase as a classroom, you stop fearing the market's mood swings and start learning from them. That's the long game. 🌱
━━━━━━━━━━━━━━━━━━━━
YOUR TURN:
**Which market phase taught you the most: bull, bear, or sideways?**
Share your biggest lesson in the comments. Real stories help the whole community learn.
If this article added value, share it with a fellow trader who's still in the learning phase, and follow for more trading psychology insights.
━━━━━━━━━━━━━━━━━━━━
⚠️ Risk Disclaimer: This article is for educational and informational purposes only and does not constitute financial, investment, or trading advice. Cryptocurrency trading involves substantial risk, including the possible loss of capital. Market conditions can change quickly. Always do your own research and only trade with funds you can afford to lose.
$BTC
$ETH
$XRP
#BinanceSAFUFundTransferCompleted7499BTC #BinanceRecovery90% of stolen assets #YiHe:ProofOfReserves:10TokensAt100%Backing #CZSaysCompensationIsinPlaceUsersAreProtected #USDCCirculationFallsAbout800MInSevenDays
Most traders remember the green days. The traders who last remember the red ones too, because that's where the real lessons were hiding.
Every cycle has a personality. Bull runs make everyone feel like a genius. Bear markets make everyone feel like a beginner again. Sideways chop tests whether you actually have patience or just say you do.
Here's the truth that doesn't get said enough 👇
**Markets don't just reward or punish you. They teach you.** Every single cycle is a classroom, and the traders who show up as students tend to outlast the ones who show up as predictors.
Let's walk through what each phase can teach you. 🎓
━━━━━━━━━━━━━━━━━━━━
◆ PART 1: THE BULL PHASE — The Lesson of Humility ◆
When prices climb and everything works, confidence grows fast. Sometimes too fast.
**➤ What this phase teaches:**
① Winning streaks are not proof of skill. A rising tide lifts almost every boat, including the leaky ones.
② Position size matters more when you feel invincible, not less.
③ Having an exit plan while things feel great is a sign of maturity, not pessimism.
**✔︎ Ask yourself:** "Would my results look the same if the market was flat?"
If the honest answer is no, that's useful information, not a failure. It simply shows where your edge ends and market momentum begins.
━━━━━━━━━━━━━━━━━━━━
◆ PART 2: THE BEAR PHASE — The Lesson of Survival ◆
Downtrends strip away the noise. Hype fades, timelines go quiet, and only discipline remains.
**➤ What this phase teaches:**
① Capital preservation is a skill, not a consolation prize.
② Emotional decisions cost more in drawdowns than in rallies.
③ Patience is an active choice. Sitting out can be a position too.
✔︎ Many experienced traders say their biggest improvements came during difficult conditions, because that's when weak habits become impossible to ignore.
Think of a bear market as a free (well, not exactly free) masterclass in risk management.
━━━━━━━━━━━━━━━━━━━━
◆ PART 3: THE SIDEWAYS PHASE — The Lesson of Patience ◆
Nobody posts screenshots of range-bound markets. But this is where character gets built.
**➤ What this phase teaches:**
① Not every day needs a trade. Boredom is a hidden cost for many traders.
② Overtrading often comes from discomfort with waiting, not from opportunity.
③ Process beats prediction when direction is unclear.
✔︎ Quiet markets reveal whether you follow a plan or simply follow your impulses.
━━━━━━━━━━━━━━━━━━━━
◆ THE 3-STEP CYCLE REVIEW FRAMEWORK ◆
Want to turn any market phase into real learning? Try this simple routine:
➜ Step ① — RECORD:** Keep a trade journal. Log your reasoning, emotions, and outcome, not just entries and exits.
➜ Step ② — REVIEW:** Once a week, look for patterns. Are you rushing entries? Ignoring your own rules?
➜ Step ③ — REFINE:** Change one thing at a time. Small, consistent adjustments compound like capital does.
This takes ten minutes a week. The traders who stick with it tend to build a clear picture of their own behavior over time.
━━━━━━━━━━━━━━━━━━━━
◆ COMMON MISTAKES THAT WASTE A MARKET CYCLE ◆
✔︎ Blaming "the market" instead of reviewing your process
✔︎ Changing strategy after every loss
✔︎ Copying others without understanding their risk profile
✔︎ Confusing activity with progress
✔︎ Skipping the review because "it's too painful to look at"
Each of these keeps you repeating the same lesson at a higher price. 😅
━━━━━━━━━━━━━━━━━━━━
◆ THE LONG GAME MINDSET ◆
Short-term traders chase the next candle. Long-game traders build the next version of themselves.
Your edge isn't a single indicator or a perfect call. It's a combination of:
➤ Consistency
➤ Emotional control
➤ Risk awareness
➤ A willingness to keep learning
Prices move in cycles. So does experience. The difference is that experience, once earned, stays with you.
━━━━━━━━━━━━━━━━━━━━
Every cycle will eventually end, and a new one will begin. What matters is who you've become by the time it does.
If you treat each phase as a classroom, you stop fearing the market's mood swings and start learning from them. That's the long game. 🌱
━━━━━━━━━━━━━━━━━━━━
YOUR TURN:
**Which market phase taught you the most: bull, bear, or sideways?**
Share your biggest lesson in the comments. Real stories help the whole community learn.
If this article added value, share it with a fellow trader who's still in the learning phase, and follow for more trading psychology insights.
━━━━━━━━━━━━━━━━━━━━
⚠️ Risk Disclaimer: This article is for educational and informational purposes only and does not constitute financial, investment, or trading advice. Cryptocurrency trading involves substantial risk, including the possible loss of capital. Market conditions can change quickly. Always do your own research and only trade with funds you can afford to lose.
$BTC
$ETH
$XRP
#BinanceSAFUFundTransferCompleted7499BTC #BinanceRecovery90% of stolen assets #YiHe:ProofOfReserves:10TokensAt100%Backing #CZSaysCompensationIsinPlaceUsersAreProtected #USDCCirculationFallsAbout800MInSevenDays
4
226
$DOGE
{future}(DOGEUSDT)
Lower Highs: Is More Downside Coming?
◆━━━━━━━━━━━━━━━━━━
Market Overview
Dogecoin is trading near $0.07508 on the 4H chart, down about 0.95%. After rejecting the $0.0788–$0.0804 zone, DOGE dropped sharply and is now consolidating. The short-term trend is bearish with active volatility.
Technical Analysis
DOGE spent time ranging inside a large consolidation zone before breaking lower. The bounce toward $0.0788 failed, creating a lower high, which is a classic bearish continuation signal.
Price is now holding above $0.0704 support, but candles remain small and weak. The projected path on the chart shows a zigzag structure with possible further downside if support fails.
🟢 Bullish Case
A 4H close above $0.0784 would signal buyers recovering. A reclaim of $0.0788 could open the way toward $0.0804.
🔴 Bearish Case
A breakdown below $0.0750 followed by a close under $0.0704 would confirm continuation. That could accelerate selling pressure and extend the downtrend.
⚪ Neutral Case
DOGE may range between $0.0704 and $0.0784 while waiting for direction. Low volume would support sideways movement.
Key Levels
➤ Resistance: R1: $0.0784 | R2: $0.0804
➤ Support: S1: $0.0750 | S2: $0.0704
Context
DOGE is highly sensitive to Bitcoin moves and market sentiment. Stability in BTC could help meme coins hold support.
Conclusion
Lower highs favor sellers for now. Watch $0.0704 support and $0.0784 resistance for the next confirmation.
This is not financial advice. Always do your own research.
◆━━━━━━━━━━━━━━━━━━
#DOGE #HeYiSaysWithdrawalsExpectedtoResumeWithin42Hours #CZSaysCompensationIsinPlaceUsersAreProtected #USDCCirculationFallsAbout800MInSevenDays #ASICHasReceivedNoPredictionMarketApplications
$DOGE
Lower Highs: Is More Downside Coming?
◆━━━━━━━━━━━━━━━━━━
Market Overview
Dogecoin is trading near $0.07508 on the 4H chart, down about 0.95%. After rejecting the $0.0788–$0.0804 zone, DOGE dropped sharply and is now consolidating. The short-term trend is bearish with active volatility.
Technical Analysis
DOGE spent time ranging inside a large consolidation zone before breaking lower. The bounce toward $0.0788 failed, creating a lower high, which is a classic bearish continuation signal.
Price is now holding above $0.0704 support, but candles remain small and weak. The projected path on the chart shows a zigzag structure with possible further downside if support fails.
🟢 Bullish Case
A 4H close above $0.0784 would signal buyers recovering. A reclaim of $0.0788 could open the way toward $0.0804.
🔴 Bearish Case
A breakdown below $0.0750 followed by a close under $0.0704 would confirm continuation. That could accelerate selling pressure and extend the downtrend.
⚪ Neutral Case
DOGE may range between $0.0704 and $0.0784 while waiting for direction. Low volume would support sideways movement.
Key Levels
➤ Resistance: R1: $0.0784 | R2: $0.0804
➤ Support: S1: $0.0750 | S2: $0.0704
Context
DOGE is highly sensitive to Bitcoin moves and market sentiment. Stability in BTC could help meme coins hold support.
Conclusion
Lower highs favor sellers for now. Watch $0.0704 support and $0.0784 resistance for the next confirmation.
This is not financial advice. Always do your own research.
◆━━━━━━━━━━━━━━━━━━
#DOGE #HeYiSaysWithdrawalsExpectedtoResumeWithin42Hours #CZSaysCompensationIsinPlaceUsersAreProtected #USDCCirculationFallsAbout800MInSevenDays #ASICHasReceivedNoPredictionMarketApplications
Lower Highs: Is More Downside Coming?
◆━━━━━━━━━━━━━━━━━━
Market Overview
Dogecoin is trading near $0.07508 on the 4H chart, down about 0.95%. After rejecting the $0.0788–$0.0804 zone, DOGE dropped sharply and is now consolidating. The short-term trend is bearish with active volatility.
Technical Analysis
DOGE spent time ranging inside a large consolidation zone before breaking lower. The bounce toward $0.0788 failed, creating a lower high, which is a classic bearish continuation signal.
Price is now holding above $0.0704 support, but candles remain small and weak. The projected path on the chart shows a zigzag structure with possible further downside if support fails.
🟢 Bullish Case
A 4H close above $0.0784 would signal buyers recovering. A reclaim of $0.0788 could open the way toward $0.0804.
🔴 Bearish Case
A breakdown below $0.0750 followed by a close under $0.0704 would confirm continuation. That could accelerate selling pressure and extend the downtrend.
⚪ Neutral Case
DOGE may range between $0.0704 and $0.0784 while waiting for direction. Low volume would support sideways movement.
Key Levels
➤ Resistance: R1: $0.0784 | R2: $0.0804
➤ Support: S1: $0.0750 | S2: $0.0704
Context
DOGE is highly sensitive to Bitcoin moves and market sentiment. Stability in BTC could help meme coins hold support.
Conclusion
Lower highs favor sellers for now. Watch $0.0704 support and $0.0784 resistance for the next confirmation.
This is not financial advice. Always do your own research.
◆━━━━━━━━━━━━━━━━━━
#DOGE #HeYiSaysWithdrawalsExpectedtoResumeWithin42Hours #CZSaysCompensationIsinPlaceUsersAreProtected #USDCCirculationFallsAbout800MInSevenDays #ASICHasReceivedNoPredictionMarketApplications
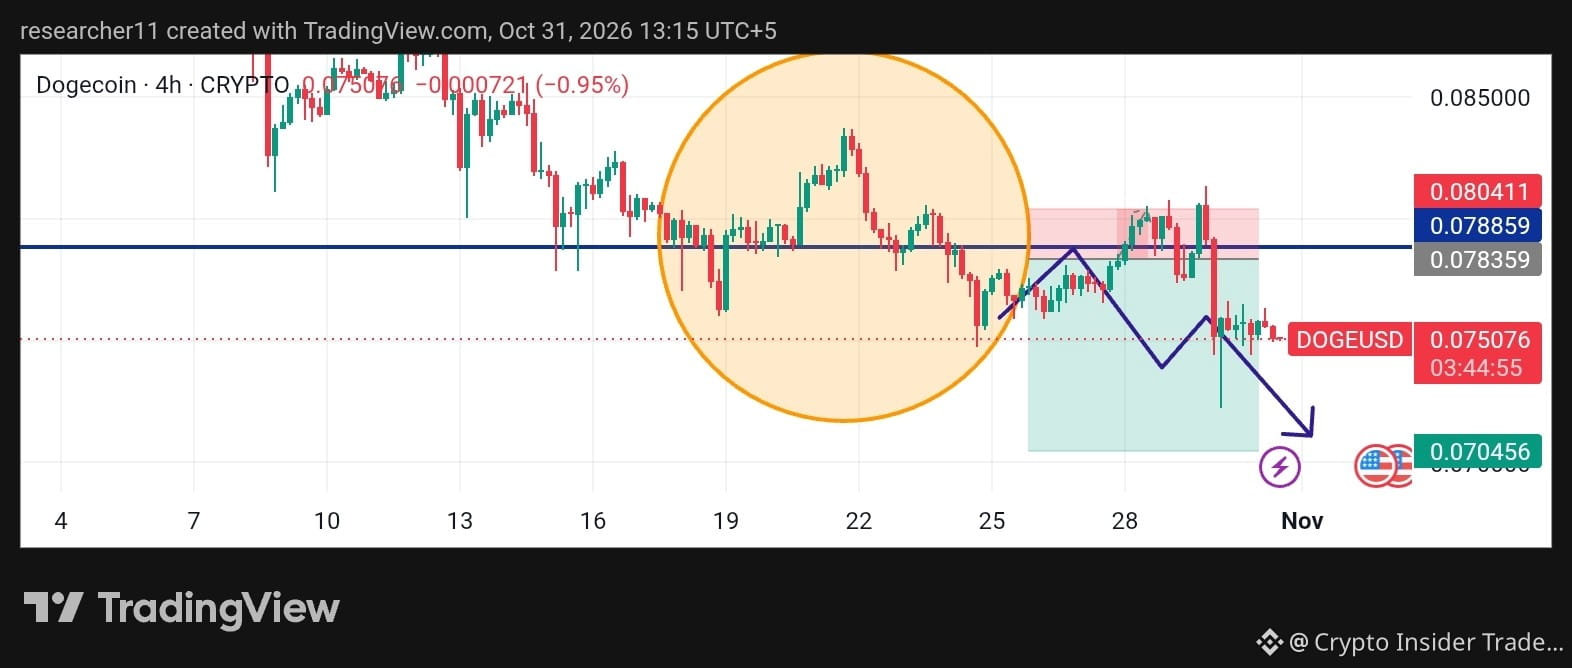
88
$XRP
{future}(XRPUSDT)
Breakdown Alert: Key Support in Focus
◆━━━━━━━━━━━━━━━━━━
Market Overview
XRP is trading near $1.2448 on the 4H chart, down about 0.7% on the day. After a sharp sell-off from the $1.30–$1.34 zone, price is now moving in a tight range. Short-term momentum remains bearish.
Technical Analysis
XRP completed a Head and Shoulders pattern, with the head near the $1.40 area. After the neckline broke, price dropped sharply and failed to reclaim it, which is a bearish sign.
Resistance at $1.3045 has capped recent bounces, while $1.3462 marks the stronger supply zone. Price is now sitting above $1.1587 support. Small candles show hesitation, but buyers haven't shown strength yet.
🟢 Bullish Case
A 4H close above $1.3045 would signal recovery. Holding above that level could open the path toward $1.3462.
🔴 Bearish Case
A breakdown below $1.20 with a close under $1.1587 would confirm continuation. This could extend the downtrend and increase selling pressure.
⚪ Neutral Case
XRP may range between $1.16 and $1.30 until a clear breakout appears. Consolidation after a drop is common and often precedes the next move.
Key Levels
➤ Resistance: R1: $1.3045 | R2: $1.3462
➤ Support: S1: $1.2000 | S2: $1.1587
Context
XRP is following the broader market weakness. Bitcoin's reaction near $75.8K will likely guide altcoins in the short term.
Conclusion
The bearish pattern remains in play unless XRP reclaims $1.30. Watch the $1.16 support closely and let price confirm the next direction.
This is not financial advice. Always do your own research.
◆━━━━━━━━━━━━━━━━━━
#xrp #HeYiSaysWithdrawalsExpectedtoResumeWithin42Hours #CZSaysCompensationIsinPlaceUsersAreProtected #USDCCirculationFallsAbout800MInSevenDays #ASICHasReceivedNoPredictionMarketApplications
$XRP
Breakdown Alert: Key Support in Focus
◆━━━━━━━━━━━━━━━━━━
Market Overview
XRP is trading near $1.2448 on the 4H chart, down about 0.7% on the day. After a sharp sell-off from the $1.30–$1.34 zone, price is now moving in a tight range. Short-term momentum remains bearish.
Technical Analysis
XRP completed a Head and Shoulders pattern, with the head near the $1.40 area. After the neckline broke, price dropped sharply and failed to reclaim it, which is a bearish sign.
Resistance at $1.3045 has capped recent bounces, while $1.3462 marks the stronger supply zone. Price is now sitting above $1.1587 support. Small candles show hesitation, but buyers haven't shown strength yet.
🟢 Bullish Case
A 4H close above $1.3045 would signal recovery. Holding above that level could open the path toward $1.3462.
🔴 Bearish Case
A breakdown below $1.20 with a close under $1.1587 would confirm continuation. This could extend the downtrend and increase selling pressure.
⚪ Neutral Case
XRP may range between $1.16 and $1.30 until a clear breakout appears. Consolidation after a drop is common and often precedes the next move.
Key Levels
➤ Resistance: R1: $1.3045 | R2: $1.3462
➤ Support: S1: $1.2000 | S2: $1.1587
Context
XRP is following the broader market weakness. Bitcoin's reaction near $75.8K will likely guide altcoins in the short term.
Conclusion
The bearish pattern remains in play unless XRP reclaims $1.30. Watch the $1.16 support closely and let price confirm the next direction.
This is not financial advice. Always do your own research.
◆━━━━━━━━━━━━━━━━━━
#xrp #HeYiSaysWithdrawalsExpectedtoResumeWithin42Hours #CZSaysCompensationIsinPlaceUsersAreProtected #USDCCirculationFallsAbout800MInSevenDays #ASICHasReceivedNoPredictionMarketApplications
Breakdown Alert: Key Support in Focus
◆━━━━━━━━━━━━━━━━━━
Market Overview
XRP is trading near $1.2448 on the 4H chart, down about 0.7% on the day. After a sharp sell-off from the $1.30–$1.34 zone, price is now moving in a tight range. Short-term momentum remains bearish.
Technical Analysis
XRP completed a Head and Shoulders pattern, with the head near the $1.40 area. After the neckline broke, price dropped sharply and failed to reclaim it, which is a bearish sign.
Resistance at $1.3045 has capped recent bounces, while $1.3462 marks the stronger supply zone. Price is now sitting above $1.1587 support. Small candles show hesitation, but buyers haven't shown strength yet.
🟢 Bullish Case
A 4H close above $1.3045 would signal recovery. Holding above that level could open the path toward $1.3462.
🔴 Bearish Case
A breakdown below $1.20 with a close under $1.1587 would confirm continuation. This could extend the downtrend and increase selling pressure.
⚪ Neutral Case
XRP may range between $1.16 and $1.30 until a clear breakout appears. Consolidation after a drop is common and often precedes the next move.
Key Levels
➤ Resistance: R1: $1.3045 | R2: $1.3462
➤ Support: S1: $1.2000 | S2: $1.1587
Context
XRP is following the broader market weakness. Bitcoin's reaction near $75.8K will likely guide altcoins in the short term.
Conclusion
The bearish pattern remains in play unless XRP reclaims $1.30. Watch the $1.16 support closely and let price confirm the next direction.
This is not financial advice. Always do your own research.
◆━━━━━━━━━━━━━━━━━━
#xrp #HeYiSaysWithdrawalsExpectedtoResumeWithin42Hours #CZSaysCompensationIsinPlaceUsersAreProtected #USDCCirculationFallsAbout800MInSevenDays #ASICHasReceivedNoPredictionMarketApplications
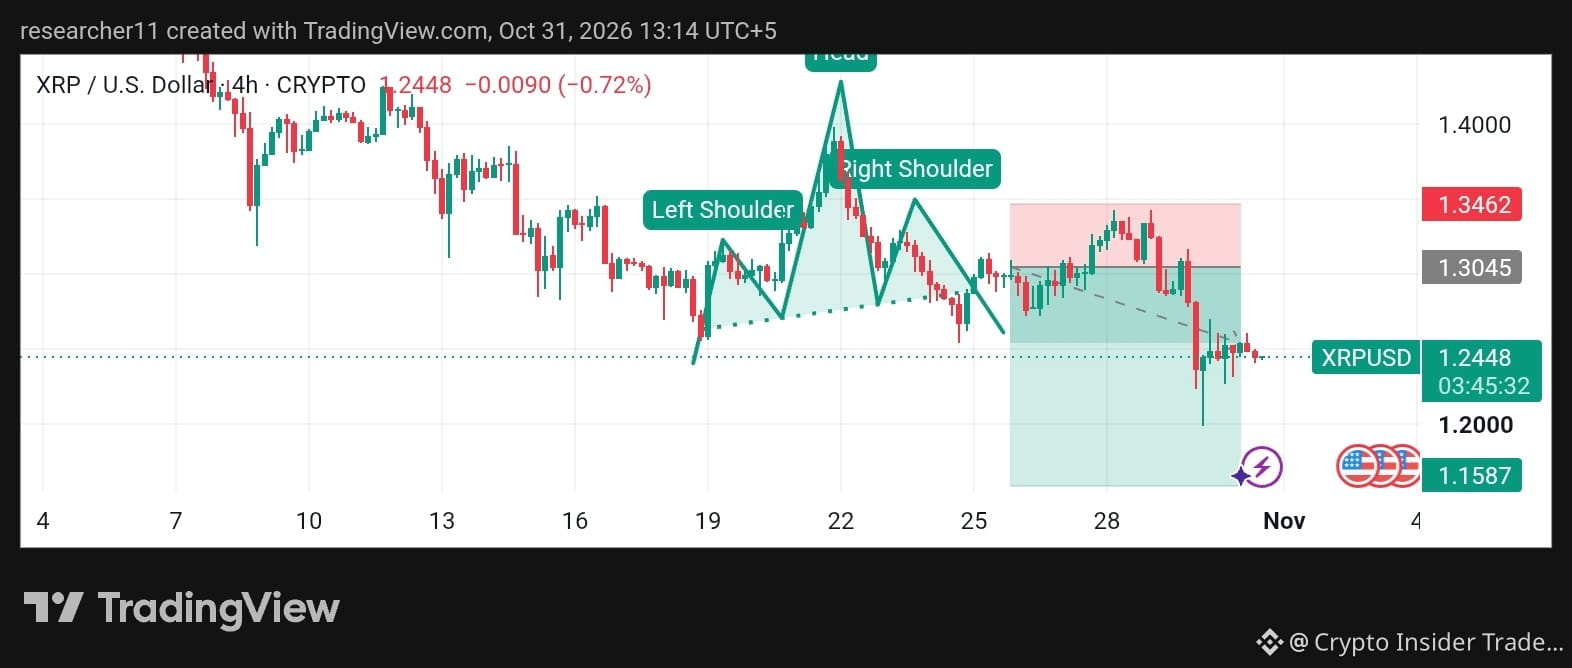
2
91
$ETH
{future}(ETHUSDT)
Head & Shoulders: Bears Eye Control
◆━━━━━━━━━━━━━━━━━━
Market Overview
Ethereum is trading near $2,242 on the 4H chart after a strong drop from the $2,370–$2,430 area. Volatility increased during the sell-off, and price is now moving sideways with small candles. The overall trend is bearish in the short term.
Technical Analysis
ETH formed a clear Head and Shoulders pattern, a classic bearish reversal structure. The neckline broke, and price followed through lower, confirming the pattern.
Resistance near $2,389 rejected price multiple times, forming a strong supply zone. Price is now hovering above the $2,156 support area. The bounce is weak so far, which suggests buyers lack strong momentum.
🟢 Bullish Case
A 4H close above $2,373 would show buyers recovering. A move back above $2,389 would weaken the bearish pattern and could target $2,431.
🔴 Bearish Case
A breakdown below $2,156 would confirm trend continuation. The pattern's downside pressure could then extend toward lower support zones.
⚪ Neutral Case
ETH may consolidate between $2,156 and $2,300 while the market looks for direction. Low volume would support this range scenario.
Key Levels
➤ Resistance: R1: $2,373 | R2: $2,431
➤ Support: S1: $2,200 | S2: $2,156
Context
ETH often follows Bitcoin's lead. If BTC holds support, ETH may see a relief bounce. A BTC breakdown would add pressure.
Conclusion
The Head and Shoulders structure favors bears for now, but $2,156 is the key level to watch. Wait for confirmation and manage risk carefully.
This is not financial advice. Always do your own research.
◆━━━━━━━━━━━━━━━━━
#ETH #HeYiSaysWithdrawalsExpectedtoResumeWithin42Hours #CZSaysCompensationIsinPlaceUsersAreProtected #USDCCirculationFallsAbout800MInSevenDays #ASICHasReceivedNoPredictionMarketApplications
$ETH
Head & Shoulders: Bears Eye Control
◆━━━━━━━━━━━━━━━━━━
Market Overview
Ethereum is trading near $2,242 on the 4H chart after a strong drop from the $2,370–$2,430 area. Volatility increased during the sell-off, and price is now moving sideways with small candles. The overall trend is bearish in the short term.
Technical Analysis
ETH formed a clear Head and Shoulders pattern, a classic bearish reversal structure. The neckline broke, and price followed through lower, confirming the pattern.
Resistance near $2,389 rejected price multiple times, forming a strong supply zone. Price is now hovering above the $2,156 support area. The bounce is weak so far, which suggests buyers lack strong momentum.
🟢 Bullish Case
A 4H close above $2,373 would show buyers recovering. A move back above $2,389 would weaken the bearish pattern and could target $2,431.
🔴 Bearish Case
A breakdown below $2,156 would confirm trend continuation. The pattern's downside pressure could then extend toward lower support zones.
⚪ Neutral Case
ETH may consolidate between $2,156 and $2,300 while the market looks for direction. Low volume would support this range scenario.
Key Levels
➤ Resistance: R1: $2,373 | R2: $2,431
➤ Support: S1: $2,200 | S2: $2,156
Context
ETH often follows Bitcoin's lead. If BTC holds support, ETH may see a relief bounce. A BTC breakdown would add pressure.
Conclusion
The Head and Shoulders structure favors bears for now, but $2,156 is the key level to watch. Wait for confirmation and manage risk carefully.
This is not financial advice. Always do your own research.
◆━━━━━━━━━━━━━━━━━
#ETH #HeYiSaysWithdrawalsExpectedtoResumeWithin42Hours #CZSaysCompensationIsinPlaceUsersAreProtected #USDCCirculationFallsAbout800MInSevenDays #ASICHasReceivedNoPredictionMarketApplications
Head & Shoulders: Bears Eye Control
◆━━━━━━━━━━━━━━━━━━
Market Overview
Ethereum is trading near $2,242 on the 4H chart after a strong drop from the $2,370–$2,430 area. Volatility increased during the sell-off, and price is now moving sideways with small candles. The overall trend is bearish in the short term.
Technical Analysis
ETH formed a clear Head and Shoulders pattern, a classic bearish reversal structure. The neckline broke, and price followed through lower, confirming the pattern.
Resistance near $2,389 rejected price multiple times, forming a strong supply zone. Price is now hovering above the $2,156 support area. The bounce is weak so far, which suggests buyers lack strong momentum.
🟢 Bullish Case
A 4H close above $2,373 would show buyers recovering. A move back above $2,389 would weaken the bearish pattern and could target $2,431.
🔴 Bearish Case
A breakdown below $2,156 would confirm trend continuation. The pattern's downside pressure could then extend toward lower support zones.
⚪ Neutral Case
ETH may consolidate between $2,156 and $2,300 while the market looks for direction. Low volume would support this range scenario.
Key Levels
➤ Resistance: R1: $2,373 | R2: $2,431
➤ Support: S1: $2,200 | S2: $2,156
Context
ETH often follows Bitcoin's lead. If BTC holds support, ETH may see a relief bounce. A BTC breakdown would add pressure.
Conclusion
The Head and Shoulders structure favors bears for now, but $2,156 is the key level to watch. Wait for confirmation and manage risk carefully.
This is not financial advice. Always do your own research.
◆━━━━━━━━━━━━━━━━━
#ETH #HeYiSaysWithdrawalsExpectedtoResumeWithin42Hours #CZSaysCompensationIsinPlaceUsersAreProtected #USDCCirculationFallsAbout800MInSevenDays #ASICHasReceivedNoPredictionMarketApplications
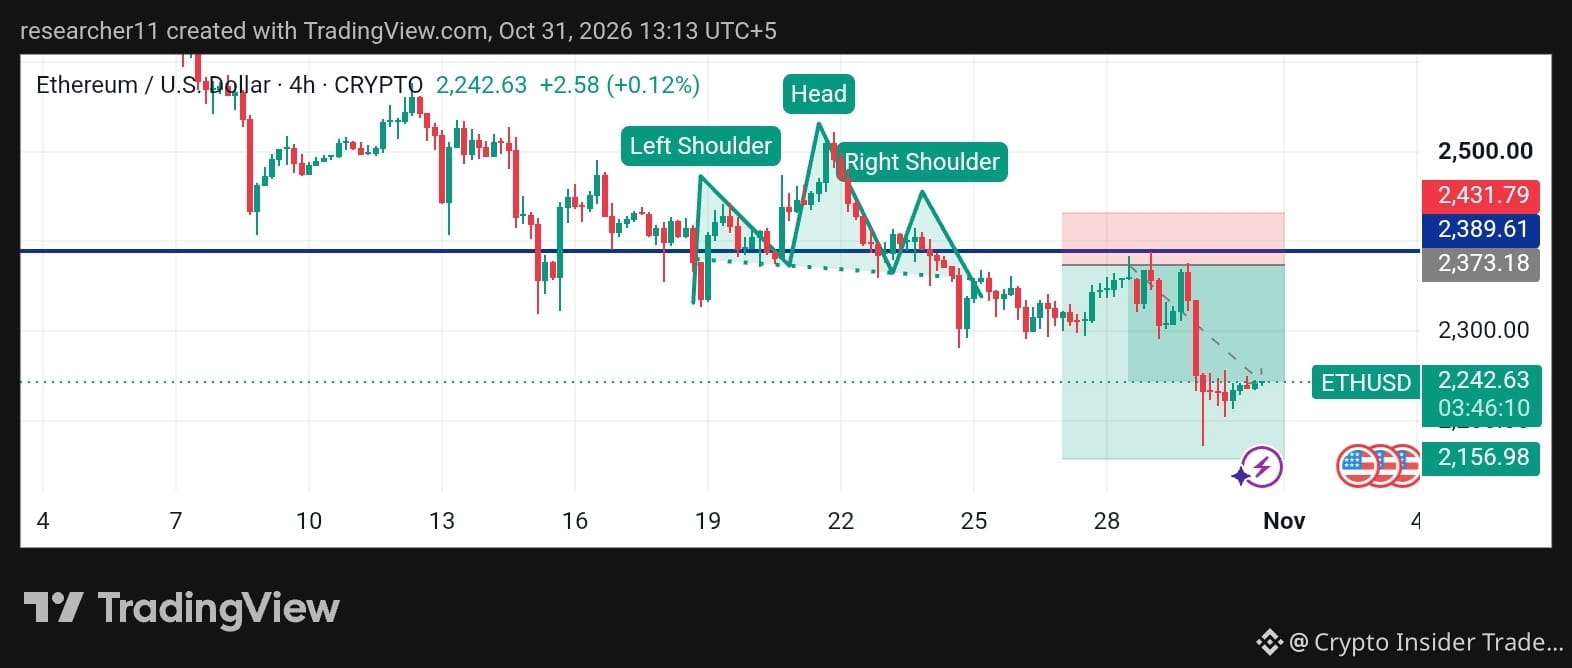
61
$BTC
{future}(BTCUSDT)
Under Pressure: Will $75.8K Hold?
◆━━━━━━━━━━━━━━━━━━
Market Overview
Bitcoin is trading near $77,311 on the 4H chart after a sharp sell-off from the $81K–$82K zone. Volatility spiked during the drop, and price is now trying to stabilize with small candles. The short-term trend remains bearish, with sellers still in control.
Technical Analysis
BTC was rejected at the $81,232 resistance area, which acted as a strong supply zone. The breakdown candle was large and decisive, showing real selling pressure.
Right now, price is consolidating just above $75,847, a key short-term support. The structure shows lower highs and a clean rejection from resistance. A small bounce is forming, but it hasn't flipped the trend yet.
🟢 Bullish Case
A 4H close above $80,829 would signal buyers regaining control. A reclaim of $81,232 would turn that former resistance into support and open room toward $82,392.
🔴 Bearish Case
A clean break and close below $75,847 would confirm continuation of the downtrend. That could open the door to deeper support levels as sellers gain momentum.
⚪ Neutral Case
Price may range between $75,847 and $79,000 while the market waits for a clear catalyst. Sideways action here would show the market is digesting the recent drop.
Key Levels
➤ Resistance: R1: $80,829 | R2: $82,392
➤ Support: S1: $76,000 | S2: $75,847
Context
BTC leads the market. Its direction will likely influence ETH, XRP, and DOGE in the short term.
Conclusion
Bitcoin is at a decision point. Watch how price reacts around $75.8K support and $80.8K resistance. Patience and risk management matter in volatile conditions.
This is not financial advice. Always do your own research.
◆━━━━━━━━━━━━━━━━━━
#BTC #HeYiSaysWithdrawalsExpectedtoResumeWithin42Hours #CZSaysCompensationIsinPlaceUsersAreProtected #USDCCirculationFallsAbout800MInSevenDays #ASICHasReceivedNoPredictionMarketApplications
$BTC
Under Pressure: Will $75.8K Hold?
◆━━━━━━━━━━━━━━━━━━
Market Overview
Bitcoin is trading near $77,311 on the 4H chart after a sharp sell-off from the $81K–$82K zone. Volatility spiked during the drop, and price is now trying to stabilize with small candles. The short-term trend remains bearish, with sellers still in control.
Technical Analysis
BTC was rejected at the $81,232 resistance area, which acted as a strong supply zone. The breakdown candle was large and decisive, showing real selling pressure.
Right now, price is consolidating just above $75,847, a key short-term support. The structure shows lower highs and a clean rejection from resistance. A small bounce is forming, but it hasn't flipped the trend yet.
🟢 Bullish Case
A 4H close above $80,829 would signal buyers regaining control. A reclaim of $81,232 would turn that former resistance into support and open room toward $82,392.
🔴 Bearish Case
A clean break and close below $75,847 would confirm continuation of the downtrend. That could open the door to deeper support levels as sellers gain momentum.
⚪ Neutral Case
Price may range between $75,847 and $79,000 while the market waits for a clear catalyst. Sideways action here would show the market is digesting the recent drop.
Key Levels
➤ Resistance: R1: $80,829 | R2: $82,392
➤ Support: S1: $76,000 | S2: $75,847
Context
BTC leads the market. Its direction will likely influence ETH, XRP, and DOGE in the short term.
Conclusion
Bitcoin is at a decision point. Watch how price reacts around $75.8K support and $80.8K resistance. Patience and risk management matter in volatile conditions.
This is not financial advice. Always do your own research.
◆━━━━━━━━━━━━━━━━━━
#BTC #HeYiSaysWithdrawalsExpectedtoResumeWithin42Hours #CZSaysCompensationIsinPlaceUsersAreProtected #USDCCirculationFallsAbout800MInSevenDays #ASICHasReceivedNoPredictionMarketApplications
Under Pressure: Will $75.8K Hold?
◆━━━━━━━━━━━━━━━━━━
Market Overview
Bitcoin is trading near $77,311 on the 4H chart after a sharp sell-off from the $81K–$82K zone. Volatility spiked during the drop, and price is now trying to stabilize with small candles. The short-term trend remains bearish, with sellers still in control.
Technical Analysis
BTC was rejected at the $81,232 resistance area, which acted as a strong supply zone. The breakdown candle was large and decisive, showing real selling pressure.
Right now, price is consolidating just above $75,847, a key short-term support. The structure shows lower highs and a clean rejection from resistance. A small bounce is forming, but it hasn't flipped the trend yet.
🟢 Bullish Case
A 4H close above $80,829 would signal buyers regaining control. A reclaim of $81,232 would turn that former resistance into support and open room toward $82,392.
🔴 Bearish Case
A clean break and close below $75,847 would confirm continuation of the downtrend. That could open the door to deeper support levels as sellers gain momentum.
⚪ Neutral Case
Price may range between $75,847 and $79,000 while the market waits for a clear catalyst. Sideways action here would show the market is digesting the recent drop.
Key Levels
➤ Resistance: R1: $80,829 | R2: $82,392
➤ Support: S1: $76,000 | S2: $75,847
Context
BTC leads the market. Its direction will likely influence ETH, XRP, and DOGE in the short term.
Conclusion
Bitcoin is at a decision point. Watch how price reacts around $75.8K support and $80.8K resistance. Patience and risk management matter in volatile conditions.
This is not financial advice. Always do your own research.
◆━━━━━━━━━━━━━━━━━━
#BTC #HeYiSaysWithdrawalsExpectedtoResumeWithin42Hours #CZSaysCompensationIsinPlaceUsersAreProtected #USDCCirculationFallsAbout800MInSevenDays #ASICHasReceivedNoPredictionMarketApplications
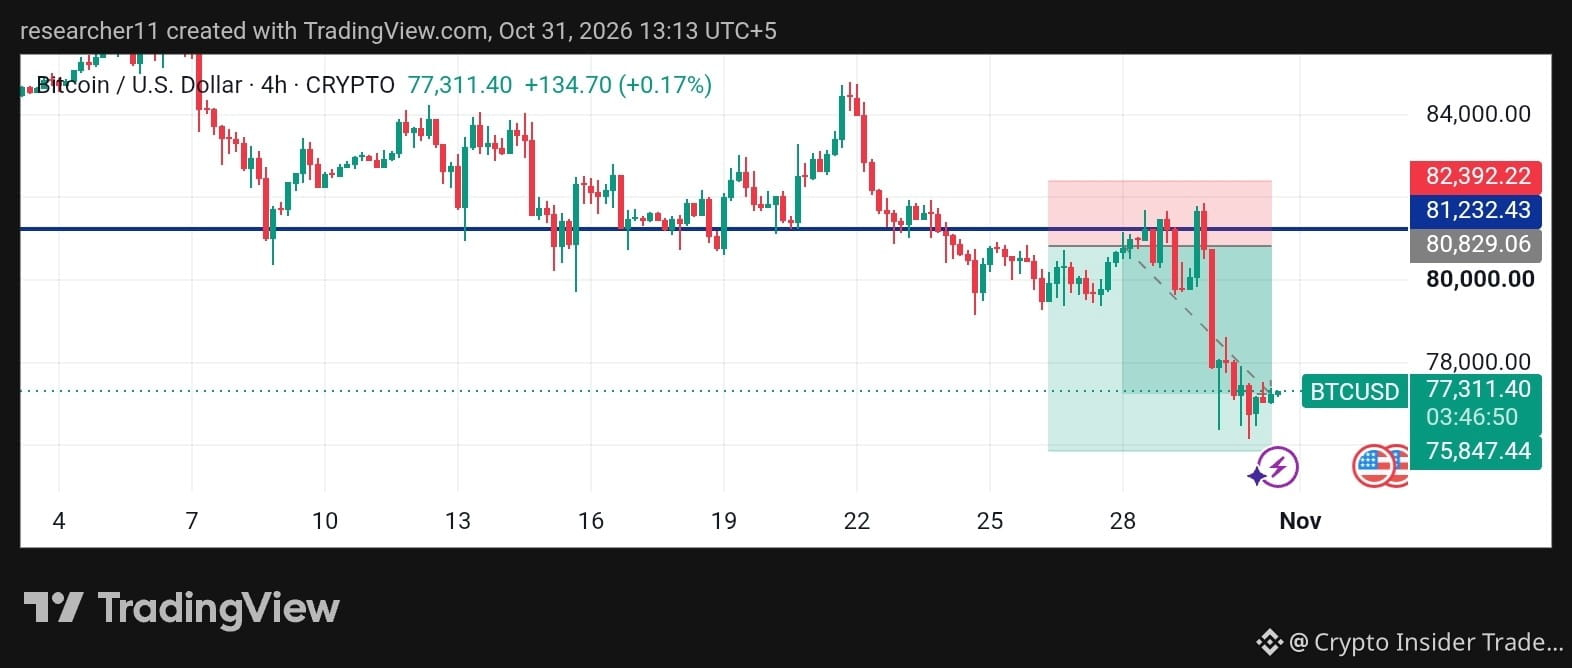
82
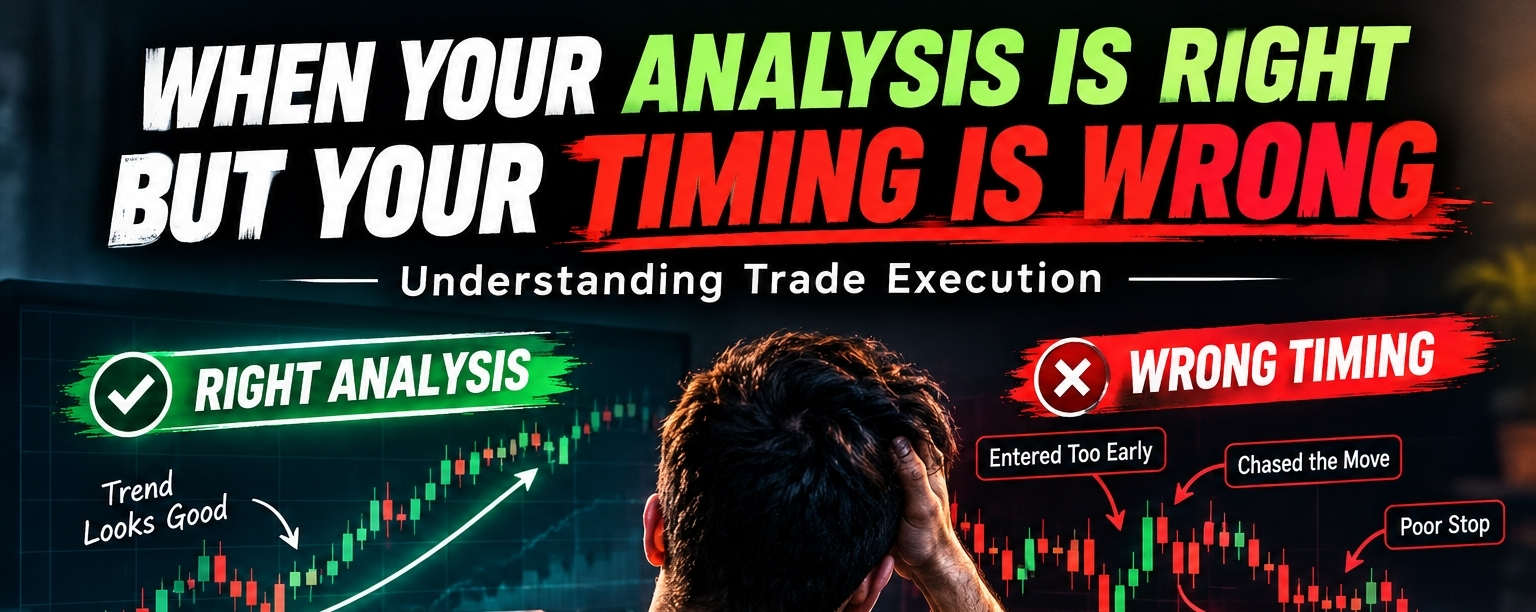
ບົດຄວາມ
When Your Analysis Is Right but Your Timing Is Wrong: Understanding Trade Execution━━━━━━━━━━━━━━━━━━━━
You called it. The level held. The trend played out exactly as you expected.
And yet… your account is red.
If that sounds familiar, you're not alone. This is one of the most frustrating experiences in trading, and one of the least discussed. Being right about the market and being right about your trade are two very different things.
Let's break down why this happens and, more importantly, how to fix it.
━━━━━━━━━━━━━━━━━━━━
◆ THE HIDDEN GAP: ANALYSIS vs EXECUTION
Analysis answers one question: **"Where might price go?"**
Execution answers a harder one: "When and how do I participate, and what happens if I'm early, late, or wrong on the path?"
Most traders spend 90% of their energy on the first question and almost none on the second. But the market doesn't pay you for being right in theory. It pays you for being right at the right size, at the right price, at the right moment.
✔︎ A correct direction with a poor entry can still lose.
✔︎ A correct idea with a stop that is too tight can still lose.
✔︎ A correct view with oversized risk can still lose.
━━━━━━━━━━━━━━━━━━━━
◆ 5 REASONS GOOD ANALYSIS STILL LOSES
① Entering too early
You see the setup forming and jump in before confirmation. Price then wanders against you, shakes you out, and finally moves in your original direction without you.
② Entering too late
The opposite problem. You wait, hesitate, then chase the move after it has already run. Your entry is now poor and your risk is bigger than planned.
③ Stops placed by emotion, not structure
A stop based on "how much I'm comfortable losing" instead of "where my idea is actually invalid" gets hit by normal market noise.
④ Position size too large
Big size makes every small pullback feel dangerous. You close early, move your stop, or panic, even when your thesis is intact.
⑤ Ignoring the path, only watching the destination
Markets rarely move in straight lines. Your target can be reached, but only after price tests your patience first. If your plan can't survive the path, the destination doesn't matter.
━━━━━━━━━━━━━━━━━━━━
◆ A SIMPLE 4-STEP EXECUTION FRAMEWORK
➤ Step 1: Define the zone, not a single price
Think in areas, not exact numbers. Markets are messy. Planning an entry zone gives you flexibility without losing discipline.
➤ Step 2: Wait for confirmation that fits your plan
Confirmation can be a reaction at a level, a structure shift, or a volume change. Choose your criteria in advance, and don't invent them in the moment.
➤ Step 3: Set invalidation first, then size
Ask: "Where is my idea clearly wrong?" Place your stop there. Then adjust your position size so that the loss, if hit, stays within your risk limit. Never do it the other way around.
➤ Step 4: Plan the exit before the entry
Know what you'll do at your target, and what you'll do if price stalls. Traders without an exit plan end up making decisions from emotion.
━━━━━━━━━━━━━━━━━━━━
◆ THE PSYCHOLOGY BEHIND BAD TIMING
Timing problems are rarely a "chart problem." They're usually a "mind problem."
➜ FOMO pushes you into early or late entries.
➜ Fear of loss makes you cut winners too soon.
➜ Ego makes you hold on or move stops because you "know" you're right.
➜ Impatience makes you take trades that don't fully meet your criteria.
Here's the uncomfortable truth: the market doesn't care how confident you are. Your edge lives in your process, not your opinion.
━━━━━━━━━━━━━━━━━━━━
◆ A QUICK EXECUTION CHECKLIST
Before every trade, ask yourself:
✔︎ Is this setup part of my written plan?
✔︎ Is my entry based on a rule, not a feeling?
✔︎ Do I know exactly where my idea is invalid?
✔︎ Is my position size within my risk limit?
✔︎ Can I accept the loss if the trade fails?
✔︎ Do I have a plan for both outcomes?
If even one answer is "no," that's your signal to pause. Skipping a trade is also a decision, and often a good one.
━━━━━━━━━━━━━━━━━━━━
◆ BUILD A REVIEW HABIT 📝
The fastest way to improve timing is to study your own trades. After each trade, record:
➤ Was my analysis correct?
➤ Was my entry well-timed?
➤ Did I follow my plan?
➤ What would I do differently?
Over time, patterns appear. Maybe you're always early. Maybe you exit too soon. You can't fix what you don't measure.
━━━━━━━━━━━━━━━━━━━━
◆ FINAL THOUGHTS
Being right about the market is only half the job. The other half is turning that insight into a well-timed, well-sized, well-managed trade.
Great traders aren't the ones who predict everything. They're the ones who execute with patience, protect their capital, and stay consistent when things don't go to plan.
Improve your execution, and your good analysis finally starts working for you.
━━━━━━━━━━━━━━━━━━━━
YOUR TURN
Which one hurts your trading most: entering too early, too late, or poor stop placement? Tell me in the comments below!
If this article helped you, share it with a fellow trader who needs to hear it.
Like and follow for more trading psychology and execution insights.
━━━━━━━━━━━━━━━━━━━━
⚠️ Risk Disclosure: This content is for educational purposes only and does not constitute financial or investment advice. Cryptocurrency trading involves significant risk, and you may lose some or all of your capital. Always do your own research and trade responsibly.
#$1.5BInLeveragedCryptoBetsLiquidated #USMidtermElections #KOSPIFalls3.53%BackBelow6000 #BinanceWillListPredictPREDICT #SwitzerlandFirstSpotBitcoinETFExpectedToTradeInNovember $BTC
{future}(BTCUSDT)
$ETH
{future}(ETHUSDT)
$XRP
{future}(XRPUSDT)
When Your Analysis Is Right but Your Timing Is Wrong: Understanding Trade Execution
━━━━━━━━━━━━━━━━━━━━
You called it. The level held. The trend played out exactly as you expected.
And yet… your account is red.
If that sounds familiar, you're not alone. This is one of the most frustrating experiences in trading, and one of the least discussed. Being right about the market and being right about your trade are two very different things.
Let's break down why this happens and, more importantly, how to fix it.
━━━━━━━━━━━━━━━━━━━━
◆ THE HIDDEN GAP: ANALYSIS vs EXECUTION
Analysis answers one question: **"Where might price go?"**
Execution answers a harder one: "When and how do I participate, and what happens if I'm early, late, or wrong on the path?"
Most traders spend 90% of their energy on the first question and almost none on the second. But the market doesn't pay you for being right in theory. It pays you for being right at the right size, at the right price, at the right moment.
✔︎ A correct direction with a poor entry can still lose.
✔︎ A correct idea with a stop that is too tight can still lose.
✔︎ A correct view with oversized risk can still lose.
━━━━━━━━━━━━━━━━━━━━
◆ 5 REASONS GOOD ANALYSIS STILL LOSES
① Entering too early
You see the setup forming and jump in before confirmation. Price then wanders against you, shakes you out, and finally moves in your original direction without you.
② Entering too late
The opposite problem. You wait, hesitate, then chase the move after it has already run. Your entry is now poor and your risk is bigger than planned.
③ Stops placed by emotion, not structure
A stop based on "how much I'm comfortable losing" instead of "where my idea is actually invalid" gets hit by normal market noise.
④ Position size too large
Big size makes every small pullback feel dangerous. You close early, move your stop, or panic, even when your thesis is intact.
⑤ Ignoring the path, only watching the destination
Markets rarely move in straight lines. Your target can be reached, but only after price tests your patience first. If your plan can't survive the path, the destination doesn't matter.
━━━━━━━━━━━━━━━━━━━━
◆ A SIMPLE 4-STEP EXECUTION FRAMEWORK
➤ Step 1: Define the zone, not a single price
Think in areas, not exact numbers. Markets are messy. Planning an entry zone gives you flexibility without losing discipline.
➤ Step 2: Wait for confirmation that fits your plan
Confirmation can be a reaction at a level, a structure shift, or a volume change. Choose your criteria in advance, and don't invent them in the moment.
➤ Step 3: Set invalidation first, then size
Ask: "Where is my idea clearly wrong?" Place your stop there. Then adjust your position size so that the loss, if hit, stays within your risk limit. Never do it the other way around.
➤ Step 4: Plan the exit before the entry
Know what you'll do at your target, and what you'll do if price stalls. Traders without an exit plan end up making decisions from emotion.
━━━━━━━━━━━━━━━━━━━━
◆ THE PSYCHOLOGY BEHIND BAD TIMING
Timing problems are rarely a "chart problem." They're usually a "mind problem."
➜ FOMO pushes you into early or late entries.
➜ Fear of loss makes you cut winners too soon.
➜ Ego makes you hold on or move stops because you "know" you're right.
➜ Impatience makes you take trades that don't fully meet your criteria.
Here's the uncomfortable truth: the market doesn't care how confident you are. Your edge lives in your process, not your opinion.
━━━━━━━━━━━━━━━━━━━━
◆ A QUICK EXECUTION CHECKLIST
Before every trade, ask yourself:
✔︎ Is this setup part of my written plan?
✔︎ Is my entry based on a rule, not a feeling?
✔︎ Do I know exactly where my idea is invalid?
✔︎ Is my position size within my risk limit?
✔︎ Can I accept the loss if the trade fails?
✔︎ Do I have a plan for both outcomes?
If even one answer is "no," that's your signal to pause. Skipping a trade is also a decision, and often a good one.
━━━━━━━━━━━━━━━━━━━━
◆ BUILD A REVIEW HABIT 📝
The fastest way to improve timing is to study your own trades. After each trade, record:
➤ Was my analysis correct?
➤ Was my entry well-timed?
➤ Did I follow my plan?
➤ What would I do differently?
Over time, patterns appear. Maybe you're always early. Maybe you exit too soon. You can't fix what you don't measure.
━━━━━━━━━━━━━━━━━━━━
◆ FINAL THOUGHTS
Being right about the market is only half the job. The other half is turning that insight into a well-timed, well-sized, well-managed trade.
Great traders aren't the ones who predict everything. They're the ones who execute with patience, protect their capital, and stay consistent when things don't go to plan.
Improve your execution, and your good analysis finally starts working for you.
━━━━━━━━━━━━━━━━━━━━
YOUR TURN
Which one hurts your trading most: entering too early, too late, or poor stop placement? Tell me in the comments below!
If this article helped you, share it with a fellow trader who needs to hear it.
Like and follow for more trading psychology and execution insights.
━━━━━━━━━━━━━━━━━━━━
⚠️ Risk Disclosure: This content is for educational purposes only and does not constitute financial or investment advice. Cryptocurrency trading involves significant risk, and you may lose some or all of your capital. Always do your own research and trade responsibly.
#$1.5BInLeveragedCryptoBetsLiquidated #USMidtermElections #KOSPIFalls3.53%BackBelow6000 #BinanceWillListPredictPREDICT #SwitzerlandFirstSpotBitcoinETFExpectedToTradeInNovember $BTC
$ETH
$XRP
You called it. The level held. The trend played out exactly as you expected.
And yet… your account is red.
If that sounds familiar, you're not alone. This is one of the most frustrating experiences in trading, and one of the least discussed. Being right about the market and being right about your trade are two very different things.
Let's break down why this happens and, more importantly, how to fix it.
━━━━━━━━━━━━━━━━━━━━
◆ THE HIDDEN GAP: ANALYSIS vs EXECUTION
Analysis answers one question: **"Where might price go?"**
Execution answers a harder one: "When and how do I participate, and what happens if I'm early, late, or wrong on the path?"
Most traders spend 90% of their energy on the first question and almost none on the second. But the market doesn't pay you for being right in theory. It pays you for being right at the right size, at the right price, at the right moment.
✔︎ A correct direction with a poor entry can still lose.
✔︎ A correct idea with a stop that is too tight can still lose.
✔︎ A correct view with oversized risk can still lose.
━━━━━━━━━━━━━━━━━━━━
◆ 5 REASONS GOOD ANALYSIS STILL LOSES
① Entering too early
You see the setup forming and jump in before confirmation. Price then wanders against you, shakes you out, and finally moves in your original direction without you.
② Entering too late
The opposite problem. You wait, hesitate, then chase the move after it has already run. Your entry is now poor and your risk is bigger than planned.
③ Stops placed by emotion, not structure
A stop based on "how much I'm comfortable losing" instead of "where my idea is actually invalid" gets hit by normal market noise.
④ Position size too large
Big size makes every small pullback feel dangerous. You close early, move your stop, or panic, even when your thesis is intact.
⑤ Ignoring the path, only watching the destination
Markets rarely move in straight lines. Your target can be reached, but only after price tests your patience first. If your plan can't survive the path, the destination doesn't matter.
━━━━━━━━━━━━━━━━━━━━
◆ A SIMPLE 4-STEP EXECUTION FRAMEWORK
➤ Step 1: Define the zone, not a single price
Think in areas, not exact numbers. Markets are messy. Planning an entry zone gives you flexibility without losing discipline.
➤ Step 2: Wait for confirmation that fits your plan
Confirmation can be a reaction at a level, a structure shift, or a volume change. Choose your criteria in advance, and don't invent them in the moment.
➤ Step 3: Set invalidation first, then size
Ask: "Where is my idea clearly wrong?" Place your stop there. Then adjust your position size so that the loss, if hit, stays within your risk limit. Never do it the other way around.
➤ Step 4: Plan the exit before the entry
Know what you'll do at your target, and what you'll do if price stalls. Traders without an exit plan end up making decisions from emotion.
━━━━━━━━━━━━━━━━━━━━
◆ THE PSYCHOLOGY BEHIND BAD TIMING
Timing problems are rarely a "chart problem." They're usually a "mind problem."
➜ FOMO pushes you into early or late entries.
➜ Fear of loss makes you cut winners too soon.
➜ Ego makes you hold on or move stops because you "know" you're right.
➜ Impatience makes you take trades that don't fully meet your criteria.
Here's the uncomfortable truth: the market doesn't care how confident you are. Your edge lives in your process, not your opinion.
━━━━━━━━━━━━━━━━━━━━
◆ A QUICK EXECUTION CHECKLIST
Before every trade, ask yourself:
✔︎ Is this setup part of my written plan?
✔︎ Is my entry based on a rule, not a feeling?
✔︎ Do I know exactly where my idea is invalid?
✔︎ Is my position size within my risk limit?
✔︎ Can I accept the loss if the trade fails?
✔︎ Do I have a plan for both outcomes?
If even one answer is "no," that's your signal to pause. Skipping a trade is also a decision, and often a good one.
━━━━━━━━━━━━━━━━━━━━
◆ BUILD A REVIEW HABIT 📝
The fastest way to improve timing is to study your own trades. After each trade, record:
➤ Was my analysis correct?
➤ Was my entry well-timed?
➤ Did I follow my plan?
➤ What would I do differently?
Over time, patterns appear. Maybe you're always early. Maybe you exit too soon. You can't fix what you don't measure.
━━━━━━━━━━━━━━━━━━━━
◆ FINAL THOUGHTS
Being right about the market is only half the job. The other half is turning that insight into a well-timed, well-sized, well-managed trade.
Great traders aren't the ones who predict everything. They're the ones who execute with patience, protect their capital, and stay consistent when things don't go to plan.
Improve your execution, and your good analysis finally starts working for you.
━━━━━━━━━━━━━━━━━━━━
YOUR TURN
Which one hurts your trading most: entering too early, too late, or poor stop placement? Tell me in the comments below!
If this article helped you, share it with a fellow trader who needs to hear it.
Like and follow for more trading psychology and execution insights.
━━━━━━━━━━━━━━━━━━━━
⚠️ Risk Disclosure: This content is for educational purposes only and does not constitute financial or investment advice. Cryptocurrency trading involves significant risk, and you may lose some or all of your capital. Always do your own research and trade responsibly.
#$1.5BInLeveragedCryptoBetsLiquidated #USMidtermElections #KOSPIFalls3.53%BackBelow6000 #BinanceWillListPredictPREDICT #SwitzerlandFirstSpotBitcoinETFExpectedToTradeInNovember $BTC
$ETH
$XRP
4
237
$TSLA
{future}(TSLAUSDT)
Breakout Above 383: Momentum in Focus
Market Overview
Tesla (TSLA) is trading at 403.34 on the 4H chart, nearly flat on the day. After a sharp rally in late October, price is now consolidating near highs. The move showed strong momentum, and the market is now deciding whether to continue or pause.
━━━━━━━━━━━━━━━
Technical Analysis
TSLA broke above the 383 resistance zone, which had capped price several times in September and October. That level now acts as the first major support. A second support band sits at 369–372.
Price is hovering around the 400 psychological level, with 420.38 as the next upside objective. Small candles after the surge suggest consolidation, which is typical after an impulsive move. Pre-market near 394.58 shows a slight dip, so a retest of lower levels is possible.
A healthy breakout usually holds former resistance as support, so watch the 383 area closely.
━━━━━━━━━━━━━━━
Scenario Analysis
🟢 Bullish Case: Price holds above 400 or retests 383 and bounces, with a push toward 420.38.
🔴 Bearish Case: A 4H close below 383.23 would signal a failed breakout and open 371.83 and 369.06.
⚪ Neutral Case: Sideways action between 395 and 410 would suggest the market is digesting the rally.
━━━━━━━━━━━━━━━
Key Levels
🔺 Resistance: R1 400.00 | R2 420.38
🔻 Support: S1 383.23 | S2 369.06
━━━━━━━━━━━━━━━
Conclusion
TSLA is in a strong bullish structure but is extended after the rally. Watch whether 383 holds on any pullback and whether volume supports continuation.
This is market analysis, not financial advice. Always do your own research.
#TSLA #KOSPIFalls3.53%BackBelow6000 #AmazonSharesFallAbout7%InPremarketTrading #USMidtermElections #TwoAddressesHoldingAbout1.28BUSDTFrozen
$TSLA
Breakout Above 383: Momentum in Focus
Market Overview
Tesla (TSLA) is trading at 403.34 on the 4H chart, nearly flat on the day. After a sharp rally in late October, price is now consolidating near highs. The move showed strong momentum, and the market is now deciding whether to continue or pause.
━━━━━━━━━━━━━━━
Technical Analysis
TSLA broke above the 383 resistance zone, which had capped price several times in September and October. That level now acts as the first major support. A second support band sits at 369–372.
Price is hovering around the 400 psychological level, with 420.38 as the next upside objective. Small candles after the surge suggest consolidation, which is typical after an impulsive move. Pre-market near 394.58 shows a slight dip, so a retest of lower levels is possible.
A healthy breakout usually holds former resistance as support, so watch the 383 area closely.
━━━━━━━━━━━━━━━
Scenario Analysis
🟢 Bullish Case: Price holds above 400 or retests 383 and bounces, with a push toward 420.38.
🔴 Bearish Case: A 4H close below 383.23 would signal a failed breakout and open 371.83 and 369.06.
⚪ Neutral Case: Sideways action between 395 and 410 would suggest the market is digesting the rally.
━━━━━━━━━━━━━━━
Key Levels
🔺 Resistance: R1 400.00 | R2 420.38
🔻 Support: S1 383.23 | S2 369.06
━━━━━━━━━━━━━━━
Conclusion
TSLA is in a strong bullish structure but is extended after the rally. Watch whether 383 holds on any pullback and whether volume supports continuation.
This is market analysis, not financial advice. Always do your own research.
#TSLA #KOSPIFalls3.53%BackBelow6000 #AmazonSharesFallAbout7%InPremarketTrading #USMidtermElections #TwoAddressesHoldingAbout1.28BUSDTFrozen
Breakout Above 383: Momentum in Focus
Market Overview
Tesla (TSLA) is trading at 403.34 on the 4H chart, nearly flat on the day. After a sharp rally in late October, price is now consolidating near highs. The move showed strong momentum, and the market is now deciding whether to continue or pause.
━━━━━━━━━━━━━━━
Technical Analysis
TSLA broke above the 383 resistance zone, which had capped price several times in September and October. That level now acts as the first major support. A second support band sits at 369–372.
Price is hovering around the 400 psychological level, with 420.38 as the next upside objective. Small candles after the surge suggest consolidation, which is typical after an impulsive move. Pre-market near 394.58 shows a slight dip, so a retest of lower levels is possible.
A healthy breakout usually holds former resistance as support, so watch the 383 area closely.
━━━━━━━━━━━━━━━
Scenario Analysis
🟢 Bullish Case: Price holds above 400 or retests 383 and bounces, with a push toward 420.38.
🔴 Bearish Case: A 4H close below 383.23 would signal a failed breakout and open 371.83 and 369.06.
⚪ Neutral Case: Sideways action between 395 and 410 would suggest the market is digesting the rally.
━━━━━━━━━━━━━━━
Key Levels
🔺 Resistance: R1 400.00 | R2 420.38
🔻 Support: S1 383.23 | S2 369.06
━━━━━━━━━━━━━━━
Conclusion
TSLA is in a strong bullish structure but is extended after the rally. Watch whether 383 holds on any pullback and whether volume supports continuation.
This is market analysis, not financial advice. Always do your own research.
#TSLA #KOSPIFalls3.53%BackBelow6000 #AmazonSharesFallAbout7%InPremarketTrading #USMidtermElections #TwoAddressesHoldingAbout1.28BUSDTFrozen
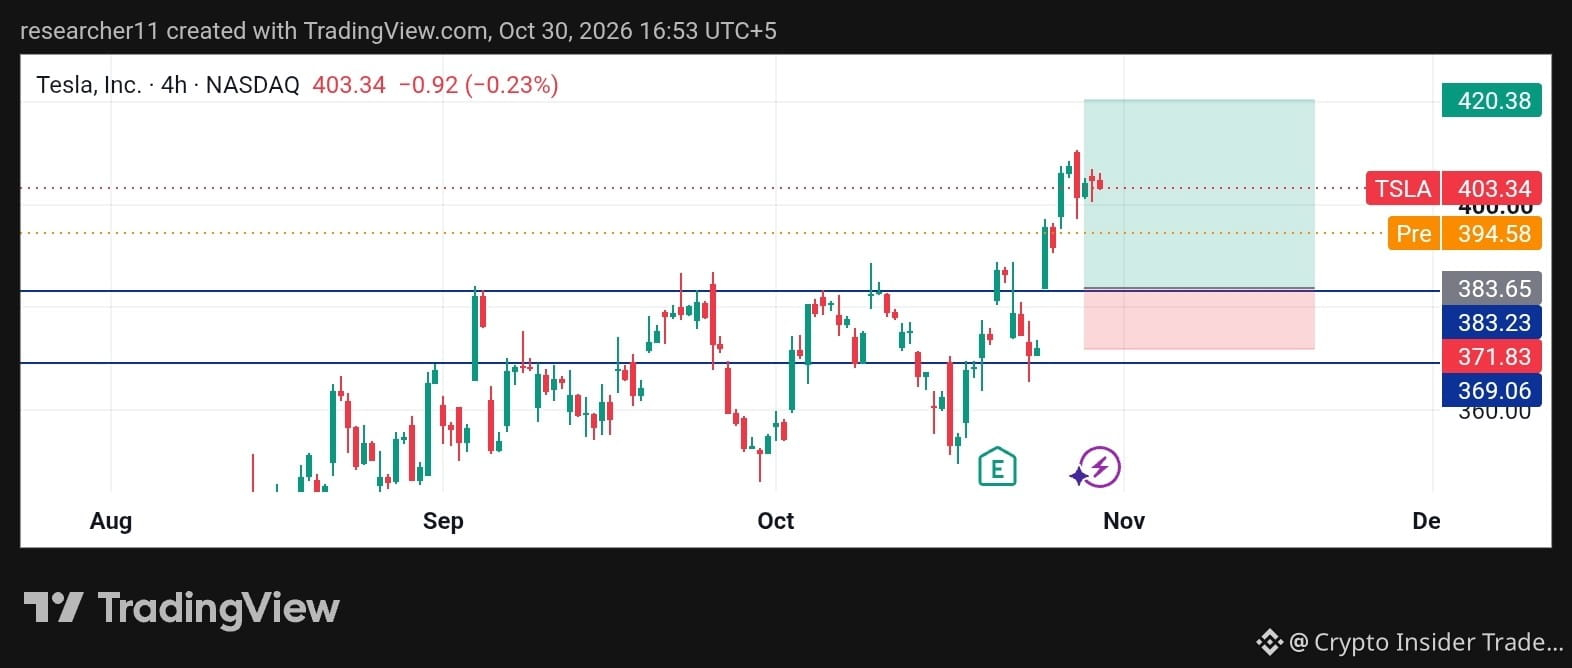
318
$AMZN
{future}(AMZNUSDT)
Slides 4%: Resistance Now in Control
Market Overview
Amazon (AMZN) is trading near 244.16 on the 4H chart, down about 4.25% in a sharp move. After failing to hold gains in late October, sellers pushed price below the range that had contained trading for weeks, and volatility has picked up.
━━━━━━━━━━━━━━━
Technical Analysis
The 248–249 zone, which previously acted as support, has flipped into resistance. Price is now trading below it, a bearish sign. A pullback to retest this area before any further move down would be a common pattern.
Immediate support sits at 240, then the larger 228.59 level. Pre-market near 227.43 shows downside pressure remains in play. Above, 255.71 marks the level that would invalidate the bearish structure.
Strong selling candles on the drop suggest sellers are active, but a quick recovery above 249 would challenge that view.
━━━━━━━━━━━━━━━
Scenario Analysis
🔴 Bearish Case: Price retests 248.47–249.07, gets rejected, and moves back toward 240 and 228.59.
🟢 Bullish Case: A 4H close above 249.07 would reclaim lost ground, with 255.71 as the next test.
⚪ Neutral Case: Price ranging between 240 and 248 would signal indecision.
━━━━━━━━━━━━━━━
Key Levels
🔺 Resistance: R1 248.47 | R2 255.71
🔻 Support: S1 240.00 | S2 228.59
━━━━━━━━━━━━━━━
Conclusion
AMZN is under pressure, but the key is how price behaves at the 248–249 retest. Rejection there strengthens the bearish case, while a reclaim shifts momentum back to buyers.
This is market analysis, not financial advice. Always do your own research.
#AMZNB
#KOSPIFalls3.53%BackBelow6000 #AmazonSharesFallAbout7%InPremarketTrading #USMidtermElections #TwoAddressesHoldingAbout1.28BUSDTFrozen
$AMZN
Slides 4%: Resistance Now in Control
Market Overview
Amazon (AMZN) is trading near 244.16 on the 4H chart, down about 4.25% in a sharp move. After failing to hold gains in late October, sellers pushed price below the range that had contained trading for weeks, and volatility has picked up.
━━━━━━━━━━━━━━━
Technical Analysis
The 248–249 zone, which previously acted as support, has flipped into resistance. Price is now trading below it, a bearish sign. A pullback to retest this area before any further move down would be a common pattern.
Immediate support sits at 240, then the larger 228.59 level. Pre-market near 227.43 shows downside pressure remains in play. Above, 255.71 marks the level that would invalidate the bearish structure.
Strong selling candles on the drop suggest sellers are active, but a quick recovery above 249 would challenge that view.
━━━━━━━━━━━━━━━
Scenario Analysis
🔴 Bearish Case: Price retests 248.47–249.07, gets rejected, and moves back toward 240 and 228.59.
🟢 Bullish Case: A 4H close above 249.07 would reclaim lost ground, with 255.71 as the next test.
⚪ Neutral Case: Price ranging between 240 and 248 would signal indecision.
━━━━━━━━━━━━━━━
Key Levels
🔺 Resistance: R1 248.47 | R2 255.71
🔻 Support: S1 240.00 | S2 228.59
━━━━━━━━━━━━━━━
Conclusion
AMZN is under pressure, but the key is how price behaves at the 248–249 retest. Rejection there strengthens the bearish case, while a reclaim shifts momentum back to buyers.
This is market analysis, not financial advice. Always do your own research.
#AMZNB
#KOSPIFalls3.53%BackBelow6000 #AmazonSharesFallAbout7%InPremarketTrading #USMidtermElections #TwoAddressesHoldingAbout1.28BUSDTFrozen
Slides 4%: Resistance Now in Control
Market Overview
Amazon (AMZN) is trading near 244.16 on the 4H chart, down about 4.25% in a sharp move. After failing to hold gains in late October, sellers pushed price below the range that had contained trading for weeks, and volatility has picked up.
━━━━━━━━━━━━━━━
Technical Analysis
The 248–249 zone, which previously acted as support, has flipped into resistance. Price is now trading below it, a bearish sign. A pullback to retest this area before any further move down would be a common pattern.
Immediate support sits at 240, then the larger 228.59 level. Pre-market near 227.43 shows downside pressure remains in play. Above, 255.71 marks the level that would invalidate the bearish structure.
Strong selling candles on the drop suggest sellers are active, but a quick recovery above 249 would challenge that view.
━━━━━━━━━━━━━━━
Scenario Analysis
🔴 Bearish Case: Price retests 248.47–249.07, gets rejected, and moves back toward 240 and 228.59.
🟢 Bullish Case: A 4H close above 249.07 would reclaim lost ground, with 255.71 as the next test.
⚪ Neutral Case: Price ranging between 240 and 248 would signal indecision.
━━━━━━━━━━━━━━━
Key Levels
🔺 Resistance: R1 248.47 | R2 255.71
🔻 Support: S1 240.00 | S2 228.59
━━━━━━━━━━━━━━━
Conclusion
AMZN is under pressure, but the key is how price behaves at the 248–249 retest. Rejection there strengthens the bearish case, while a reclaim shifts momentum back to buyers.
This is market analysis, not financial advice. Always do your own research.
#AMZNB
#KOSPIFalls3.53%BackBelow6000 #AmazonSharesFallAbout7%InPremarketTrading #USMidtermElections #TwoAddressesHoldingAbout1.28BUSDTFrozen
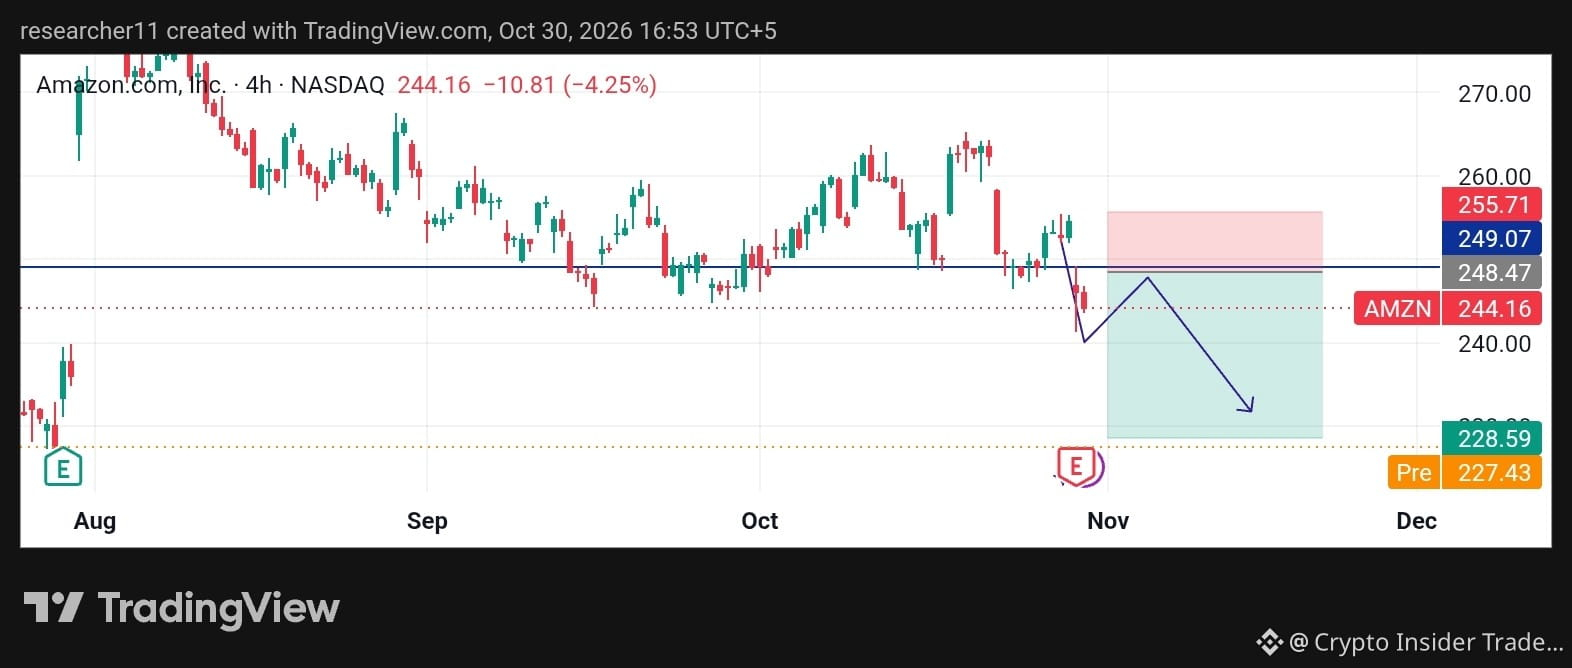
64
$AAPL
{future}(AAPLUSDT)
Climbing Higher: Is a Retest Coming?
Market Overview
Apple (AAPL) is trading at 348.93 on the 4H chart, up about 1.48%. Since early October, price has built a steady uptrend with higher highs and higher lows, and momentum has stayed constructive.
━━━━━━━━━━━━━━━
Technical Analysis
The chart shows a zigzag climb, with each pullback holding above the previous swing low. That is a classic sign of buyers stepping in on dips. Price is now trading above the 342–343 zone, which acted as resistance earlier and now looks like support.
The nearby 348.47 level is the first line of defense. Below it, 342.94 and the 335.75–339.91 band mark deeper support from earlier consolidation. On the upside, 360 is the psychological barrier, with 364.57 as the next projected objective.
A healthy pullback toward 348 before another push higher would fit the current structure.
━━━━━━━━━━━━━━━
Scenario Analysis
🟢 Bullish Case: Price holds above 348.47 and breaks 360 with strong momentum, opening room toward 364.57.
🔴 Bearish Case: A 4H close below 342.94 would weaken the structure and shift focus to 339.91 and 335.75.
⚪ Neutral Case: Sideways movement between 348 and 360 would suggest consolidation.
━━━━━━━━━━━━━━━
Key Levels
🔺 Resistance: R1 360.00 | R2 364.57
🔻 Support: S1 348.47 | S2 342.94
━━━━━━━━━━━━━━━
Conclusion
AAPL remains in a constructive trend. Watch the 348 area for signs of buyer strength and look for volume confirmation on any breakout.
This is market analysis, not financial advice. Always do your own research.
#AAPL #KOSPIFalls3.53%BackBelow6000 #AmazonSharesFallAbout7%InPremarketTrading #USMidtermElections #BinanceWillListPredictPREDICT
$AAPL
Climbing Higher: Is a Retest Coming?
Market Overview
Apple (AAPL) is trading at 348.93 on the 4H chart, up about 1.48%. Since early October, price has built a steady uptrend with higher highs and higher lows, and momentum has stayed constructive.
━━━━━━━━━━━━━━━
Technical Analysis
The chart shows a zigzag climb, with each pullback holding above the previous swing low. That is a classic sign of buyers stepping in on dips. Price is now trading above the 342–343 zone, which acted as resistance earlier and now looks like support.
The nearby 348.47 level is the first line of defense. Below it, 342.94 and the 335.75–339.91 band mark deeper support from earlier consolidation. On the upside, 360 is the psychological barrier, with 364.57 as the next projected objective.
A healthy pullback toward 348 before another push higher would fit the current structure.
━━━━━━━━━━━━━━━
Scenario Analysis
🟢 Bullish Case: Price holds above 348.47 and breaks 360 with strong momentum, opening room toward 364.57.
🔴 Bearish Case: A 4H close below 342.94 would weaken the structure and shift focus to 339.91 and 335.75.
⚪ Neutral Case: Sideways movement between 348 and 360 would suggest consolidation.
━━━━━━━━━━━━━━━
Key Levels
🔺 Resistance: R1 360.00 | R2 364.57
🔻 Support: S1 348.47 | S2 342.94
━━━━━━━━━━━━━━━
Conclusion
AAPL remains in a constructive trend. Watch the 348 area for signs of buyer strength and look for volume confirmation on any breakout.
This is market analysis, not financial advice. Always do your own research.
#AAPL #KOSPIFalls3.53%BackBelow6000 #AmazonSharesFallAbout7%InPremarketTrading #USMidtermElections #BinanceWillListPredictPREDICT
Climbing Higher: Is a Retest Coming?
Market Overview
Apple (AAPL) is trading at 348.93 on the 4H chart, up about 1.48%. Since early October, price has built a steady uptrend with higher highs and higher lows, and momentum has stayed constructive.
━━━━━━━━━━━━━━━
Technical Analysis
The chart shows a zigzag climb, with each pullback holding above the previous swing low. That is a classic sign of buyers stepping in on dips. Price is now trading above the 342–343 zone, which acted as resistance earlier and now looks like support.
The nearby 348.47 level is the first line of defense. Below it, 342.94 and the 335.75–339.91 band mark deeper support from earlier consolidation. On the upside, 360 is the psychological barrier, with 364.57 as the next projected objective.
A healthy pullback toward 348 before another push higher would fit the current structure.
━━━━━━━━━━━━━━━
Scenario Analysis
🟢 Bullish Case: Price holds above 348.47 and breaks 360 with strong momentum, opening room toward 364.57.
🔴 Bearish Case: A 4H close below 342.94 would weaken the structure and shift focus to 339.91 and 335.75.
⚪ Neutral Case: Sideways movement between 348 and 360 would suggest consolidation.
━━━━━━━━━━━━━━━
Key Levels
🔺 Resistance: R1 360.00 | R2 364.57
🔻 Support: S1 348.47 | S2 342.94
━━━━━━━━━━━━━━━
Conclusion
AAPL remains in a constructive trend. Watch the 348 area for signs of buyer strength and look for volume confirmation on any breakout.
This is market analysis, not financial advice. Always do your own research.
#AAPL #KOSPIFalls3.53%BackBelow6000 #AmazonSharesFallAbout7%InPremarketTrading #USMidtermElections #BinanceWillListPredictPREDICT
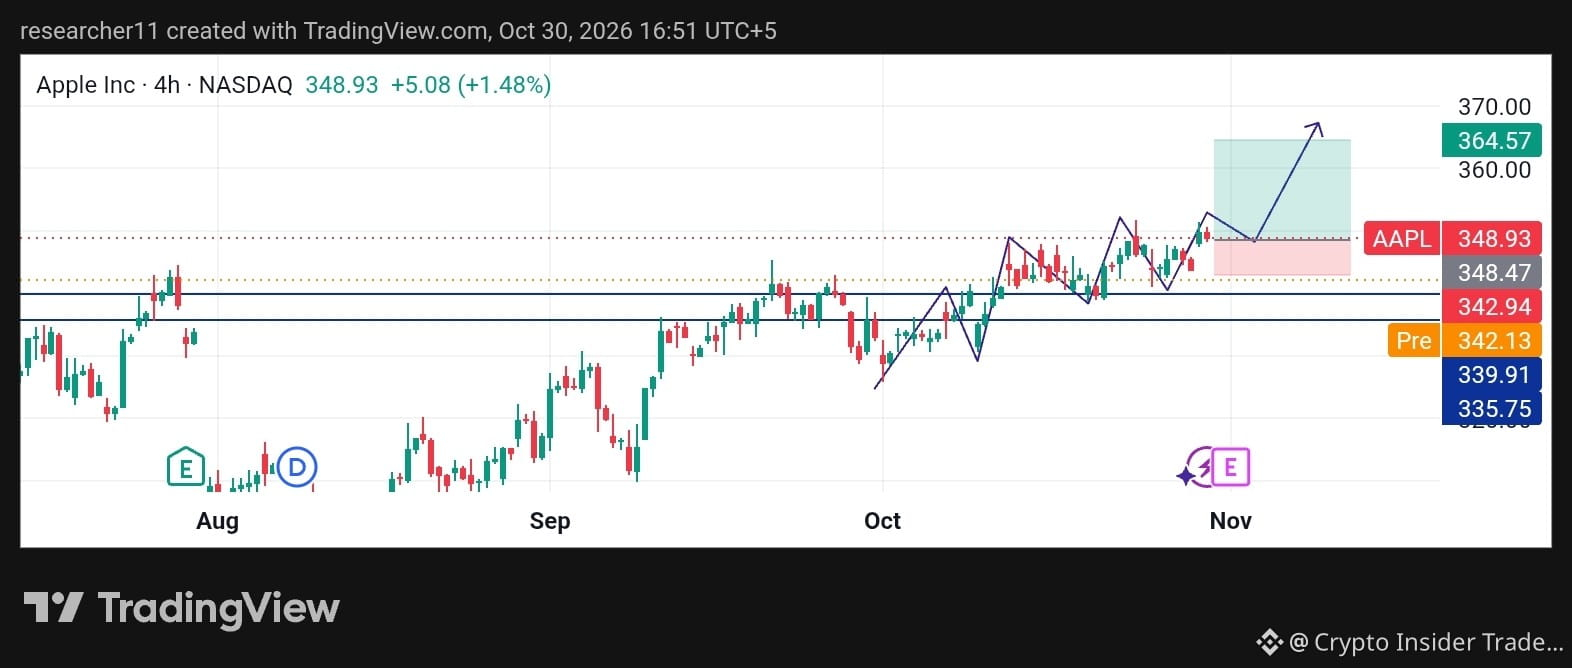
262
ເຂົ້າສູ່ລະບົບເພື່ອສຳຫຼວດເນື້ອຫາເພີ່ມເຕີມ
ເຂົ້າຮ່ວມກຸ່ມຜູ້ໃຊ້ຄຣິບໂຕທົ່ວໂລກໃນ Binance Square.
⚡️ ໄດ້ຮັບຂໍ້ມູນຫຼ້າສຸດ ແລະ ທີ່ມີປະໂຫຍດກ່ຽວກັບຄຣິບໂຕ.
💬 ໄດ້ຮັບຄວາມໄວ້ວາງໃຈຈາກຕະຫຼາດແລກປ່ຽນຄຣິບໂຕທີ່ໃຫຍ່ທີ່ສຸດໃນໂລກ.
👍 ຄົ້ນຫາຂໍ້ມູນເຊີງເລິກທີ່ແທ້ຈາກນັກສ້າງທີ່ໄດ້ຮັບການຢືນຢັນ.
ອີເມວ / ເບີໂທລະສັບ
ຫົວຂໍ້ທີ່ກໍາລັງນິຍົມ
BTCRebounds80K
62,485 ຄັ້ງທີ່ເບິ່ງ
691 ກຳລັງສົນທະນາ
BITCOIN UPDATE I’M STILL BEARISH, AND HERE’S WHY! 🚨⚠️
As you all witnessed, BTC bounced back from the $75,700 area and touched $81K. First, the market trapped long traders, and then it trapped short traders.
I’m still bearish. First of all, as everyone knows, Democrats won today’s US midterm elections, and in my view, this outcome is bearish for the market.
The market can remain volatile in the short term and trap as many traders as it wants, but that doesn’t change the overall market outlook.
There are several important upcoming events, including US Non Farm Payrolls (November 6), US CPI Inflation (November 10), US PPI (November 13), US Retail Sales (November 17), FOMC Meeting Minutes (November 18), US PCE Inflation (November 25), Federal Reserve interest rate expectations, the US Dollar Index (DXY), Treasury Yields, Nasdaq performance, Bitcoin ETF flows, and ongoing( Iran ) Israel geopolitical developments. All of these could have a significant impact on Bitcoin and the overall crypto market.
But don’t get too carried away by Bitcoin’s recent movement. Technically speaking, there hasn’t been any major bullish move yet. Yesterday, BTC was trading between $80K and $82K, and even today, it’s still around the same range.
If you want to turn bullish, that’s entirely your choice.
In my previous post, I clearly explained that BTC had technical support in the $75K / $76K zone, and the price bounced from that support and made its way back towards $80K. But this wasn’t something I had failed to mention before. In fact, I repeatedly mentioned in my posts that BTC could move towards $80K, $81K, or even $82K.
Despite that, I’m still bearish.
And I don’t have just one reason to support my bearish outlook. I have several reasons, which I’ve already explained in my previous posts.
For now, I’ll continue to wait for BTC to drop below $74K, which I believe could happen very soon. In my view, such a correction is also necessary for the market.
Anyone looking for crypto guidance just let me know.
#BTCRebounds80K
Strategic Adviser
·29 ຖືກໃຈ
·30.5k ຄັ້ງທີ່ເບິ່ງ
Binance98PercentReplenished
39,086 ຄັ້ງທີ່ເບິ່ງ
545 ກຳລັງສົນທະນາ
USMidterms-WhatAreMarketsExpecting?
341,936 ຄັ້ງທີ່ເບິ່ງ
2,048 ກຳລັງສົນທະນາ