

Ab_CryptoTrading
5.3k ໂພສ

Ab_CryptoTrading
 Square Verified+
ລາຍງານ
ບລັອກຜູ້ໃຊ້
Opportunity Creator🔮 || Full Time Crypto Trader💰 || Free Daily Trades ✅ || Web 3 👨💻 ||Promoter 💎 || Day Trader 📊 || UID 21517050
ເປີດການຊື້ຂາຍ
ຜູ້ຊື້ຂາຍຊົ່ວຄາວ
8.8 ປີ
7.3K+ ກໍາລັງຕິດຕາມ
32.5K+ ຜູ້ຕິດຕາມ
27.6K+ Liked
ໂພສ
Portfolio
ທັງໝົດ
ວົງຢືມ
ວີດີໂອ
ຖ່າຍທອດສົດ
ປັກໝຸດ
ຢືນຢັນແລ້ວ
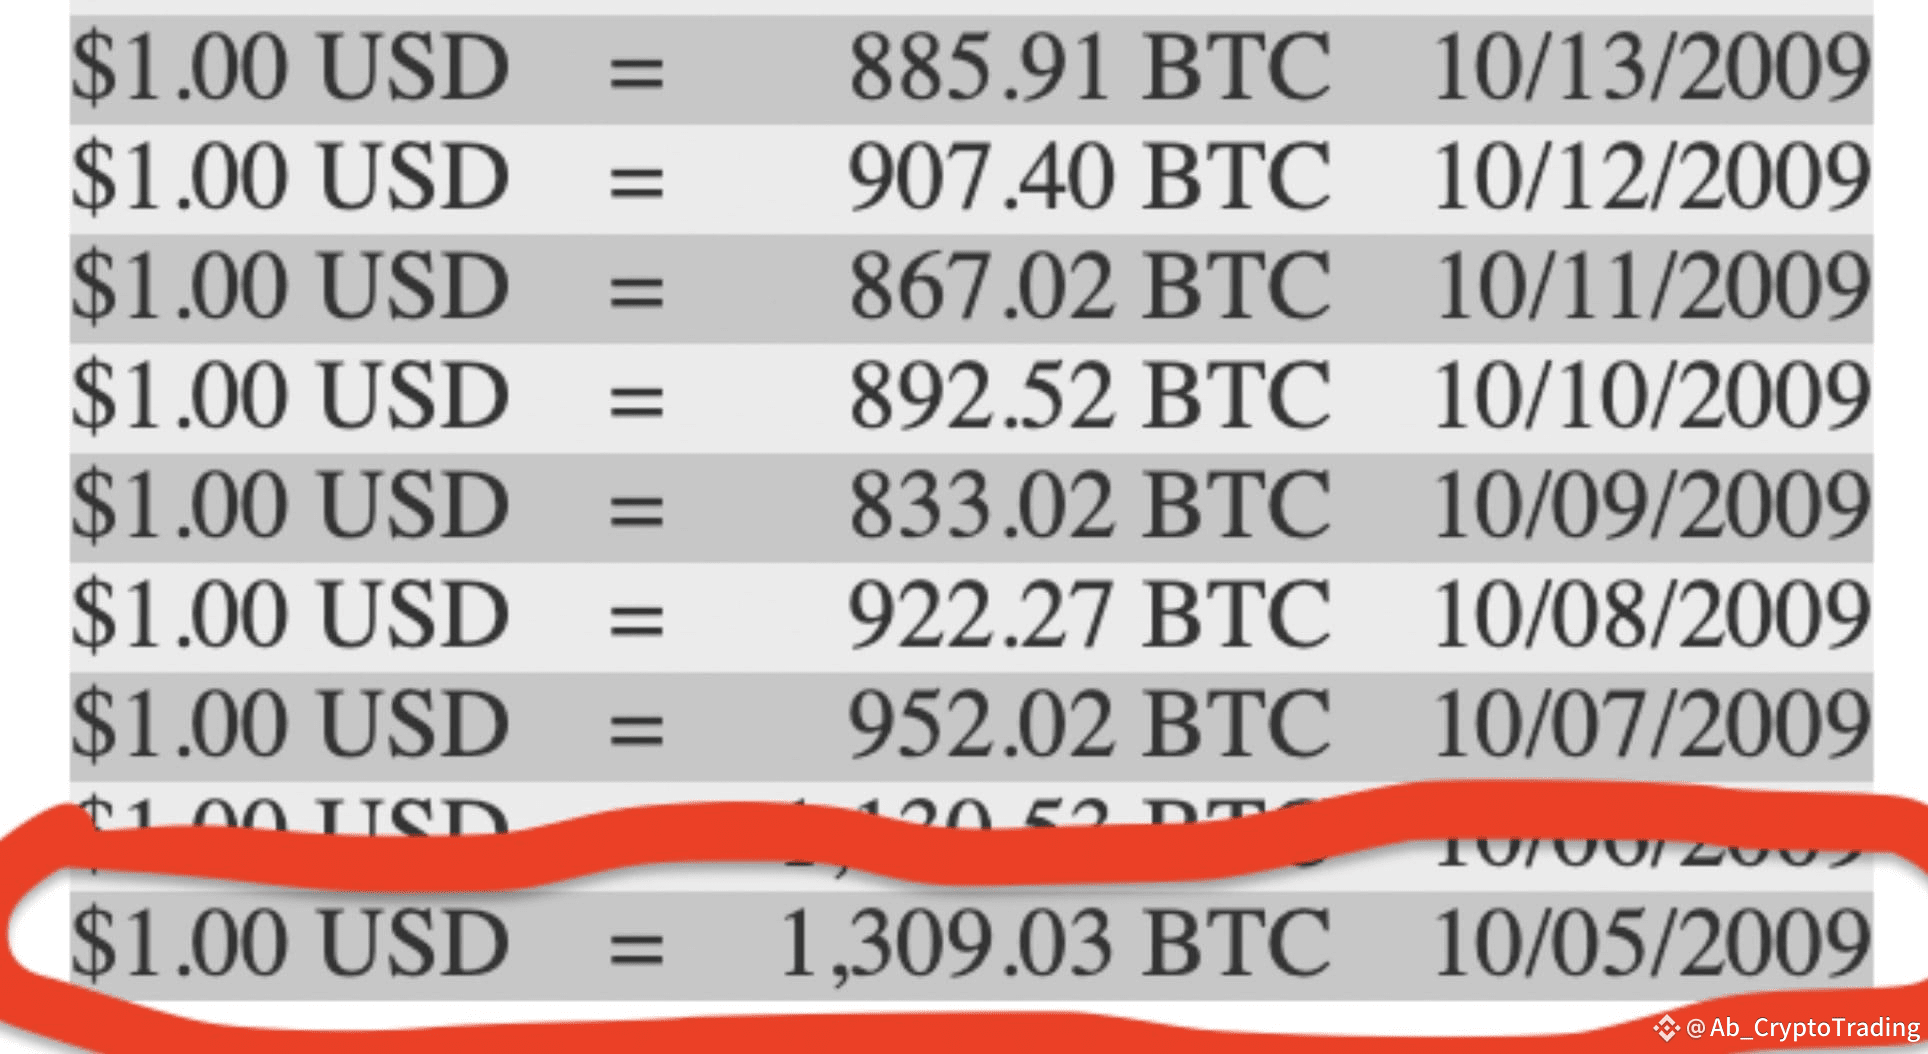
16 years ago, You could buy 1,309 #Bitcoin for $1
$1 = 1,309 BTC 🤯 $BTC
$USDT 1
#BTC 1,309
#BTCReclaims120K
#BNBBreaksATH
#Write2Earn
16 years ago, You could buy 1,309 #Bitcoin for $1
$1 = 1,309 BTC 🤯 $BTC
$USDT 1
#BTC 1,309
#BTCReclaims120K
#BNBBreaksATH
#Write2Earn
$1 = 1,309 BTC 🤯 $BTC
$USDT 1
#BTC 1,309
#BTCReclaims120K
#BNBBreaksATH
#Write2Earn
364
257
859
141.7k
ປັກໝຸດ
Everyone here is excited.
Why?
$80K $BTC on a Sunday.
But if you’re smart,
You know what this signals.
Let me break it down:
Next week is primed to be EVEN MORE bullish.
Why?
Weekends are typically low-volume,
Low-interest,
And often where pullbacks show up.
But the fact that we’re pushing this high on a weekend???
It’s a signal that buyers are piling in.
Now imagine what happens when the weekday volume kicks in.
When the big players return,
With more eyes on the charts and more liquidity flowing in.
This isn’t just a run-up;
It’s the setup for something much bigger.
Watch closely,
This is how breakouts become parabolic moves.$BTC #BTCBreaks80KATH #BIOProtocol #FedRateStrategy #EthereumRally #Write2Earn!
Why?
$80K $BTC on a Sunday.
But if you’re smart,
You know what this signals.
Let me break it down:
Next week is primed to be EVEN MORE bullish.
Why?
Weekends are typically low-volume,
Low-interest,
And often where pullbacks show up.
But the fact that we’re pushing this high on a weekend???
It’s a signal that buyers are piling in.
Now imagine what happens when the weekday volume kicks in.
When the big players return,
With more eyes on the charts and more liquidity flowing in.
This isn’t just a run-up;
It’s the setup for something much bigger.
Watch closely,
This is how breakouts become parabolic moves.$BTC #BTCBreaks80KATH #BIOProtocol #FedRateStrategy #EthereumRally #Write2Earn!
116
35
599
348.6k
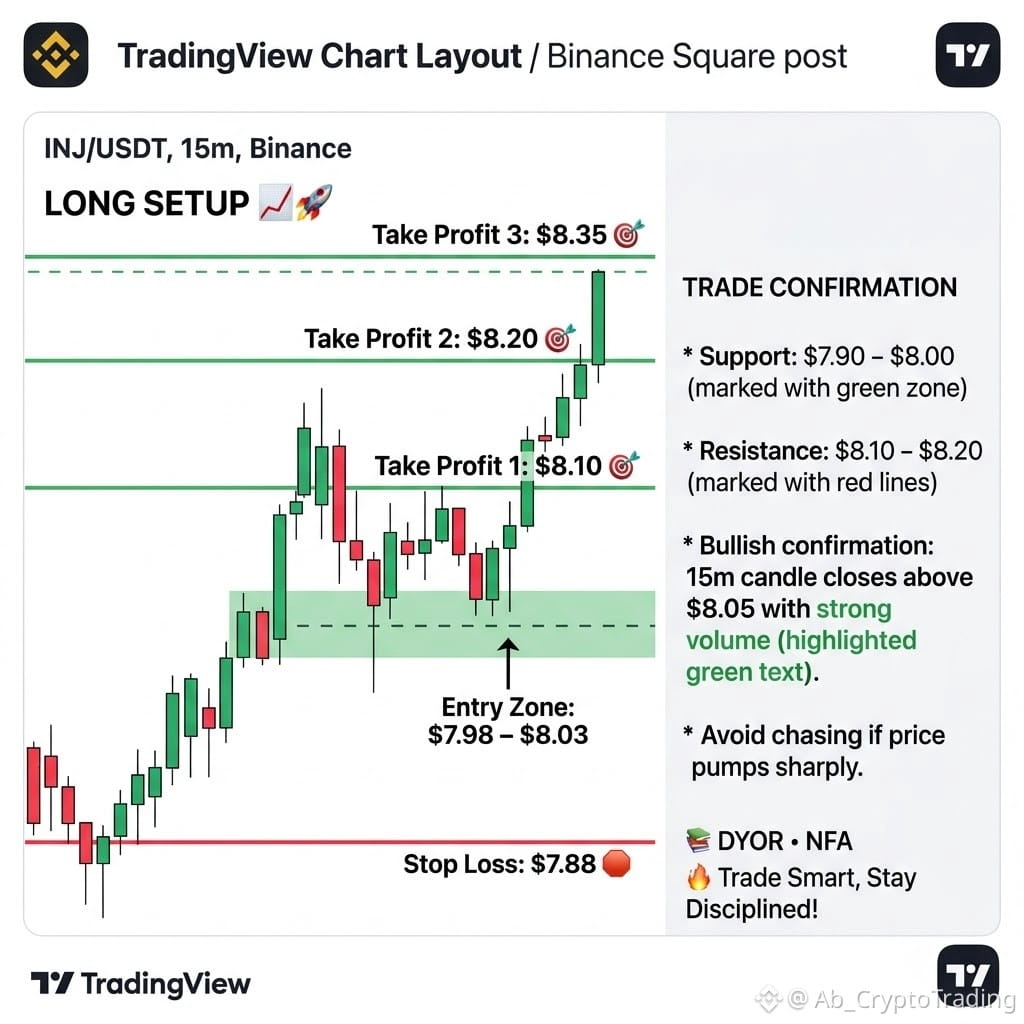
🟢 $INJ /USDT — LONG SETUP 📈🚀
💰 Entry Zone: $7.98 – $8.03
🎯 Take Profit 1: $8.10 🎯 Take Profit 2: $8.20 🎯 Take Profit 3: $8.35
🛑 Stop Loss: $7.88
l
📊 Trade Confirmation
* Support: $7.90 – $8.00
* Resistance: $8.10 – $8.20
* Bullish confirmation: 15m candle closes above $8.05 with strong volume.
* Avoid chasing if price pumps sharply.
📚 DYOR • NFA 🔥 Trade Smart, Stay Disciplined!
#FOMCWatch #FOMCWatch #CanGoogleDefindItsCore #CanMicrosoftDeliverOnAI #EarningsSeason
1
54
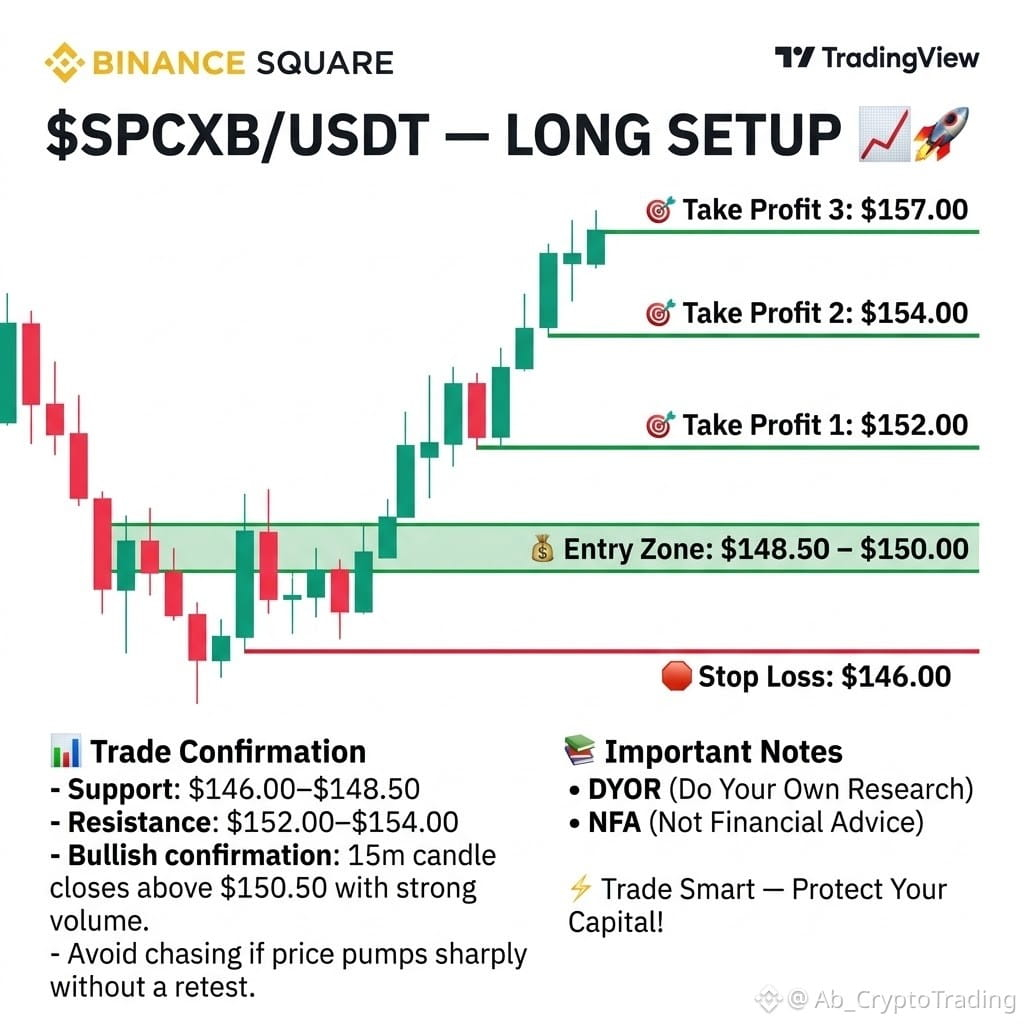
🟢 $SPCXB /USDT — LONG SETUP 📈🚀
💰 Entry Zone: $148.50 – $150.00
🎯 Take Profit 1: $152.00 🎯 Take Profit 2: $154.00 🎯 Take Profit 3: $157.00
🛑 Stop Loss: $146.00
📊 Trade Confirmation
Support: $146.00–$148.50
Resistance: $152.00–$154.00
Bullish confirmation: 15m candle closes above $150.50 with strong volume.
Avoid chasing if price pumps sharply without a retest.
📚 DYOR • NFA ⚡ Trade Smart — Protect Your Capital!
#CanMicrosoftDeliverOnAI #CanGoogleDefindItsCore #FOMCWatch #SouthKoreaConsidersEducationTaxOnCryptoExchanges #Write2Earn
1
63
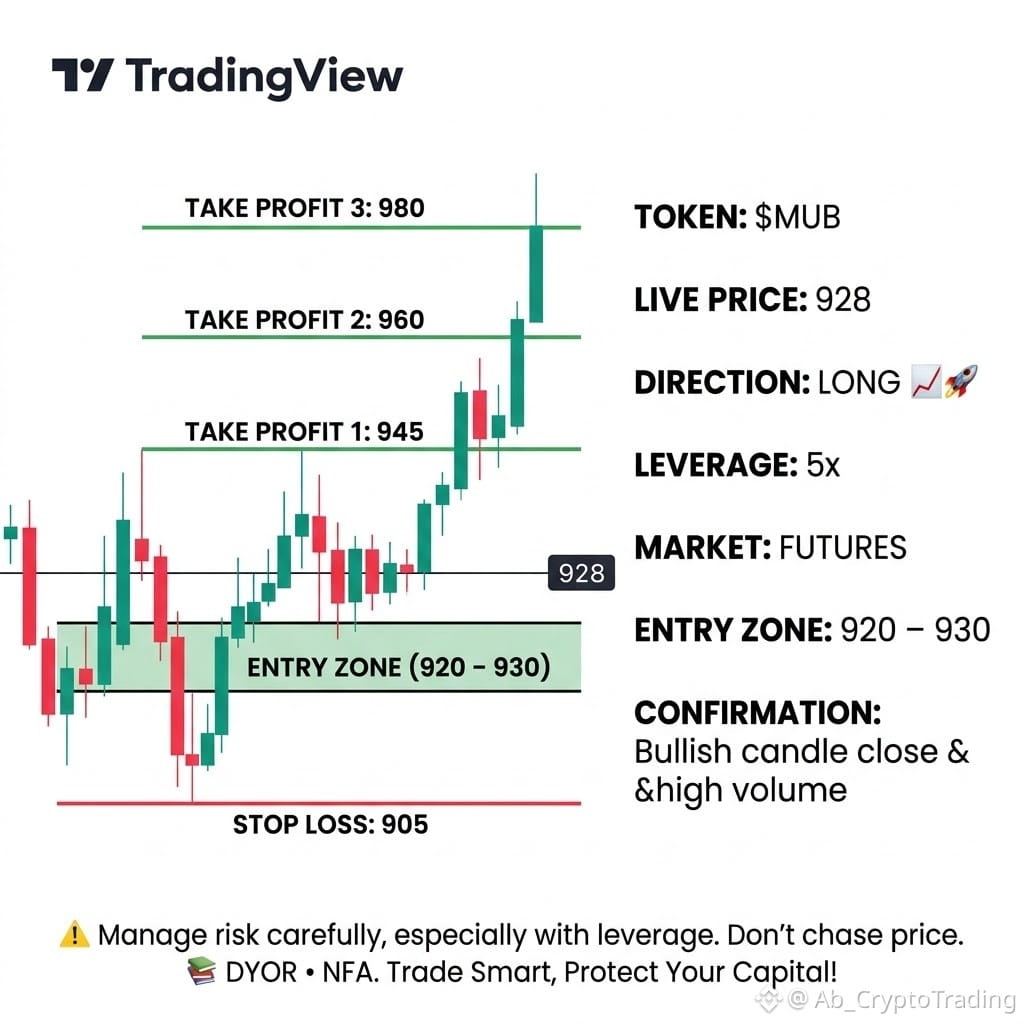
🟢 $MUB /USDT — LONG SETUP 📈🚀
💰 Entry Zone: 920 – 930
🎯 1 Take Profit 945 🎯 2 Take Profit 960 🎯 3 Take Profit 980
🛑 Stop Loss: 905
📊 Confirmation: Look for a bullish candle close and strong buying volume before entering.
⚠️ Don't chase the price. Wait for confirmation and manage risk carefully, especially when using leverage.
📚 DYOR • NFA 🔥 Trade Smart, Protect Your Capital!
#MUB #CanMicrosoftDeliverOnAI #CanGoogleDefindItsCore #FOMCWatch #EarningsSeason
1
45
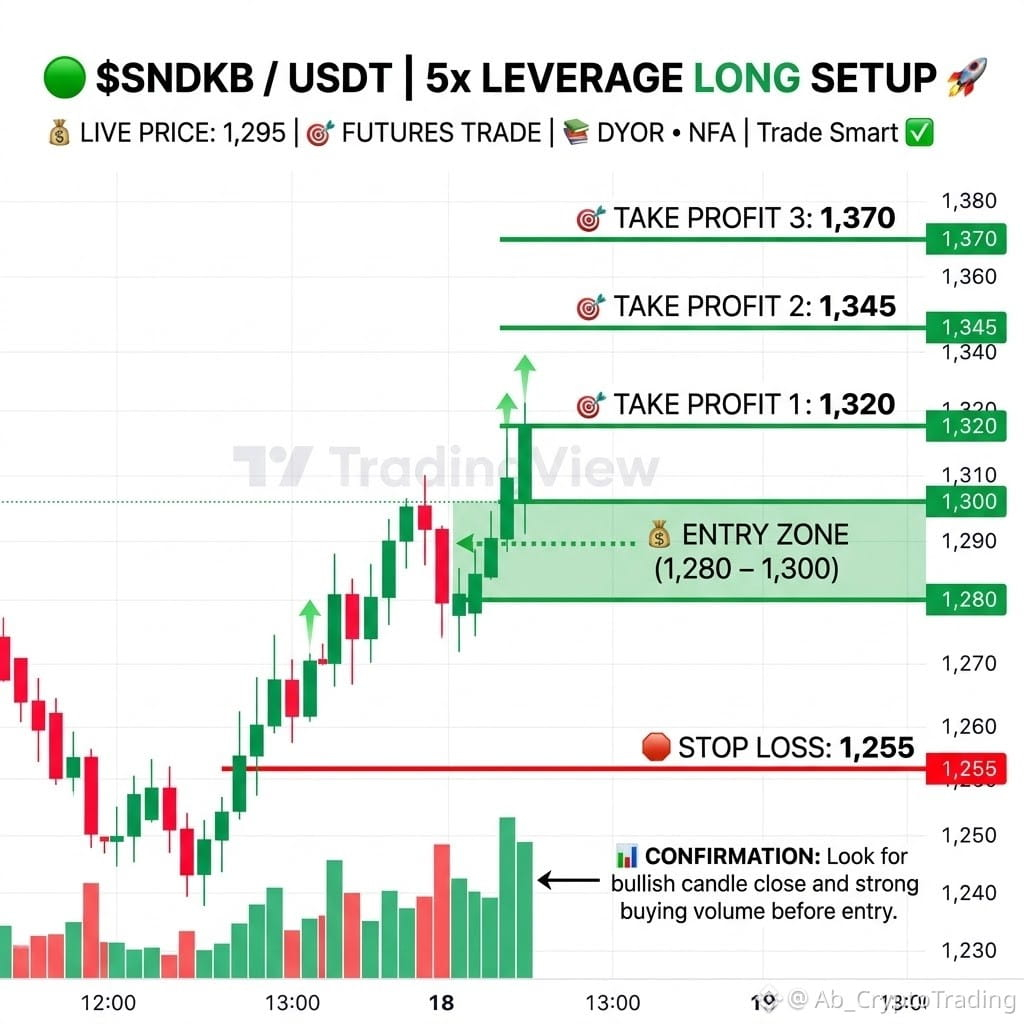
🟢 $SNDKB /USDT — LONG SETUP 📈🚀
💰 Entry Zone: 1,280 – 1,300
🎯 Take Profit 1: 1,320 🎯 Take Profit 2: 1,345 🎯 Take Profit 3: 1,370
🛑 Stop Loss: 1,255
📊 Confirmation: Look for a bullish candle close and strong buying volume before entering.
📚 DYOR • NFA | Trade Smart ✅
#SouthKoreaConsidersEducationTaxOnCryptoExchanges #FOMCWatch #SNDKB #CanMicrosoftDeliverOnAI #CanGoogleDefindItsCore
1
144
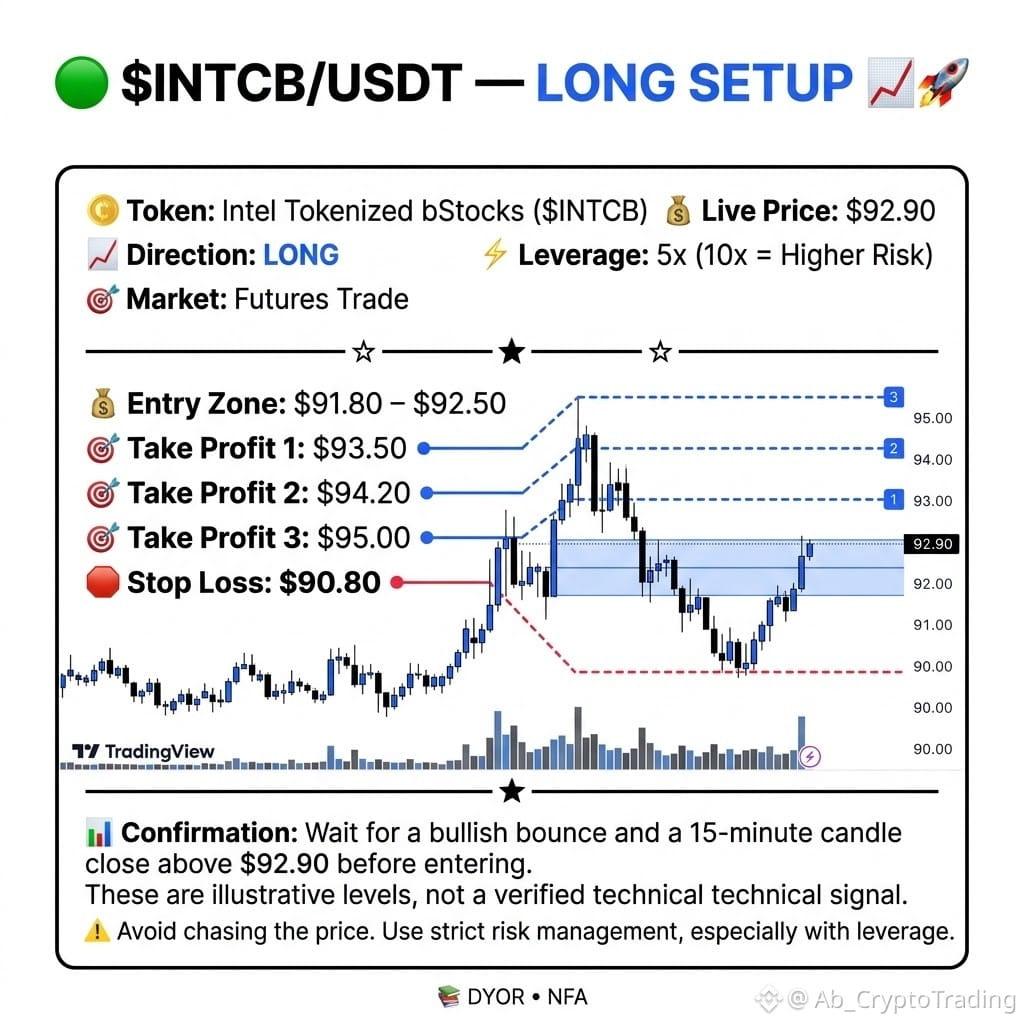
🟢 $INTCB /USDT — LONG SETUP 📈🚀
━━━━━━━━━━━━━━
💰 Entry Zone: $91.80 – $92.50
🎯 Take Profit 1: $93.50 🎯 Take Profit 2: $94.20 🎯 Take Profit 3: $95.00
🛑 Stop Loss: $90.80
━━━━━━━━━━━━━━
📊 Confirmation: Wait for a bullish bounce and a 15-minute candle close above $92.90 before entering. These are illustrative levels, not a verified technical signal.
⚠️ Avoid chasing the price. Use strict risk management, especially with leverage.
📚 DYOR • NFA
#CanMicrosoftDeliverOnAI #CanGoogleDefindItsCore #谷歌财报能否守住基本盘 #微软财报能否兑现ai红利 #FOMCWatch
━━━━━━━━━━━━━━
💰 Entry Zone: $91.80 – $92.50
🎯 Take Profit 1: $93.50 🎯 Take Profit 2: $94.20 🎯 Take Profit 3: $95.00
🛑 Stop Loss: $90.80
━━━━━━━━━━━━━━
📊 Confirmation: Wait for a bullish bounce and a 15-minute candle close above $92.90 before entering. These are illustrative levels, not a verified technical signal.
⚠️ Avoid chasing the price. Use strict risk management, especially with leverage.
📚 DYOR • NFA
#CanMicrosoftDeliverOnAI #CanGoogleDefindItsCore #谷歌财报能否守住基本盘 #微软财报能否兑现ai红利 #FOMCWatch
1
114
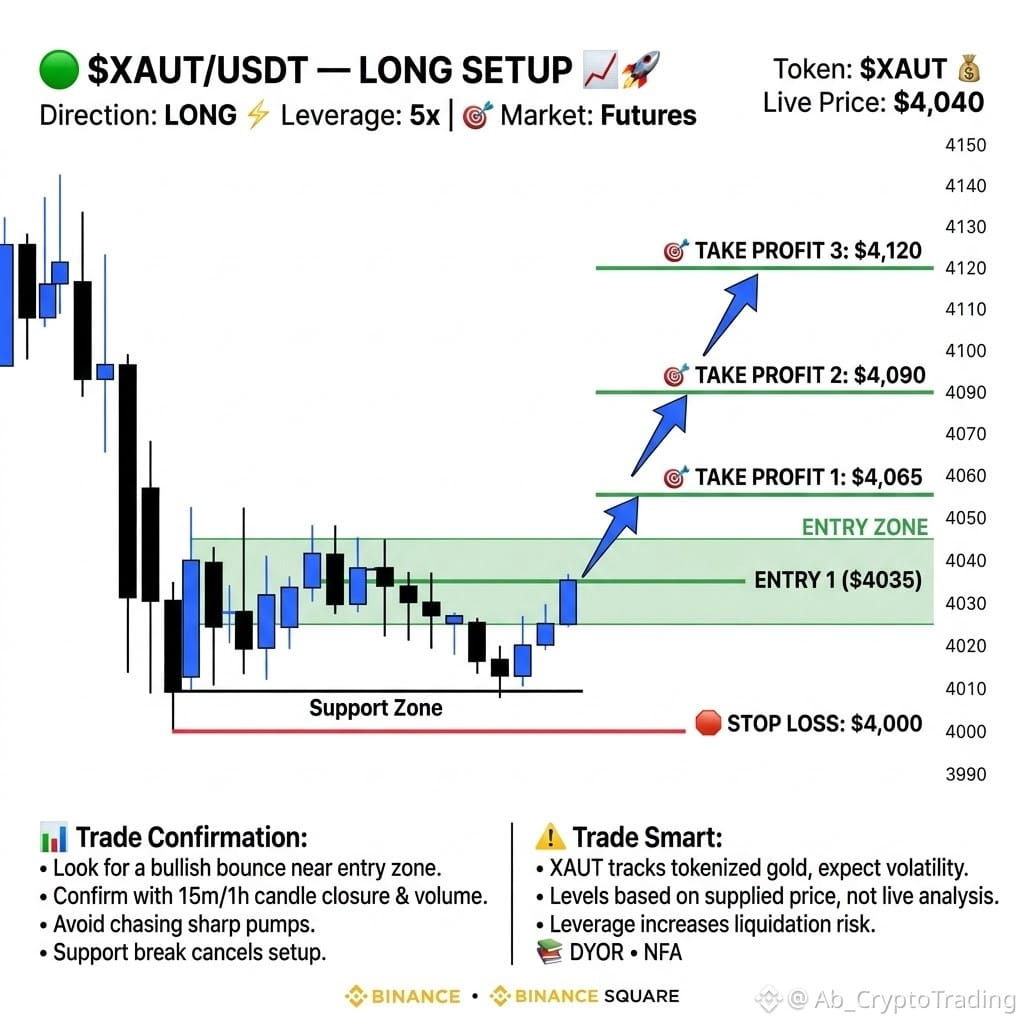
🟢 $XAUT /USDT — LONG SETUP 📈🚀
━━━━━━━━━━━━━━
💰 Entry Zone: $4,025 – $4,045
🎯 Take Profit 1: $4,065 🎯 Take Profit 2: $4,090 🎯 Take Profit 3: $4,120
🛑 Stop Loss: $4,000
━━━━━━━━━━━━━━
📊 Trade Confirmation:
* Look for a bullish bounce near the entry zone.
* Confirm with 15m/1h candle closure and volume.
* Avoid chasing if price pumps sharply.
* If support breaks, cancel the long setup.
📚 DYOR • NFA
#XAUT #FOMCWatch #AkashSelectsSolanaAsMigrationTarget #OCCUrgesCommunityBanksToEnterStablecoinPayments #SouthKoreaConsidersEducationTaxOnCryptoExchanges
━━━━━━━━━━━━━━
💰 Entry Zone: $4,025 – $4,045
🎯 Take Profit 1: $4,065 🎯 Take Profit 2: $4,090 🎯 Take Profit 3: $4,120
🛑 Stop Loss: $4,000
━━━━━━━━━━━━━━
📊 Trade Confirmation:
* Look for a bullish bounce near the entry zone.
* Confirm with 15m/1h candle closure and volume.
* Avoid chasing if price pumps sharply.
* If support breaks, cancel the long setup.
📚 DYOR • NFA
#XAUT #FOMCWatch #AkashSelectsSolanaAsMigrationTarget #OCCUrgesCommunityBanksToEnterStablecoinPayments #SouthKoreaConsidersEducationTaxOnCryptoExchanges
1
2
95
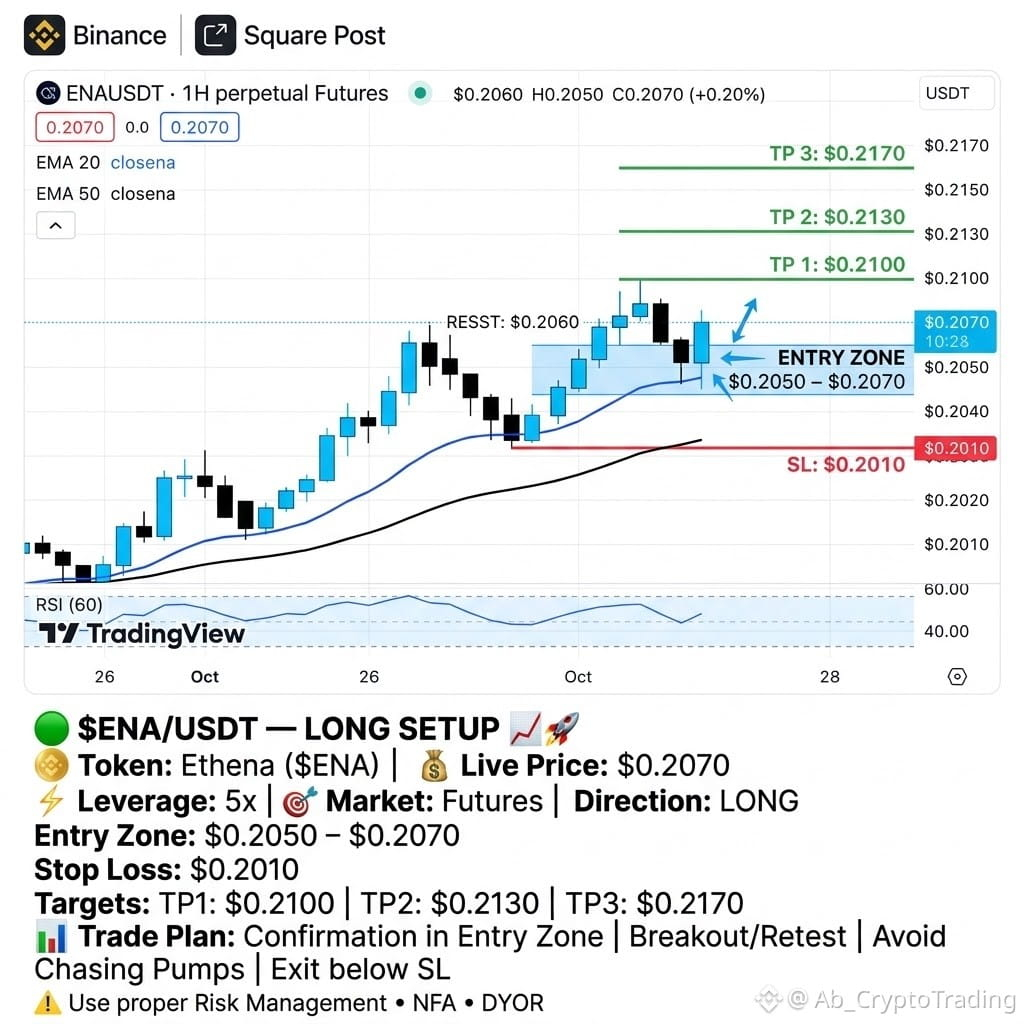
🟢 $ENA /USDT — LONG SETUP 📈🚀
━━━━━━━━━━━━━━
💰 Entry Zone: $0.2050 – $0.2070
🎯 Take Profit 1: $0.2100 🎯 Take Profit 2: $0.2130 🎯 Take Profit 3: $0.2170
🛑 Stop Loss: $0.2010
━━━━━━━━━━━━━━
📊 Trade Plan:
* Look for bullish confirmation near the entry zone.
* Confirm a breakout or successful retest before entering.
* Avoid chasing a sudden price pump.
* If price breaks below the stop-loss level, exit according to your risk plan.
⚠️ Trade Smart: Use proper risk management. 📚 DYOR • NFA
#ENA #FOMCWatch #ThailandLaunchesWORPTStablecoinToQRPaymentApp #SouthKoreaConsidersEducationTaxOnCryptoExchanges #RippleWinsFullApprovalAsNationalTrustBank
━━━━━━━━━━━━━━
💰 Entry Zone: $0.2050 – $0.2070
🎯 Take Profit 1: $0.2100 🎯 Take Profit 2: $0.2130 🎯 Take Profit 3: $0.2170
🛑 Stop Loss: $0.2010
━━━━━━━━━━━━━━
📊 Trade Plan:
* Look for bullish confirmation near the entry zone.
* Confirm a breakout or successful retest before entering.
* Avoid chasing a sudden price pump.
* If price breaks below the stop-loss level, exit according to your risk plan.
⚠️ Trade Smart: Use proper risk management. 📚 DYOR • NFA
#ENA #FOMCWatch #ThailandLaunchesWORPTStablecoinToQRPaymentApp #SouthKoreaConsidersEducationTaxOnCryptoExchanges #RippleWinsFullApprovalAsNationalTrustBank
1
221
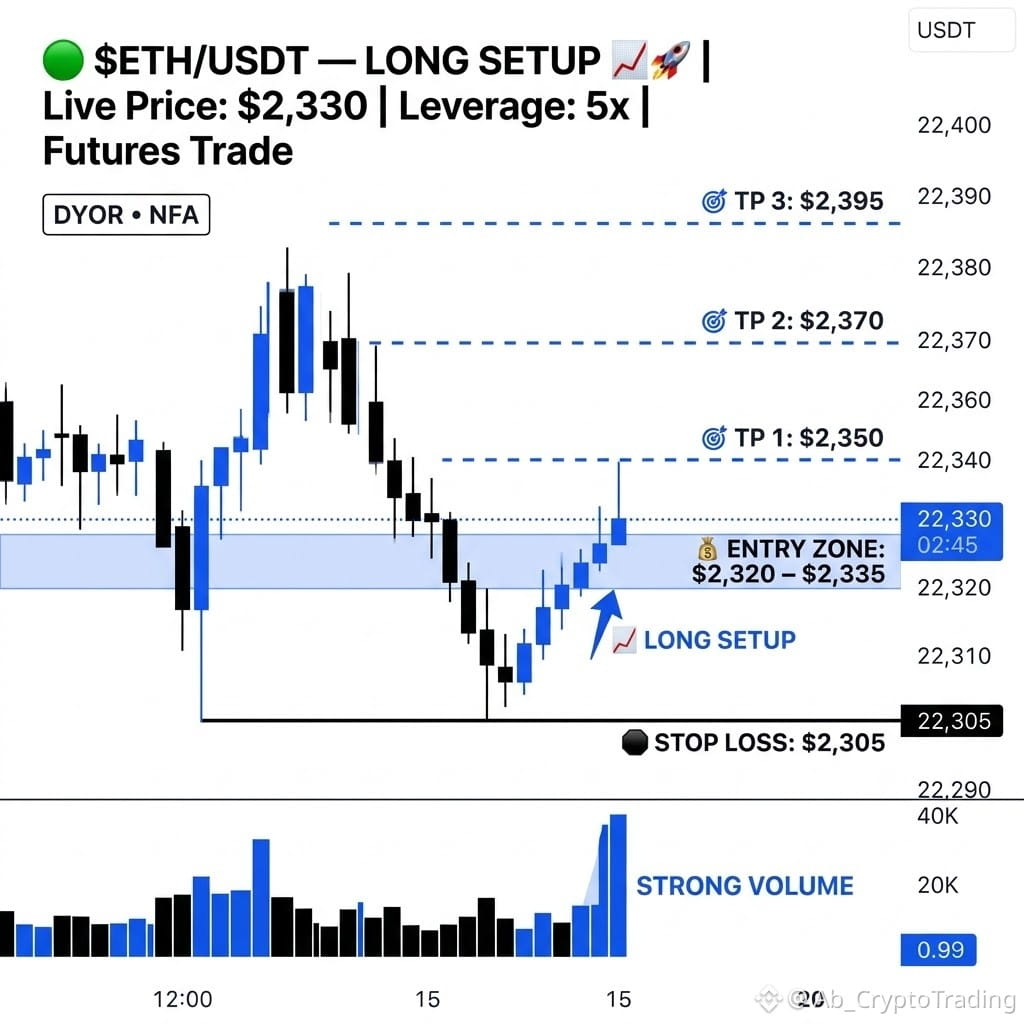
🟢 $ETH /USDT — LONG SETUP 📈🚀
━━━━━━━━━━━━━━
💰 Entry Zone: $2,320 – $2,335
🎯 Take Profit 1: $2,350 🎯 Take Profit 2: $2,370 🎯 Take Profit 3: $2,395
🛑 Stop Loss: $2,305
━━━━━━━━━━━━━━
📊 Confirmation: Watch for a bullish bounce and a 15-minute candle close above $2,335 with strong volume.
⚠️ Avoid chasing the price. If ETH breaks below support, the long setup may be invalidated.
⚡ Trade Smart 📚 DYOR • NFA
#FOMCWatch #ETH #Earncommissions #wr #ThailandLaunchesWORPTStablecoinToQRPaymentApp
━━━━━━━━━━━━━━
💰 Entry Zone: $2,320 – $2,335
🎯 Take Profit 1: $2,350 🎯 Take Profit 2: $2,370 🎯 Take Profit 3: $2,395
🛑 Stop Loss: $2,305
━━━━━━━━━━━━━━
📊 Confirmation: Watch for a bullish bounce and a 15-minute candle close above $2,335 with strong volume.
⚠️ Avoid chasing the price. If ETH breaks below support, the long setup may be invalidated.
⚡ Trade Smart 📚 DYOR • NFA
#FOMCWatch #ETH #Earncommissions #wr #ThailandLaunchesWORPTStablecoinToQRPaymentApp
1
239
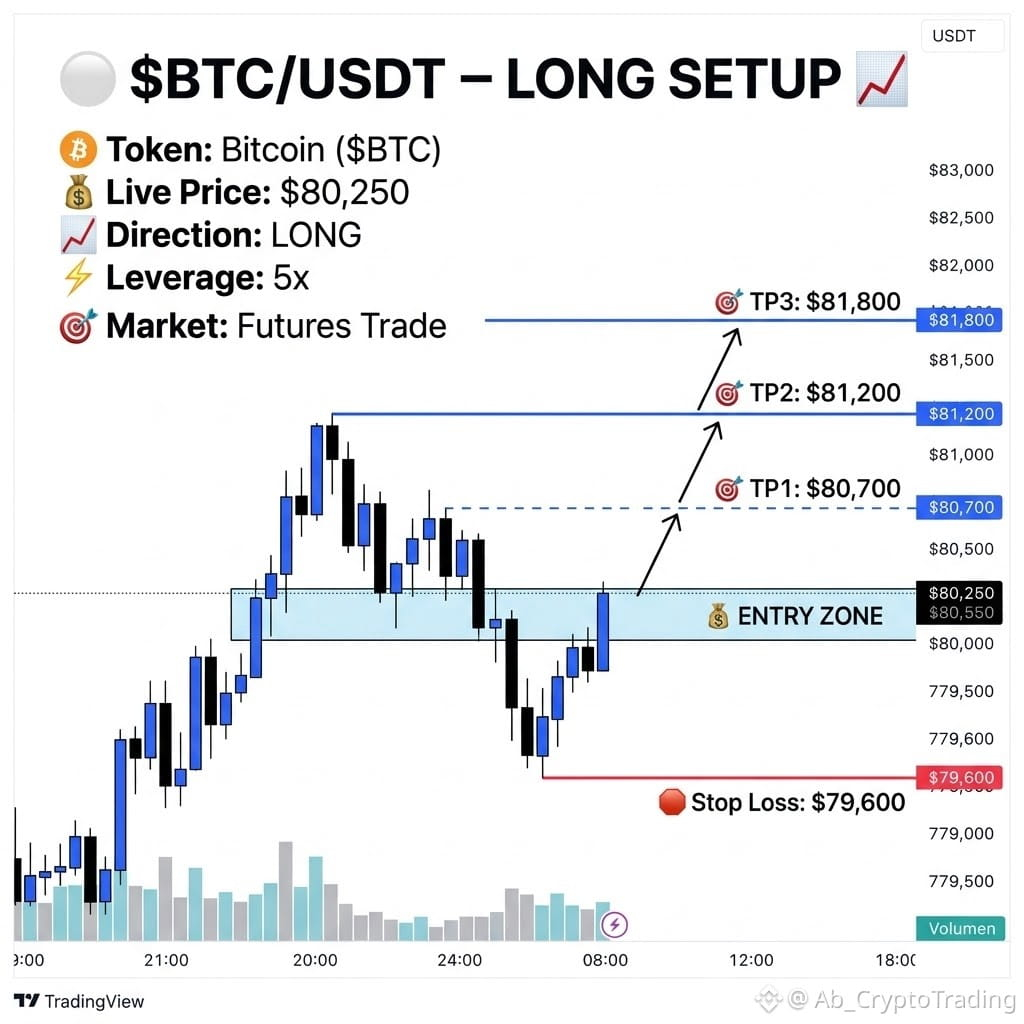
🟢 $BTC /USDT — LONG SETUP 📈🚀
━━━━━━━━━━━━━━
💰 Entry Zone: $80,000 – $80,250
🎯 Take Profit 1: $80,700 🎯 Take Profit 2: $81,200 🎯 Take Profit 3: $81,800
🛑 Stop Loss: $79,600
━━━━━━━━━━━━━━
📊 Trade Confirmation
Watch for a bullish bounce near the entry zone.
Look for a 15m candle close above $80,250 with strong volume.
If BTC breaks below $79,600, the long setup is invalidated.
⚠️ Risk Management
Wait for confirmation; avoid chasing green candles.
Use a stop loss and manage position size carefully.
Leverage can amplify losses as well as profits.
📚 DYOR • NFA
#BTC #FOMCWatch #Write2Earn #Write2Earn! #ThailandLaunchesWORPTStablecoinToQRPaymentApp
━━━━━━━━━━━━━━
💰 Entry Zone: $80,000 – $80,250
🎯 Take Profit 1: $80,700 🎯 Take Profit 2: $81,200 🎯 Take Profit 3: $81,800
🛑 Stop Loss: $79,600
━━━━━━━━━━━━━━
📊 Trade Confirmation
Watch for a bullish bounce near the entry zone.
Look for a 15m candle close above $80,250 with strong volume.
If BTC breaks below $79,600, the long setup is invalidated.
⚠️ Risk Management
Wait for confirmation; avoid chasing green candles.
Use a stop loss and manage position size carefully.
Leverage can amplify losses as well as profits.
📚 DYOR • NFA
#BTC #FOMCWatch #Write2Earn #Write2Earn! #ThailandLaunchesWORPTStablecoinToQRPaymentApp
1
75
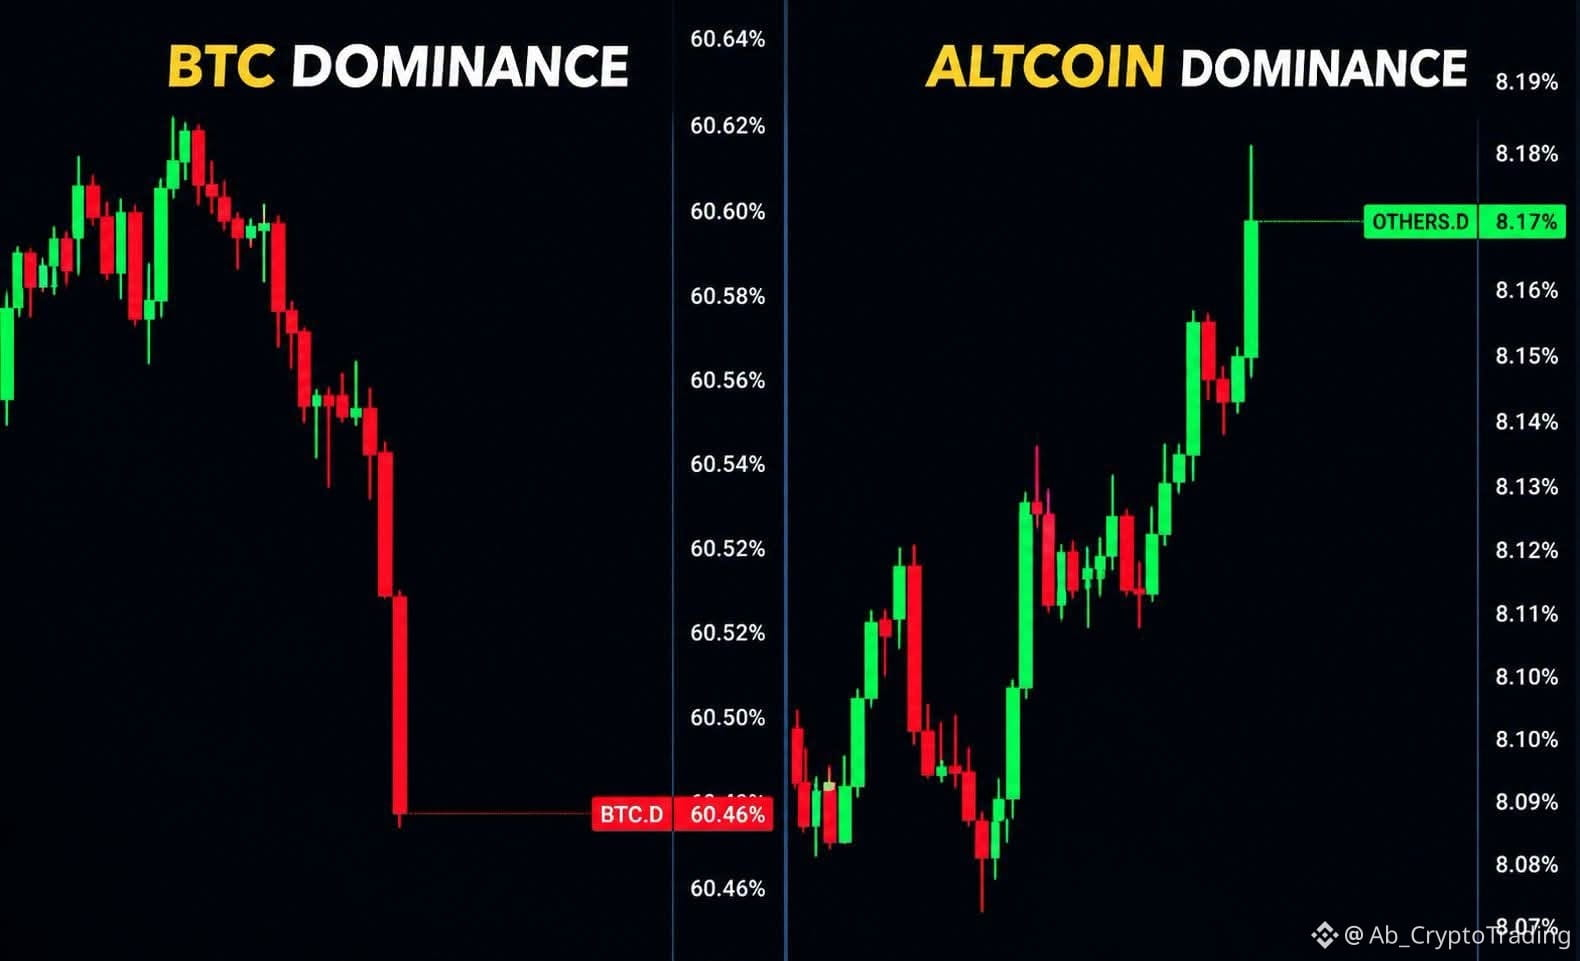
🚨 BITCOIN DOMINANCE IS FALLING… WHILE ALTCOIN DOMINANCE IS RISING. WHAT COMES NEXT? 👀
Look at the charts. 👆
🔴 $BTC Dominance: 60.46%
🟢 Altcoin Dominance (Others.D): 8.17%
The move raises a critical question for the crypto market:
Are we seeing the early signs of capital rotating into altcoins — or is it too early to call this an Altseason?
Here’s where opinions may split:
🐂 THE BULLS: Falling $BTC dominance could open the door for altcoins to outperform Bitcoin.
🐻 THE SKEPTICS: A short-term move in dominance doesn’t prove a sustained rotation. Bitcoin could still lead the next leg.
⚖️ THE BIG QUESTION: Will altcoins continue gaining ground, or will this move fade before a broader rally develops?
👇 I want your honest take:
A) Altseason is starting.
B) Too early — BTC could regain dominance.
C) Only a few altcoins will outperform; no broad Altseason.
Don't just drop a letter.
What would confirm your view — and what would invalidate it?
Let’s hear the strongest arguments from both sides. 🔥
$ETH #altcoins #FOMCWatch #Write2Earn #SouthKoreaConsidersEducationTaxOnCryptoExchanges #ThailandLaunchesWORPTStablecoinToQRPaymentApp
2
53
BITCOIN: IS HISTORY REPEATING ITSELF… OR ARE WE SEEING WHAT WE WANT TO SEE? 👀🔥
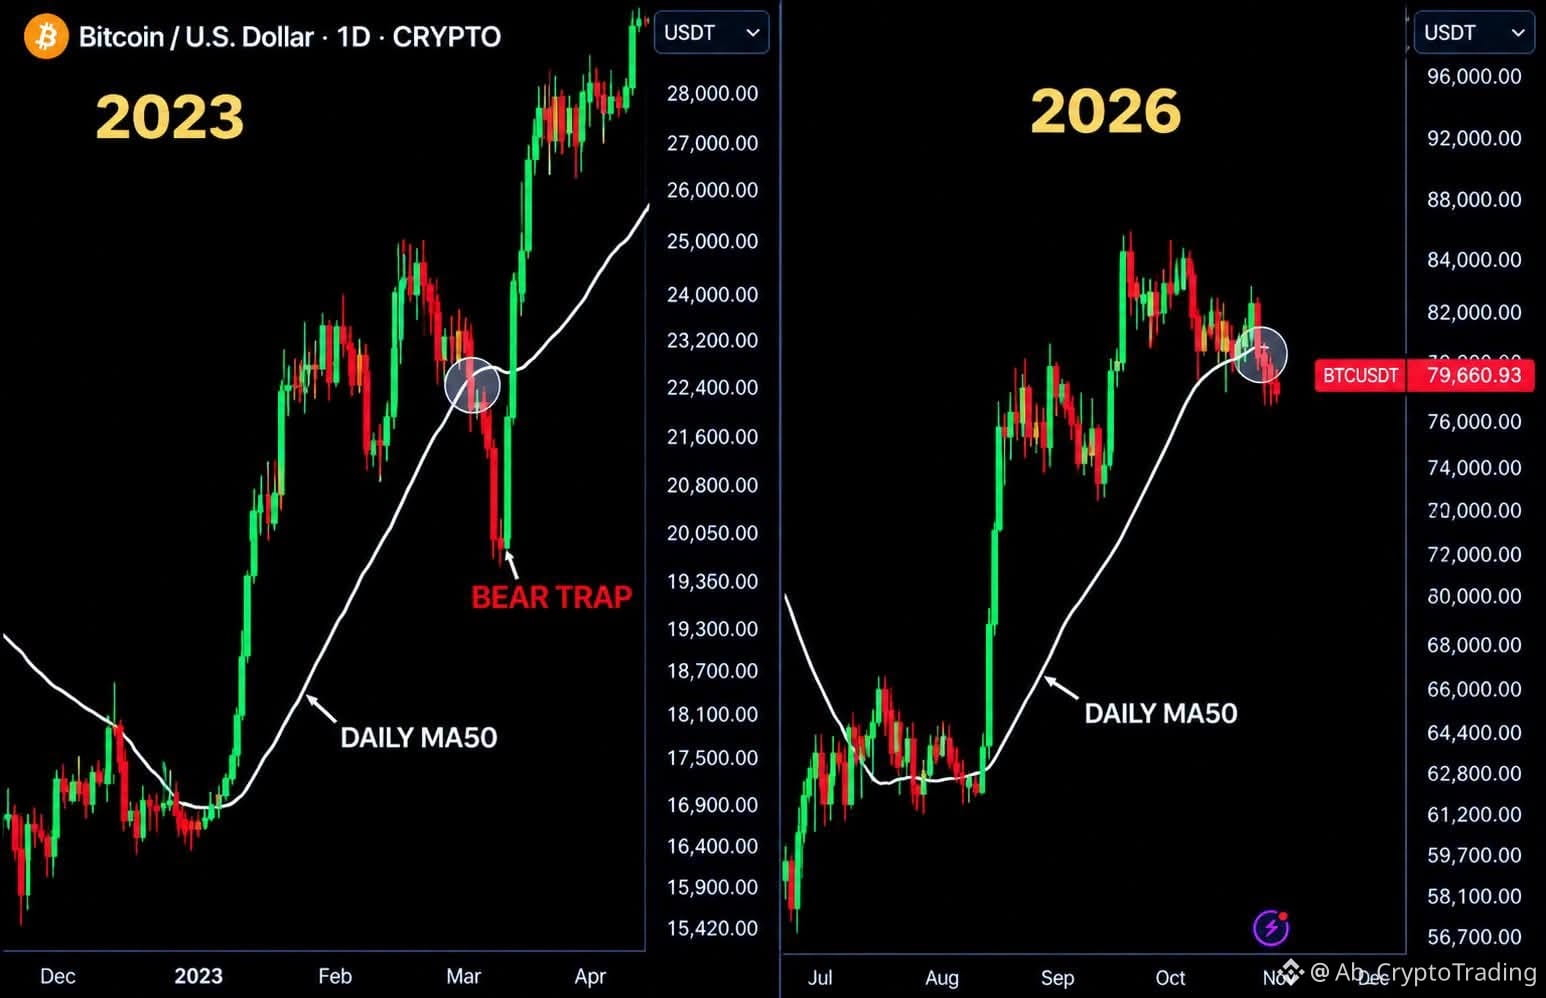
Look at the comparison between 2023 and 2026.
In the 2023 chart, Bitcoin moved around its 50-day moving average before a sharp recovery from the area marked as a potential bear trap.
Now, the 2026 chart shows price pulling back toward the daily MA50 after a strong rally.
The resemblance is interesting.
But a similar chart pattern doesn’t guarantee a similar outcome.
Here’s where the debate begins:
🟢 THE BULLISH VIEW: If the MA50 holds and buyers regain control, the current pullback could become another turning point.
🔴 THE BEARISH VIEW: If Bitcoin loses the MA50 and fails to reclaim it, the 2023 comparison could break down completely.
⚖️ THE SKEPTICAL VIEW: Two similar-looking charts are not enough. Market structure, liquidity, and broader conditions matter.
So, what are we looking at here?
A) A potential repeat of the 2023 setup
B) A temporary bounce before further downside
C) A visual similarity that still needs confirmation
Don’t just choose A, B, or C.
What specific signal on this chart would prove your view right — or prove you wrong?
Let’s see the strongest arguments from both sides. 👇
$BTC
#FOMCWatch #ThailandLaunchesWORPTStablecoinToQRPaymentApp #BitmineAdds10452ETH #OCCUrgesCommunityBanksToEnterStablecoinPayments #RippleWinsFullApprovalAsNationalTrustBank
2
78

ບົດຄວາມ
🚀 Bitcoin Bullish: Is a 20% Altcoin Rally Next?$GRVT Bitcoin ended last week on a bullish weekly close, and some traders are now preparing for a relief rally in altcoins. Several major tokens are sitting on key support levels, and a 20% bounce across altcoins is being tipped as the next possible move.
An analyst who trades altcoin cycles has started building positions in Solana, SUI, Render and Avalanche.
Bitcoin Sets The Tone
The latest weekly candle suggests Bitcoin could recover most of the past two weeks’ losses within days. The levels being watched:
Upside target: $84,000 to $85,000 this week
Short-term trigger: a move above $80,000 to $81,000 could lift $BTC quickly to $83,000
Support: current levels, with a deeper floor at $77,000
Liquidity: short positions are building between $81,000 and $82,700, which raises the chance of a short squeeze
Bitcoin’s daily RSI has also fallen to very low levels, a reading that often comes before a bounce.
Bitcoin Dominance Could Unlock Altcoins
Bitcoin’s share of the total crypto market is close to the top of a wedge pattern on the weekly chart. A sharp drop in dominance from here would usually mean money flowing into altcoins, and that could set off a fast rally.
Altcoins At Key Levels
Solana (SOL)
Support zone: $97 to $101
First target: $104, then a push toward $120
Setup invalidated below $93 to $94
SUI
Sitting on its 200-day moving average and the 0.618 Fibonacci level
Trading inside a falling wedge on the four-hour chart, a pattern that often ends in a breakout
Key support near $0.87
Render (RENDER)
Holding the 200-day moving average and the 0.618 Fibonacci level
Next important zone near $1.67
Bounce target of $1.95 to $2
Avalanche (AVAX)
The 0.618 Fibonacci support sits near $8.70 to $8.75
Setup weakens below $8.40 to $8.50
First target is a move of 10% to 12%
Other Altcoins On The Watchlist
$XRP : bouncing off its 200-day moving average and the 0.618 Fibonacci level, and needs a trendline break to start a bigger move
Bittensor (TAO): a breakout above its current trendline would confirm a bullish setup
Compound (COMP): back near $20 and sitting on its 200-day moving average
Cardano (ADA): a possible four-hour breakout, though it is not seen as one of the strongest charts
Injective (INJ) and NEAR: both still look weak in the short term, with INJ possibly slipping to around $7
Two Possible Paths
Prices could dip one more time to clear out leveraged positions before rallying, or break higher straight away. Either way, the current zone is seen as an early entry area ahead of a bigger move expected in the coming weeks.
#BitcoinSlipsBelow$80KAgain #StrategySkipsBitcoinPurchasesSpends$205MOnSTRCBuybacks #AnthropicTTMRevenueGrewAbout1200% #ThailandLaunchesWORPTStablecoinToQRPaymentApp #BitmineAdds10452ETH
🚀 Bitcoin Bullish: Is a 20% Altcoin Rally Next?
$GRVT Bitcoin ended last week on a bullish weekly close, and some traders are now preparing for a relief rally in altcoins. Several major tokens are sitting on key support levels, and a 20% bounce across altcoins is being tipped as the next possible move.
An analyst who trades altcoin cycles has started building positions in Solana, SUI, Render and Avalanche.
Bitcoin Sets The Tone
The latest weekly candle suggests Bitcoin could recover most of the past two weeks’ losses within days. The levels being watched:
Upside target: $84,000 to $85,000 this week
Short-term trigger: a move above $80,000 to $81,000 could lift $BTC quickly to $83,000
Support: current levels, with a deeper floor at $77,000
Liquidity: short positions are building between $81,000 and $82,700, which raises the chance of a short squeeze
Bitcoin’s daily RSI has also fallen to very low levels, a reading that often comes before a bounce.
Bitcoin Dominance Could Unlock Altcoins
Bitcoin’s share of the total crypto market is close to the top of a wedge pattern on the weekly chart. A sharp drop in dominance from here would usually mean money flowing into altcoins, and that could set off a fast rally.
Altcoins At Key Levels
Solana (SOL)
Support zone: $97 to $101
First target: $104, then a push toward $120
Setup invalidated below $93 to $94
SUI
Sitting on its 200-day moving average and the 0.618 Fibonacci level
Trading inside a falling wedge on the four-hour chart, a pattern that often ends in a breakout
Key support near $0.87
Render (RENDER)
Holding the 200-day moving average and the 0.618 Fibonacci level
Next important zone near $1.67
Bounce target of $1.95 to $2
Avalanche (AVAX)
The 0.618 Fibonacci support sits near $8.70 to $8.75
Setup weakens below $8.40 to $8.50
First target is a move of 10% to 12%
Other Altcoins On The Watchlist
$XRP : bouncing off its 200-day moving average and the 0.618 Fibonacci level, and needs a trendline break to start a bigger move
Bittensor (TAO): a breakout above its current trendline would confirm a bullish setup
Compound (COMP): back near $20 and sitting on its 200-day moving average
Cardano (ADA): a possible four-hour breakout, though it is not seen as one of the strongest charts
Injective (INJ) and NEAR: both still look weak in the short term, with INJ possibly slipping to around $7
Two Possible Paths
Prices could dip one more time to clear out leveraged positions before rallying, or break higher straight away. Either way, the current zone is seen as an early entry area ahead of a bigger move expected in the coming weeks.
#BitcoinSlipsBelow$80KAgain #StrategySkipsBitcoinPurchasesSpends$205MOnSTRCBuybacks #AnthropicTTMRevenueGrewAbout1200% #ThailandLaunchesWORPTStablecoinToQRPaymentApp #BitmineAdds10452ETH
2
151
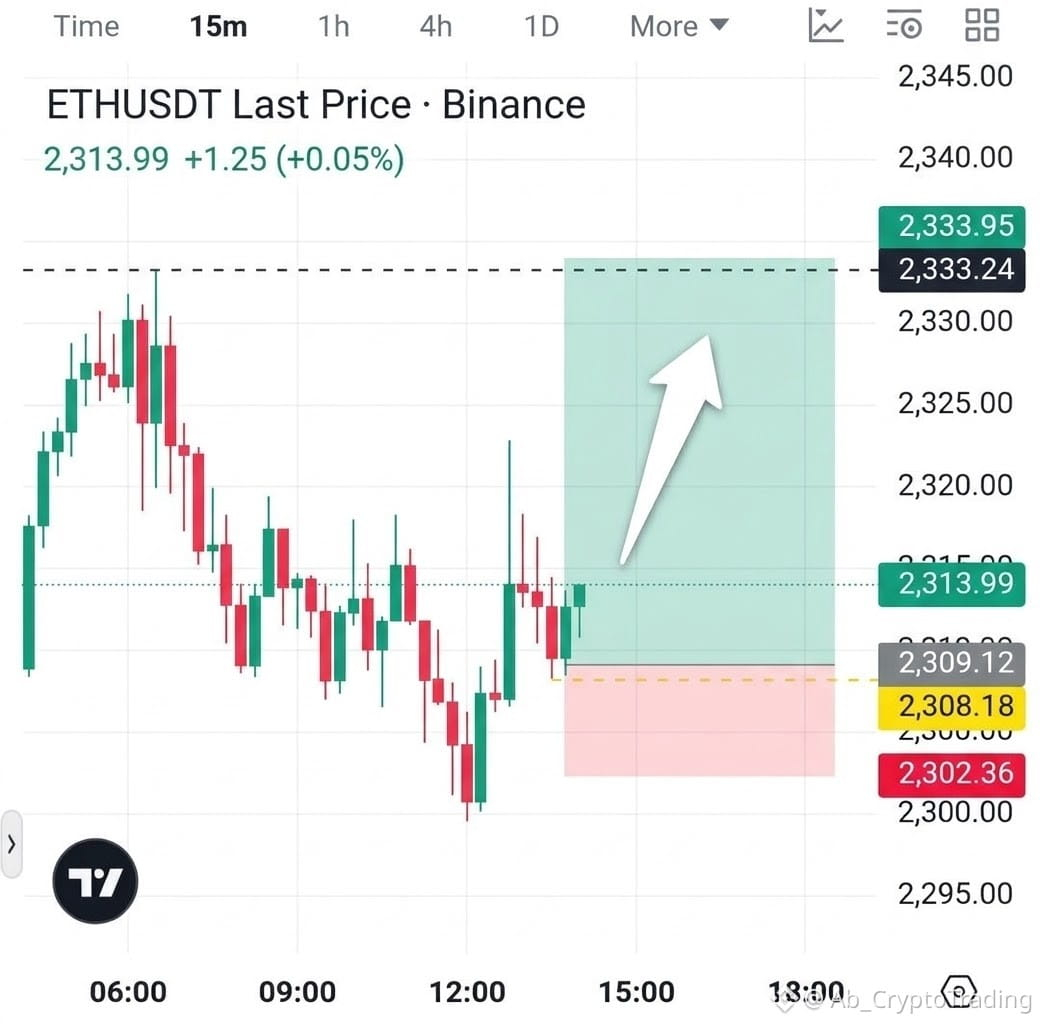
🟢 $ETH /USDT — LONG SETUP 👀📈
🎯 Take Profit: $2,335
🛑 Stop Loss: $2,302
━━━━━━━━━━━━━━
Why I’m Looking for a LONG on $ETH 👇
What I like here isn’t just the support — it’s how price reacts after every dip.
Sellers keep pushing $ETH lower, but whenever price approaches the $2,308–$2,310 support zone, buyers step back in and absorb the selling pressure.
That tells me bears aren’t getting the clean downside continuation they want. 👀
Meanwhile, there’s a liquidity zone sitting above around $2,330–$2,335, which could be the next target if buyers maintain control.
📊 My Trading Plan:
- 🟢 Support: $2,308–$2,310
- 🎯 Target: $2,335
- 🛑 Stop Loss: $2,302
- 📈 Watch for bullish confirmation and buying volume.
If sellers were truly in control, this support might already have broken. So far, the reaction keeps the bullish scenario in play.
I’m watching for one more push higher — but if support breaks, the setup is invalidated.
⚠️ Don’t chase green candles. Manage your risk and wait for confirmation.
DYOR • NFA
#ETH #Ethereum #cryptotrading #BinanceSquare #TradingSetup
2
104
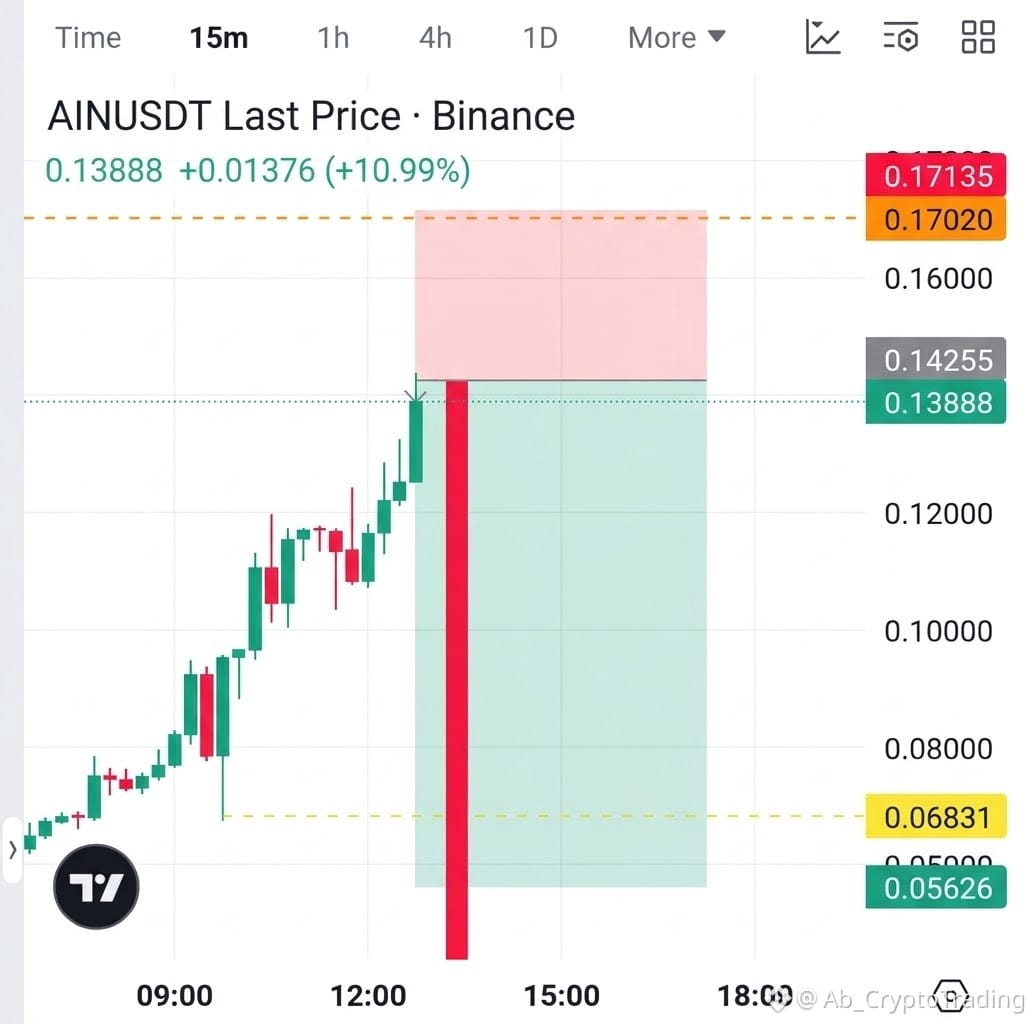
👀 Guys, I’m watching a potential major SHORT opportunity on $AIN !
🎯 Take Profit (TP): $0.0680
🛑 Stop Loss (SL): $0.1710
{future}(AINUSDT)
🔥 Why am I looking to short after such a massive pump?
I know some of you are wondering why I’m considering a short while momentum still looks strong.
Here’s what I’m watching 👇🏻
📉 1. Higher-Timeframe Reaction Zone
$AIN is approaching an important reaction area where selling pressure may start to take control.
🐻 2. Potential Selling Pressure
If buyers fail to maintain momentum and bearish confirmation appears, the price could face a sharp correction.
💧 3. Late-Buyer Liquidity
After a strong run-up, late buyers can become vulnerable if price loses key support, potentially accelerating the move down.
⚠️ 4. One More Pump Is Possible
Price could push higher before reversing. I’m not ignoring that risk, and I won’t increase leverage to chase a losing position.
━━━━━━━━━━━━━━
🎯 My Strategy: Wait for bearish confirmation, watch the key reaction zone, and manage risk carefully.
I’m not shorting $AIN simply because it pumped. I’m watching for a potential shift in market structure and selling pressure.
If this setup confirms, a significant pullback could follow. 📉
⚠️ Risk Warning: This is a speculative setup, not a guaranteed move. The TP and SL are proposed levels, not verified technical levels. Use strict risk management, especially with futures leverage.
📚 DYOR • NFA
#AIN #EarningsSeason #ThailandLaunchesWORPTStablecoinToQRPaymentApp #Write2Earn
👀 Guys, I’m watching a potential major SHORT opportunity on $AIN !
🎯 Take Profit (TP): $0.0680
🛑 Stop Loss (SL): $0.1710
🔥 Why am I looking to short after such a massive pump?
I know some of you are wondering why I’m considering a short while momentum still looks strong.
Here’s what I’m watching 👇🏻
📉 1. Higher-Timeframe Reaction Zone
$AIN is approaching an important reaction area where selling pressure may start to take control.
🐻 2. Potential Selling Pressure
If buyers fail to maintain momentum and bearish confirmation appears, the price could face a sharp correction.
💧 3. Late-Buyer Liquidity
After a strong run-up, late buyers can become vulnerable if price loses key support, potentially accelerating the move down.
⚠️ 4. One More Pump Is Possible
Price could push higher before reversing. I’m not ignoring that risk, and I won’t increase leverage to chase a losing position.
━━━━━━━━━━━━━━
🎯 My Strategy: Wait for bearish confirmation, watch the key reaction zone, and manage risk carefully.
I’m not shorting $AIN simply because it pumped. I’m watching for a potential shift in market structure and selling pressure.
If this setup confirms, a significant pullback could follow. 📉
⚠️ Risk Warning: This is a speculative setup, not a guaranteed move. The TP and SL are proposed levels, not verified technical levels. Use strict risk management, especially with futures leverage.
📚 DYOR • NFA
#AIN #EarningsSeason #ThailandLaunchesWORPTStablecoinToQRPaymentApp #Write2Earn
3
162
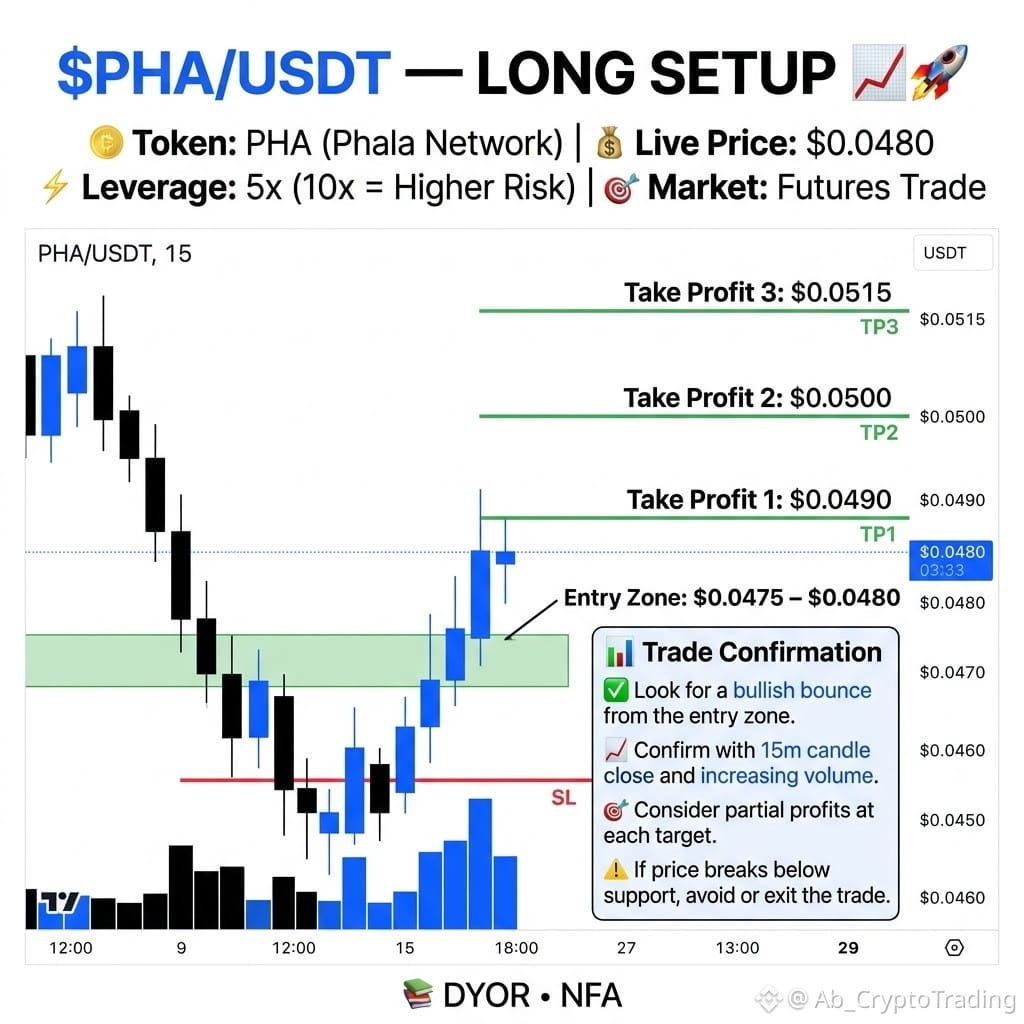
🟢 $PHA /USDT — LONG SETUP 📈🚀
━━━━━━━━━━━━━━
💰 Entry Zone: $0.0475 – $0.0480
🎯 Take Profit 1: $0.0490 🎯 Take Profit 2: $0.0500 🎯 Take Profit 3: $0.0515
🛑 Stop Loss: $0.0465
━━━━━━━━━━━━━━
📊 Trade Confirmation
* ✅ Look for a bullish bounce from the entry zone.
* 📈 Confirm with 15m candle close and increasing volume.
* 🎯 Consider partial profits at each target.
* ⚠️ If price breaks below support, avoid or exit the trade.
📚 DYOR • NFA
#PHA #BinancePick #EarningsSeason #AnthropicTTMRevenueGrewAbout1200% #Write2Earn!
━━━━━━━━━━━━━━
💰 Entry Zone: $0.0475 – $0.0480
🎯 Take Profit 1: $0.0490 🎯 Take Profit 2: $0.0500 🎯 Take Profit 3: $0.0515
🛑 Stop Loss: $0.0465
━━━━━━━━━━━━━━
📊 Trade Confirmation
* ✅ Look for a bullish bounce from the entry zone.
* 📈 Confirm with 15m candle close and increasing volume.
* 🎯 Consider partial profits at each target.
* ⚠️ If price breaks below support, avoid or exit the trade.
📚 DYOR • NFA
#PHA #BinancePick #EarningsSeason #AnthropicTTMRevenueGrewAbout1200% #Write2Earn!
3
347
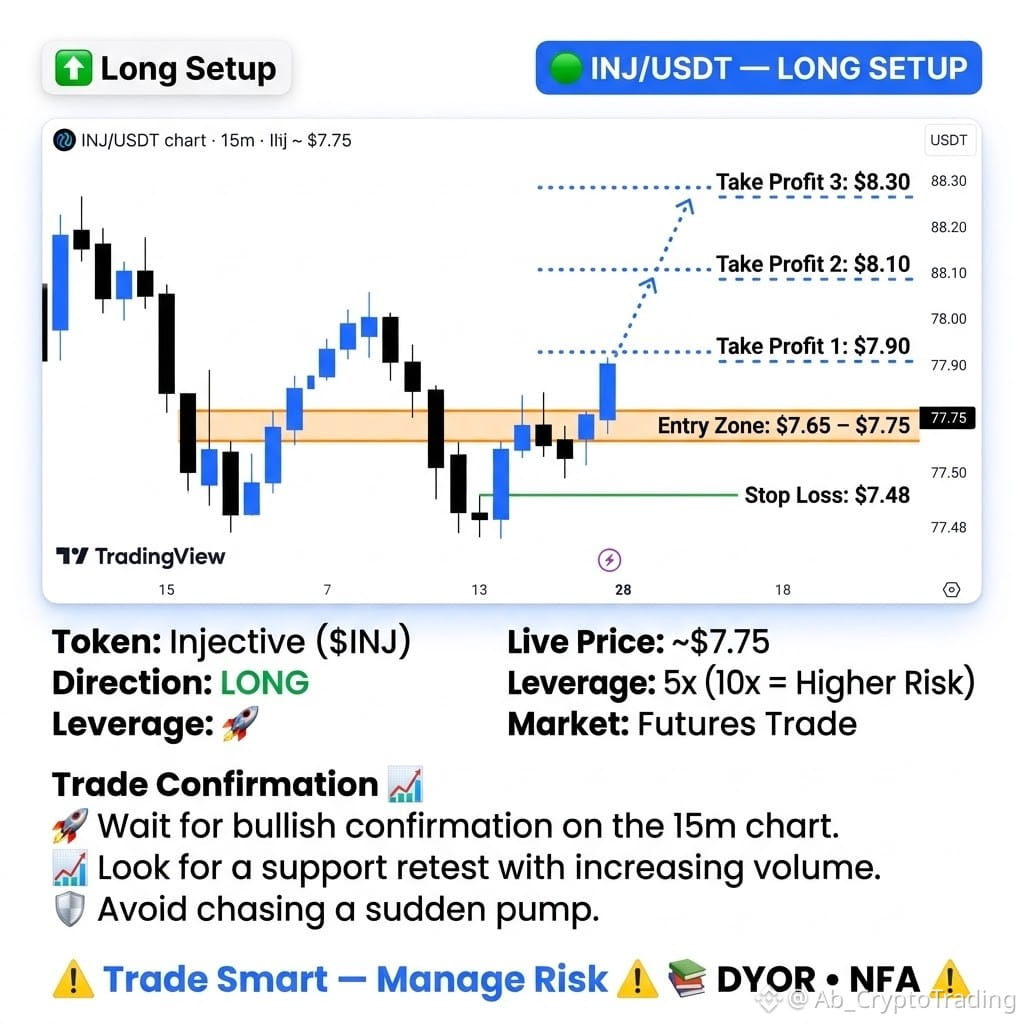
🟢 $INJ /USDT — LONG SETUP 📈🚀
━━━━━━━━━━━━━━
💰 Entry Zone: $7.65 – $7.70
🎯 Take Profit 1: $7.90 🎯 Take Profit 2: $8.10 🎯 Take Profit 3: $8.30
🛑 Stop Loss: $7.48
━━━━━━━━━━━━━━
📊 Trade Confirmation
* Wait for bullish confirmation on the 15m chart.
* Look for a support retest with increasing volume.
* Avoid chasing a sudden pump.
⚠️ Trade Smart — Manage Risk 📚 DYOR • NFA
#INJ #BinancePick #EarningsSeason #Write2Earn #Write2Earn!
━━━━━━━━━━━━━━
💰 Entry Zone: $7.65 – $7.70
🎯 Take Profit 1: $7.90 🎯 Take Profit 2: $8.10 🎯 Take Profit 3: $8.30
🛑 Stop Loss: $7.48
━━━━━━━━━━━━━━
📊 Trade Confirmation
* Wait for bullish confirmation on the 15m chart.
* Look for a support retest with increasing volume.
* Avoid chasing a sudden pump.
⚠️ Trade Smart — Manage Risk 📚 DYOR • NFA
#INJ #BinancePick #EarningsSeason #Write2Earn #Write2Earn!
2
115
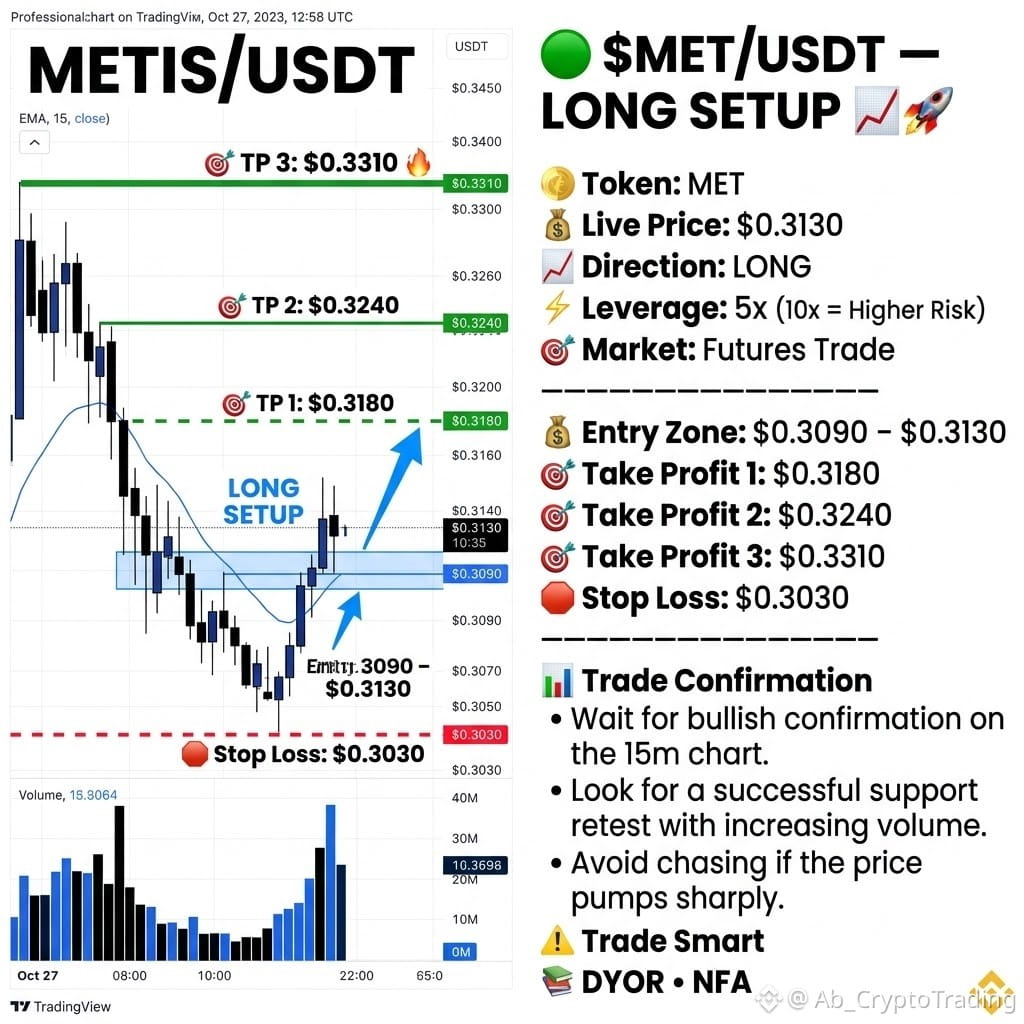
🟢 $MET /USDT — LONG SETUP 📈🚀
━━━━━━━━━━━━━━
💰 Entry Zone: $0.3090 – $0.3130
🎯 Take Profit 1: $0.3180 🎯 Take Profit 2: $0.3240 🎯 Take Profit 3: $0.3310
🛑 Stop Loss: $0.3030
━━━━━━━━━━━━━━
📊 Trade Confirmation
* Wait for bullish confirmation on the 15m chart.
* Look for a successful support retest with increasing volume.
* Avoid chasing if the price pumps sharply.
⚠️ Trade Smart 📚 DYOR • NFA
#BinancePick #EarningsSeason #Write2Earn #Write2Earn! #AnthropicTTMRevenueGrewAbout1200%
━━━━━━━━━━━━━━
💰 Entry Zone: $0.3090 – $0.3130
🎯 Take Profit 1: $0.3180 🎯 Take Profit 2: $0.3240 🎯 Take Profit 3: $0.3310
🛑 Stop Loss: $0.3030
━━━━━━━━━━━━━━
📊 Trade Confirmation
* Wait for bullish confirmation on the 15m chart.
* Look for a successful support retest with increasing volume.
* Avoid chasing if the price pumps sharply.
⚠️ Trade Smart 📚 DYOR • NFA
#BinancePick #EarningsSeason #Write2Earn #Write2Earn! #AnthropicTTMRevenueGrewAbout1200%
2
74
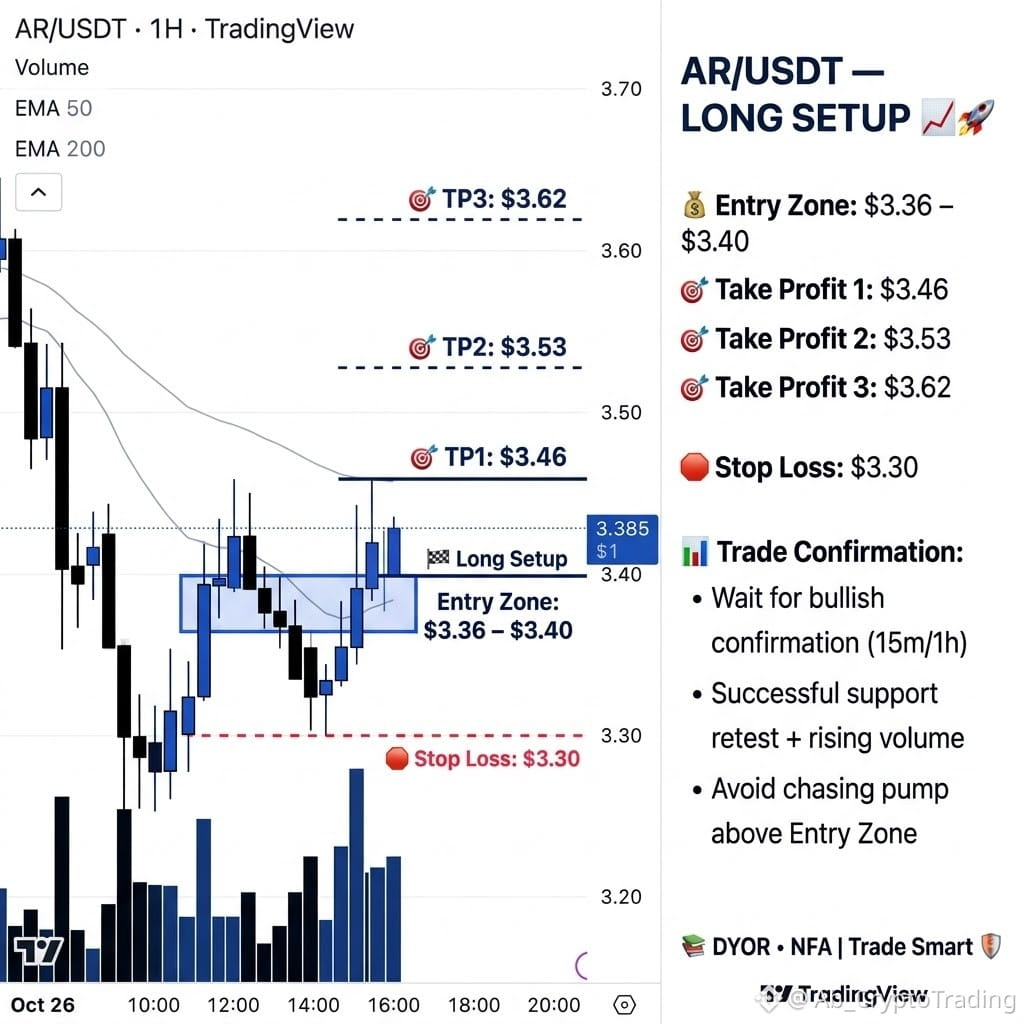
🟢 $AR /USDT — LONG SETUP 📈🚀
━━━━━━━━━━━━━━
💰 Entry Zone: $3.36 – $3.40
🎯 Take Profit 1: $3.46 🎯 Take Profit 2: $3.53 🎯 Take Profit 3: $3.62
🛑 Stop Loss: $3.30
━━━━━━━━━━━━━━
📊 Trade Confirmation:
* Wait for bullish confirmation on the 15m/1h chart.
* Look for a successful support retest with rising volume.
* Avoid chasing if price pumps above the entry zone.
📚 DYOR • NFA | Trade Smart 🛡️
#ARB #ARB🔥🔥🔥 #BinancePick #EarningsSeason #AnthropicTTMRevenueGrewAbout1200%
━━━━━━━━━━━━━━
💰 Entry Zone: $3.36 – $3.40
🎯 Take Profit 1: $3.46 🎯 Take Profit 2: $3.53 🎯 Take Profit 3: $3.62
🛑 Stop Loss: $3.30
━━━━━━━━━━━━━━
📊 Trade Confirmation:
* Wait for bullish confirmation on the 15m/1h chart.
* Look for a successful support retest with rising volume.
* Avoid chasing if price pumps above the entry zone.
📚 DYOR • NFA | Trade Smart 🛡️
#ARB #ARB🔥🔥🔥 #BinancePick #EarningsSeason #AnthropicTTMRevenueGrewAbout1200%
2
97
ເຂົ້າສູ່ລະບົບເພື່ອສຳຫຼວດເນື້ອຫາເພີ່ມເຕີມ
ເຂົ້າຮ່ວມກຸ່ມຜູ້ໃຊ້ຄຣິບໂຕທົ່ວໂລກໃນ Binance Square.
⚡️ ໄດ້ຮັບຂໍ້ມູນຫຼ້າສຸດ ແລະ ທີ່ມີປະໂຫຍດກ່ຽວກັບຄຣິບໂຕ.
💬 ໄດ້ຮັບຄວາມໄວ້ວາງໃຈຈາກຕະຫຼາດແລກປ່ຽນຄຣິບໂຕທີ່ໃຫຍ່ທີ່ສຸດໃນໂລກ.
👍 ຄົ້ນຫາຂໍ້ມູນເຊີງເລິກທີ່ແທ້ຈາກນັກສ້າງທີ່ໄດ້ຮັບການຢືນຢັນ.
ອີເມວ / ເບີໂທລະສັບ
ຫົວຂໍ້ທີ່ກໍາລັງນິຍົມ
CanMicrosoftDeliverOnAI
2,369 ຄັ້ງທີ່ເບິ່ງ
127 ກຳລັງສົນທະນາ
Earnings Season Session 3: Will Google & Microsoft Beat Earnings Expectations?
Binance Square Official
·20 ຖືກໃຈ
·5k ຄັ້ງທີ່ເບິ່ງ
CanGoogleDefindItsCore
1,882 ຄັ້ງທີ່ເບິ່ງ
126 ກຳລັງສົນທະນາ
FOMCWatch
9M ຄັ້ງທີ່ເບິ່ງ
27,284 ກຳລັງສົນທະນາ