
#tradingstrategy
tradingstrategy
6.1M ຄັ້ງທີ່ເບິ່ງ
28,333 ກຳລັງສົນທະນາ
ມາແຮງ
ຫຼ້າສຸດ

·
--
ສັນຍານໝີ
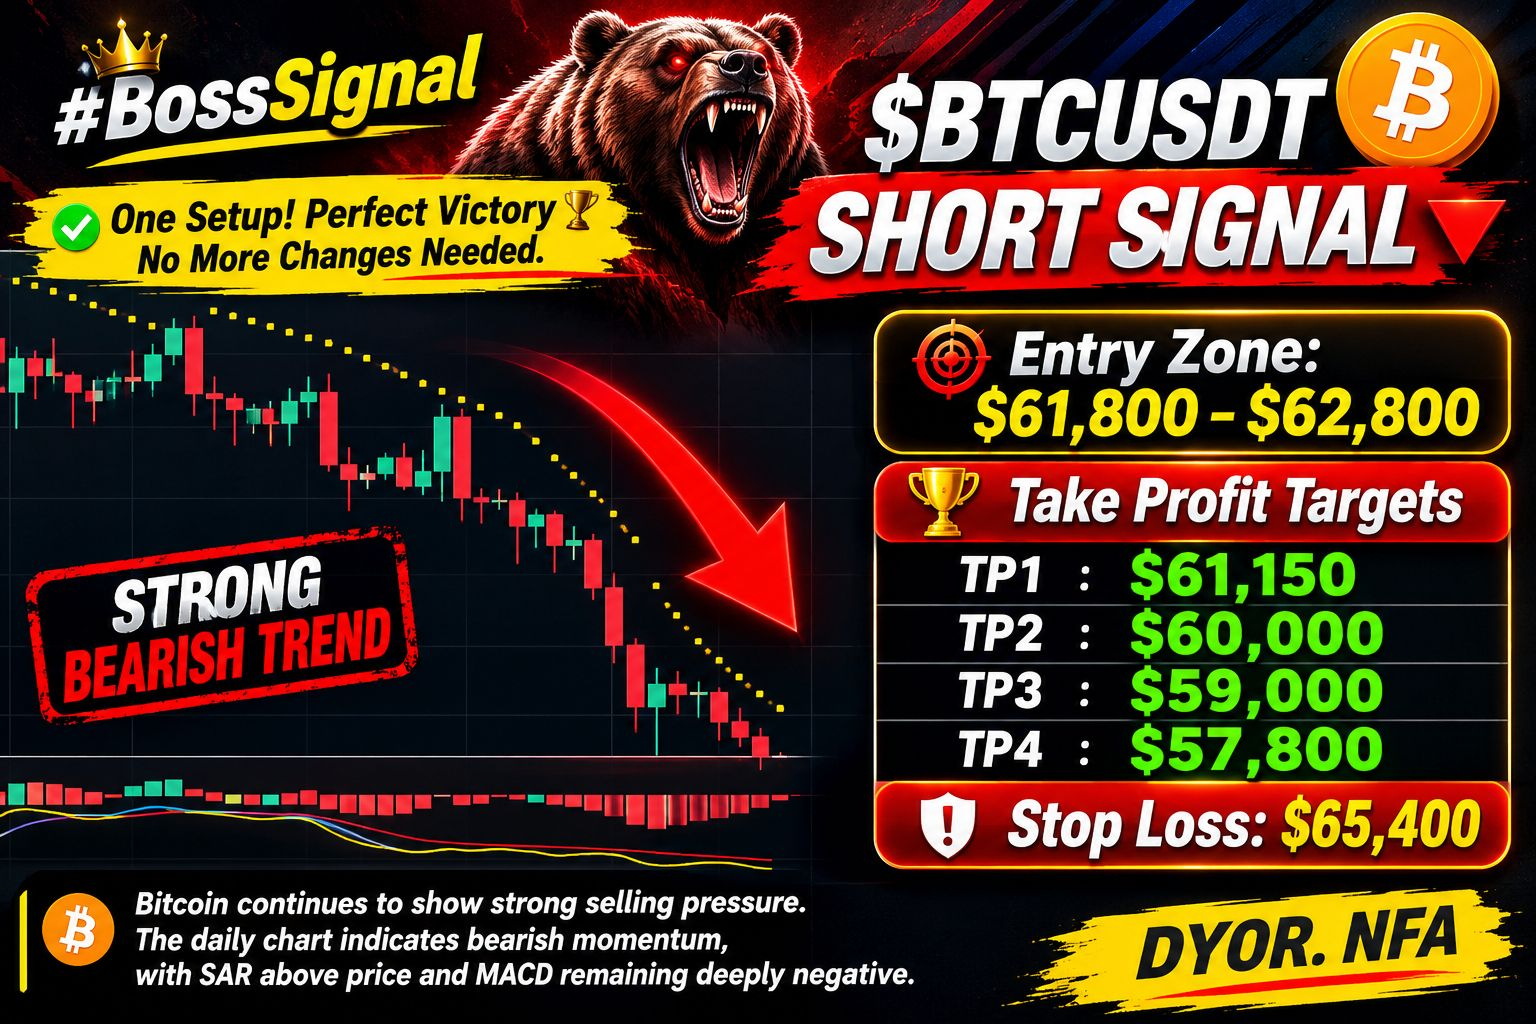
🐻🔴 #BossSignal — $BTC USDT SHORT UPDATE 🏆
One Setup. One Complete Victory! 🎯 No unnecessary changes. No confusion. Just a clear trading plan.
🚨 STRONG BEARISH MOMENTUM
Bitcoin continues to face strong selling pressure on the daily timeframe. SAR remains above price, while MACD confirms bearish momentum.
📉 Our Targets:
TP1: $61,150
TP2: $60,000
TP3: $59,000
TP4: $57,800
🎯 Entry Zone: $61,800–$62,800
🛑 Stop Loss: $65,400
🤫 #BossSignal — Trade with a plan, stay disciplined, and let the market decide.
DYOR. NFA.
#BTC #Bitcoin #CryptoSignals #TradingStrategy
🐻🔴 #BossSignal — $BTC USDT SHORT UPDATE 🏆
One Setup. One Complete Victory! 🎯 No unnecessary changes. No confusion. Just a clear trading plan.
🚨 STRONG BEARISH MOMENTUM
Bitcoin continues to face strong selling pressure on the daily timeframe. SAR remains above price, while MACD confirms bearish momentum.
📉 Our Targets:
TP1: $61,150
TP2: $60,000
TP3: $59,000
TP4: $57,800
🎯 Entry Zone: $61,800–$62,800
🛑 Stop Loss: $65,400
🤫 #BossSignal — Trade with a plan, stay disciplined, and let the market decide.
DYOR. NFA.
#BTC #Bitcoin #CryptoSignals #TradingStrategy
One Setup. One Complete Victory! 🎯 No unnecessary changes. No confusion. Just a clear trading plan.
🚨 STRONG BEARISH MOMENTUM
Bitcoin continues to face strong selling pressure on the daily timeframe. SAR remains above price, while MACD confirms bearish momentum.
📉 Our Targets:
TP1: $61,150
TP2: $60,000
TP3: $59,000
TP4: $57,800
🎯 Entry Zone: $61,800–$62,800
🛑 Stop Loss: $65,400
🤫 #BossSignal — Trade with a plan, stay disciplined, and let the market decide.
DYOR. NFA.
#BTC #Bitcoin #CryptoSignals #TradingStrategy
2
1
172


·
--
ຢືນຢັນແລ້ວ
Sometimes the biggest opportunity comes from watching the opposite side of the market.
$SOXS is an interesting ticker to watch when semiconductor sentiment turns bearish. What catches my attention is its inverse exposure to the semiconductor market, making it a different way to approach short-term market weakness.
But there is something important to understand: $SOXS targets 3x the inverse daily performance of its benchmark, not long-term returns. That leverage brings significant risk, especially during volatile sessions.
My approach is simple: watch market direction, manage position size, and never risk more than I can afford to lose.
I'm curious about your view: Can semiconductor weakness create another opportunity for $SOXS, or will the bulls take control?
#SOXS #Semiconductors #MarketTrends #TradingStrategy
{future}(SOXSUSDT)
Sometimes the biggest opportunity comes from watching the opposite side of the market.
$SOXS is an interesting ticker to watch when semiconductor sentiment turns bearish. What catches my attention is its inverse exposure to the semiconductor market, making it a different way to approach short-term market weakness.
But there is something important to understand: $SOXS targets 3x the inverse daily performance of its benchmark, not long-term returns. That leverage brings significant risk, especially during volatile sessions.
My approach is simple: watch market direction, manage position size, and never risk more than I can afford to lose.
I'm curious about your view: Can semiconductor weakness create another opportunity for $SOXS , or will the bulls take control?
#SOXS #Semiconductors #MarketTrends #TradingStrategy
$SOXS is an interesting ticker to watch when semiconductor sentiment turns bearish. What catches my attention is its inverse exposure to the semiconductor market, making it a different way to approach short-term market weakness.
But there is something important to understand: $SOXS targets 3x the inverse daily performance of its benchmark, not long-term returns. That leverage brings significant risk, especially during volatile sessions.
My approach is simple: watch market direction, manage position size, and never risk more than I can afford to lose.
I'm curious about your view: Can semiconductor weakness create another opportunity for $SOXS , or will the bulls take control?
#SOXS #Semiconductors #MarketTrends #TradingStrategy
399

·
--
🚨 $BTC BELOW $60,000 — THE MARKET IS SENDING A WARNING.
Bitcoin (BTC) has dropped below a psychologically important $60K level, and the latest trading data shows why traders should pay attention.
📊 BINANCE BTCUSDT — November 21:
• Price: $59,000
• 24H Change: -4.88%
• 24H High: $62,639
• 24H Low: $57,778
• 24H Trading Volume: $2.29B
🔥 THE BIGGER STORY:
This isn't just another red candle. Bitcoin is facing pressure from broader risk-asset weakness, while leveraged traders are exposed to further volatility.
🎯 THREE LEVELS TO WATCH:
1. $57,778 — Recent 24H low. A breakdown could increase selling pressure.
2. $60,000 — Key psychological level. Reclaiming it could improve short-term sentiment.
3. $62,639 — Recent 24H high. A recovery toward this zone would signal stronger buyers.
⚠️ TRADING STRATEGY:
Don't blindly buy the dip or chase shorts. Watch how BTC reacts around $60K, confirm volume, and manage risk before entering.
The biggest opportunity in a volatile market is protecting your capital until the direction becomes clearer.
Zyverra tracks the facts, not the hype.
#Bitcoin #BTC #CryptoMarket #TradingStrategy #Zyverra
🚨 $BTC BELOW $60,000 — THE MARKET IS SENDING A WARNING.
Bitcoin (BTC) has dropped below a psychologically important $60K level, and the latest trading data shows why traders should pay attention.
📊 BINANCE BTCUSDT — November 21:
• Price: $59,000
• 24H Change: -4.88%
• 24H High: $62,639
• 24H Low: $57,778
• 24H Trading Volume: $2.29B
🔥 THE BIGGER STORY:
This isn't just another red candle. Bitcoin is facing pressure from broader risk-asset weakness, while leveraged traders are exposed to further volatility.
🎯 THREE LEVELS TO WATCH:
1. $57,778 — Recent 24H low. A breakdown could increase selling pressure.
2. $60,000 — Key psychological level. Reclaiming it could improve short-term sentiment.
3. $62,639 — Recent 24H high. A recovery toward this zone would signal stronger buyers.
⚠️ TRADING STRATEGY:
Don't blindly buy the dip or chase shorts. Watch how BTC reacts around $60K, confirm volume, and manage risk before entering.
The biggest opportunity in a volatile market is protecting your capital until the direction becomes clearer.
Zyverra tracks the facts, not the hype.
#Bitcoin #BTC #CryptoMarket #TradingStrategy #Zyverra
Bitcoin (BTC) has dropped below a psychologically important $60K level, and the latest trading data shows why traders should pay attention.
📊 BINANCE BTCUSDT — November 21:
• Price: $59,000
• 24H Change: -4.88%
• 24H High: $62,639
• 24H Low: $57,778
• 24H Trading Volume: $2.29B
🔥 THE BIGGER STORY:
This isn't just another red candle. Bitcoin is facing pressure from broader risk-asset weakness, while leveraged traders are exposed to further volatility.
🎯 THREE LEVELS TO WATCH:
1. $57,778 — Recent 24H low. A breakdown could increase selling pressure.
2. $60,000 — Key psychological level. Reclaiming it could improve short-term sentiment.
3. $62,639 — Recent 24H high. A recovery toward this zone would signal stronger buyers.
⚠️ TRADING STRATEGY:
Don't blindly buy the dip or chase shorts. Watch how BTC reacts around $60K, confirm volume, and manage risk before entering.
The biggest opportunity in a volatile market is protecting your capital until the direction becomes clearer.
Zyverra tracks the facts, not the hype.
#Bitcoin #BTC #CryptoMarket #TradingStrategy #Zyverra
78

·
--
$SKY /USDT — A Quiet Move Worth Keeping on the Radar
My personal trading approach is simple: I do not judge a coin by one green candle. I watch its price behavior, buying pressure, and ability to hold important levels.
$SKY is trading near $0.04285 with a 5.23% gain over the last 24 hours. I am watching for a possible continuation if buyers remain active.
Potential LONG Setup
- Current Price: $0.04285
- Entry Point (EP): $0.04220 – $0.04285
- TP1: $0.04400
- TP2: $0.04520
- TP3: $0.04650
- Stop Loss (SL): $0.04050
My Trading Experience:
I believe a planned entry is better than emotional buying. If SKY holds the entry range and buying pressure improves, the upper targets may become possible. A loss of support would make me reconsider the setup.
The goal is not to win every trade. The goal is to manage risk consistently.
I am not a financial advisor. Always do your own research (DYOR).
#SKY #CryptoInvesting #TradingStrategy #Binance
$SKY /USDT — A Quiet Move Worth Keeping on the Radar
My personal trading approach is simple: I do not judge a coin by one green candle. I watch its price behavior, buying pressure, and ability to hold important levels.
$SKY is trading near $0.04285 with a 5.23% gain over the last 24 hours. I am watching for a possible continuation if buyers remain active.
Potential LONG Setup
- Current Price: $0.04285
- Entry Point (EP): $0.04220 – $0.04285
- TP1: $0.04400
- TP2: $0.04520
- TP3: $0.04650
- Stop Loss (SL): $0.04050
My Trading Experience:
I believe a planned entry is better than emotional buying. If SKY holds the entry range and buying pressure improves, the upper targets may become possible. A loss of support would make me reconsider the setup.
The goal is not to win every trade. The goal is to manage risk consistently.
I am not a financial advisor. Always do your own research (DYOR).
#SKY #CryptoInvesting #TradingStrategy #Binance
My personal trading approach is simple: I do not judge a coin by one green candle. I watch its price behavior, buying pressure, and ability to hold important levels.
$SKY is trading near $0.04285 with a 5.23% gain over the last 24 hours. I am watching for a possible continuation if buyers remain active.
Potential LONG Setup
- Current Price: $0.04285
- Entry Point (EP): $0.04220 – $0.04285
- TP1: $0.04400
- TP2: $0.04520
- TP3: $0.04650
- Stop Loss (SL): $0.04050
My Trading Experience:
I believe a planned entry is better than emotional buying. If SKY holds the entry range and buying pressure improves, the upper targets may become possible. A loss of support would make me reconsider the setup.
The goal is not to win every trade. The goal is to manage risk consistently.
I am not a financial advisor. Always do your own research (DYOR).
#SKY #CryptoInvesting #TradingStrategy #Binance
360

·
--
ສັນຍານໝີ
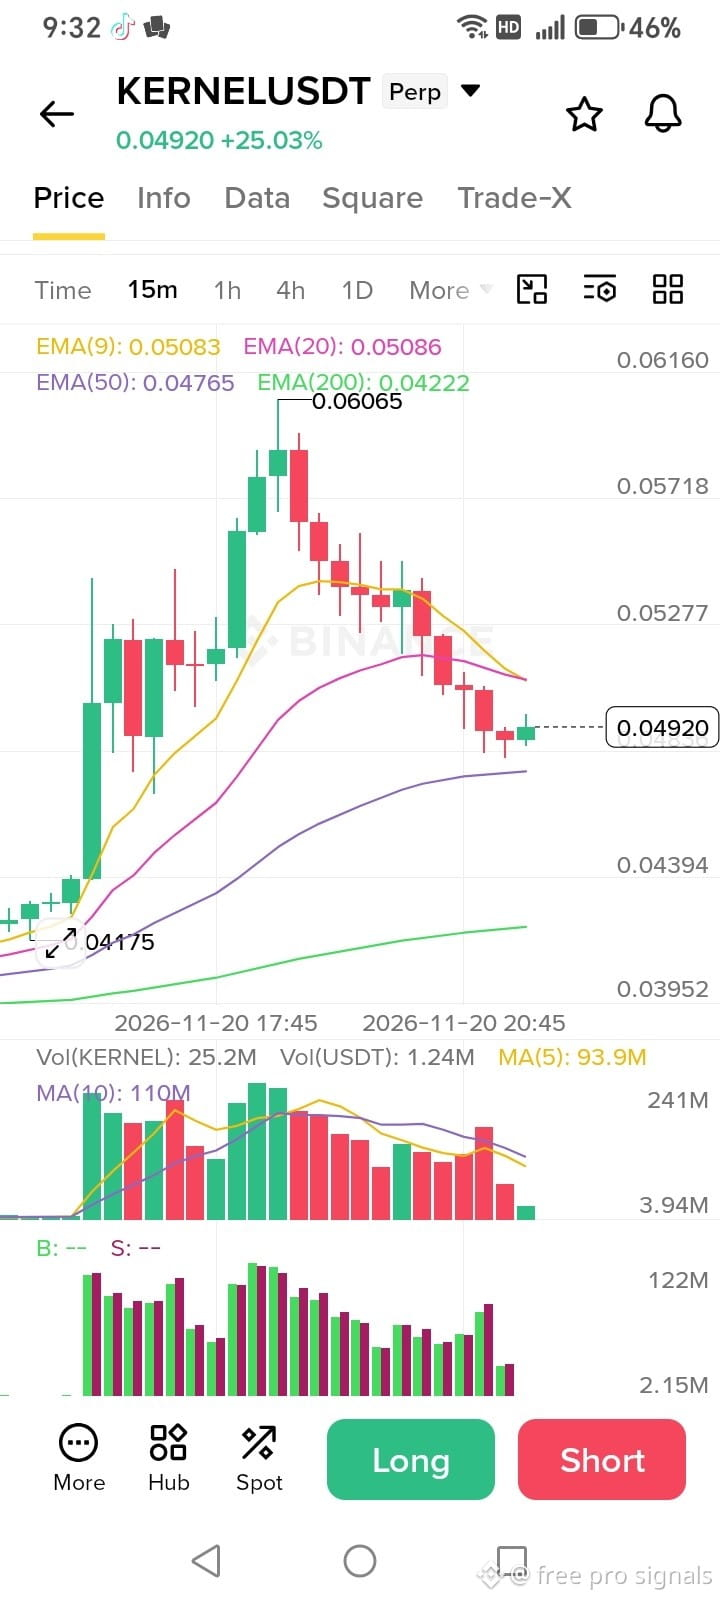
🚨 $KERNEL USDT — SHORT OPPORTUNITY? BEARS TAKING CONTROL! 📉
Short now $KERNEL
{future}(KERNELUSDT)
KERNEL has surged over 25%, but the rejection from $0.06065 is showing signs of short-term selling pressure.
After analyzing price action, volume, liquidity and market structure, I'm watching a potential SHORT setup.
🔴 TRADE SETUP: SHORT
📍 Entry Zone: $0.0476 – $0.0480
🛑 Stop Loss: $0.0533
🎯 TAKE PROFIT TARGETS
TP1: $0.0460
TP2: $0.0445
TP3: $0.0425
⚙️ Leverage: 2x–3x (Isolated)
📊 Entry Confirmation: 15M candle close below $0.0470, followed by a bearish retest of the entry zone.
WHY SHORT? • Strong rejection from $0.06065. • Lower highs on the 15M chart. • Selling pressure after the massive pump. • Buyers still need to reclaim the $0.0510 resistance.
⚠️ IMPORTANT: Do not enter before confirmation. If price holds support and reclaims resistance, this SHORT setup may become invalid.
💬 YOUR MOVE: Are bears preparing another leg down, or will bulls surprise everyone with a recovery?
Comment your target: TP1, TP2 or TP3?
Let's see who reads the market correctly! 🔥
⚠️ Disclaimer: This is a technical trading idea, not financial advice. No setup guarantees profits. Always calculate position size, manage risk and never risk more than you can afford to lose.
#KERNELUSDT #ShortSetup #Altcoins #TechnicalAnalysisPost #FuturesTrading #CryptoSignalsLive #TradingStrategy
🚨 $KERNEL USDT — SHORT OPPORTUNITY? BEARS TAKING CONTROL! 📉
Short now $KERNEL
KERNEL has surged over 25%, but the rejection from $0.06065 is showing signs of short-term selling pressure.
After analyzing price action, volume, liquidity and market structure, I'm watching a potential SHORT setup.
🔴 TRADE SETUP: SHORT
📍 Entry Zone: $0.0476 – $0.0480
🛑 Stop Loss: $0.0533
🎯 TAKE PROFIT TARGETS
TP1: $0.0460
TP2: $0.0445
TP3: $0.0425
⚙️ Leverage: 2x–3x (Isolated)
📊 Entry Confirmation: 15M candle close below $0.0470, followed by a bearish retest of the entry zone.
WHY SHORT? • Strong rejection from $0.06065. • Lower highs on the 15M chart. • Selling pressure after the massive pump. • Buyers still need to reclaim the $0.0510 resistance.
⚠️ IMPORTANT: Do not enter before confirmation. If price holds support and reclaims resistance, this SHORT setup may become invalid.
💬 YOUR MOVE: Are bears preparing another leg down, or will bulls surprise everyone with a recovery?
Comment your target: TP1, TP2 or TP3?
Let's see who reads the market correctly! 🔥
⚠️ Disclaimer: This is a technical trading idea, not financial advice. No setup guarantees profits. Always calculate position size, manage risk and never risk more than you can afford to lose.
#KERNELUSDT #ShortSetup #Altcoins #TechnicalAnalysisPost #FuturesTrading #CryptoSignalsLive #TradingStrategy
Short now $KERNEL
KERNEL has surged over 25%, but the rejection from $0.06065 is showing signs of short-term selling pressure.
After analyzing price action, volume, liquidity and market structure, I'm watching a potential SHORT setup.
🔴 TRADE SETUP: SHORT
📍 Entry Zone: $0.0476 – $0.0480
🛑 Stop Loss: $0.0533
🎯 TAKE PROFIT TARGETS
TP1: $0.0460
TP2: $0.0445
TP3: $0.0425
⚙️ Leverage: 2x–3x (Isolated)
📊 Entry Confirmation: 15M candle close below $0.0470, followed by a bearish retest of the entry zone.
WHY SHORT? • Strong rejection from $0.06065. • Lower highs on the 15M chart. • Selling pressure after the massive pump. • Buyers still need to reclaim the $0.0510 resistance.
⚠️ IMPORTANT: Do not enter before confirmation. If price holds support and reclaims resistance, this SHORT setup may become invalid.
💬 YOUR MOVE: Are bears preparing another leg down, or will bulls surprise everyone with a recovery?
Comment your target: TP1, TP2 or TP3?
Let's see who reads the market correctly! 🔥
⚠️ Disclaimer: This is a technical trading idea, not financial advice. No setup guarantees profits. Always calculate position size, manage risk and never risk more than you can afford to lose.
#KERNELUSDT #ShortSetup #Altcoins #TechnicalAnalysisPost #FuturesTrading #CryptoSignalsLive #TradingStrategy
144

BINANCE CRYPTO LEARNING SERIES — PART 126
🔥 Trading Expectancy: Kya Aapki Strategy Long Term Profit Deti Hai?
Har trade ka profit zaroori nahi, lekin aapki strategy ka long-term result positive hona chahiye.
Expectancy batati hai ke average ek trade se kitna profit ya loss expect kiya ja sakta hai.
📊 Example:
- Win Rate: 50%
- Average Profit: $20
- Average Loss: $10
Yani 10 trades mein 5 wins aur 5 losses par:
Total Profit: $100
Total Loss: $50
Net Profit: $50
🧠 Golden Rule: Sirf Win Rate nahi, Average Profit aur Loss bhi check karein.
Aapki strategy ka Win Rate kitna hai? 👇
#BinanceSquare #tradingStrategy #CryptoTrading #tradingeducation $BTC #BTC
{spot}(BTCUSDT)
BINANCE CRYPTO LEARNING SERIES — PART 126
🔥 Trading Expectancy: Kya Aapki Strategy Long Term Profit Deti Hai?
Har trade ka profit zaroori nahi, lekin aapki strategy ka long-term result positive hona chahiye.
Expectancy batati hai ke average ek trade se kitna profit ya loss expect kiya ja sakta hai.
📊 Example:
- Win Rate: 50%
- Average Profit: $20
- Average Loss: $10
Yani 10 trades mein 5 wins aur 5 losses par:
Total Profit: $100
Total Loss: $50
Net Profit: $50
🧠 Golden Rule: Sirf Win Rate nahi, Average Profit aur Loss bhi check karein.
Aapki strategy ka Win Rate kitna hai? 👇
#BinanceSquare #tradingStrategy #CryptoTrading #tradingeducation $BTC #BTC
🔥 Trading Expectancy: Kya Aapki Strategy Long Term Profit Deti Hai?
Har trade ka profit zaroori nahi, lekin aapki strategy ka long-term result positive hona chahiye.
Expectancy batati hai ke average ek trade se kitna profit ya loss expect kiya ja sakta hai.
📊 Example:
- Win Rate: 50%
- Average Profit: $20
- Average Loss: $10
Yani 10 trades mein 5 wins aur 5 losses par:
Total Profit: $100
Total Loss: $50
Net Profit: $50
🧠 Golden Rule: Sirf Win Rate nahi, Average Profit aur Loss bhi check karein.
Aapki strategy ka Win Rate kitna hai? 👇
#BinanceSquare #tradingStrategy #CryptoTrading #tradingeducation $BTC #BTC

1
54

📗 Liquidity & Volume Playbook: Reading Breakout Confirmations
1. Beyond Price Wicks:
A breakout without sustained spot and perpetual volume often turns into a fakeout trap.
2. Smart Execution Checklist:
• Wait for candle close above resistance.
• Watch funding rates and open interest balance.
• Scale out into strength rather than chasing green candles.
💬 What indicator or confirmation do you trust most?
Trackers: $BTC $SOL $INJ
#TradingStrategy #TechnicalAnalysis #BinanceSquare
📗 Liquidity & Volume Playbook: Reading Breakout Confirmations
1. Beyond Price Wicks:
A breakout without sustained spot and perpetual volume often turns into a fakeout trap.
2. Smart Execution Checklist:
• Wait for candle close above resistance.
• Watch funding rates and open interest balance.
• Scale out into strength rather than chasing green candles.
💬 What indicator or confirmation do you trust most?
Trackers: $BTC $SOL $INJ
#TradingStrategy #TechnicalAnalysis #BinanceSquare
1. Beyond Price Wicks:
A breakout without sustained spot and perpetual volume often turns into a fakeout trap.
2. Smart Execution Checklist:
• Wait for candle close above resistance.
• Watch funding rates and open interest balance.
• Scale out into strength rather than chasing green candles.
💬 What indicator or confirmation do you trust most?
Trackers: $BTC $SOL $INJ
#TradingStrategy #TechnicalAnalysis #BinanceSquare
123

·
--
ບົດຄວາມ
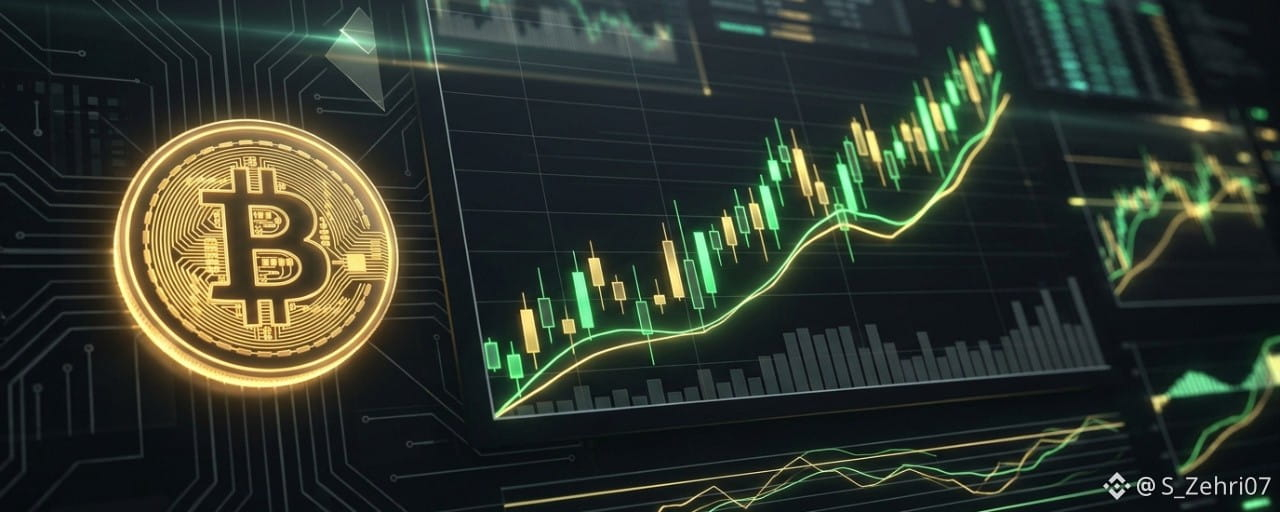
Crypto Market Reset: How to Navigate Bitcoin’s $60K Test Without Getting LiquidatedThe crypto market just delivered a brutal reminder of how quickly sentiment can flip. With total market capitalization sliding toward the $2.0T–$2.2T zone, over $400M in leveraged positions wiped out, and the Fear & Greed Index plunging into extreme fear territory, panic is dominating social feeds.
$BTC recently tested the critical $60,000 psychological threshold following heavy spot ETF outflows and broader macro pressure, dragging $ETH into the $1,700–$1,800 range and pulling SOL back toward the low $70s.
When red candles stack up like this, emotional traders make costly mistakes. Here is a clear, structured breakdown of what is actually driving the sell-off—and how disciplined traders position themselves during high-fear resets.
1. Why Is the Market Pulling Back Right Now?
Understanding the catalyst prevents panic selling at the bottom:
Institutional Flow Rotation: After months of steady inflows, spot Bitcoin ETFs saw over $2.5B in net outflows in mid-November as macro funds reduced risk exposure ahead of interest rate uncertainty.Leverage Flush: Over-leveraged long positions piled up near local highs. Once key intraday support broke, cascading liquidations accelerated the drop far beyond what spot selling alone would cause.Correlation With Tech Equities: Broader risk-off sentiment across traditional tech stocks spilled directly into digital assets, temporarily pressuring high-beta altcoins.
2. Key Levels to Watch on Major Assets
Instead of guessing the exact bottom, focus on objective market structure:
Bitcoin ($BTC): The $58,500–$60,000 zone is the immediate battleground. Holding daily closes above this region signals absorption; losing it cleanly opens the door to deeper liquidity sweeps before a sustained reversal.Ethereum ($ETH): Trading around $1,700–$1,800, $ETH needs to stabilize alongside $BTC before altcoin pairs can regain relative strength.Solana ($SOL): Hovering in the $70–$75 zone, SOL remains one of the highest-beta majors—meaning it drops faster during panics, but historically rebounds sharpest once market liquidity returns.
3. The 3-Step Survival Playbook for Extreme Fear
Historically, Fear & Greed readings near 10 have marked high-value accumulation zones for patient participants, provided you manage risk properly:
Eliminate High Leverage: Volatility spikes in both directions during market resets. Spot positions cannot be liquidated by a sudden 5% wick; 20x leverage can.Scale In Using Tranches (DCA): Never deploy 100% of your capital on a single red candle. Split your entries into 3 or 4 planned tiers across major support zones.Follow Confirmation, Not Emotion: If you are trading short-term momentum rather than investing long-term, wait for a clear higher low and reclaiming of key resistance on strong spot volume before entering.
Final Takeaway
Bearish headlines always feel loudest at local bottoms, just as euphoria peaks at market tops. Leverage gets flushed, weak hands capitulate, and patient capital quietly prepares for the next expansion phase.
What is your game plan right now? Are you accumulating $BTC, $ETH, and at these levels, or waiting on the sidelines in stablecoins for lower prices?
Drop your thoughts in the comments below and follow for daily, no-noise market breakdowns! 👇
$BTC $ETH #bitcoin #CryptoMarket #TradingStrategy #RiskManagement #BinanceSquare
Crypto Market Reset: How to Navigate Bitcoin’s $60K Test Without Getting Liquidated
The crypto market just delivered a brutal reminder of how quickly sentiment can flip. With total market capitalization sliding toward the $2.0T–$2.2T zone, over $400M in leveraged positions wiped out, and the Fear & Greed Index plunging into extreme fear territory, panic is dominating social feeds.
$BTC recently tested the critical $60,000 psychological threshold following heavy spot ETF outflows and broader macro pressure, dragging $ETH into the $1,700–$1,800 range and pulling SOL back toward the low $70s.
When red candles stack up like this, emotional traders make costly mistakes. Here is a clear, structured breakdown of what is actually driving the sell-off—and how disciplined traders position themselves during high-fear resets.
1. Why Is the Market Pulling Back Right Now?
Understanding the catalyst prevents panic selling at the bottom:
Institutional Flow Rotation: After months of steady inflows, spot Bitcoin ETFs saw over $2.5B in net outflows in mid-November as macro funds reduced risk exposure ahead of interest rate uncertainty.Leverage Flush: Over-leveraged long positions piled up near local highs. Once key intraday support broke, cascading liquidations accelerated the drop far beyond what spot selling alone would cause.Correlation With Tech Equities: Broader risk-off sentiment across traditional tech stocks spilled directly into digital assets, temporarily pressuring high-beta altcoins.
2. Key Levels to Watch on Major Assets
Instead of guessing the exact bottom, focus on objective market structure:
Bitcoin ($BTC ): The $58,500–$60,000 zone is the immediate battleground. Holding daily closes above this region signals absorption; losing it cleanly opens the door to deeper liquidity sweeps before a sustained reversal.Ethereum ($ETH): Trading around $1,700–$1,800, $ETH needs to stabilize alongside $BTC before altcoin pairs can regain relative strength.Solana ($SOL): Hovering in the $70–$75 zone, SOL remains one of the highest-beta majors—meaning it drops faster during panics, but historically rebounds sharpest once market liquidity returns.
3. The 3-Step Survival Playbook for Extreme Fear
Historically, Fear & Greed readings near 10 have marked high-value accumulation zones for patient participants, provided you manage risk properly:
Eliminate High Leverage: Volatility spikes in both directions during market resets. Spot positions cannot be liquidated by a sudden 5% wick; 20x leverage can.Scale In Using Tranches (DCA): Never deploy 100% of your capital on a single red candle. Split your entries into 3 or 4 planned tiers across major support zones.Follow Confirmation, Not Emotion: If you are trading short-term momentum rather than investing long-term, wait for a clear higher low and reclaiming of key resistance on strong spot volume before entering.
Final Takeaway
Bearish headlines always feel loudest at local bottoms, just as euphoria peaks at market tops. Leverage gets flushed, weak hands capitulate, and patient capital quietly prepares for the next expansion phase.
What is your game plan right now? Are you accumulating $BTC , $ETH, and at these levels, or waiting on the sidelines in stablecoins for lower prices?
Drop your thoughts in the comments below and follow for daily, no-noise market breakdowns! 👇
$BTC $ETH #bitcoin #CryptoMarket #TradingStrategy #RiskManagement #BinanceSquare
$BTC recently tested the critical $60,000 psychological threshold following heavy spot ETF outflows and broader macro pressure, dragging $ETH into the $1,700–$1,800 range and pulling SOL back toward the low $70s.
When red candles stack up like this, emotional traders make costly mistakes. Here is a clear, structured breakdown of what is actually driving the sell-off—and how disciplined traders position themselves during high-fear resets.
1. Why Is the Market Pulling Back Right Now?
Understanding the catalyst prevents panic selling at the bottom:
Institutional Flow Rotation: After months of steady inflows, spot Bitcoin ETFs saw over $2.5B in net outflows in mid-November as macro funds reduced risk exposure ahead of interest rate uncertainty.Leverage Flush: Over-leveraged long positions piled up near local highs. Once key intraday support broke, cascading liquidations accelerated the drop far beyond what spot selling alone would cause.Correlation With Tech Equities: Broader risk-off sentiment across traditional tech stocks spilled directly into digital assets, temporarily pressuring high-beta altcoins.
2. Key Levels to Watch on Major Assets
Instead of guessing the exact bottom, focus on objective market structure:
Bitcoin ($BTC ): The $58,500–$60,000 zone is the immediate battleground. Holding daily closes above this region signals absorption; losing it cleanly opens the door to deeper liquidity sweeps before a sustained reversal.Ethereum ($ETH): Trading around $1,700–$1,800, $ETH needs to stabilize alongside $BTC before altcoin pairs can regain relative strength.Solana ($SOL): Hovering in the $70–$75 zone, SOL remains one of the highest-beta majors—meaning it drops faster during panics, but historically rebounds sharpest once market liquidity returns.
3. The 3-Step Survival Playbook for Extreme Fear
Historically, Fear & Greed readings near 10 have marked high-value accumulation zones for patient participants, provided you manage risk properly:
Eliminate High Leverage: Volatility spikes in both directions during market resets. Spot positions cannot be liquidated by a sudden 5% wick; 20x leverage can.Scale In Using Tranches (DCA): Never deploy 100% of your capital on a single red candle. Split your entries into 3 or 4 planned tiers across major support zones.Follow Confirmation, Not Emotion: If you are trading short-term momentum rather than investing long-term, wait for a clear higher low and reclaiming of key resistance on strong spot volume before entering.
Final Takeaway
Bearish headlines always feel loudest at local bottoms, just as euphoria peaks at market tops. Leverage gets flushed, weak hands capitulate, and patient capital quietly prepares for the next expansion phase.
What is your game plan right now? Are you accumulating $BTC , $ETH, and at these levels, or waiting on the sidelines in stablecoins for lower prices?
Drop your thoughts in the comments below and follow for daily, no-noise market breakdowns! 👇
$BTC $ETH #bitcoin #CryptoMarket #TradingStrategy #RiskManagement #BinanceSquare
297

·
--
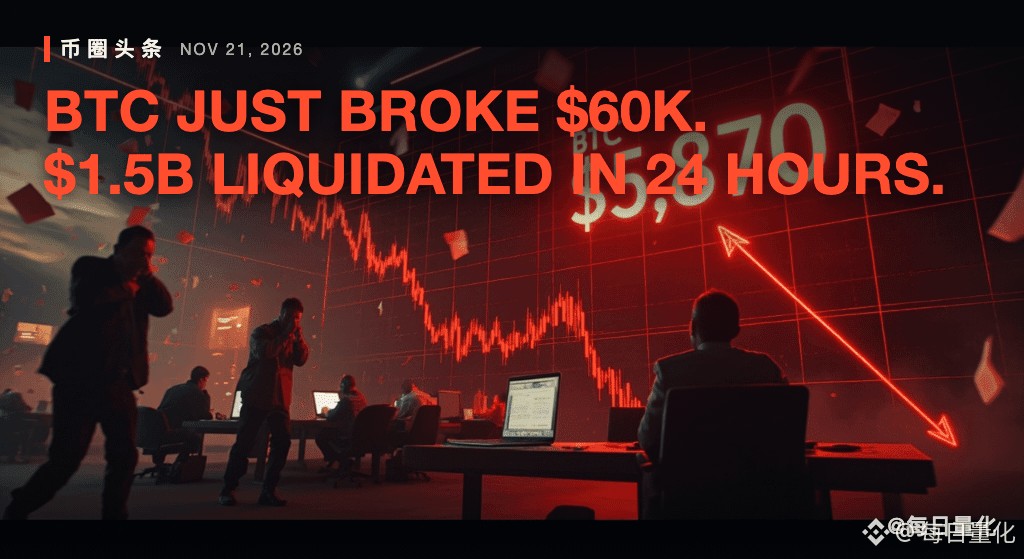
BTC JUST BROKE $60K. $1.5B LIQUIDATED IN 24 HOURS.
🚨 BTC fell below $60,000 overnight for the first time since early July. The "digital gold" story just died in public. BTC is falling WITH stocks, not against them.
1. $BTC sits at $58,870, down 5.6% in 24 hours and 13.6% on the week. Global stocks just logged a 7th straight losing session, the longest run since 2023.
2. The flush found the leverage: $1.5B liquidated in 24 hours, $770M of it in one hour. BlackRock's IBIT bled a record $541.1M in a single day on Thursday.
3. The money did not vanish. It rotated. ARK sold its ETH and SOL ETFs and put $90M into the Anthropic IPO. Ripple's CEO says investors are selling XRP and BTC to buy that stock. One buyer stood against the crowd: Tom Lee's BitMine added 32,447 $ETH.
My take: $BTC touches $57,000 before it reclaims $60,000. Another $180M in long liquidations sits right below it.
What to watch: $57,000. A clean break starts the next liquidation wave. A hold opens a bounce toward $62,000.
Will $BTC hit $57,000 before reclaiming $60,000?
$BTC $ETH #GlobalStocksFaceLongestLosingStreakSince2023 #TradingStrategy #Bitcoin #Ethereum #CryptoMarket
——
全量化交易,抓住每一个市场机会。
BTC JUST BROKE $60K. $1.5B LIQUIDATED IN 24 HOURS.
🚨 BTC fell below $60,000 overnight for the first time since early July. The "digital gold" story just died in public. BTC is falling WITH stocks, not against them.
1. $BTC sits at $58,870, down 5.6% in 24 hours and 13.6% on the week. Global stocks just logged a 7th straight losing session, the longest run since 2023.
2. The flush found the leverage: $1.5B liquidated in 24 hours, $770M of it in one hour. BlackRock's IBIT bled a record $541.1M in a single day on Thursday.
3. The money did not vanish. It rotated. ARK sold its ETH and SOL ETFs and put $90M into the Anthropic IPO. Ripple's CEO says investors are selling XRP and BTC to buy that stock. One buyer stood against the crowd: Tom Lee's BitMine added 32,447 $ETH .
My take: $BTC touches $57,000 before it reclaims $60,000. Another $180M in long liquidations sits right below it.
What to watch: $57,000. A clean break starts the next liquidation wave. A hold opens a bounce toward $62,000.
Will $BTC hit $57,000 before reclaiming $60,000?
$BTC $ETH #GlobalStocksFaceLongestLosingStreakSince2023 #TradingStrategy #Bitcoin #Ethereum #CryptoMarket
——
全量化交易,抓住每一个市场机会。
🚨 BTC fell below $60,000 overnight for the first time since early July. The "digital gold" story just died in public. BTC is falling WITH stocks, not against them.
1. $BTC sits at $58,870, down 5.6% in 24 hours and 13.6% on the week. Global stocks just logged a 7th straight losing session, the longest run since 2023.
2. The flush found the leverage: $1.5B liquidated in 24 hours, $770M of it in one hour. BlackRock's IBIT bled a record $541.1M in a single day on Thursday.
3. The money did not vanish. It rotated. ARK sold its ETH and SOL ETFs and put $90M into the Anthropic IPO. Ripple's CEO says investors are selling XRP and BTC to buy that stock. One buyer stood against the crowd: Tom Lee's BitMine added 32,447 $ETH .
My take: $BTC touches $57,000 before it reclaims $60,000. Another $180M in long liquidations sits right below it.
What to watch: $57,000. A clean break starts the next liquidation wave. A hold opens a bounce toward $62,000.
Will $BTC hit $57,000 before reclaiming $60,000?
$BTC $ETH #GlobalStocksFaceLongestLosingStreakSince2023 #TradingStrategy #Bitcoin #Ethereum #CryptoMarket
——
全量化交易,抓住每一个市场机会。

144

·
--
ສັນຍານກະທິງ
The Waiting Game Is Over When the Chart Finally Gives You a Clear Entry! 🎯
$IDOL $KERNEL $ZS
Don't buy simply because price starts moving. Watch for a breakout with rising volume, then check whether the previous resistance holds as support. That retest could offer a more disciplined entry. If the level fails, step aside and protect your capital.
#CryptoOpportunity #TradingStrategy
{future}(IDOLUSDT)
{future}(KERNELUSDT)
{future}(ZSUSDT)
The Waiting Game Is Over When the Chart Finally Gives You a Clear Entry! 🎯
$IDOL $KERNEL $ZS
Don't buy simply because price starts moving. Watch for a breakout with rising volume, then check whether the previous resistance holds as support. That retest could offer a more disciplined entry. If the level fails, step aside and protect your capital.
#CryptoOpportunity #TradingStrategy
$IDOL $KERNEL $ZS
Don't buy simply because price starts moving. Watch for a breakout with rising volume, then check whether the previous resistance holds as support. That retest could offer a more disciplined entry. If the level fails, step aside and protect your capital.
#CryptoOpportunity #TradingStrategy

2
439
·
--
ສັນຍານກະທິງ
The Market Doesn't Reward Impatience — It Rewards a Well-Planned Entry! 🔥
$EVAA $BLESS $DODOX
Mark the nearest support and resistance levels. If buyers defend support and price begins forming higher lows, momentum may be improving. Wait for confirmation and avoid entering when the risk-to-reward is unattractive.
#TradingStrategy #CryptoMarket
{future}(EVAAUSDT)
{future}(BLESSUSDT)
{future}(DODOXUSDT)
The Market Doesn't Reward Impatience — It Rewards a Well-Planned Entry! 🔥
$EVAA $BLESS $DODOX
Mark the nearest support and resistance levels. If buyers defend support and price begins forming higher lows, momentum may be improving. Wait for confirmation and avoid entering when the risk-to-reward is unattractive.
#TradingStrategy #CryptoMarket
$EVAA $BLESS $DODOX
Mark the nearest support and resistance levels. If buyers defend support and price begins forming higher lows, momentum may be improving. Wait for confirmation and avoid entering when the risk-to-reward is unattractive.
#TradingStrategy #CryptoMarket

3
1.2k
·
--
ສັນຍານກະທິງ
Don't Let the Next Market Move Catch You Without a Plan! 👀
$STABLE $AIN $KO
Focus on liquidity, price stability, and important technical levels. Wait for a clear setup rather than assuming every market movement creates a trading opportunity. Capital protection should always come first.
#TradingStrategy #MarketOpportunity
{future}(STABLEUSDT)
{future}(AINUSDT)
{future}(KOUSDT)
Don't Let the Next Market Move Catch You Without a Plan! 👀
$STABLE $AIN $KO
Focus on liquidity, price stability, and important technical levels. Wait for a clear setup rather than assuming every market movement creates a trading opportunity. Capital protection should always come first.
#TradingStrategy #MarketOpportunity
$STABLE $AIN $KO
Focus on liquidity, price stability, and important technical levels. Wait for a clear setup rather than assuming every market movement creates a trading opportunity. Capital protection should always come first.
#TradingStrategy #MarketOpportunity

3
515

·
--
QVX regime classification: SHORT.
Entry trigger is a rally into the 62,000–62,917 resistance band; that zone capped prior advances and aligns with the suggested sell-into-strength approach. Invalidation sits above 62,917 on a daily close. First target is 58,055 support, with a secondary objective near 57,400 if momentum accelerates. Stop placement above resistance keeps risk tight relative to reward, roughly 1:2. Position sizing is reduced given the 7.8% range between key levels. The Strategy treasury drawdown is a sentiment headwind, but QVX trades price structure, not headlines. Price remains below resistance, so the short bias holds. 📉
Full QVX strategy details & real-time signals here: https://www.qilanx.com/ledger-archive
#QVX #BTC #TradingStrategy
Stay disciplined.
QVX regime classification: SHORT.
Entry trigger is a rally into the 62,000–62,917 resistance band; that zone capped prior advances and aligns with the suggested sell-into-strength approach. Invalidation sits above 62,917 on a daily close. First target is 58,055 support, with a secondary objective near 57,400 if momentum accelerates. Stop placement above resistance keeps risk tight relative to reward, roughly 1:2. Position sizing is reduced given the 7.8% range between key levels. The Strategy treasury drawdown is a sentiment headwind, but QVX trades price structure, not headlines. Price remains below resistance, so the short bias holds. 📉
Full QVX strategy details & real-time signals here: https://www.qilanx.com/ledger-archive
#QVX #BTC #TradingStrategy
Stay disciplined.
Entry trigger is a rally into the 62,000–62,917 resistance band; that zone capped prior advances and aligns with the suggested sell-into-strength approach. Invalidation sits above 62,917 on a daily close. First target is 58,055 support, with a secondary objective near 57,400 if momentum accelerates. Stop placement above resistance keeps risk tight relative to reward, roughly 1:2. Position sizing is reduced given the 7.8% range between key levels. The Strategy treasury drawdown is a sentiment headwind, but QVX trades price structure, not headlines. Price remains below resistance, so the short bias holds. 📉
Full QVX strategy details & real-time signals here: https://www.qilanx.com/ledger-archive
#QVX #BTC #TradingStrategy
Stay disciplined.
43
·
--
ສັນຍານກະທິງ
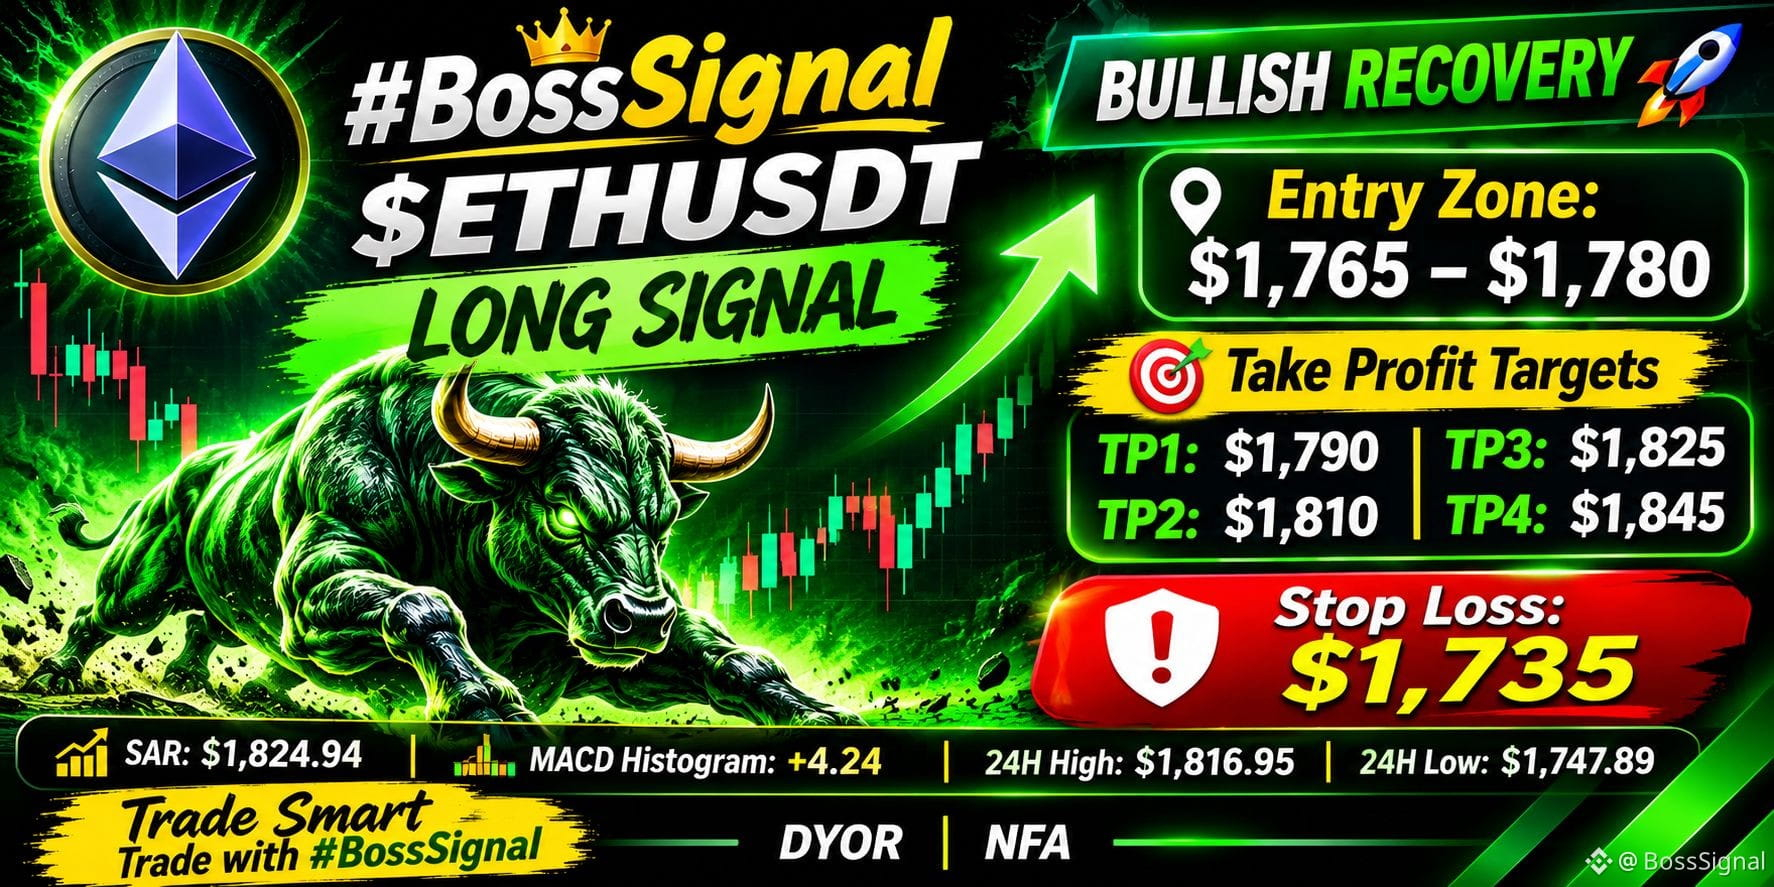
🐻🟢 #BossSigna l — $ETH USDT LONG SIGNAL! 🚀
Ethereum bullish recovery watch! 📈
🎯 Entry Zone: $1,765 – $1,780
💰 Take Profit Targets:
TP1: $1,790
TP2: $1,810
TP3: $1,825
TP4: $1,845
🛑 Stop Loss: $1,735
🔥 The focus is on a potential bullish recovery. Watch the key resistance levels and follow the trading plan with proper risk management.
🏆 Stay disciplined. Trade smart. Let the setup play out!
#BossSignal 👊
#ETH #Ethereum #ETHUSDT #CryptoSignals #BinanceSquare #TradingStrategy
DYOR | NFA
🐻🟢 #BossSigna l — $ETH USDT LONG SIGNAL! 🚀
Ethereum bullish recovery watch! 📈
🎯 Entry Zone: $1,765 – $1,780
💰 Take Profit Targets:
TP1: $1,790
TP2: $1,810
TP3: $1,825
TP4: $1,845
🛑 Stop Loss: $1,735
🔥 The focus is on a potential bullish recovery. Watch the key resistance levels and follow the trading plan with proper risk management.
🏆 Stay disciplined. Trade smart. Let the setup play out!
#BossSignal 👊
#ETH #Ethereum #ETHUSDT #CryptoSignals #BinanceSquare #TradingStrategy
DYOR | NFA
Ethereum bullish recovery watch! 📈
🎯 Entry Zone: $1,765 – $1,780
💰 Take Profit Targets:
TP1: $1,790
TP2: $1,810
TP3: $1,825
TP4: $1,845
🛑 Stop Loss: $1,735
🔥 The focus is on a potential bullish recovery. Watch the key resistance levels and follow the trading plan with proper risk management.
🏆 Stay disciplined. Trade smart. Let the setup play out!
#BossSignal 👊
#ETH #Ethereum #ETHUSDT #CryptoSignals #BinanceSquare #TradingStrategy
DYOR | NFA
1
1
245

·
--
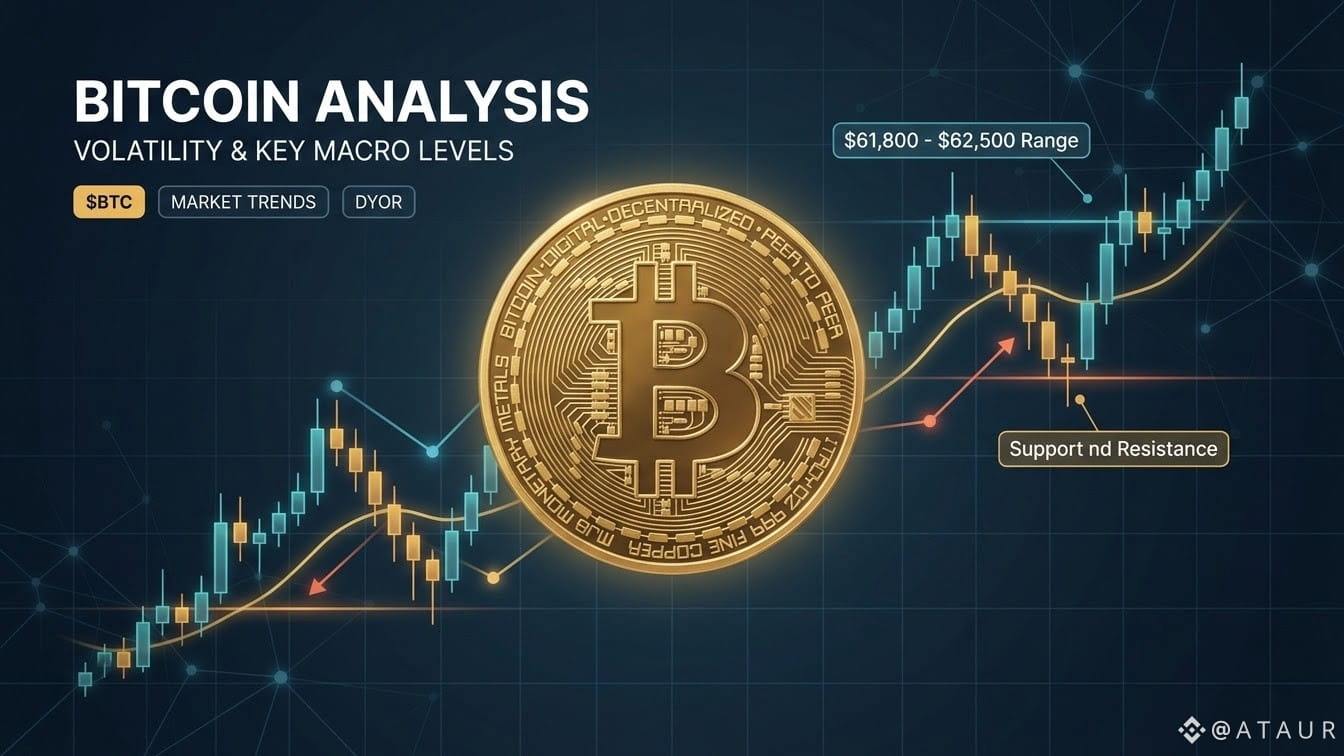
BTC Around $61K–$62K: Relief Bounce or Still Under Macro Pressure? 📊
Crypto traders are watching every move as $BTC hovers around the $61,700–$62,000 zone amid mixed market signals. On one hand, short-term relief moves keep intraday traders active; on the other hand, macro headlines—including interest rate expectations, ETF outflow discussions, and broader risk sentiment—are keeping volatility elevated.
3 Things Traders Are Watching Right Now:
1. Key Price Levels & Liquidity: Whether $BTC can hold support and build momentum or face another liquidity sweep.
2. Macro & Liquidity Triggers: Rate expectations and institutional flows continue to shape short-term direction.
3. Sector Rotation ($BNB, AI & RWA): While majors consolidate, traders are paying close attention to high-activity ecosystems like $BNB Chain alongside AI and tokenized real-world asset narratives.
My Take: In choppy markets, chasing sudden green candles or over-leveraging is one of the fastest ways to get wiped out. Waiting for clear confirmation, managing position size, and respecting stop-losses matters far more than predicting every tick.
What’s your move right now—accumulating in ranges, waiting for a clearer breakout, or staying on the sidelines? Drop your thoughts below! 👇
Disclaimer: This post is for informational purposes only and is not financial advice. Always do your own research (DYOR).
#BinanceSquare #bitcoin #BTC #CryptoMarket #tradingStrategy
BTC Around $61K–$62K: Relief Bounce or Still Under Macro Pressure? 📊
Crypto traders are watching every move as $BTC hovers around the $61,700–$62,000 zone amid mixed market signals. On one hand, short-term relief moves keep intraday traders active; on the other hand, macro headlines—including interest rate expectations, ETF outflow discussions, and broader risk sentiment—are keeping volatility elevated.
3 Things Traders Are Watching Right Now:
1. Key Price Levels & Liquidity: Whether $BTC can hold support and build momentum or face another liquidity sweep.
2. Macro & Liquidity Triggers: Rate expectations and institutional flows continue to shape short-term direction.
3. Sector Rotation ($BNB, AI & RWA): While majors consolidate, traders are paying close attention to high-activity ecosystems like $BNB Chain alongside AI and tokenized real-world asset narratives.
My Take: In choppy markets, chasing sudden green candles or over-leveraging is one of the fastest ways to get wiped out. Waiting for clear confirmation, managing position size, and respecting stop-losses matters far more than predicting every tick.
What’s your move right now—accumulating in ranges, waiting for a clearer breakout, or staying on the sidelines? Drop your thoughts below! 👇
Disclaimer: This post is for informational purposes only and is not financial advice. Always do your own research (DYOR).
#BinanceSquare #bitcoin #BTC #CryptoMarket #tradingStrategy
Crypto traders are watching every move as $BTC hovers around the $61,700–$62,000 zone amid mixed market signals. On one hand, short-term relief moves keep intraday traders active; on the other hand, macro headlines—including interest rate expectations, ETF outflow discussions, and broader risk sentiment—are keeping volatility elevated.
3 Things Traders Are Watching Right Now:
1. Key Price Levels & Liquidity: Whether $BTC can hold support and build momentum or face another liquidity sweep.
2. Macro & Liquidity Triggers: Rate expectations and institutional flows continue to shape short-term direction.
3. Sector Rotation ($BNB, AI & RWA): While majors consolidate, traders are paying close attention to high-activity ecosystems like $BNB Chain alongside AI and tokenized real-world asset narratives.
My Take: In choppy markets, chasing sudden green candles or over-leveraging is one of the fastest ways to get wiped out. Waiting for clear confirmation, managing position size, and respecting stop-losses matters far more than predicting every tick.
What’s your move right now—accumulating in ranges, waiting for a clearer breakout, or staying on the sidelines? Drop your thoughts below! 👇
Disclaimer: This post is for informational purposes only and is not financial advice. Always do your own research (DYOR).
#BinanceSquare #bitcoin #BTC #CryptoMarket #tradingStrategy
80
·
--
ສັນຍານກະທິງ
A Clear Market Setup Is Worth More Than a Hundred Predictions! 📊
$HD $CYBER $TMF
Identify the trend, mark support and resistance, and wait for confirmation before entering. These are different types of market-linked assets, so understand their individual risks and trading characteristics first.
#MarketAnalysis #TradingStrategy @CZ @Square-Creator-413287043 @Square-Creator-5565dccc3bd17
{future}(HDUSDT)
{future}(CYBERUSDT)
{future}(TMFUSDT)
A Clear Market Setup Is Worth More Than a Hundred Predictions! 📊
$HD $CYBER $TMF
Identify the trend, mark support and resistance, and wait for confirmation before entering. These are different types of market-linked assets, so understand their individual risks and trading characteristics first.
#MarketAnalysis #TradingStrategy @CZ @marvtrader @成都-金元宝
$HD $CYBER $TMF
Identify the trend, mark support and resistance, and wait for confirmation before entering. These are different types of market-linked assets, so understand their individual risks and trading characteristics first.
#MarketAnalysis #TradingStrategy @CZ @marvtrader @成都-金元宝


3
161
One Market Shift Can Change the Entire Trading Picture! 👀
$SQQQ $BLESS $CYBER
Watch momentum carefully and identify whether buyers or sellers are gaining control. Look for volume confirmation before considering an entry. Remember, inverse leveraged products such as SQQQ carry additional risks and aren't suitable for careless holding.
@CZ @Square-Creator-5565dccc3bd17 @Square-Creator-413287043
#MarketOpportunity #TradingStrategy
{future}(SQQQUSDT)
{future}(BLESSUSDT)
{future}(CYBERUSDT)
One Market Shift Can Change the Entire Trading Picture! 👀
$SQQQ $BLESS $CYBER
Watch momentum carefully and identify whether buyers or sellers are gaining control. Look for volume confirmation before considering an entry. Remember, inverse leveraged products such as SQQQ carry additional risks and aren't suitable for careless holding.
@CZ @成都-金元宝 @marvtrader
#MarketOpportunity #TradingStrategy
$SQQQ $BLESS $CYBER
Watch momentum carefully and identify whether buyers or sellers are gaining control. Look for volume confirmation before considering an entry. Remember, inverse leveraged products such as SQQQ carry additional risks and aren't suitable for careless holding.
@CZ @成都-金元宝 @marvtrader
#MarketOpportunity #TradingStrategy

1
475
·
--
QVX price-volume analysis points SHORT.
Entry is prioritized near resistance at 64060.01 on any rally; if price fails to reclaim that level, the short stays valid. Downside targets are support at 61230.0, with a secondary zone below it. Current price is 61882.0, already in profit from yesterday's position, so stop placement can be tightened above resistance to protect gains. Risk is capped at 1% of equity per trade. 📉 The Hayes headline is background only; it confirms the QVX SHORT view but does not drive the setup. Position sizing stays fixed, and no adds occur unless price retests resistance on declining volume.
#QVX #BTC #TradingStrategy
QVX price-volume analysis points SHORT.
Entry is prioritized near resistance at 64060.01 on any rally; if price fails to reclaim that level, the short stays valid. Downside targets are support at 61230.0, with a secondary zone below it. Current price is 61882.0, already in profit from yesterday's position, so stop placement can be tightened above resistance to protect gains. Risk is capped at 1% of equity per trade. 📉 The Hayes headline is background only; it confirms the QVX SHORT view but does not drive the setup. Position sizing stays fixed, and no adds occur unless price retests resistance on declining volume.
#QVX #BTC #TradingStrategy
Entry is prioritized near resistance at 64060.01 on any rally; if price fails to reclaim that level, the short stays valid. Downside targets are support at 61230.0, with a secondary zone below it. Current price is 61882.0, already in profit from yesterday's position, so stop placement can be tightened above resistance to protect gains. Risk is capped at 1% of equity per trade. 📉 The Hayes headline is background only; it confirms the QVX SHORT view but does not drive the setup. Position sizing stays fixed, and no adds occur unless price retests resistance on declining volume.
#QVX #BTC #TradingStrategy
73

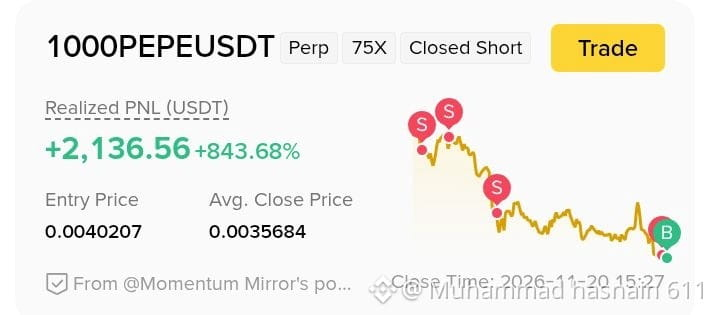
🔥 PEPE SHORT TRADE: A MASSIVE $2,136 PROFIT! 🐸
Sometimes the biggest opportunities appear when the market moves in the opposite direction of popular expectations.
A recent 1000PEPEUSDT Perpetual Short Trade delivered an impressive result:
📊 Trade Breakdown:
- Trading Pair: 1000PEPEUSDT
- Position: SHORT 🔴
- Leverage: 75X
- Entry Price: 0.0040207
- Average Close Price: 0.0035684
- Realized Profit: +2,136.56 USDT
- ROI: +843.68%
The strategy was simple: identify the downward move, stay disciplined, and close the short position at a lower price.
🐸 PEPE reminds us that opportunities exist in both directions. Bulls look for breakouts, while smart bears look for breakdowns.
But remember, 75X leverage carries extreme liquidation risk. One wrong move can wipe out a position.
What's your strategy right now? Are you BULLISH or BEARISH on PEPE? 👇
#PEPE #1000PEPE #BinanceFutures #CryptoTrading #tradingStrategy
🔥 PEPE SHORT TRADE: A MASSIVE $2,136 PROFIT! 🐸
Sometimes the biggest opportunities appear when the market moves in the opposite direction of popular expectations.
A recent 1000PEPEUSDT Perpetual Short Trade delivered an impressive result:
📊 Trade Breakdown:
- Trading Pair: 1000PEPEUSDT
- Position: SHORT 🔴
- Leverage: 75X
- Entry Price: 0.0040207
- Average Close Price: 0.0035684
- Realized Profit: +2,136.56 USDT
- ROI: +843.68%
The strategy was simple: identify the downward move, stay disciplined, and close the short position at a lower price.
🐸 PEPE reminds us that opportunities exist in both directions. Bulls look for breakouts, while smart bears look for breakdowns.
But remember, 75X leverage carries extreme liquidation risk. One wrong move can wipe out a position.
What's your strategy right now? Are you BULLISH or BEARISH on PEPE? 👇
#PEPE #1000PEPE #BinanceFutures #CryptoTrading #tradingStrategy
Sometimes the biggest opportunities appear when the market moves in the opposite direction of popular expectations.
A recent 1000PEPEUSDT Perpetual Short Trade delivered an impressive result:
📊 Trade Breakdown:
- Trading Pair: 1000PEPEUSDT
- Position: SHORT 🔴
- Leverage: 75X
- Entry Price: 0.0040207
- Average Close Price: 0.0035684
- Realized Profit: +2,136.56 USDT
- ROI: +843.68%
The strategy was simple: identify the downward move, stay disciplined, and close the short position at a lower price.
🐸 PEPE reminds us that opportunities exist in both directions. Bulls look for breakouts, while smart bears look for breakdowns.
But remember, 75X leverage carries extreme liquidation risk. One wrong move can wipe out a position.
What's your strategy right now? Are you BULLISH or BEARISH on PEPE? 👇
#PEPE #1000PEPE #BinanceFutures #CryptoTrading #tradingStrategy
87


ບົດຄວາມ
🚨 CRYPTO CRASH OR GOLDEN OPPORTUNITY? Bitcoin Drops Below $62,000! What Should Traders Do Now? 📉🔥The crypto market is at a very critical turning point right now! After 7 straight weeks of decline,BTC touched its lowest level since July (around $61,800) today, pushing the market into Extreme Fear (Fear & Greed Index: 11).
The big question for every trader is: Is this time to panic sell or look for smart entries? Let’s break down today’s biggest market updates and key trading levels in simple words:
1️⃣ Why Is the Market Dropping?
Massive ETF Outflows: Over $1.1 Billion flowed out of US Spot Bitcoin ETFs this week, creating strong short-term selling pressure.Tech & AI Rotation: Following Wall Street's excitement around Anthropic’s record IPO, some big investors moved liquidity from crypto into AI stocks. However, select AI-related crypto tokens are still showing strength compared to the rest of the market.
2️⃣ Crucial Trading Levels to Watch Today 📊
Bitcoin ($BTC): If BTC holds the $61,200 – $61,500 support zone, we could see a fast relief bounce (short squeeze) back toward $64,000. If this support breaks, the next major floor sits near $58,000.Ethereum ($ETH): ETH is currently under pressure in the $1,730 – $1,800 range. Avoid aggressive long positions until a strong candle closes above $1,850.Ripple ($XRP): Despite the broader market drop, XRP is holding relatively steady around $0.90 – $1.00, as shrinking exchange reserves keep whales interested.
3️⃣ Smart Strategy for Traders Right Now 💡
Avoid High Leverage & FOMO: Volatility is extremely high today. Keep your position sizes small and always protect your capital with a Stop-Loss.Use DCA (Dollar-Cost Averaging): Instead of buying all at once, plan small entries near strong support zones.
⚠️ Disclaimer: This post is for educational and market update purposes only, not financial advice. Always Do Your Own Research (DYOR) before trading.
👇 What is your next move? Will BTC bounce from here or drop to $58K? Share your prediction in the comments and click the coin cashtags above to check live charts! 💬🚀
$BTC
{spot}(BTCUSDT)
$ETH
{spot}(ETHUSDT)
$XRP
{future}(XRPUSDT)
#BinanceSquare #CryptoNewss #Ethereum #XRP #TradingStrategy
🚨 CRYPTO CRASH OR GOLDEN OPPORTUNITY? Bitcoin Drops Below $62,000! What Should Traders Do Now? 📉🔥
The crypto market is at a very critical turning point right now! After 7 straight weeks of decline,BTC touched its lowest level since July (around $61,800) today, pushing the market into Extreme Fear (Fear & Greed Index: 11).
The big question for every trader is: Is this time to panic sell or look for smart entries? Let’s break down today’s biggest market updates and key trading levels in simple words:
1️⃣ Why Is the Market Dropping?
Massive ETF Outflows: Over $1.1 Billion flowed out of US Spot Bitcoin ETFs this week, creating strong short-term selling pressure.Tech & AI Rotation: Following Wall Street's excitement around Anthropic’s record IPO, some big investors moved liquidity from crypto into AI stocks. However, select AI-related crypto tokens are still showing strength compared to the rest of the market.
2️⃣ Crucial Trading Levels to Watch Today 📊
Bitcoin ($BTC ): If BTC holds the $61,200 – $61,500 support zone, we could see a fast relief bounce (short squeeze) back toward $64,000. If this support breaks, the next major floor sits near $58,000.Ethereum ($ETH ): ETH is currently under pressure in the $1,730 – $1,800 range. Avoid aggressive long positions until a strong candle closes above $1,850.Ripple ($XRP ): Despite the broader market drop, XRP is holding relatively steady around $0.90 – $1.00, as shrinking exchange reserves keep whales interested.
3️⃣ Smart Strategy for Traders Right Now 💡
Avoid High Leverage & FOMO: Volatility is extremely high today. Keep your position sizes small and always protect your capital with a Stop-Loss.Use DCA (Dollar-Cost Averaging): Instead of buying all at once, plan small entries near strong support zones.
⚠️ Disclaimer: This post is for educational and market update purposes only, not financial advice. Always Do Your Own Research (DYOR) before trading.
👇 What is your next move? Will BTC bounce from here or drop to $58K? Share your prediction in the comments and click the coin cashtags above to check live charts! 💬🚀
$BTC
$ETH
$XRP
#BinanceSquare #CryptoNewss #Ethereum #XRP #TradingStrategy
The big question for every trader is: Is this time to panic sell or look for smart entries? Let’s break down today’s biggest market updates and key trading levels in simple words:
1️⃣ Why Is the Market Dropping?
Massive ETF Outflows: Over $1.1 Billion flowed out of US Spot Bitcoin ETFs this week, creating strong short-term selling pressure.Tech & AI Rotation: Following Wall Street's excitement around Anthropic’s record IPO, some big investors moved liquidity from crypto into AI stocks. However, select AI-related crypto tokens are still showing strength compared to the rest of the market.
2️⃣ Crucial Trading Levels to Watch Today 📊
Bitcoin ($BTC ): If BTC holds the $61,200 – $61,500 support zone, we could see a fast relief bounce (short squeeze) back toward $64,000. If this support breaks, the next major floor sits near $58,000.Ethereum ($ETH ): ETH is currently under pressure in the $1,730 – $1,800 range. Avoid aggressive long positions until a strong candle closes above $1,850.Ripple ($XRP ): Despite the broader market drop, XRP is holding relatively steady around $0.90 – $1.00, as shrinking exchange reserves keep whales interested.
3️⃣ Smart Strategy for Traders Right Now 💡
Avoid High Leverage & FOMO: Volatility is extremely high today. Keep your position sizes small and always protect your capital with a Stop-Loss.Use DCA (Dollar-Cost Averaging): Instead of buying all at once, plan small entries near strong support zones.
⚠️ Disclaimer: This post is for educational and market update purposes only, not financial advice. Always Do Your Own Research (DYOR) before trading.
👇 What is your next move? Will BTC bounce from here or drop to $58K? Share your prediction in the comments and click the coin cashtags above to check live charts! 💬🚀
$BTC
$ETH
$XRP
#BinanceSquare #CryptoNewss #Ethereum #XRP #TradingStrategy
5
ເຂົ້າສູ່ລະບົບເພື່ອສຳຫຼວດເນື້ອຫາເພີ່ມເຕີມ
ເຂົ້າຮ່ວມກຸ່ມຜູ້ໃຊ້ຄຣິບໂຕທົ່ວໂລກໃນ Binance Square.
⚡️ ໄດ້ຮັບຂໍ້ມູນຫຼ້າສຸດ ແລະ ທີ່ມີປະໂຫຍດກ່ຽວກັບຄຣິບໂຕ.
💬 ໄດ້ຮັບຄວາມໄວ້ວາງໃຈຈາກຕະຫຼາດແລກປ່ຽນຄຣິບໂຕທີ່ໃຫຍ່ທີ່ສຸດໃນໂລກ.
👍 ຄົ້ນຫາຂໍ້ມູນເຊີງເລິກທີ່ແທ້ຈາກນັກສ້າງທີ່ໄດ້ຮັບການຢືນຢັນ.
ອີເມວ / ເບີໂທລະສັບ
ຫົວຂໍ້ທີ່ກໍາລັງນິຍົມ
1
#CanBTCReboundAfterFallingBelow60K?
272,929 ຄັ້ງທີ່ເບິ່ງ
1,240 ກຳລັງສົນທະນາ
2
#GlobalStocksFaceLongestLosingStreakSince2023
92,503 ຄັ້ງທີ່ເບິ່ງ
907 ກຳລັງສົນທະນາ
3
#AnthropicPlungesTowardIPOPriceonDay2
45,433 ຄັ້ງທີ່ເບິ່ງ
474 ກຳລັງສົນທະນາ
4
#TwentyOneCapitalAdds172.25BTC
876 ຄັ້ງທີ່ເບິ່ງ
59 ກຳລັງສົນທະນາ
5
#HKBillWouldExcludeTokenizedDepositsFromVirtualAssets
232 ຄັ້ງທີ່ເບິ່ງ
11 ກຳລັງສົນທະນາ
6
#BNBDropsBelow540USDTWith8.46%DailyDecline
20,454 ຄັ້ງທີ່ເບິ່ງ
164 ກຳລັງສົນທະນາ
7
#HKBillProposesHK$100KFineForUnauthorizedCryptoTitles
702 ຄັ້ງທີ່ເບິ່ງ
12 ກຳລັງສົນທະນາ
8
#BitMineFaces$10.1BUnrealizedETHLoss
1,554 ຄັ້ງທີ່ເບິ່ງ
15 ກຳລັງສົນທະນາ
9
#StrategyReports$35BNetReserves
1,098 ຄັ້ງທີ່ເບິ່ງ
14 ກຳລັງສົນທະນາ
10
#MorganStanleyEndsAnthropicStockSupportAfterOneDay
9,319 ຄັ້ງທີ່ເບິ່ງ
115 ກຳລັງສົນທະນາ