

#etcusd
etcusd
79,919 ຄັ້ງທີ່ເບິ່ງ
125 ກຳລັງສົນທະນາ
ມາແຮງ
ຫຼ້າສຸດ

Got it - here is a fresh one for $ETC:
> *$ETC TRADERS, LISTEN UP! 👇*
> Ethereum Classic is moving - volatility is here, and so is the opportunity.
> No sideways boredom, only clean pumps and dips to trade.
> This is the time to trade $ETC, not just hold it.
> *Are you Long or Short?* 📊💸
#Binance #Crypto #ETCUSD #BinanceSquare #trading
{spot}(ETCUSDT)
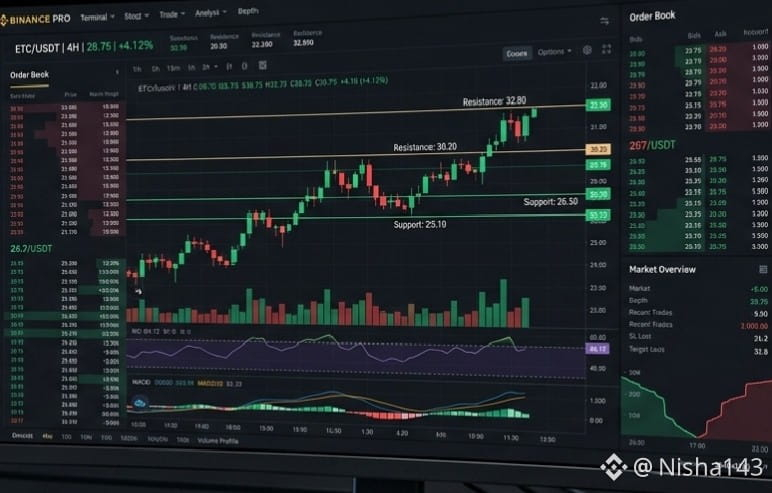
Got it - here is a fresh one for $ETC :
> *$ETC TRADERS, LISTEN UP! 👇*
> Ethereum Classic is moving - volatility is here, and so is the opportunity.
> No sideways boredom, only clean pumps and dips to trade.
> This is the time to trade $ETC , not just hold it.
> *Are you Long or Short?* 📊💸
#Binance #Crypto #ETCUSD #BinanceSquare #trading
> *$ETC TRADERS, LISTEN UP! 👇*
> Ethereum Classic is moving - volatility is here, and so is the opportunity.
> No sideways boredom, only clean pumps and dips to trade.
> This is the time to trade $ETC , not just hold it.
> *Are you Long or Short?* 📊💸
#Binance #Crypto #ETCUSD #BinanceSquare #trading
1

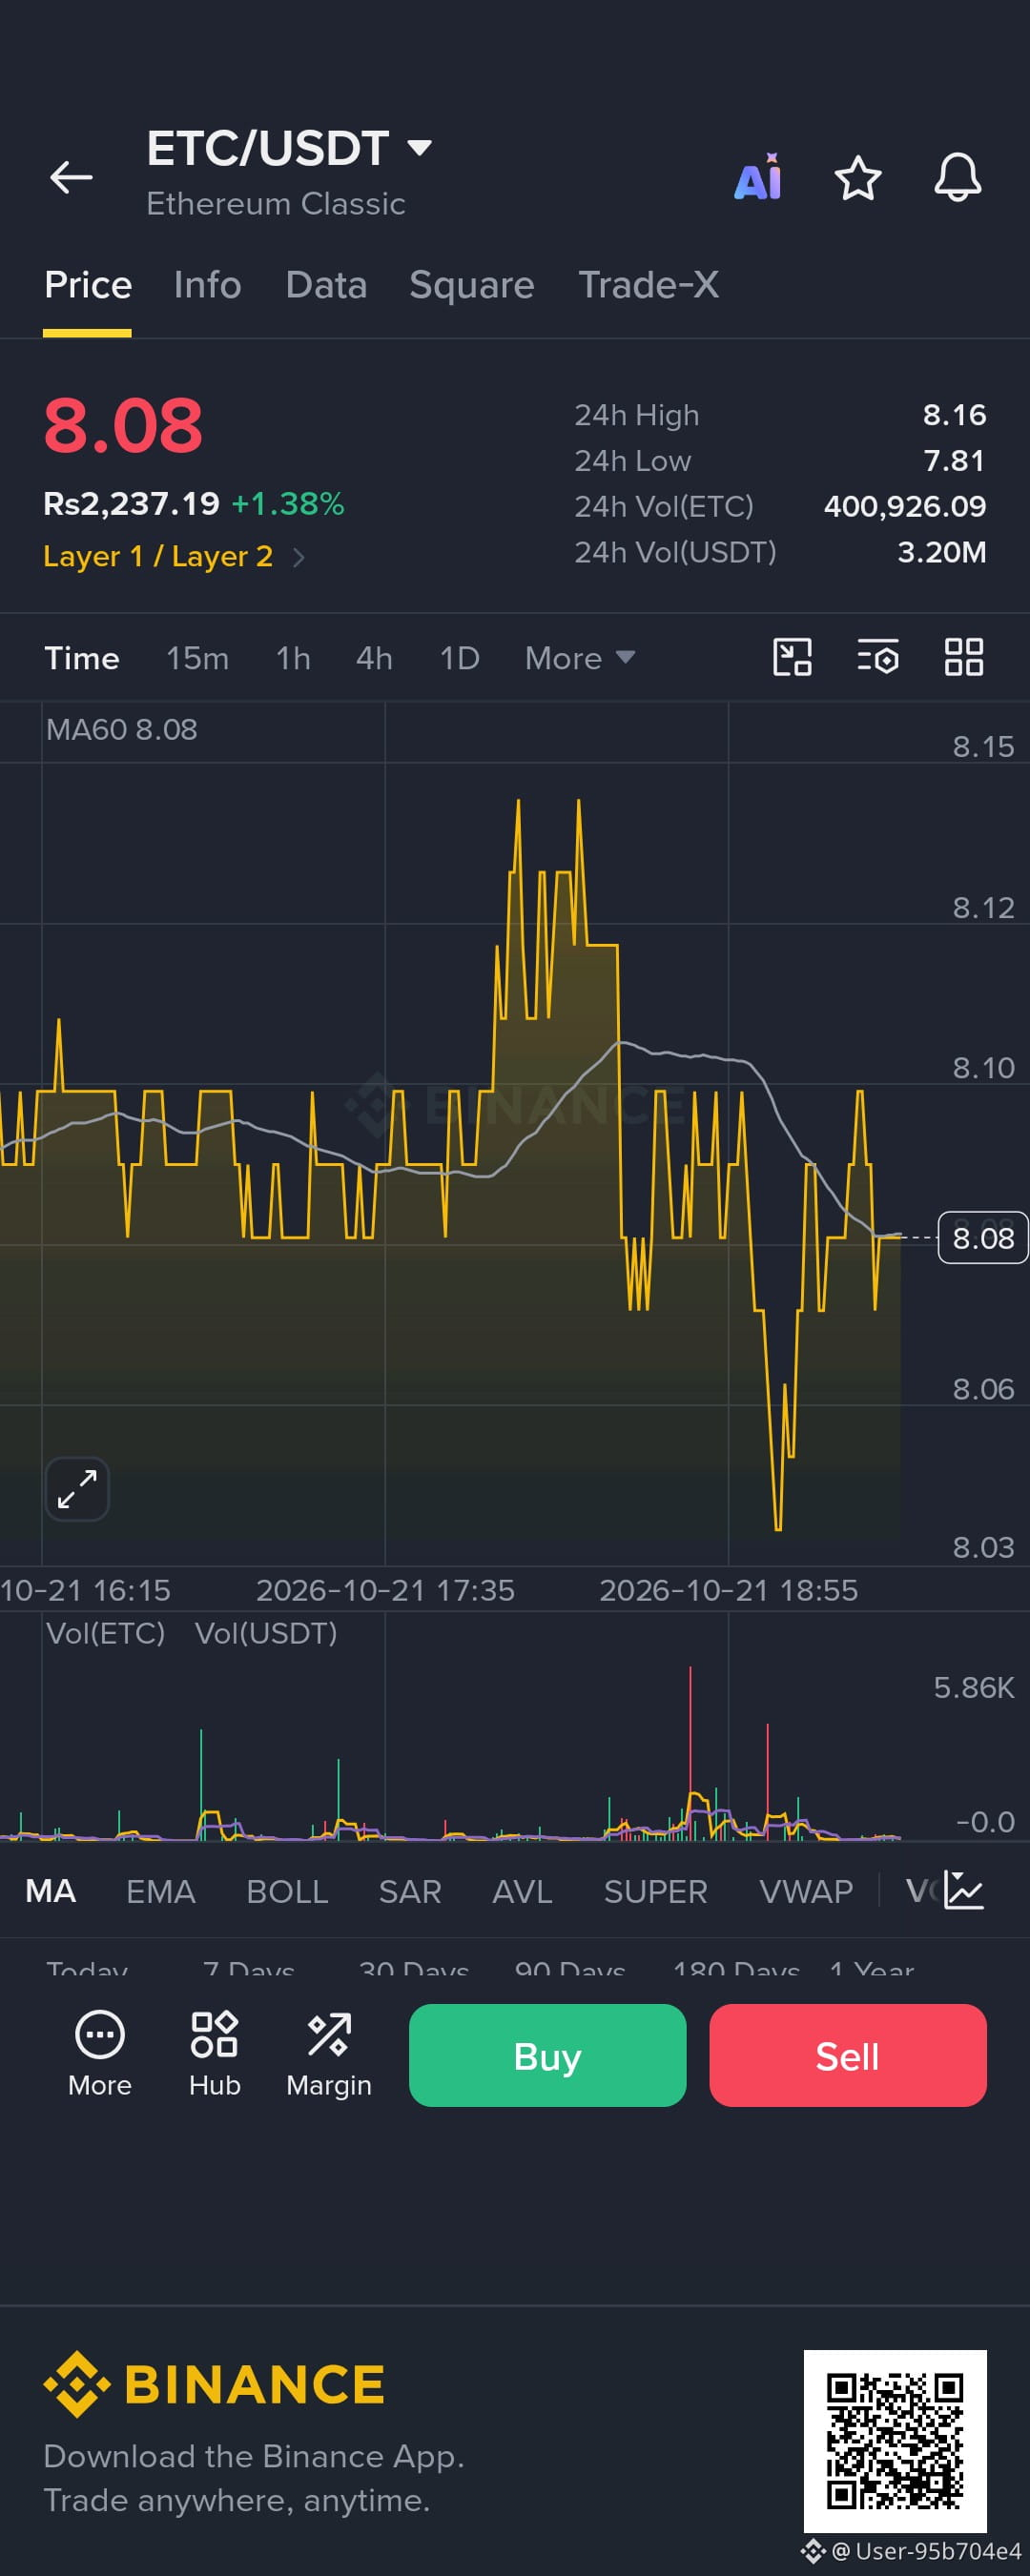
$ETC is showing short-term bullish momentum, but the overall trend remains bearish. Resistance sits at $8.14–$8.36, while key support is around $7.79. A confirmed breakout could push price toward $8.65. However, losing support may open the door to $7.47. Watch price action carefully and manage risk before entering any trade.
$ETC
{spot}(ETCUSDT)
#ETCUSD
$ETC is showing short-term bullish momentum, but the overall trend remains bearish. Resistance sits at $8.14–$8.36, while key support is around $7.79. A confirmed breakout could push price toward $8.65. However, losing support may open the door to $7.47. Watch price action carefully and manage risk before entering any trade.
$ETC
#ETCUSD
$ETC
#ETCUSD
30


·
--
🚀 Ethereum Classic (ETC) Market Update
Ethereum Classic (ETC) is trading near a key support zone after recent market fluctuations. Price action suggests that buyers are attempting to regain momentum, while overall sentiment remains cautiously optimistic.
📊 Key Levels to Watch: 🟢 Support: $16.50 – $17.20 🔴 Resistance: $18.80 – $20.00
💡 Technical Outlook: • Holding above the current support could open the door for a move toward the $20 resistance area. • A breakout above resistance may signal renewed bullish momentum. • If support fails, traders should be prepared for increased short-term volatility.
⚠️ Risk Management Matters: Always use proper stop-loss strategies and never invest more than you can afford to lose.
NFA (Not Financial Advice) – Do your own research before making any investment decisions.
#EthereumClassic #ETC #Crypto #BinanceSquare #CryptoTrading #Altcoins #TechnicalAnalysis #Blockchain
$ETC
#SOXRises6.4%ToRecordHigh
#ETCUSD

105

·
--
ສັນຍານໝີ
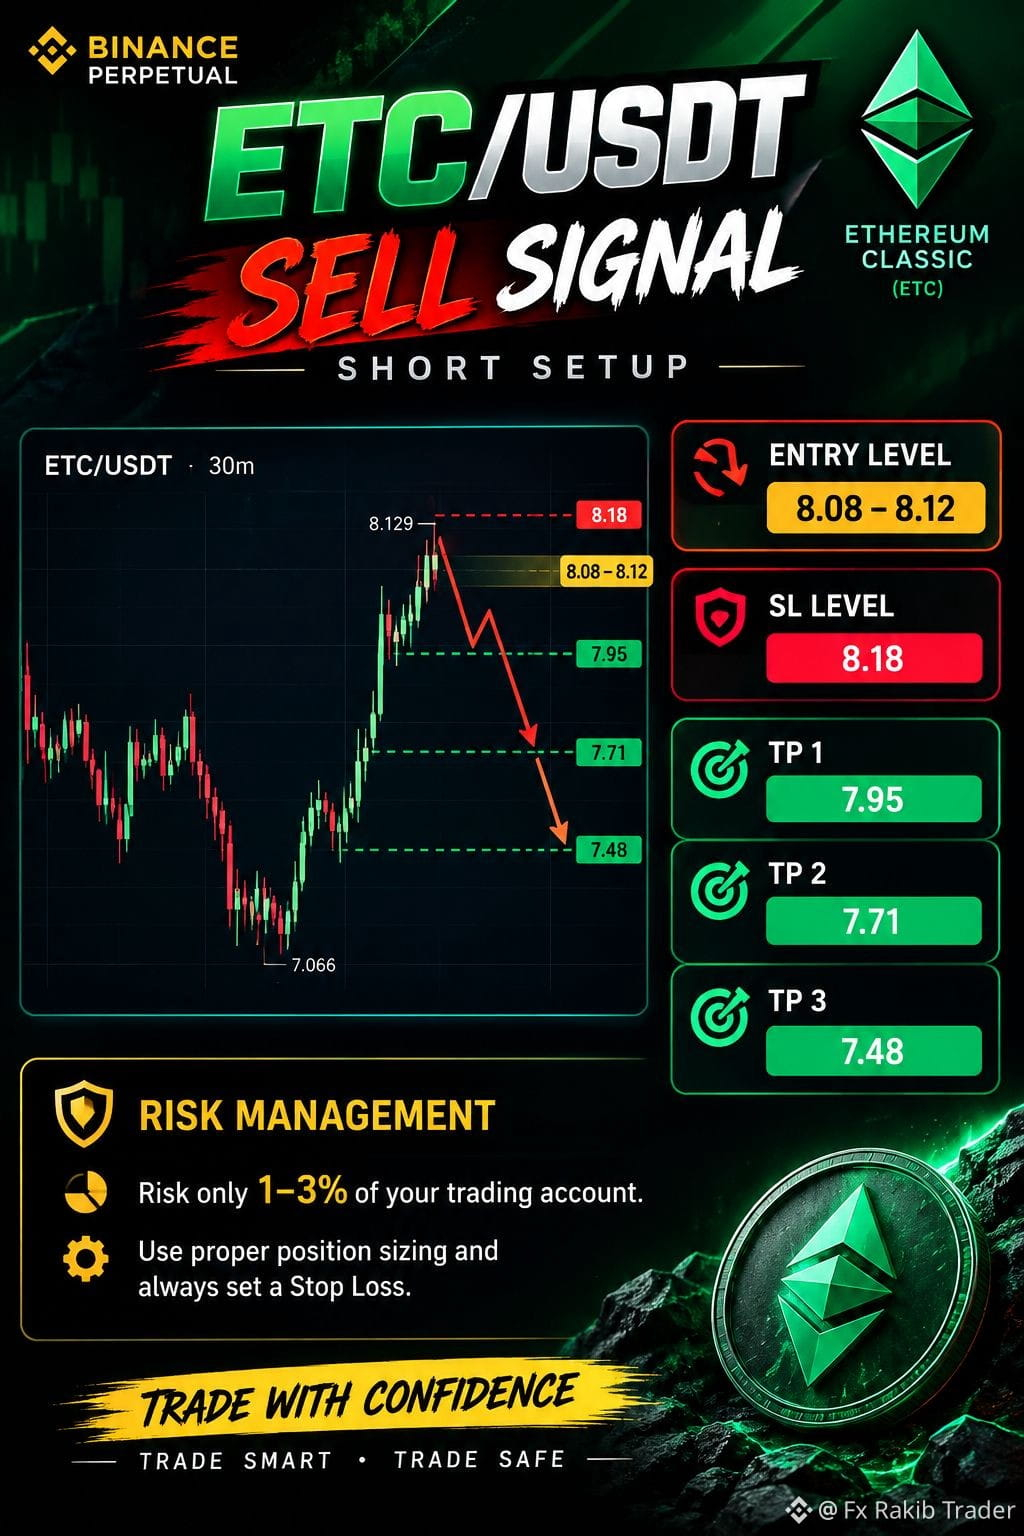
📉 ETC/USDT$ETC — SELL SIGNAL$ETC
🔴 SHORT SETUP
🎯 Entry Level: 8.08 – 8.12
🛑 SL Level: 8.18
💰 TP 1: 7.95
💰 TP 2: 7.71
💰 TP 3: 7.48
⚠️ Risk Management Risk only 1–3% of your trading account. Use proper position sizing and always set a Stop Loss.
📊 Trade with confirmation. Trade smart. Trade safe.$ETC
#ETC #ETCUSD T #BinanceSquareTalks
{spot}(ETCUSDT)
🤑#e #CryptoTrading #ShortSetup #TradingSignals
📉 ETC/USDT$ETC — SELL SIGNAL$ETC
🔴 SHORT SETUP
🎯 Entry Level: 8.08 – 8.12
🛑 SL Level: 8.18
💰 TP 1: 7.95
💰 TP 2: 7.71
💰 TP 3: 7.48
⚠️ Risk Management Risk only 1–3% of your trading account. Use proper position sizing and always set a Stop Loss.
📊 Trade with confirmation. Trade smart. Trade safe.$ETC
#ETC #ETCUSD T #BinanceSquareTalks
🤑#e #CryptoTrading #ShortSetup #TradingSignals
69

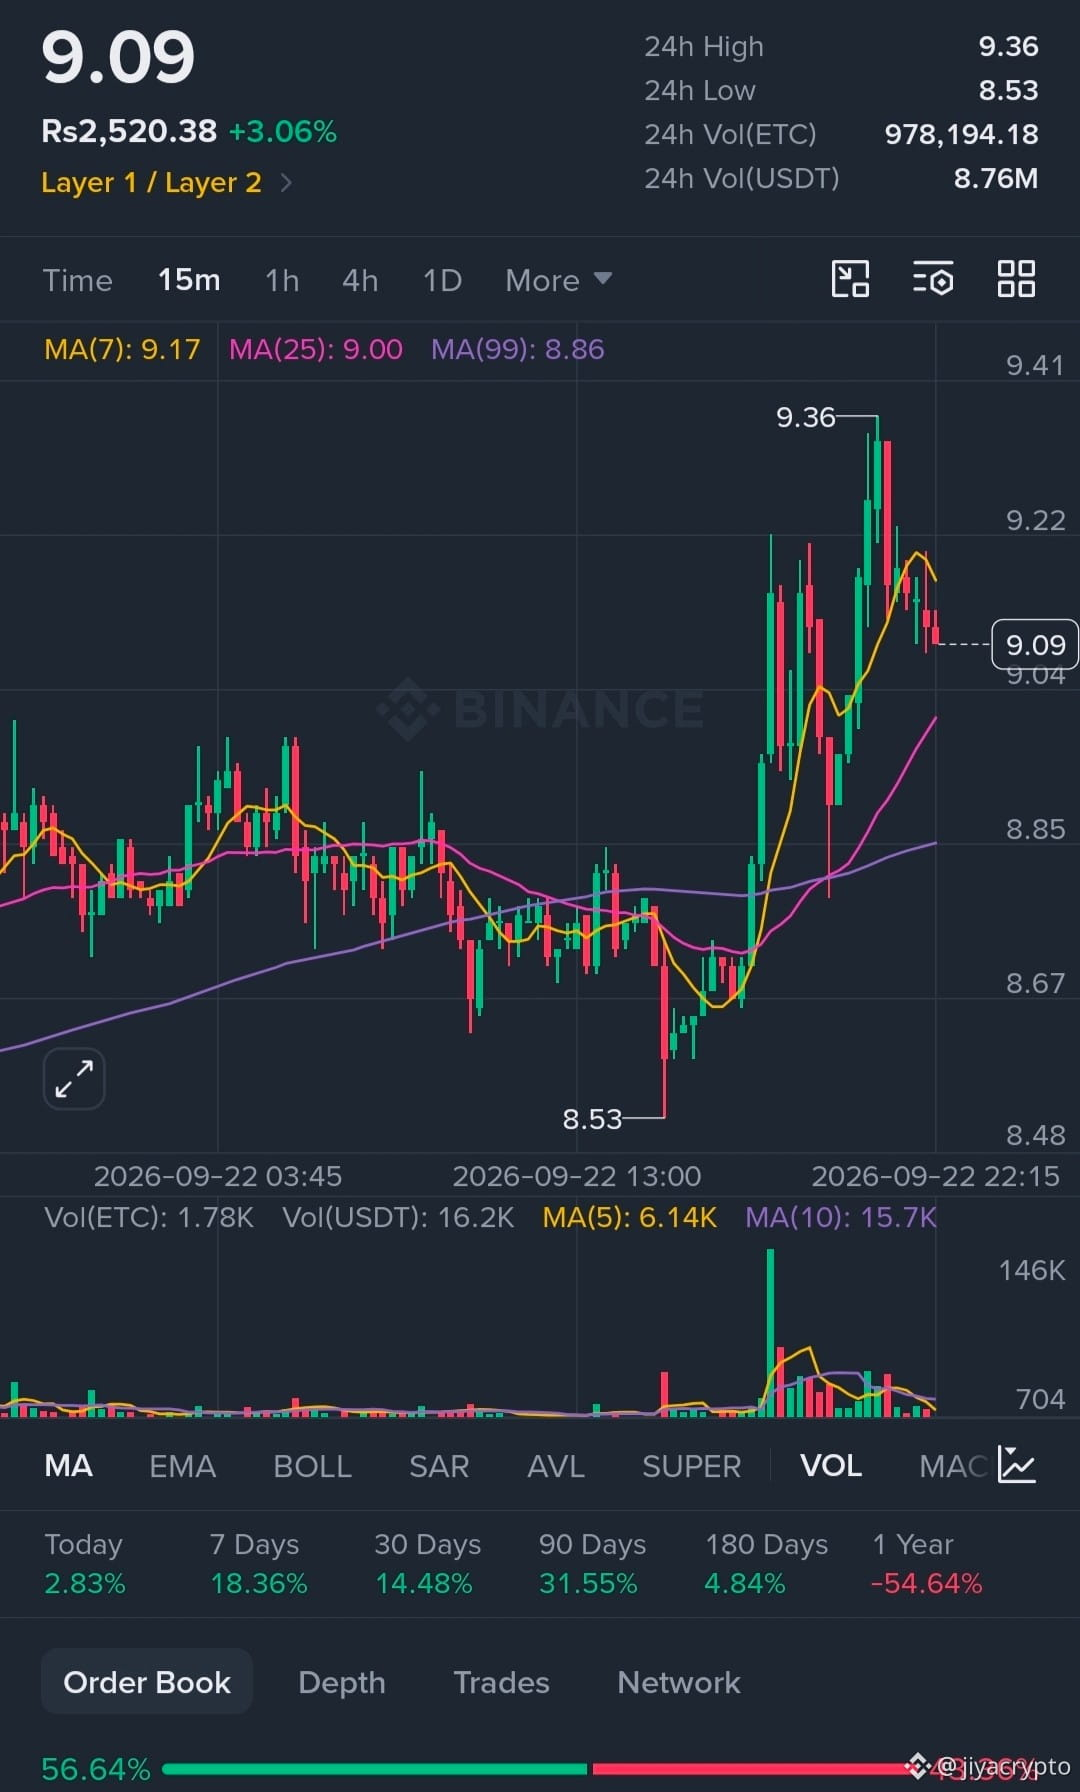
$ETC is currently hovering around $9.36, taking a little breather after its recent rally. The chart is basically saying: “I ran 36%… can I please have some water?” 😂
🔹 Support: $9.12
🔹 Resistance: $9.60
🔹 Below $9.12: $8.80–$9.00 becomes important
🔹 Above $9.60: momentum could start looking interesting again.
ETC recently made a strong move, but the latest weakness appears more connected to broader crypto-market conditions and Bitcoin’s movement than to a major ETC-specific negative catalyst.
#ETCUSD #etcs #ETCBearish

1
1
279

·
--
📉 $ETC Massive Distribution Near Ceiling – Breakdown Imminent! ⚡
Market momentum shows Ethereum Classic ($ETC) is facing heavy overhead rejection. Buyers are completely exhausted at local highs, leaving clean room for a breakdown.
📊 Execution Parameters:
▪️ Pullback Entry Range: $9.45 – $9.65
▪️ Defensive Stop-Loss: $10.15
▪️ Primary Targets: $8.90 | $8.50
▪️ Extended Slide Targets: $8.10 | $7.70
Structure remains strictly invalid if bulls push back and claim daily candles over $10.15. Keep an eye on local volume levels.
Sellers are stepping in—position accordingly.
#ETCUSD #CryptoTrading #Altcoins
{future}(ETCUSDT)
📉 $ETC Massive Distribution Near Ceiling – Breakdown Imminent! ⚡
Market momentum shows Ethereum Classic ($ETC ) is facing heavy overhead rejection. Buyers are completely exhausted at local highs, leaving clean room for a breakdown.
📊 Execution Parameters:
▪️ Pullback Entry Range: $9.45 – $9.65
▪️ Defensive Stop-Loss: $10.15
▪️ Primary Targets: $8.90 | $8.50
▪️ Extended Slide Targets: $8.10 | $7.70
Structure remains strictly invalid if bulls push back and claim daily candles over $10.15. Keep an eye on local volume levels.
Sellers are stepping in—position accordingly.
#ETCUSD #CryptoTrading #Altcoins
1
58

·
--
ສັນຍານກະທິງ
#ETCvsBTC *ETC Update — Ethereum Classic | Sep 13, 2026*
*Current Price*
- *$7.61 - $7.77* across exchanges
- *24h*: -0.5% to +4.5% depending on exchange
- *Day range*: $7.55 low to $8.04 high
- *Market Cap*: ∼$1.21B - $1.3B bfe7b4c0e35e
*Performance*
- *1 Month*: +24% to +20.6% — ETC is actually outperforming the "Dynamic Asset" category avg of 21%
- *5 Day*: -1.9%
- *1 Year*: -64.87%
- *ATH*: $150.42 — we’re still -95.7% from that bfe70fff
*What's happening*
1. *Volume spike*: 24h volume up 52.96% to €47.13M. 7D volume jumped 245%
2. *Narrative*: ETC is still "code is law" + PoW chain focused on immutability. Deflationary tokenomics with block rewards decreasing over time like BTC halving
3. *Position*: Ranked #54-#68. 158M ETC circulating of 210.7M max supply 0fff63c3e35e
*ETC vs BTC/ETH*
- ETC vs BTC: -45.89%
- ETC vs ETH: -34.04%
- Still outperforming on monthly basis though 0fff7b8b
*Key levels to watch*
- *Support*: $7.55 - $7.37
- *Resistance*: $NVDAB 7.82 - $8.04
- *Catalysts*: Same macro factors as BTC — CPI, FOMC Sept 16, and risk sentiment. ETC tends to be higher beta
Want me to make a chart comparing *ETC vs BTC* for the last month, or mark support/resistance zones on ETC like we did for BTC $GOOGL.US 69K?
#ETC/USDT #ETCUSD #etccoin #ETC/USDT
1
73

·
--
$ETC
{spot}(ETCUSDT)
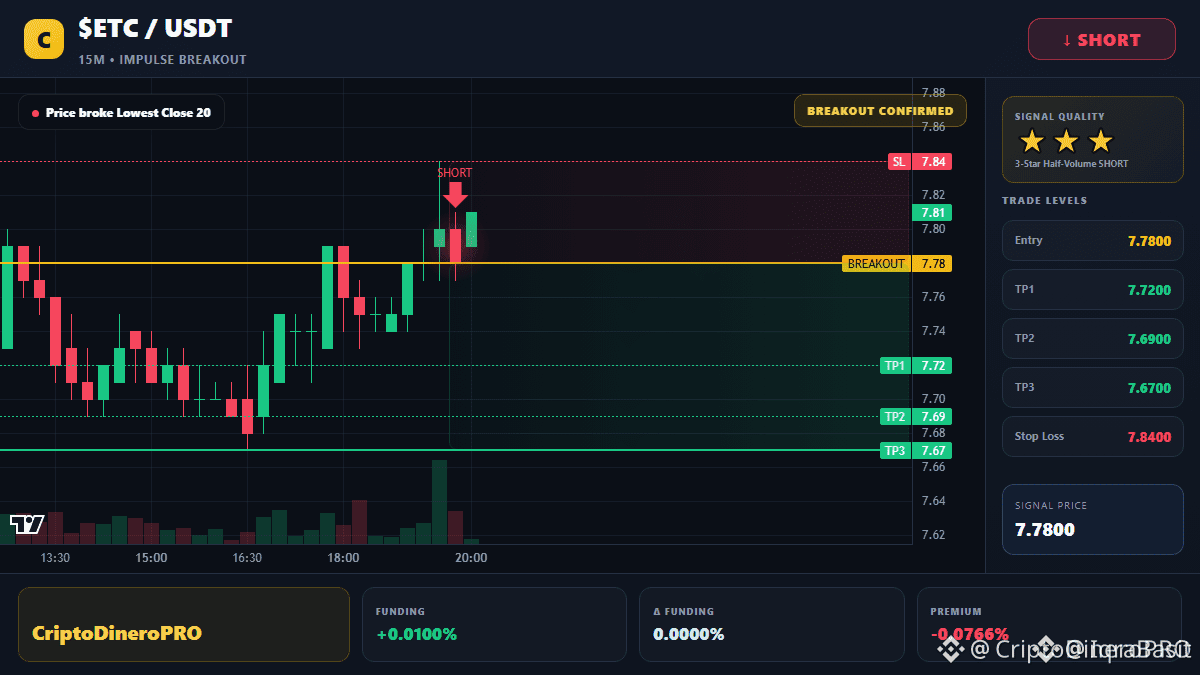
ETC is showing cautious momentum near the $7.50–$7.60 zone.
Key support is around $7.45–$7.50.
A breakout above $7.75–$7.80 could trigger stronger upside momentum.
Holding above support keeps the short-term outlook neutral-to-bullish.
A break below $7.45 could open the door to further downside.#ETC #ETCvsBTC #ETCUSD #USBankCompletesCrossBorderPaymentPilotOnStellar
$ETC
ETC is showing cautious momentum near the $7.50–$7.60 zone.
Key support is around $7.45–$7.50.
A breakout above $7.75–$7.80 could trigger stronger upside momentum.
Holding above support keeps the short-term outlook neutral-to-bullish.
A break below $7.45 could open the door to further downside.#ETC #ETCvsBTC #ETCUSD #USBankCompletesCrossBorderPaymentPilotOnStellar

2
38

·
--
ສັນຍານກະທິງ
$ETC / USD — Today’s Analysis 📊
ETC is holding near $9.50 after a strong recent move.
🔹 Resistance: $9.20 → $10.40
🔹 Support: $8.60 → $7.09
A sustained move above $9.20 could strengthen the bullish structure, while losing $8.60 may bring another pullback.
Watch volume and confirmation before entering.
#ETC #ETCUSD #Crypto #Trading #MarketAnalysis
{future}(ETCUSDT)
$ETC / USD — Today’s Analysis 📊
ETC is holding near $9.50 after a strong recent move.
🔹 Resistance: $9.20 → $10.40
🔹 Support: $8.60 → $7.09
A sustained move above $9.20 could strengthen the bullish structure, while losing $8.60 may bring another pullback.
Watch volume and confirmation before entering.
#ETC #ETCUSD #Crypto #Trading #MarketAnalysis
36

·
--
$ETC Ethereum Classic (ETC) is back in the spotlight after a strong technical move. Recent data shows ETC has gained roughly 33% over the past month, breaking out of a long-term downtrend and attracting renewed trader attention. �
CoinMarketCap
🚀 Latest News: ETC has also benefited from a broader rotation into older Proof-of-Work assets, with the token gaining more than 8% on September 8 during that market rotation. �
CoinMarketCap
📈 Bullish Setup: The current structure looks interesting, but the major confirmation zone is around $10.09. A convincing break and hold above this area could strengthen the recovery narrative. �
CoinMarketCap
🔥 Longer-Term Levels: Some technical analysis places the next major resistance around $12.86, followed by much higher historical resistance zones if the broader trend reversal continues. �
Coin Gabbar
⚠️ Risk: ETC's recent rally has pushed momentum indicators toward overbought territory, so a pullback or consolidation would not be surprising. There is also negative exchange-related news: two SBI-affiliated Japanese exchanges have announced plans to remove ETC in October as part of a service merger. �
CoinMarketCap
My Take: ETC is becoming an interesting high-risk recovery play. The key question now is whether buyers can turn this breakout into a sustained trend rather than another temporary rally. Watch volume, $10.09 resistance and the broader crypto market closely.
Not financial advice — always manage risk.
#ETC/USDT #ETCUSD #etcpow #etccoin #etccoin
{future}(ETCUSDT)
$ETC Ethereum Classic (ETC) is back in the spotlight after a strong technical move. Recent data shows ETC has gained roughly 33% over the past month, breaking out of a long-term downtrend and attracting renewed trader attention. �
CoinMarketCap
🚀 Latest News: ETC has also benefited from a broader rotation into older Proof-of-Work assets, with the token gaining more than 8% on September 8 during that market rotation. �
CoinMarketCap
📈 Bullish Setup: The current structure looks interesting, but the major confirmation zone is around $10.09. A convincing break and hold above this area could strengthen the recovery narrative. �
CoinMarketCap
🔥 Longer-Term Levels: Some technical analysis places the next major resistance around $12.86, followed by much higher historical resistance zones if the broader trend reversal continues. �
Coin Gabbar
⚠️ Risk: ETC's recent rally has pushed momentum indicators toward overbought territory, so a pullback or consolidation would not be surprising. There is also negative exchange-related news: two SBI-affiliated Japanese exchanges have announced plans to remove ETC in October as part of a service merger. �
CoinMarketCap
My Take: ETC is becoming an interesting high-risk recovery play. The key question now is whether buyers can turn this breakout into a sustained trend rather than another temporary rally. Watch volume, $10.09 resistance and the broader crypto market closely.
Not financial advice — always manage risk.
#ETC/USDT #ETCUSD #etcpow #etccoin #etccoin
CoinMarketCap
🚀 Latest News: ETC has also benefited from a broader rotation into older Proof-of-Work assets, with the token gaining more than 8% on September 8 during that market rotation. �
CoinMarketCap
📈 Bullish Setup: The current structure looks interesting, but the major confirmation zone is around $10.09. A convincing break and hold above this area could strengthen the recovery narrative. �
CoinMarketCap
🔥 Longer-Term Levels: Some technical analysis places the next major resistance around $12.86, followed by much higher historical resistance zones if the broader trend reversal continues. �
Coin Gabbar
⚠️ Risk: ETC's recent rally has pushed momentum indicators toward overbought territory, so a pullback or consolidation would not be surprising. There is also negative exchange-related news: two SBI-affiliated Japanese exchanges have announced plans to remove ETC in October as part of a service merger. �
CoinMarketCap
My Take: ETC is becoming an interesting high-risk recovery play. The key question now is whether buyers can turn this breakout into a sustained trend rather than another temporary rally. Watch volume, $10.09 resistance and the broader crypto market closely.
Not financial advice — always manage risk.
#ETC/USDT #ETCUSD #etcpow #etccoin #etccoin
70


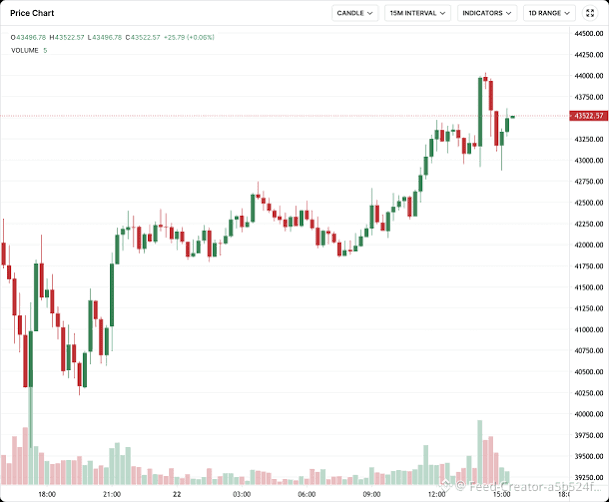
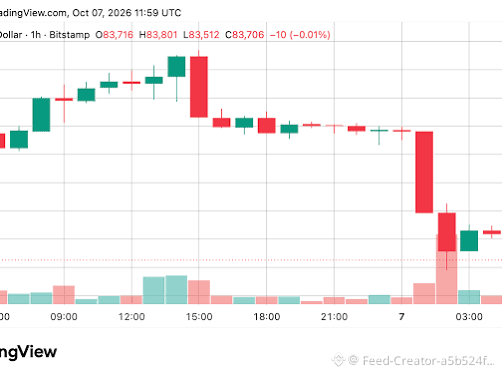
$ETC Understanding a Bitcoin Candlestick Chart
A candlestick chart is a specialized financial visual tool used by traders to track the price movements of cryptocurrencies like Bitcoin over specific time intervals (e.g., 15 minutes, 1 hour, or 1 day).
1. Anatomy of a Candlestick
Each individual "candle" on the chart tells a story about Bitcoin's price action during that period using four key data points:
Open: The price of Bitcoin when the time period started.
Close: The price of Bitcoin when the time period ended.
High: The highest price Bitcoin reached during that timeframe.
Low: The lowest price Bitcoin touched during that timeframe.
2. Color Coding
Green (Bullish) Candle: Indicates that the price of Bitcoin increased. The closing price was higher than the opening price.
Red (Bearish) Candle: Indicates that the price of Bitcoin decreased. The closing price was lower than the opening price.
3. The Body and the Wicks
The Body (The thick middle part): Represents the net price movement between the opening and closing prices.
The Wicks/Shadows (The thin lines at the top and bottom): Show the exact extremes—how high or how low the price fluctuated before settling down.
4. Practical Use
Traders analyze these shapes and patterns (like a Shooting Star or Morning Star) to gauge market psychology and attempt to predict whether buyers (bulls) or sellers (bears) are currently controlling the market momentum.
If you want to dive deeper, let me know:
Would you like me to look up the exact live price of Bitcoin right now?
Are you trying to understand a specific candle pattern (like Doji or Hammer)?
Do you want to see a chart for a particular timeframe (e.g., daily or weekly)?
#ETCUSD #ASICHasReceivedNoPredictionMarketApplications #HeYiSaysWithdrawalsExpectedtoResumeWithin42Hours
83

·
--
ສັນຍານກະທິງ
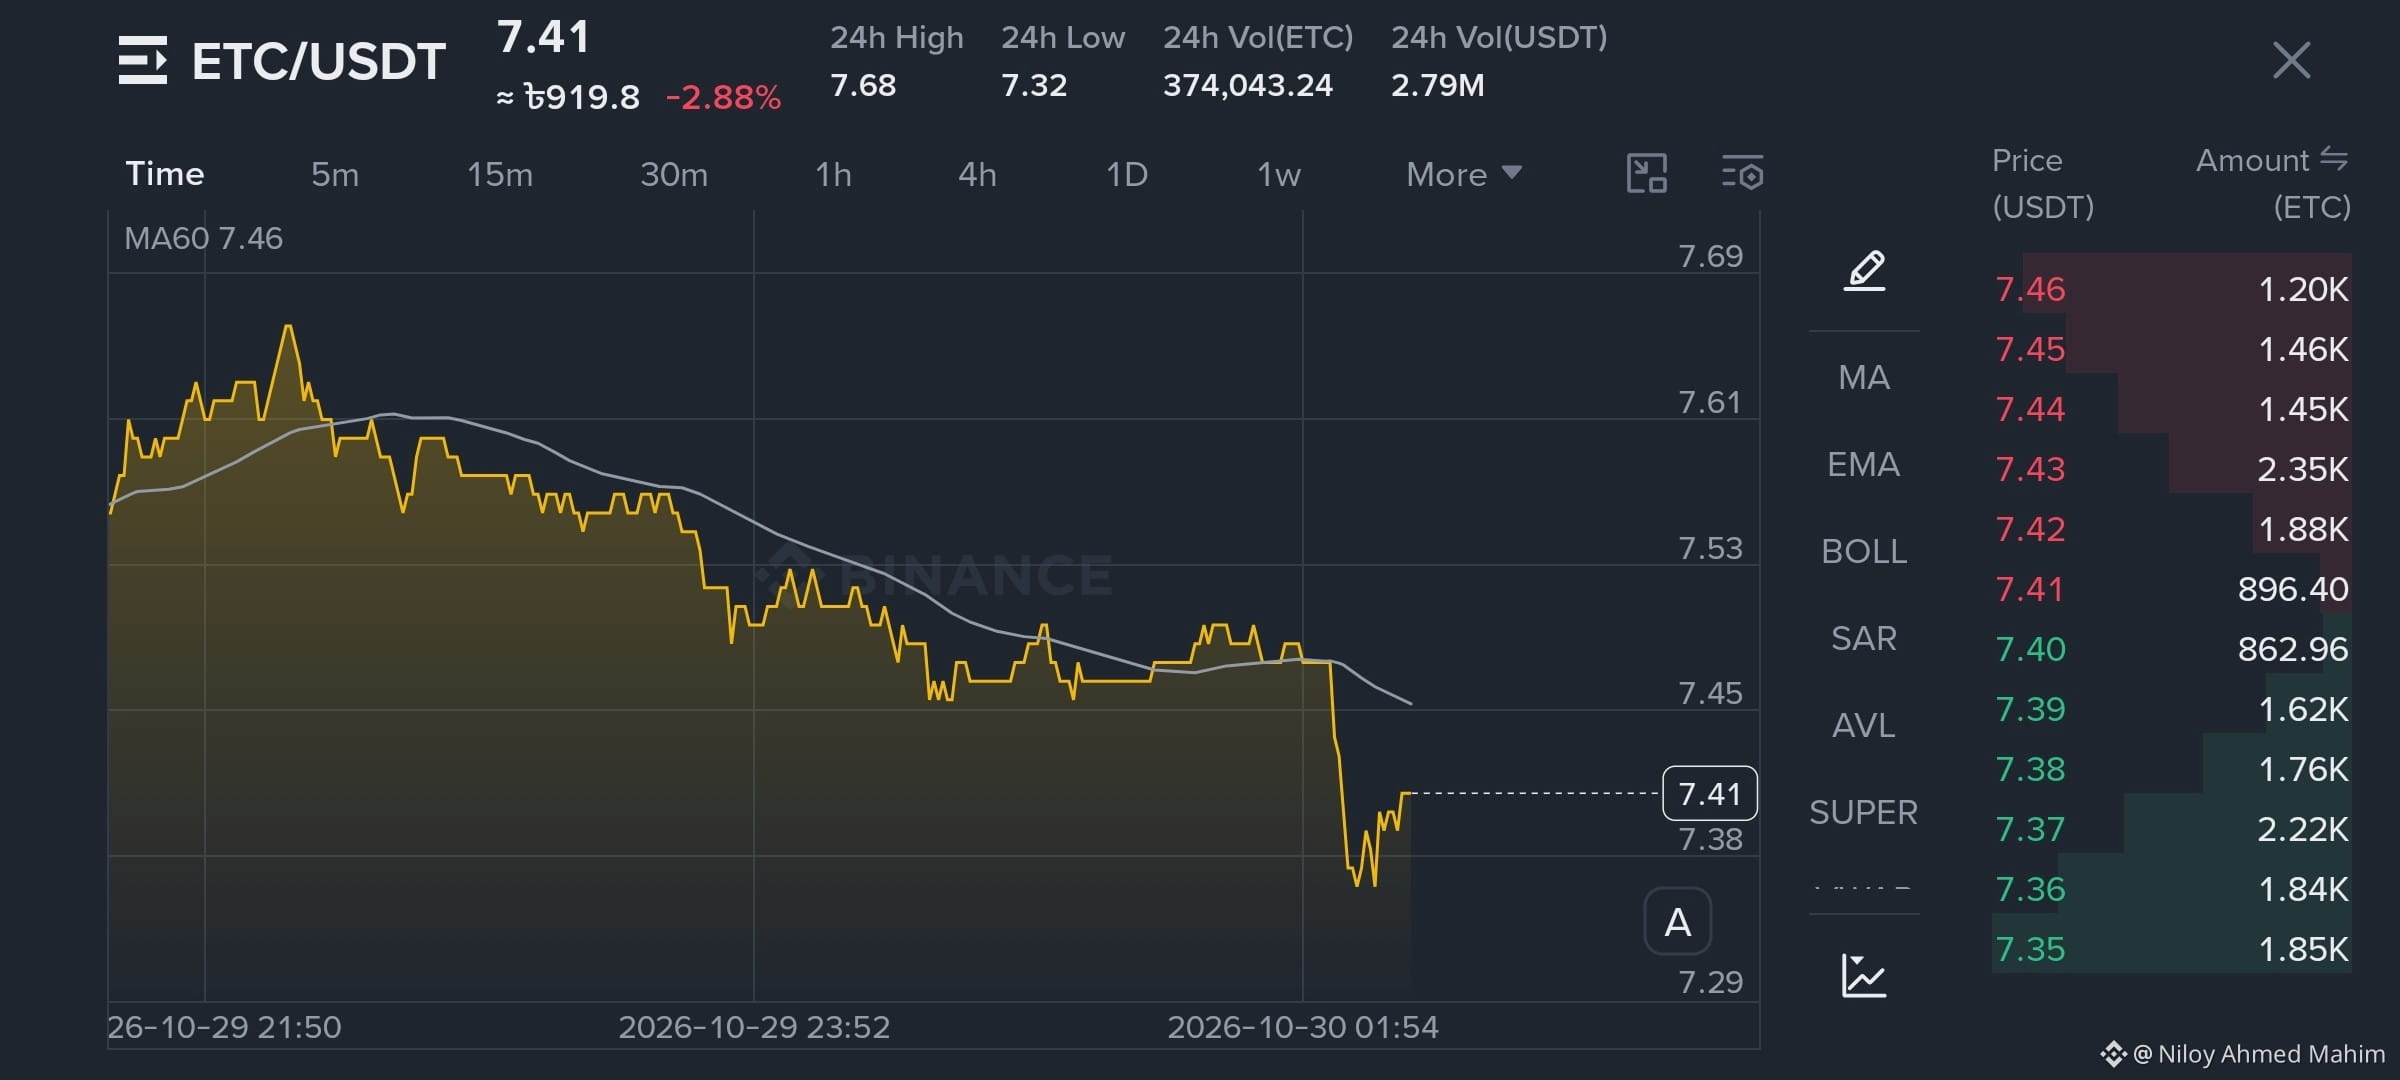
You can consider buying and holding some (ETC/USDT)
as the price is currently quite low.🤑🏹
It could rise within the next 3–5 days. I’m confident in this prediction,
but always do your own research before investing. 📈
#FedWatch #EarningsSeason #USMidtermElections #ETC/USDT #etcusd
{spot}(ETCUSDT)
{spot}(BTCUSDT)
{spot}(HYPEUSDT)
$MA.US $V.US $AAPLB
follow 😊
You can consider buying and holding some (ETC/USDT)
as the price is currently quite low.🤑🏹
It could rise within the next 3–5 days. I’m confident in this prediction,
but always do your own research before investing. 📈
#FedWatch #EarningsSeason #USMidtermElections #ETC/USDT #etcusd
$MA.US $V.US $AAPLB
follow 😊
as the price is currently quite low.🤑🏹
It could rise within the next 3–5 days. I’m confident in this prediction,
but always do your own research before investing. 📈
#FedWatch #EarningsSeason #USMidtermElections #ETC/USDT #etcusd
$MA.US $V.US $AAPLB
follow 😊
295


·
--
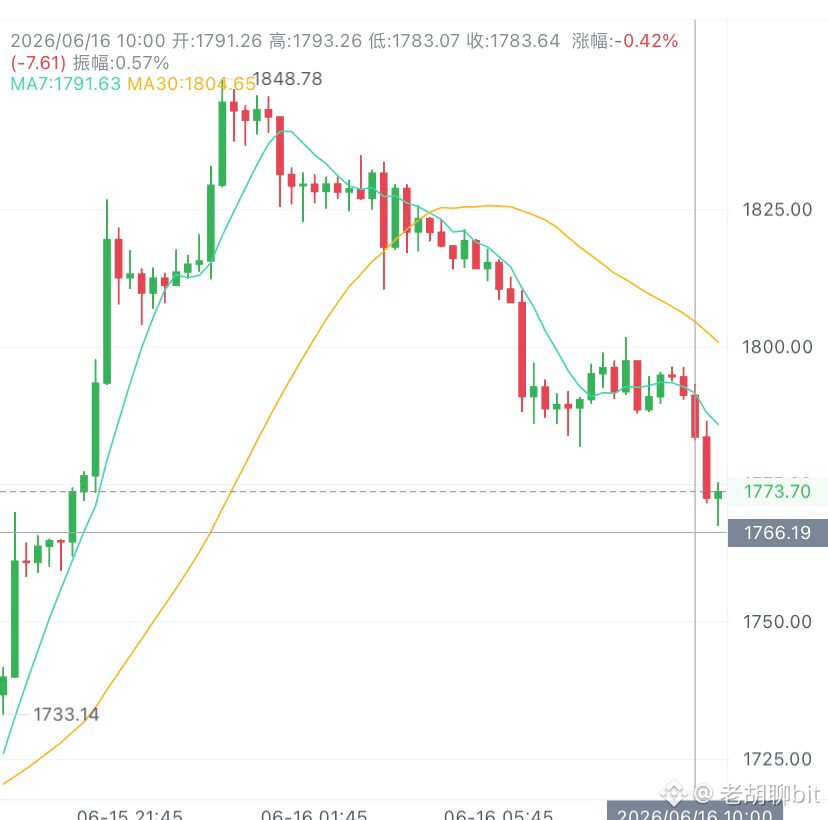
6.16以太思路参考
大饼空头情绪笼罩市场,以太坊同步承压,操作思路顺势高空,下方下行空间仍有释放。
比特币全线走弱带动盘面承压,二饼短期趋势明确偏空,切勿逆势做多。
昨晚行情短暂冲高试探1850压力位,多头后劲不足,空头抛盘集中涌出,价格快速回落至1780关口。当下窄幅缩量震荡只是下跌蓄力,不存在反转走强基础,1780支撑很难守住。
宏观层面双重利空压制:美联储鹰派论调持续发酵,叠加现货ETF资金不断流出,市场买盘意愿低迷,每一轮反弹都是做空窗口期。
反弹至1830、1850区域分批进场空单
止盈分段看1720、1660#美国战略石油储备创1983年来新低 #XRP突破1.2美元涨约8% #ETCUSD
大饼空头情绪笼罩市场,以太坊同步承压,操作思路顺势高空,下方下行空间仍有释放。
比特币全线走弱带动盘面承压,二饼短期趋势明确偏空,切勿逆势做多。
昨晚行情短暂冲高试探1850压力位,多头后劲不足,空头抛盘集中涌出,价格快速回落至1780关口。当下窄幅缩量震荡只是下跌蓄力,不存在反转走强基础,1780支撑很难守住。
宏观层面双重利空压制:美联储鹰派论调持续发酵,叠加现货ETF资金不断流出,市场买盘意愿低迷,每一轮反弹都是做空窗口期。
反弹至1830、1850区域分批进场空单
止盈分段看1720、1660#美国战略石油储备创1983年来新低 #XRP突破1.2美元涨约8% #ETCUSD
1
1
620


·
--
别信币圈共赢神话!交易本质就是财富重新分配的硬博弈
交易的底层逻辑从来不是什么皆大欢喜的共赢,本质就是一场财富重新分配的硬核较量。$ETH
好多人聊比特币,总绕不开技术创新、金融自由这些高大上的角度,这些东西当然有价值,但对真金白银扎进市场的人来说,最核心的真相是:交易就是人和人之间,认知、资金储备和纪律执行力的硬碰硬比拼。
币圈根本不是轻松升级的小游戏,是高强度的竞技赛场,有人把利润揣进兜里,就必然有人在错误的位置付出真金白银的代价。同样看多的行情,300U的小资金可能一波快速波动就因为仓位乱、没计划被扫出场,做好资金管理的人却能稳稳熬到下一波机会。$BTC
方向看对了不代表结果就一样,散户最大的坑不是看不懂行情,是涨起来被贪婪牵着追高,跌下去被恐惧吓得割肉。币圈从来不会缺机会,缺的是机会真砸下来的时候,你手里还有本金、有耐心、有执行力。不想当情绪交易的牺牲品,想靠更系统的方法摸透市场,咱们可以一起交流打磨思路。#ETCUSD

289

·
--
$ETC is showing a cautiously bullish short-term setup. As of September 7, ETC was around $7.90, up roughly 3% in 24 hours, with price holding above its 7-day and 30-day moving averages.
🟢 Resistance: $7.94 → $8.03
🟢 Bullish breakout: A sustained move above $8.03 could strengthen momentum toward $8.14.
🔴 Support: $7.83, then roughly $7.72–$7.79.
📈 Trend: Short-term bullish, but ETC still needs stronger volume and a clean breakout to confirm the move.
⚠️ Risk: A break below $7.64 could weaken the setup and expose lower support.
Overall: 🟢 Cautiously Bullish — ETC is improving technically, but the $8.00–$8.03 zone is the key near-term test.
#ETC #ETCUSDT #ETCUSD #ZcashRises45%WeeklyToHighestSince2016 #USIranTradeTankerStrikesEscalate
{spot}(ETCUSDT)
$ETC is showing a cautiously bullish short-term setup. As of September 7, ETC was around $7.90, up roughly 3% in 24 hours, with price holding above its 7-day and 30-day moving averages.
🟢 Resistance: $7.94 → $8.03
🟢 Bullish breakout: A sustained move above $8.03 could strengthen momentum toward $8.14.
🔴 Support: $7.83, then roughly $7.72–$7.79.
📈 Trend: Short-term bullish, but ETC still needs stronger volume and a clean breakout to confirm the move.
⚠️ Risk: A break below $7.64 could weaken the setup and expose lower support.
Overall: 🟢 Cautiously Bullish — ETC is improving technically, but the $8.00–$8.03 zone is the key near-term test.
#ETC #ETCUSDT #ETCUSD #ZcashRises45%WeeklyToHighestSince2016 #USIranTradeTankerStrikesEscalate

50
ເຂົ້າສູ່ລະບົບເພື່ອສຳຫຼວດເນື້ອຫາເພີ່ມເຕີມ
ເຂົ້າຮ່ວມກຸ່ມຜູ້ໃຊ້ຄຣິບໂຕທົ່ວໂລກໃນ Binance Square.
⚡️ ໄດ້ຮັບຂໍ້ມູນຫຼ້າສຸດ ແລະ ທີ່ມີປະໂຫຍດກ່ຽວກັບຄຣິບໂຕ.
💬 ໄດ້ຮັບຄວາມໄວ້ວາງໃຈຈາກຕະຫຼາດແລກປ່ຽນຄຣິບໂຕທີ່ໃຫຍ່ທີ່ສຸດໃນໂລກ.
👍 ຄົ້ນຫາຂໍ້ມູນເຊີງເລິກທີ່ແທ້ຈາກນັກສ້າງທີ່ໄດ້ຮັບການຢືນຢັນ.
ອີເມວ / ເບີໂທລະສັບ
ຫົວຂໍ້ທີ່ກໍາລັງນິຍົມ
1
#BinanceReports80%Recoveryof$6.3BillioninLossesfromHackIncident
22,489 ຄັ້ງທີ່ເບິ່ງ
195 ກຳລັງສົນທະນາ
2
#HeYiSaysWithdrawalsExpectedtoResumeWithin42Hours
43,132 ຄັ້ງທີ່ເບິ່ງ
803 ກຳລັງສົນທະນາ
3
#CZSaysCompensationIsinPlaceUsersAreProtected
49,006 ຄັ້ງທີ່ເບິ່ງ
677 ກຳລັງສົນທະນາ
4
#RichardTengSaysBinanceWillCoverAllHackedLosseswithCompanyFunds
7,949 ຄັ້ງທີ່ເບິ່ງ
49 ກຳລັງສົນທະນາ
5
#IntelHasItsWorstDaySince1974
8,932 ຄັ້ງທີ່ເບິ່ງ
260 ກຳລັງສົນທະນາ
6
#TRMCambodianCasinosReceived$1.07BInCrypto
1,853 ຄັ້ງທີ່ເບິ່ງ
49 ກຳລັງສົນທະນາ
7
#USDCCirculationFallsAbout800MInSevenDays
26,850 ຄັ້ງທີ່ເບິ່ງ
435 ກຳລັງສົນທະນາ
8
#SuspectedNorthKoreaAttacksAccountForNearly89%OfCryptoHackLosses
9,011 ຄັ້ງທີ່ເບິ່ງ
76 ກຳລັງສົນທະນາ
9
#OpenAICutsFundraisingTargetBy$10B
1,868 ຄັ້ງທີ່ເບິ່ງ
60 ກຳລັງສົນທະນາ
10
#ASICHasReceivedNoPredictionMarketApplications
38,912 ຄັ້ງທີ່ເບິ່ງ
855 ກຳລັງສົນທະນາ