
#markettrends
markettrends
3.1M ຄັ້ງທີ່ເບິ່ງ
6,511 ກຳລັງສົນທະນາ
ມາແຮງ
ຫຼ້າສຸດ


·
--
ບົດຄວາມ
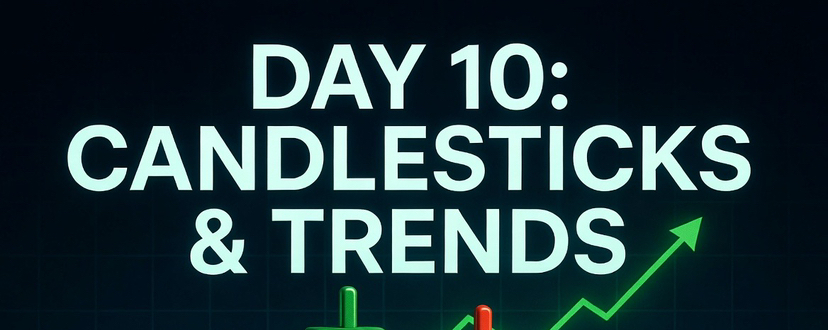
How to Read Candlestick Charts and Identify TrendsWelcome to the tenth day of our educational series, marking a major milestone in your trading journey! Now that you have mastered how to execute and automate your orders, we are officially shifting our focus away from the mechanics of the platform and moving directly into market analysis. Today, we are unlocking the primary language of global market analysts: Japanese Candlestick Charts and Market Trends. Learning to read these visual data points allows you to see exactly who is winning the psychological battle between buyers and sellers in real time.
The Anatomy of a Candlestick
A standard candlestick chart compresses a massive amount of market trading data into simple, highly visual shapes. Each individual candle represents price action over a specific, chosen timeframe—whether it is 15 minutes, 4 hours, or an entire day.
Every single candlestick is composed of two primary elements: the Real Body and the Wicks (also known as shadows).
The Real Body: The thick, colored center of the candle represents the exact distance between the Open Price (where the timeframe started) and the Close Price (where the timeframe ended).
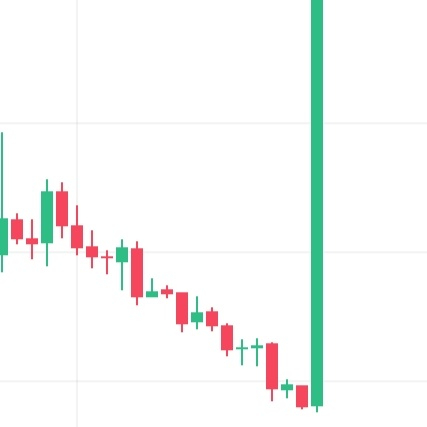
Green (Bullish) Candle: Occurs when the closing price is higher than the opening price, indicating strong buying pressure.
Red (Bearish) Candle: Occurs when the closing price is lower than the opening price, indicating aggressive selling pressure.
The Wicks (Shadows): The thin lines extending from the top and bottom of the real body display the absolute High and Low prices touched during that specific timeframe, showing how far the market stretched before snapping back toward the body.
The Three Directions of Market Trends
Prices do not move in straight lines; they move in waves or zig-zag patterns. By connecting these waves over a larger timeframe, you can identify the macro direction of the asset, commonly referred to as the trend. The market moves in one of three distinct directions:
Uptrend (Bull Market): Characterized by a consecutive series of Higher Highs (HH) and Higher Lows (HL). This indicates that buyers are constantly willing to buy the asset at a premium, pushing the floor price higher with each wave.
Downtrend (Bear Market): Characterized by a consecutive series of Lower Highs (LH) and Lower Lows (LL). This shows that sellers are dominating the market, dumping assets aggressively and driving the floor price down.
Sideways Trend (Consolidation): Occurs when the price bounces back and forth within a flat horizontal range, unable to break above an upper ceiling or fall below a lower floor. This indicates a state of equilibrium and indecision between buyers and sellers.
Creator's Advice: Trade with the Trend, Not Against It
The most valuable rule for any technical analyst is a classic industry maxim: "The trend is your friend." Trying to guess the exact bottom of a brutal downtrend or shorting the absolute peak of a parabolic uptrend is a quick way to deplete your capital. Your probability of execution success increases dramatically when you align your trades with the dominant market direction. Look at the macro charts first to establish the overall trend before zooming in to execute your strategy.
Tomorrow, we will build upon this visual foundation by diving into the world of Support and Resistance, teaching you how to identify key psychological levels where prices are highly likely to bounce or break out. For today, your practical homework is to open any digital asset chart in Pro mode, change the timeframe to the 1-Day (1D) setting, and trace whether the asset has been making higher highs or lower lows over the last few weeks.
#CryptoAnalysis #CandlestickCharts #MarketTrends #TechnicalAnalysis
How to Read Candlestick Charts and Identify Trends
Welcome to the tenth day of our educational series, marking a major milestone in your trading journey! Now that you have mastered how to execute and automate your orders, we are officially shifting our focus away from the mechanics of the platform and moving directly into market analysis. Today, we are unlocking the primary language of global market analysts: Japanese Candlestick Charts and Market Trends. Learning to read these visual data points allows you to see exactly who is winning the psychological battle between buyers and sellers in real time.
The Anatomy of a Candlestick
A standard candlestick chart compresses a massive amount of market trading data into simple, highly visual shapes. Each individual candle represents price action over a specific, chosen timeframe—whether it is 15 minutes, 4 hours, or an entire day.
Every single candlestick is composed of two primary elements: the Real Body and the Wicks (also known as shadows).
The Real Body: The thick, colored center of the candle represents the exact distance between the Open Price (where the timeframe started) and the Close Price (where the timeframe ended).
Green (Bullish) Candle: Occurs when the closing price is higher than the opening price, indicating strong buying pressure.
Red (Bearish) Candle: Occurs when the closing price is lower than the opening price, indicating aggressive selling pressure.
The Wicks (Shadows): The thin lines extending from the top and bottom of the real body display the absolute High and Low prices touched during that specific timeframe, showing how far the market stretched before snapping back toward the body.
The Three Directions of Market Trends
Prices do not move in straight lines; they move in waves or zig-zag patterns. By connecting these waves over a larger timeframe, you can identify the macro direction of the asset, commonly referred to as the trend. The market moves in one of three distinct directions:
Uptrend (Bull Market): Characterized by a consecutive series of Higher Highs (HH) and Higher Lows (HL). This indicates that buyers are constantly willing to buy the asset at a premium, pushing the floor price higher with each wave.
Downtrend (Bear Market): Characterized by a consecutive series of Lower Highs (LH) and Lower Lows (LL). This shows that sellers are dominating the market, dumping assets aggressively and driving the floor price down.
Sideways Trend (Consolidation): Occurs when the price bounces back and forth within a flat horizontal range, unable to break above an upper ceiling or fall below a lower floor. This indicates a state of equilibrium and indecision between buyers and sellers.
Creator's Advice: Trade with the Trend, Not Against It
The most valuable rule for any technical analyst is a classic industry maxim: "The trend is your friend." Trying to guess the exact bottom of a brutal downtrend or shorting the absolute peak of a parabolic uptrend is a quick way to deplete your capital. Your probability of execution success increases dramatically when you align your trades with the dominant market direction. Look at the macro charts first to establish the overall trend before zooming in to execute your strategy.
Tomorrow, we will build upon this visual foundation by diving into the world of Support and Resistance, teaching you how to identify key psychological levels where prices are highly likely to bounce or break out. For today, your practical homework is to open any digital asset chart in Pro mode, change the timeframe to the 1-Day (1D) setting, and trace whether the asset has been making higher highs or lower lows over the last few weeks.
#CryptoAnalysis #CandlestickCharts #MarketTrends #TechnicalAnalysis
The Anatomy of a Candlestick
A standard candlestick chart compresses a massive amount of market trading data into simple, highly visual shapes. Each individual candle represents price action over a specific, chosen timeframe—whether it is 15 minutes, 4 hours, or an entire day.
Every single candlestick is composed of two primary elements: the Real Body and the Wicks (also known as shadows).
The Real Body: The thick, colored center of the candle represents the exact distance between the Open Price (where the timeframe started) and the Close Price (where the timeframe ended).
Green (Bullish) Candle: Occurs when the closing price is higher than the opening price, indicating strong buying pressure.
Red (Bearish) Candle: Occurs when the closing price is lower than the opening price, indicating aggressive selling pressure.
The Wicks (Shadows): The thin lines extending from the top and bottom of the real body display the absolute High and Low prices touched during that specific timeframe, showing how far the market stretched before snapping back toward the body.
The Three Directions of Market Trends
Prices do not move in straight lines; they move in waves or zig-zag patterns. By connecting these waves over a larger timeframe, you can identify the macro direction of the asset, commonly referred to as the trend. The market moves in one of three distinct directions:
Uptrend (Bull Market): Characterized by a consecutive series of Higher Highs (HH) and Higher Lows (HL). This indicates that buyers are constantly willing to buy the asset at a premium, pushing the floor price higher with each wave.
Downtrend (Bear Market): Characterized by a consecutive series of Lower Highs (LH) and Lower Lows (LL). This shows that sellers are dominating the market, dumping assets aggressively and driving the floor price down.
Sideways Trend (Consolidation): Occurs when the price bounces back and forth within a flat horizontal range, unable to break above an upper ceiling or fall below a lower floor. This indicates a state of equilibrium and indecision between buyers and sellers.
Creator's Advice: Trade with the Trend, Not Against It
The most valuable rule for any technical analyst is a classic industry maxim: "The trend is your friend." Trying to guess the exact bottom of a brutal downtrend or shorting the absolute peak of a parabolic uptrend is a quick way to deplete your capital. Your probability of execution success increases dramatically when you align your trades with the dominant market direction. Look at the macro charts first to establish the overall trend before zooming in to execute your strategy.
Tomorrow, we will build upon this visual foundation by diving into the world of Support and Resistance, teaching you how to identify key psychological levels where prices are highly likely to bounce or break out. For today, your practical homework is to open any digital asset chart in Pro mode, change the timeframe to the 1-Day (1D) setting, and trace whether the asset has been making higher highs or lower lows over the last few weeks.
#CryptoAnalysis #CandlestickCharts #MarketTrends #TechnicalAnalysis
7
1
10
725

Power-law models often captivate the crypto community by mapping Bitcoin on a logarithmic scale to suggest inevitable rebounds. Yet, relying strictly on mathematical curves can be misleading. Markets are driven by complex human behavior, liquidity shifts, and macroeconomic forces rather than geometry alone. It is fascinating to explore these long-term projections, but critical thinking remains essential when separating solid data from wishful charting. Always look beyond the lines. $BTC #Bitcoin #CryptoAnalysis #MarketTrends
Power-law models often captivate the crypto community by mapping Bitcoin on a logarithmic scale to suggest inevitable rebounds. Yet, relying strictly on mathematical curves can be misleading. Markets are driven by complex human behavior, liquidity shifts, and macroeconomic forces rather than geometry alone. It is fascinating to explore these long-term projections, but critical thinking remains essential when separating solid data from wishful charting. Always look beyond the lines. $BTC #Bitcoin #CryptoAnalysis #MarketTrends
13
Bitcoin is currently consolidating around the $65,000 mark, highlighting a fascinating shift in market dynamics. Recent data from Talos reveals that the popular crypto basis trade is seeing diminishing returns, now offering yields comparable to traditional U.S. Treasuries. This compression suggests institutional players are recalibrating their strategies as macro conditions evolve. Instead of chasing easy carry yields, capital is becoming more selective, paving the way for organic asset rotation across the broader ecosystem. $BTC $XRP $SOL #Bitcoin #CryptoAnalysis #MarketTrends
Bitcoin is currently consolidating around the $65,000 mark, highlighting a fascinating shift in market dynamics. Recent data from Talos reveals that the popular crypto basis trade is seeing diminishing returns, now offering yields comparable to traditional U.S. Treasuries. This compression suggests institutional players are recalibrating their strategies as macro conditions evolve. Instead of chasing easy carry yields, capital is becoming more selective, paving the way for organic asset rotation across the broader ecosystem. $BTC $XRP $SOL #Bitcoin #CryptoAnalysis #MarketTrends
Bitcoin just pulled off something extremely rare, dropping 12% below its crucial 200-week moving average. Historically, markets treat these deep structural breaks as major shakeouts rather than the end of the road. With only three prior instances since 2013, the resulting rebound patterns highlight just how resilient macro demand has been during cycle resets. It is a stark reminder that extreme volatility often tests investor conviction right before major trend shifts unfold. $BTC #Bitcoin #CryptoAnalysis #MarketTrends
Bitcoin just pulled off something extremely rare, dropping 12% below its crucial 200-week moving average. Historically, markets treat these deep structural breaks as major shakeouts rather than the end of the road. With only three prior instances since 2013, the resulting rebound patterns highlight just how resilient macro demand has been during cycle resets. It is a stark reminder that extreme volatility often tests investor conviction right before major trend shifts unfold. $BTC #Bitcoin #CryptoAnalysis #MarketTrends
18
Traditional tech markets are increasingly colliding with crypto liquidity dynamics. As major AI players like Anthropic move toward public listings, capital shifts in fascinating ways. These corporate milestones often draw sideline cash away from digital assets temporarily. It is a reminder that Bitcoin does not exist in a vacuum; broader macro capital allocation plays a massive role in shaping market depth and trading momentum across global risk-on sectors. $BTC #Bitcoin #Macro #MarketTrends
Traditional tech markets are increasingly colliding with crypto liquidity dynamics. As major AI players like Anthropic move toward public listings, capital shifts in fascinating ways. These corporate milestones often draw sideline cash away from digital assets temporarily. It is a reminder that Bitcoin does not exist in a vacuum; broader macro capital allocation plays a massive role in shaping market depth and trading momentum across global risk-on sectors. $BTC #Bitcoin #Macro #MarketTrends
18
·
--
The crypto market is at a critical crossroads as all eyes remain fixed on Bitcoin while momentum shifts, making the analysis of current price action and key support and resistance levels essential for staying ahead of market volatility and determining whether a major breakout or consolidation phase lies on the horizon. Traders should track critical moving averages and volume profiles closely using advanced charting tools directly on their charts while balancing on-chain data with macroeconomic factors to filter out market noise and spot genuine trend reversals. What is your strategy for the current BTC price action? Drop your insights and analysis below! #Bitcoin #BTC #CryptoTrading #TechnicalAnalysis #BinanceSquare #MarketTrends
The crypto market is at a critical crossroads as all eyes remain fixed on Bitcoin while momentum shifts, making the analysis of current price action and key support and resistance levels essential for staying ahead of market volatility and determining whether a major breakout or consolidation phase lies on the horizon. Traders should track critical moving averages and volume profiles closely using advanced charting tools directly on their charts while balancing on-chain data with macroeconomic factors to filter out market noise and spot genuine trend reversals. What is your strategy for the current BTC price action? Drop your insights and analysis below! #Bitcoin #BTC #CryptoTrading #TechnicalAnalysis #BinanceSquare #MarketTrends
1
82

·
--
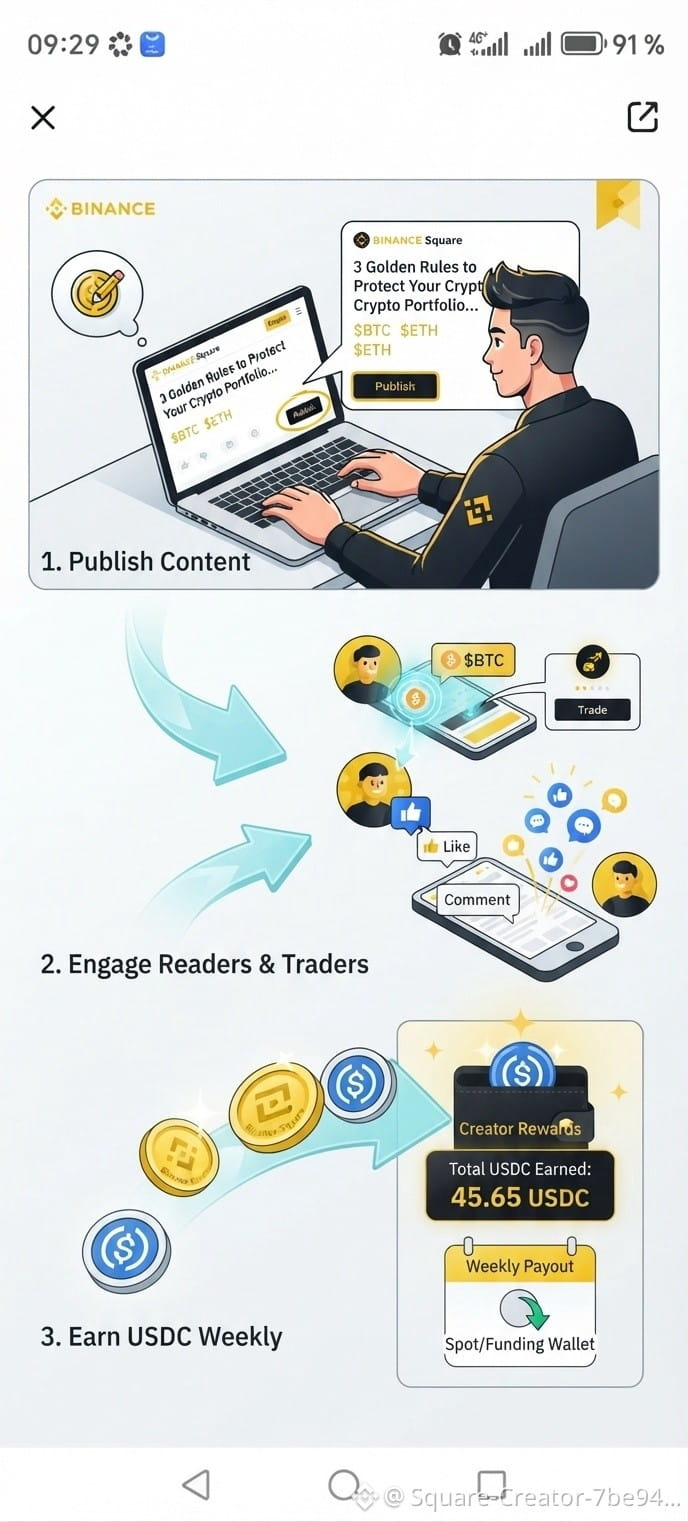
Title: 3 Golden Rules to Protect Your Crypto Portfolio in Current Market Volatility 📉🚀
Content: Hello Binance Square Community! 🌟
With the constant market fluctuations recently, many crypto traders fall into the trap of emotional decision-making, leading to major portfolio losses.
Success in this market isn’t about luck; it’s about discipline and risk management. Here are 3 golden rules you should strictly follow:
1/ Don't Put All Your Eggs in One Basket (Diversification):
Spreading your investments across major, stable assets like $BTC and $ETH helps cushion the blow during sudden market drops.
2/ Use Dollar-Cost Averaging (DCA):
Instead of investing your entire capital all at once at high prices, use DCA to build your positions gradually over time for a better average entry price.
3/ Control Your Emotions (Fear & Greed):
FOMO buying and panic selling are your portfolio's worst enemies. Stick to a clear, analytical plan rather than trading on impulse.
What do you think? 👇 In your opinion, which cryptocurrency is worth watching most this week? Let me know in the comments!
(Disclaimer: This post is for educational and informational purposes only and does not constitute financial advice.)
#Write2Earn #CryptoEducation #BinanceSquare #MarketTrends
Title: 3 Golden Rules to Protect Your Crypto Portfolio in Current Market Volatility 📉🚀
Content: Hello Binance Square Community! 🌟
With the constant market fluctuations recently, many crypto traders fall into the trap of emotional decision-making, leading to major portfolio losses.
Success in this market isn’t about luck; it’s about discipline and risk management. Here are 3 golden rules you should strictly follow:
1/ Don't Put All Your Eggs in One Basket (Diversification):
Spreading your investments across major, stable assets like $BTC and $ETH helps cushion the blow during sudden market drops.
2/ Use Dollar-Cost Averaging (DCA):
Instead of investing your entire capital all at once at high prices, use DCA to build your positions gradually over time for a better average entry price.
3/ Control Your Emotions (Fear & Greed):
FOMO buying and panic selling are your portfolio's worst enemies. Stick to a clear, analytical plan rather than trading on impulse.
What do you think? 👇 In your opinion, which cryptocurrency is worth watching most this week? Let me know in the comments!
(Disclaimer: This post is for educational and informational purposes only and does not constitute financial advice.)
#Write2Earn #CryptoEducation #BinanceSquare #MarketTrends
Content: Hello Binance Square Community! 🌟
With the constant market fluctuations recently, many crypto traders fall into the trap of emotional decision-making, leading to major portfolio losses.
Success in this market isn’t about luck; it’s about discipline and risk management. Here are 3 golden rules you should strictly follow:
1/ Don't Put All Your Eggs in One Basket (Diversification):
Spreading your investments across major, stable assets like $BTC and $ETH helps cushion the blow during sudden market drops.
2/ Use Dollar-Cost Averaging (DCA):
Instead of investing your entire capital all at once at high prices, use DCA to build your positions gradually over time for a better average entry price.
3/ Control Your Emotions (Fear & Greed):
FOMO buying and panic selling are your portfolio's worst enemies. Stick to a clear, analytical plan rather than trading on impulse.
What do you think? 👇 In your opinion, which cryptocurrency is worth watching most this week? Let me know in the comments!
(Disclaimer: This post is for educational and informational purposes only and does not constitute financial advice.)
#Write2Earn #CryptoEducation #BinanceSquare #MarketTrends
1
23

·
--
Market Trends
The majors are holding at levels that indicate a potential trend reversal, with $BTC sitting at a dominant position and $ETH making up 10.0% of the global market cap. BTC dominance is at 58.6%, which is a significant indicator of the current market sentiment. The Crypto Catalyst
$BTC is ranked #1 and its dominance is a key factor in determining the overall trend, with a global market cap of $2218.4B. The Fear & Greed Index is at 19/100, indicating EXTREME FEAR in the market, which can be a sign of a potential reversal. The Dynamic Outlook
If the majors continue to hold their current levels, we can expect a potential trend reversal, with $BTC and $ETH leading the way. The current market sentiment is one of EXTREME FEAR, which can be a sign of a potential reversal, and the dominance of $BTC is a key factor in determining the overall trend. Disclaimer
The information provided is based on current market data and should not be taken as investment advice. Bitcoin #Ethereum #MarketTrends
Market Trends
The majors are holding at levels that indicate a potential trend reversal, with $BTC sitting at a dominant position and $ETH making up 10.0% of the global market cap. BTC dominance is at 58.6%, which is a significant indicator of the current market sentiment. The Crypto Catalyst
$BTC is ranked #1 and its dominance is a key factor in determining the overall trend, with a global market cap of $2218.4B. The Fear & Greed Index is at 19/100, indicating EXTREME FEAR in the market, which can be a sign of a potential reversal. The Dynamic Outlook
If the majors continue to hold their current levels, we can expect a potential trend reversal, with $BTC and $ETH leading the way. The current market sentiment is one of EXTREME FEAR, which can be a sign of a potential reversal, and the dominance of $BTC is a key factor in determining the overall trend. Disclaimer
The information provided is based on current market data and should not be taken as investment advice. Bitcoin #Ethereum #MarketTrends
The majors are holding at levels that indicate a potential trend reversal, with $BTC sitting at a dominant position and $ETH making up 10.0% of the global market cap. BTC dominance is at 58.6%, which is a significant indicator of the current market sentiment. The Crypto Catalyst
$BTC is ranked #1 and its dominance is a key factor in determining the overall trend, with a global market cap of $2218.4B. The Fear & Greed Index is at 19/100, indicating EXTREME FEAR in the market, which can be a sign of a potential reversal. The Dynamic Outlook
If the majors continue to hold their current levels, we can expect a potential trend reversal, with $BTC and $ETH leading the way. The current market sentiment is one of EXTREME FEAR, which can be a sign of a potential reversal, and the dominance of $BTC is a key factor in determining the overall trend. Disclaimer
The information provided is based on current market data and should not be taken as investment advice. Bitcoin #Ethereum #MarketTrends
34
Market corrections often stem from unexpected macroeconomic crosscurrents rather than network fundamentals. Recent capital shifts toward major tech developments and AI giant liquidity events have temporarily redirected institutional attention away from altcoins. While the sharp drawdown tested sentiment, infrastructure growth and developer activity continue moving forward independently of short-term liquidity crunches. $ETH $NVDA #Ethereum #CryptoAnalysis #MarketTrends
Market corrections often stem from unexpected macroeconomic crosscurrents rather than network fundamentals. Recent capital shifts toward major tech developments and AI giant liquidity events have temporarily redirected institutional attention away from altcoins. While the sharp drawdown tested sentiment, infrastructure growth and developer activity continue moving forward independently of short-term liquidity crunches. $ETH $NVDA #Ethereum #CryptoAnalysis #MarketTrends
277
The latest Q3 report from Dunamu, the operator behind Upbit, highlights a brutal quarter with a $14 million net loss and a sharp 61% drop in revenue. This massive swing from last year's profits underscores how heavily exchange earnings rely on sustained retail momentum and bull market hype. When volume dries up, even industry giants feel the squeeze. Exchange tokens and broader market sentiment often react to these macro shifts, signaling a crucial cooling-off period for major regional platforms right now. #CryptoNews #Upbit #MarketTrends
The latest Q3 report from Dunamu, the operator behind Upbit, highlights a brutal quarter with a $14 million net loss and a sharp 61% drop in revenue. This massive swing from last year's profits underscores how heavily exchange earnings rely on sustained retail momentum and bull market hype. When volume dries up, even industry giants feel the squeeze. Exchange tokens and broader market sentiment often react to these macro shifts, signaling a crucial cooling-off period for major regional platforms right now. #CryptoNews #Upbit #MarketTrends
1
Recent market data highlights a shifting dynamic in Bitcoin trading behavior, with domestic US session pressure appearing as a primary catalyst behind the latest downside volatility. Meanwhile, broader tech sector developments continue to capture the attention of macro observers. Rather than chasing short-term market noise, seasoned participants are focusing on underlying structural liquidity shifts and global economic indicators. Understanding these regional trading patterns remains essential for navigating current market phases effectively. $BTC $NVDA #Bitcoin #CryptoAnalysis #MarketTrends
Recent market data highlights a shifting dynamic in Bitcoin trading behavior, with domestic US session pressure appearing as a primary catalyst behind the latest downside volatility. Meanwhile, broader tech sector developments continue to capture the attention of macro observers. Rather than chasing short-term market noise, seasoned participants are focusing on underlying structural liquidity shifts and global economic indicators. Understanding these regional trading patterns remains essential for navigating current market phases effectively. $BTC $NVDA #Bitcoin #CryptoAnalysis #MarketTrends
38
The recent streak of spot Bitcoin ETF outflows shows institutional sentiment is cooling off as macro pressures mount. While billions leaving the funds in November highlights cautious positioning, it is a reminder that market cycles always feature phases of heavy consolidation. Long-term trends are rarely defined by single-month flows, making structural health far more telling than short-term capital shifts. $BTC #Bitcoin #Crypto #MarketTrends
The recent streak of spot Bitcoin ETF outflows shows institutional sentiment is cooling off as macro pressures mount. While billions leaving the funds in November highlights cautious positioning, it is a reminder that market cycles always feature phases of heavy consolidation. Long-term trends are rarely defined by single-month flows, making structural health far more telling than short-term capital shifts. $BTC #Bitcoin #Crypto #MarketTrends
Recent institutional outflow data highlights a shifting mood around spot Bitcoin ETFs, marked by notable consecutive withdrawal streaks from major funds. While these products previously served as relentless demand drivers, the current trend shows capital taking a cautious pause. Market participants are watching how institutional sentiment evolves amid broader macro developments and shifting liquidity dynamics across the ecosystem. $BTC #Bitcoin #CryptoAnalysis #MarketTrends
Recent institutional outflow data highlights a shifting mood around spot Bitcoin ETFs, marked by notable consecutive withdrawal streaks from major funds. While these products previously served as relentless demand drivers, the current trend shows capital taking a cautious pause. Market participants are watching how institutional sentiment evolves amid broader macro developments and shifting liquidity dynamics across the ecosystem. $BTC #Bitcoin #CryptoAnalysis #MarketTrends
70

·
--
ສັນຍານໝີ
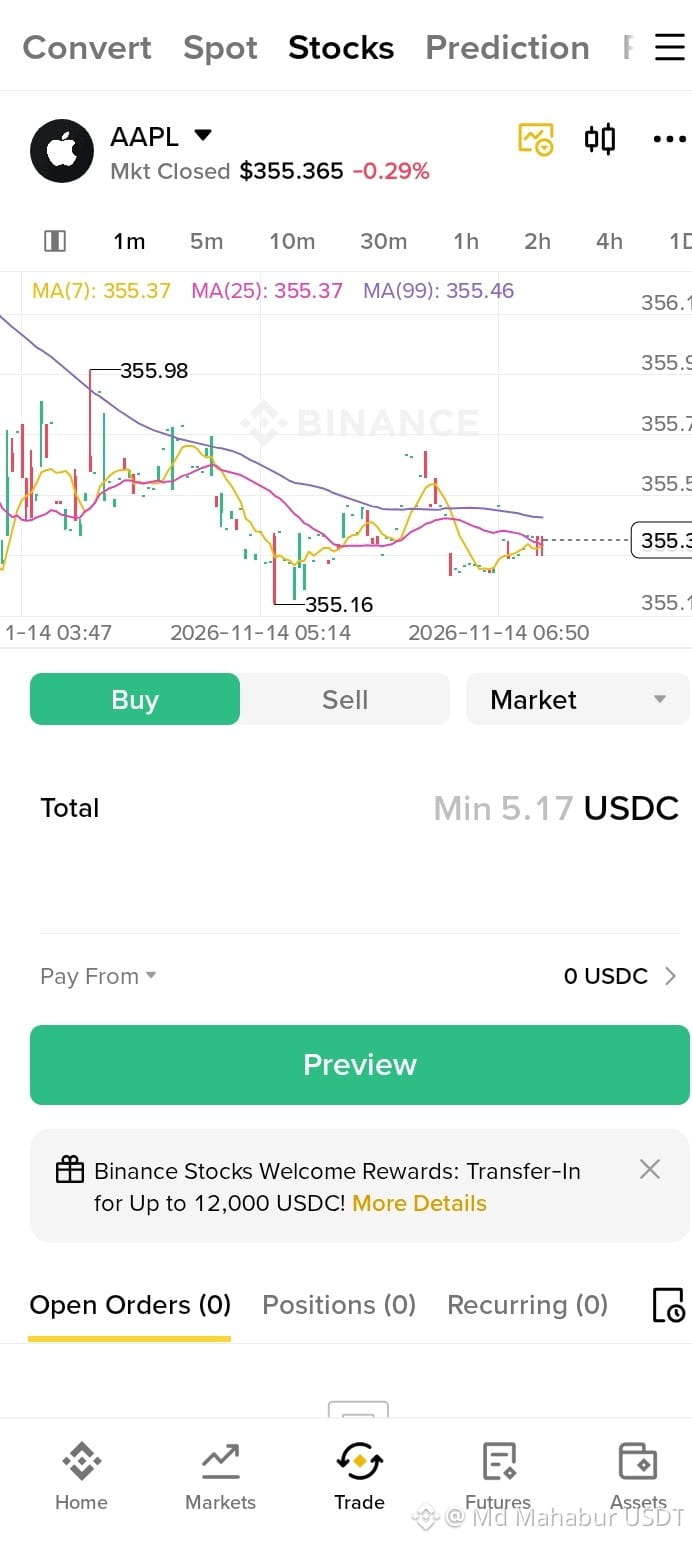
$$Apple (AAPL) stocks looking steady on Binance! 📈 analyzing the market trends and planning the next move. What are your thoughts on tech stocks right now?
#Apple #AAPL #Binance #StockTrading #MarketTrends $AAPLB
$$Apple (AAPL) stocks looking steady on Binance! 📈 analyzing the market trends and planning the next move. What are your thoughts on tech stocks right now?
#Apple #AAPL #Binance #StockTrading #MarketTrends $AAPLB
#Apple #AAPL #Binance #StockTrading #MarketTrends $AAPLB
120

·
--
港股今日大跌!恒指跌0.92%,科指跌1.75%。PCB和光通信板块领跌,景旺电子暴跌超10%。BOSS直聘暴跌23%!石油天然气板块逆势上涨。市场情绪谨慎,投资者观望。#港股 #市场趋势 $BTC $ETH
Hong Kong stocks taking a hit today! Hang Seng down 0.92%, Tech Index down 1.75%. PCB and optical communication sectors leading the decline. Boss直聘 crashing 23%! Oil and gas sector bucking the trend. Cautious market sentiment, investors watching closely. #Stocks #MarketTrends $BTC $ETH
港股今日大跌!恒指跌0.92%,科指跌1.75%。PCB和光通信板块领跌,景旺电子暴跌超10%。BOSS直聘暴跌23%!石油天然气板块逆势上涨。市场情绪谨慎,投资者观望。#港股 #市场趋势 $BTC $ETH
Hong Kong stocks taking a hit today! Hang Seng down 0.92%, Tech Index down 1.75%. PCB and optical communication sectors leading the decline. Boss直聘 crashing 23%! Oil and gas sector bucking the trend. Cautious market sentiment, investors watching closely. #Stocks #MarketTrends $BTC $ETH
Hong Kong stocks taking a hit today! Hang Seng down 0.92%, Tech Index down 1.75%. PCB and optical communication sectors leading the decline. Boss直聘 crashing 23%! Oil and gas sector bucking the trend. Cautious market sentiment, investors watching closely. #Stocks #MarketTrends $BTC $ETH
413

RETAIL VOLUME DRYING UP AS $GEMI CUTS COSTS AND PIVOTS TO PREDICTIONS! 📉⚡
The latest earnings from $GEMI expose a harsh reality: retail capital has gone quiet after the initial 2025 euphoria. 📊 Trading volume cratering by over seventy percent shows liquidity migrating elsewhere while exchanges tighten their belts to survive the winter. 🛡️
Even with a narrowed net loss and rising platform assets, the pivot toward prediction markets reveals where platforms are scrambling for fresh revenue streams. 💡 When traditional spot volume cools down, survival demands aggressive adaptation and lean operations. ⚡
💬 Are prediction markets enough to rescue exchange margins, or is retail waiting on the sidelines for the next major macro catalyst? 👇
⚠️ Not financial advice. Always manage your risk. 🛡️
🏷️ #GEMI #CryptoExchange #Earnings #MarketTrends
🔥 💎
RETAIL VOLUME DRYING UP AS $GEMI CUTS COSTS AND PIVOTS TO PREDICTIONS! 📉⚡
The latest earnings from $GEMI expose a harsh reality: retail capital has gone quiet after the initial 2025 euphoria. 📊 Trading volume cratering by over seventy percent shows liquidity migrating elsewhere while exchanges tighten their belts to survive the winter. 🛡️
Even with a narrowed net loss and rising platform assets, the pivot toward prediction markets reveals where platforms are scrambling for fresh revenue streams. 💡 When traditional spot volume cools down, survival demands aggressive adaptation and lean operations. ⚡
💬 Are prediction markets enough to rescue exchange margins, or is retail waiting on the sidelines for the next major macro catalyst? 👇
⚠️ Not financial advice. Always manage your risk. 🛡️
🏷️ #GEMI #CryptoExchange #Earnings #MarketTrends
🔥 💎
The latest earnings from $GEMI expose a harsh reality: retail capital has gone quiet after the initial 2025 euphoria. 📊 Trading volume cratering by over seventy percent shows liquidity migrating elsewhere while exchanges tighten their belts to survive the winter. 🛡️
Even with a narrowed net loss and rising platform assets, the pivot toward prediction markets reveals where platforms are scrambling for fresh revenue streams. 💡 When traditional spot volume cools down, survival demands aggressive adaptation and lean operations. ⚡
💬 Are prediction markets enough to rescue exchange margins, or is retail waiting on the sidelines for the next major macro catalyst? 👇
⚠️ Not financial advice. Always manage your risk. 🛡️
🏷️ #GEMI #CryptoExchange #Earnings #MarketTrends
🔥 💎
GEMIUS+3,65%
3
·
--
比特币ETF资金流出16亿美元,股市却迎来逢低买入热潮!这波资金流向背后藏着什么信号?$BTC #BitcoinETF #市场趋势
Bitcoin ETFs saw $1.6 billion outflows in November while equity markets are experiencing dip buying frenzy. What's behind this capital shift? $BTC #BitcoinETF #MarketTrends
比特币ETF资金流出16亿美元,股市却迎来逢低买入热潮!这波资金流向背后藏着什么信号?$BTC #BitcoinETF #市场趋势
Bitcoin ETFs saw $1.6 billion outflows in November while equity markets are experiencing dip buying frenzy. What's behind this capital shift? $BTC #BitcoinETF #MarketTrends
Bitcoin ETFs saw $1.6 billion outflows in November while equity markets are experiencing dip buying frenzy. What's behind this capital shift? $BTC #BitcoinETF #MarketTrends
63
·
--
A股培育钻石概念股集体大涨,力量钻石飙涨近10%。传统市场的火热表明人们对替代钻石的投资需求正在上升。这可能预示着加密世界中钻石主题NFT和相关代币的潜力正在被市场重新评估。关注市场趋势变化!
A-share cultivated diamond stocks are surging, with Liliang Diamond jumping nearly 10%. This rally in traditional markets shows growing demand for alternative diamond investments. It may signal renewed market interest in diamond-themed NFTs and related tokens in the crypto space. Keep an eye on these trends!
#MarketTrends $DIAM
A股培育钻石概念股集体大涨,力量钻石飙涨近10%。传统市场的火热表明人们对替代钻石的投资需求正在上升。这可能预示着加密世界中钻石主题NFT和相关代币的潜力正在被市场重新评估。关注市场趋势变化!
A-share cultivated diamond stocks are surging, with Liliang Diamond jumping nearly 10%. This rally in traditional markets shows growing demand for alternative diamond investments. It may signal renewed market interest in diamond-themed NFTs and related tokens in the crypto space. Keep an eye on these trends!
#MarketTrends $DIAM
A-share cultivated diamond stocks are surging, with Liliang Diamond jumping nearly 10%. This rally in traditional markets shows growing demand for alternative diamond investments. It may signal renewed market interest in diamond-themed NFTs and related tokens in the crypto space. Keep an eye on these trends!
#MarketTrends $DIAM
1

🇺🇸 TRUMP, CRYPTO & BITCOIN: WHAT'S NEXT FOR THE MARKET? ₿
Donald Trump's political decisions and US economic policies continue to influence global financial markets, including cryptocurrency. 🇺🇸
📊 Bitcoin Market Outlook
$BTC remains sensitive to political developments, regulatory uncertainty, and global economic conditions. Recent market volatility shows why traders should watch key support and resistance levels carefully.
🔥 Key Things to Watch:
• US crypto regulations and government policies.
• Trump's influence on crypto market sentiment.
• Bitcoin buying and selling pressure.
• Institutional demand and market liquidity.
💡 My View: Political headlines can create short-term volatility, but Bitcoin's long-term direction depends on broader adoption, liquidity, and market demand.
Are Trump's policies bullish or bearish for Bitcoin? 🤔
👇 Share your thoughts!
#Bitcoin #$BTC #TRUMP #cryptouniverseofficial
{spot}(BTCUSDT)
#Binance #CryptoAnalysis #MarketTrends #Trading
🇺🇸 TRUMP, CRYPTO & BITCOIN: WHAT'S NEXT FOR THE MARKET? ₿
Donald Trump's political decisions and US economic policies continue to influence global financial markets, including cryptocurrency. 🇺🇸
📊 Bitcoin Market Outlook
$BTC remains sensitive to political developments, regulatory uncertainty, and global economic conditions. Recent market volatility shows why traders should watch key support and resistance levels carefully.
🔥 Key Things to Watch:
• US crypto regulations and government policies.
• Trump's influence on crypto market sentiment.
• Bitcoin buying and selling pressure.
• Institutional demand and market liquidity.
💡 My View: Political headlines can create short-term volatility, but Bitcoin's long-term direction depends on broader adoption, liquidity, and market demand.
Are Trump's policies bullish or bearish for Bitcoin? 🤔
👇 Share your thoughts!
#Bitcoin #$BTC #TRUMP #cryptouniverseofficial
#Binance #CryptoAnalysis #MarketTrends #Trading
Donald Trump's political decisions and US economic policies continue to influence global financial markets, including cryptocurrency. 🇺🇸
📊 Bitcoin Market Outlook
$BTC remains sensitive to political developments, regulatory uncertainty, and global economic conditions. Recent market volatility shows why traders should watch key support and resistance levels carefully.
🔥 Key Things to Watch:
• US crypto regulations and government policies.
• Trump's influence on crypto market sentiment.
• Bitcoin buying and selling pressure.
• Institutional demand and market liquidity.
💡 My View: Political headlines can create short-term volatility, but Bitcoin's long-term direction depends on broader adoption, liquidity, and market demand.
Are Trump's policies bullish or bearish for Bitcoin? 🤔
👇 Share your thoughts!
#Bitcoin #$BTC #TRUMP #cryptouniverseofficial
#Binance #CryptoAnalysis #MarketTrends #Trading
218

·
--
$SOL — Solana's recent weekly decline makes its next support test important; strong spot buying and a recovery above resistance could signal that market confidence is returning.
{spot}(SOLUSDT)
$XRP — XRP has faced notable selling pressure during the latest correction; traders should watch whether buyers defend the current support structure or sellers maintain control.
{spot}(XRPUSDT)
$DOGE — Dogecoin remains one of the market's most actively traded meme assets; a rise in volume alongside higher lows could provide an early sign of improving sentiment.
{spot}(DOGEUSDT)
#SOL #XRP #DOGE #CryptoTrading #MarketTrends
$SOL — Solana's recent weekly decline makes its next support test important; strong spot buying and a recovery above resistance could signal that market confidence is returning.
$XRP — XRP has faced notable selling pressure during the latest correction; traders should watch whether buyers defend the current support structure or sellers maintain control.
$DOGE — Dogecoin remains one of the market's most actively traded meme assets; a rise in volume alongside higher lows could provide an early sign of improving sentiment.
#SOL #XRP #DOGE #CryptoTrading #MarketTrends
$XRP — XRP has faced notable selling pressure during the latest correction; traders should watch whether buyers defend the current support structure or sellers maintain control.
$DOGE — Dogecoin remains one of the market's most actively traded meme assets; a rise in volume alongside higher lows could provide an early sign of improving sentiment.
#SOL #XRP #DOGE #CryptoTrading #MarketTrends

4
ເຂົ້າສູ່ລະບົບເພື່ອສຳຫຼວດເນື້ອຫາເພີ່ມເຕີມ
ເຂົ້າຮ່ວມກຸ່ມຜູ້ໃຊ້ຄຣິບໂຕທົ່ວໂລກໃນ Binance Square.
⚡️ ໄດ້ຮັບຂໍ້ມູນຫຼ້າສຸດ ແລະ ທີ່ມີປະໂຫຍດກ່ຽວກັບຄຣິບໂຕ.
💬 ໄດ້ຮັບຄວາມໄວ້ວາງໃຈຈາກຕະຫຼາດແລກປ່ຽນຄຣິບໂຕທີ່ໃຫຍ່ທີ່ສຸດໃນໂລກ.
👍 ຄົ້ນຫາຂໍ້ມູນເຊີງເລິກທີ່ແທ້ຈາກນັກສ້າງທີ່ໄດ້ຮັບການຢືນຢັນ.
ອີເມວ / ເບີໂທລະສັບ
ຫົວຂໍ້ທີ່ກໍາລັງນິຍົມ
1
#NvidiaBeatsEstimatesWith$130BQ4Outlook
9,415 ຄັ້ງທີ່ເບິ່ງ
142 ກຳລັງສົນທະນາ
2
#AnthropicIPOPriceCouldExceed$80
15,397 ຄັ້ງທີ່ເບິ່ງ
129 ກຳລັງສົນທະນາ
3
#CanNvidia’sDataCenterGrowthContinue?
46,382 ຄັ້ງທີ່ເບິ່ງ
637 ກຳລັງສົນທະນາ
4
#CanadaAndUSLaunchOperationNiagaraAgainstApprovalPhishing
1,234 ຄັ້ງທີ່ເບິ່ງ
21 ກຳລັງສົນທະນາ
5
#BankOfEnglandUnveilsClearingHousePathwayCoveringDLTFirms
1,601 ຄັ້ງທີ່ເບິ່ງ
38 ກຳລັງສົນທະນາ
6
#DBSAndCirclePartnerToExpandAsianInstitutionsUSDCAccess
3,045 ຄັ້ງທີ່ເບິ່ງ
52 ກຳລັງສົນທະນາ
7
#LedgerHardwareImplantReportsExtendToDubai
14,788 ຄັ້ງທີ່ເບິ່ງ
235 ກຳລັງສົນທະນາ
8
#NvidiaBoardNotConsideringHuang’sReturnasCEO
209,285 ຄັ້ງທີ່ເບິ່ງ
1,499 ກຳລັງສົນທະນາ
9
#KOSPIFalls2.59%ToLowestCloseSinceFebruary
60,893 ຄັ້ງທີ່ເບິ່ງ
700 ກຳລັງສົນທະນາ
10
#AnthropicClearedToListOnNasdaqAsANT
54,245 ຄັ້ງທີ່ເບິ່ງ
569 ກຳລັງສົນທະນາ