

#bitcoinspotetfs$999mnetinflow
bitcoinspotetfs$999mnetinflow
4,282 views
53 ກຳລັງສົນທະນາ
ມາແຮງ
ຫຼ້າສຸດ

·
--
ສັນຍານກະທິງ
📊 BIG MONEY IS BACK.
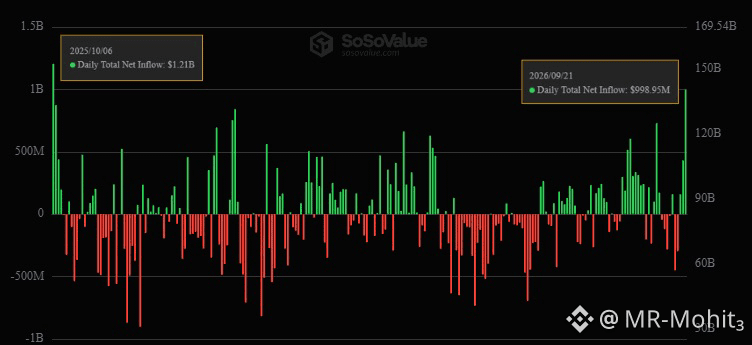
US Spot Bitcoin ETFs pulled in $999M, while Ethereum ETFs added $270M — their biggest inflows since the October 10 crash.
$BTC pushed above $86K and $ETH reclaimed $2.7K.
ETF demand is heating up again. 👀₿#CardanoAddedToX402KitForADAPayments #BitcoinSpotETFs$999MNetInflow
📊 BIG MONEY IS BACK.
US Spot Bitcoin ETFs pulled in $999M, while Ethereum ETFs added $270M — their biggest inflows since the October 10 crash.
$BTC pushed above $86K and $ETH reclaimed $2.7K.
ETF demand is heating up again. 👀₿#CardanoAddedToX402KitForADAPayments #BitcoinSpotETFs$999MNetInflow
US Spot Bitcoin ETFs pulled in $999M, while Ethereum ETFs added $270M — their biggest inflows since the October 10 crash.
$BTC pushed above $86K and $ETH reclaimed $2.7K.
ETF demand is heating up again. 👀₿#CardanoAddedToX402KitForADAPayments #BitcoinSpotETFs$999MNetInflow
1
2.9k

·
--
ສັນຍານກະທິງ
#BitcoinSpotETFs$999MNetInflow
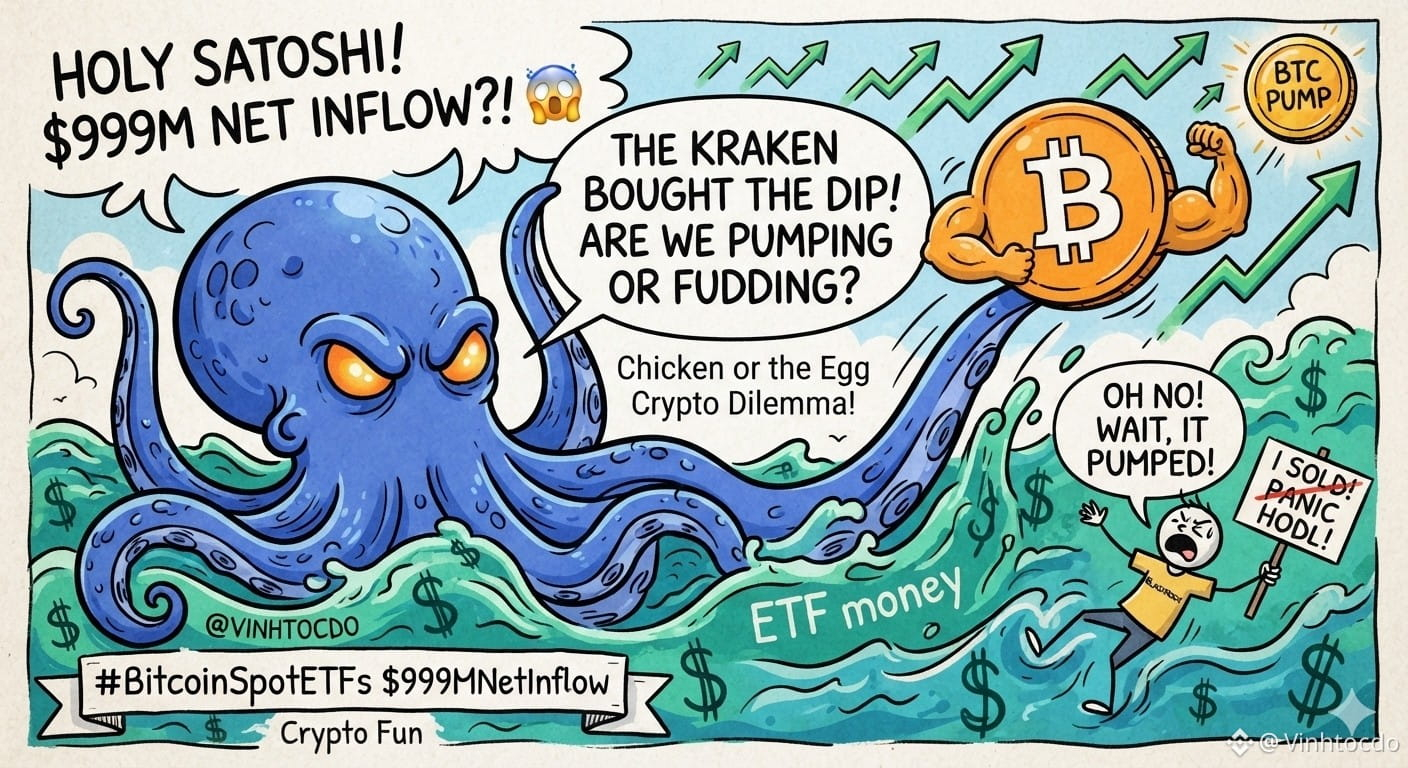
Holy Satoshi! $999M net inflow in just ONE day?! 🤯 That’s not a whale, that’s a whole kraken buying the dip!
But wait... did this massive wall of money flood in before or after BTC pumped? 🤔 Did the institutions pump our bags, or did they FOMO in after seeing green candles? Classic chicken-and-egg crypto dilemma!
What should traders do?
🛡️ Sit tight and don't panic-sell to BlackRock.
📈 Click below to trade and support your favorite captain! 👇
🪙 $BTC
{future}(BTCUSDT)
🪙 $IBIT.ETF
{etf_us}(IBIT.ETF)
🪙 $ARKB.ETF
{etf_us}(ARKB.ETF)
Not financial advice! Always DYOR!⚠️
🚀 Use code VINHTOCDO or click here to claim your bonus: [binance.com](https://www.binance.com/register?ref=VINHTOCDO)
#BitcoinSpotETFs$999MNetInflow #BitcoinETFs #CryptoTrading #whalealerts #BTC #BullRun #VINHTOCDO
#BitcoinSpotETFs$999MNetInflow
Holy Satoshi! $999M net inflow in just ONE day?! 🤯 That’s not a whale, that’s a whole kraken buying the dip!
But wait... did this massive wall of money flood in before or after BTC pumped? 🤔 Did the institutions pump our bags, or did they FOMO in after seeing green candles? Classic chicken-and-egg crypto dilemma!
What should traders do?
🛡️ Sit tight and don't panic-sell to BlackRock.
📈 Click below to trade and support your favorite captain! 👇
🪙 $BTC
🪙 $IBIT.ETF
🪙 $ARKB.ETF
Not financial advice! Always DYOR!⚠️
🚀 Use code VINHTOCDO or click here to claim your bonus: binance.com
#BitcoinSpotETFs$999MNetInflow #BitcoinETFs #CryptoTrading #whalealerts #BTC #BullRun #VINHTOCDO
Holy Satoshi! $999M net inflow in just ONE day?! 🤯 That’s not a whale, that’s a whole kraken buying the dip!
But wait... did this massive wall of money flood in before or after BTC pumped? 🤔 Did the institutions pump our bags, or did they FOMO in after seeing green candles? Classic chicken-and-egg crypto dilemma!
What should traders do?
🛡️ Sit tight and don't panic-sell to BlackRock.
📈 Click below to trade and support your favorite captain! 👇
🪙 $BTC
🪙 $IBIT.ETF
🪙 $ARKB.ETF
Not financial advice! Always DYOR!⚠️
🚀 Use code VINHTOCDO or click here to claim your bonus: binance.com
#BitcoinSpotETFs$999MNetInflow #BitcoinETFs #CryptoTrading #whalealerts #BTC #BullRun #VINHTOCDO
2
84


·
--
ສັນຍານກະທິງ
🚨 Bitcoin Spot ETFs Add $999M — Can the Inflows Continue?
Nearly $ 1 billion in fresh net inflows puts Bitcoin ETF demand back in focus.
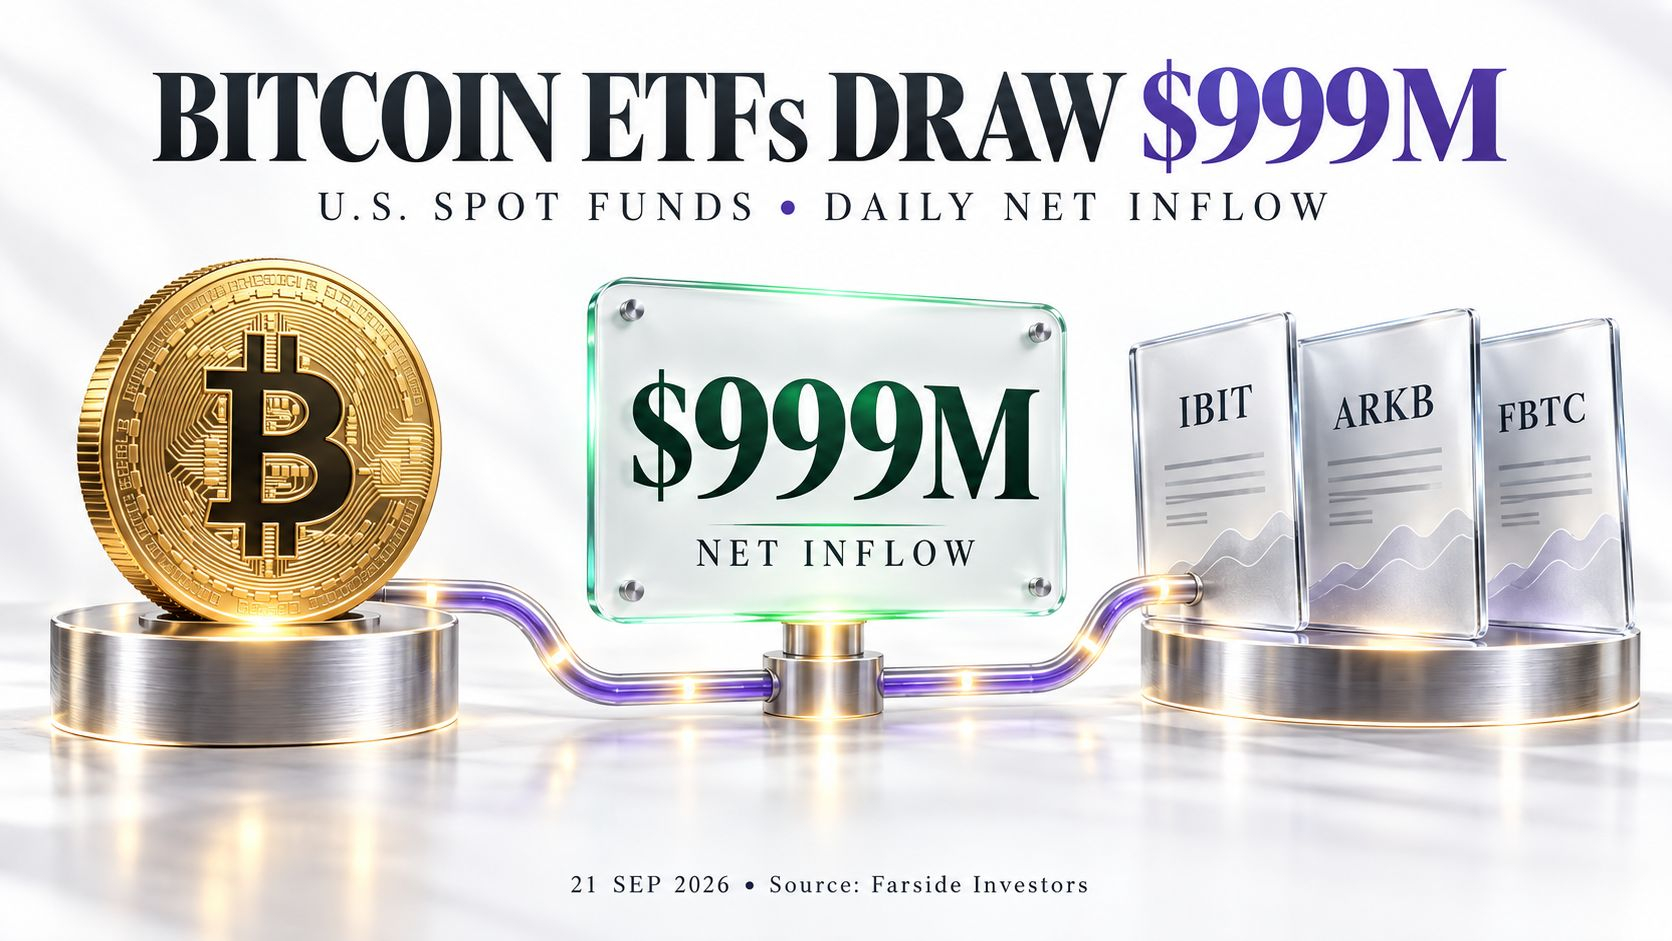
U.S. spot Bitcoin ETFs recorded $999 million in net inflows on September 21, 2026, according to Farside Investors.
The biggest contributors:
BlackRock’s IBIT: $381.4 million
ARK/21Shares’ ARKB: $289.1 million
Fidelity’s FBTC: $238.8 million
Together, those three funds contributed approximately 91% of the daily total.
This marked the third consecutive positive trading session, bringing combined net inflows across September 17, 18 and 21 to approximately $1.59 billion.
My take: The strongest part of this headline is the continuation of positive flows. Repeated net subscriptions provide more evidence of sustained demand than a single unusually strong session.
But concentration matters. With three products dominating the total, broader participation would strengthen the picture. ETF flows also cannot tell us every buyer’s identity, intended holding period or positions elsewhere.
The next useful signals are whether inflows persist, whether more funds contribute meaningfully, and how Bitcoin responds if subscriptions slow. Strong demand can support the market, but one day’s flow does not establish a price target.
Will ETF demand keep building—or does Bitcoin need another catalyst?
#bitcoin #etf #BitcoinSpotETFs$999MNetInflow
$MUBARAK $BTC $AKE
{future}(AKEUSDT)
{future}(BTCUSDT)
{future}(MUBARAKUSDT)
🚨 Bitcoin Spot ETFs Add $999M — Can the Inflows Continue?
Nearly $ 1 billion in fresh net inflows puts Bitcoin ETF demand back in focus.
U.S. spot Bitcoin ETFs recorded $999 million in net inflows on September 21, 2026, according to Farside Investors.
The biggest contributors:
BlackRock’s IBIT: $381.4 million
ARK/21Shares’ ARKB: $289.1 million
Fidelity’s FBTC: $238.8 million
Together, those three funds contributed approximately 91% of the daily total.
This marked the third consecutive positive trading session, bringing combined net inflows across September 17, 18 and 21 to approximately $1.59 billion.
My take: The strongest part of this headline is the continuation of positive flows. Repeated net subscriptions provide more evidence of sustained demand than a single unusually strong session.
But concentration matters. With three products dominating the total, broader participation would strengthen the picture. ETF flows also cannot tell us every buyer’s identity, intended holding period or positions elsewhere.
The next useful signals are whether inflows persist, whether more funds contribute meaningfully, and how Bitcoin responds if subscriptions slow. Strong demand can support the market, but one day’s flow does not establish a price target.
Will ETF demand keep building—or does Bitcoin need another catalyst?
#bitcoin #etf #BitcoinSpotETFs$999MNetInflow
$MUBARAK $BTC $AKE
Nearly $ 1 billion in fresh net inflows puts Bitcoin ETF demand back in focus.
U.S. spot Bitcoin ETFs recorded $999 million in net inflows on September 21, 2026, according to Farside Investors.
The biggest contributors:
BlackRock’s IBIT: $381.4 million
ARK/21Shares’ ARKB: $289.1 million
Fidelity’s FBTC: $238.8 million
Together, those three funds contributed approximately 91% of the daily total.
This marked the third consecutive positive trading session, bringing combined net inflows across September 17, 18 and 21 to approximately $1.59 billion.
My take: The strongest part of this headline is the continuation of positive flows. Repeated net subscriptions provide more evidence of sustained demand than a single unusually strong session.
But concentration matters. With three products dominating the total, broader participation would strengthen the picture. ETF flows also cannot tell us every buyer’s identity, intended holding period or positions elsewhere.
The next useful signals are whether inflows persist, whether more funds contribute meaningfully, and how Bitcoin responds if subscriptions slow. Strong demand can support the market, but one day’s flow does not establish a price target.
Will ETF demand keep building—or does Bitcoin need another catalyst?
#bitcoin #etf #BitcoinSpotETFs$999MNetInflow
$MUBARAK $BTC $AKE
1
72

·
--
#BitcoinSpotETFs$999MNetInflow — INSTITUTIONAL MONEY IS FLOODING BACK INTO BITCOIN.
U.S. spot Bitcoin ETFs pulled in roughly $999 million in net inflows on Sept. 21, one of the strongest institutional demand signals we’ve seen recently. BlackRock’s IBIT led the move, while Bitcoin surged from roughly $81K toward $87K during the same session.
This matters because ETF inflows are one of the cleanest ways to track traditional capital entering Bitcoin.
The setup is simple:
ETF demand rises → spot supply gets absorbed → BTC momentum strengthens → capital can rotate into altcoins.
And that links directly with what we’ve been seeing this morning:
$BTC strength → semiconductor/AI risk-on → crypto market cap expands → high-beta names start moving harder.
If inflows stay elevated for several sessions, this could become more than a one-day squeeze.
Nearly $1B entered Bitcoin ETFs in a single day. The bigger question now: is Wall Street starting another accumulation wave? 👀
{future}(BTCUSDT)
{stock_us}(NVDA.US)
{future}(AMDUSDT)
$NVDA.US $AMD #CardanoAddedToX402KitForADAPayments #XRPRises8% #AMDHits$1TrillionMarketCap #AppleGoogleSeekStablecoinTokenizedDepositTalent
#BitcoinSpotETFs$999MNetInflow — INSTITUTIONAL MONEY IS FLOODING BACK INTO BITCOIN.
U.S. spot Bitcoin ETFs pulled in roughly $999 million in net inflows on Sept. 21, one of the strongest institutional demand signals we’ve seen recently. BlackRock’s IBIT led the move, while Bitcoin surged from roughly $81K toward $87K during the same session.
This matters because ETF inflows are one of the cleanest ways to track traditional capital entering Bitcoin.
The setup is simple:
ETF demand rises → spot supply gets absorbed → BTC momentum strengthens → capital can rotate into altcoins.
And that links directly with what we’ve been seeing this morning:
$BTC strength → semiconductor/AI risk-on → crypto market cap expands → high-beta names start moving harder.
If inflows stay elevated for several sessions, this could become more than a one-day squeeze.
Nearly $1B entered Bitcoin ETFs in a single day. The bigger question now: is Wall Street starting another accumulation wave? 👀
$NVDA.US $AMD #CardanoAddedToX402KitForADAPayments #XRPRises8% #AMDHits$1TrillionMarketCap #AppleGoogleSeekStablecoinTokenizedDepositTalent
U.S. spot Bitcoin ETFs pulled in roughly $999 million in net inflows on Sept. 21, one of the strongest institutional demand signals we’ve seen recently. BlackRock’s IBIT led the move, while Bitcoin surged from roughly $81K toward $87K during the same session.
This matters because ETF inflows are one of the cleanest ways to track traditional capital entering Bitcoin.
The setup is simple:
ETF demand rises → spot supply gets absorbed → BTC momentum strengthens → capital can rotate into altcoins.
And that links directly with what we’ve been seeing this morning:
$BTC strength → semiconductor/AI risk-on → crypto market cap expands → high-beta names start moving harder.
If inflows stay elevated for several sessions, this could become more than a one-day squeeze.
Nearly $1B entered Bitcoin ETFs in a single day. The bigger question now: is Wall Street starting another accumulation wave? 👀
$NVDA.US $AMD #CardanoAddedToX402KitForADAPayments #XRPRises8% #AMDHits$1TrillionMarketCap #AppleGoogleSeekStablecoinTokenizedDepositTalent
87

#BitcoinSpotETFs$999MNetInflow
🚨 Bitcoin $BTC Spot ETFs Pull In $999M: Institutional Demand Roars Back 🚨
Picture the market after a long night of hesitation. Then, almost silently, nearly 1 Dollor billion flows through the ETF door in a single session, and suddenly Bitcoin's story looks different.
U.S. spot Bitcoin ETFs recorded roughly $999 million in net inflows, their strongest single-day inflow in about a year. The scale matters because ETF flows offer a direct window into institutional and traditional-market demand for BTC.
This is more than a headline number. Strong ETF buying arrives while Bitcoin has pushed above $85,000, showing that capital is returning alongside the price move rather than simply chasing a distant narrative.
My take: the primary driver here is capital flow, not supply mechanics. When regulated investment vehicles absorb meaningful spot exposure, available market liquidity can tighten and amplify price movements.
But one strong inflow should not be treated as a permanent trend. ETF demand can reverse quickly, and Bitcoin remains sensitive to macro conditions, rates, liquidity, and positioning.
The useful signal is therefore not “$999M means BTC must rise.” It is that institutional demand is currently strong enough to become a major force in Bitcoin's price discovery.
When capital changes direction, the chart usually tells the story afterward.
❓Do you think sustained ETF inflows can become the next major engine of Bitcoin's momentum?
Disclaimer: This content is for educational purposes only and is not financial advice.
#Bitcoin #BitcoinETF #GrowWithSAC $KERNEL $ONE
#BitcoinSpotETFs$999MNetInflow
🚨 Bitcoin $BTC Spot ETFs Pull In $999M: Institutional Demand Roars Back 🚨
Picture the market after a long night of hesitation. Then, almost silently, nearly 1 Dollor billion flows through the ETF door in a single session, and suddenly Bitcoin's story looks different.
U.S. spot Bitcoin ETFs recorded roughly $999 million in net inflows, their strongest single-day inflow in about a year. The scale matters because ETF flows offer a direct window into institutional and traditional-market demand for BTC.
This is more than a headline number. Strong ETF buying arrives while Bitcoin has pushed above $85,000, showing that capital is returning alongside the price move rather than simply chasing a distant narrative.
My take: the primary driver here is capital flow, not supply mechanics. When regulated investment vehicles absorb meaningful spot exposure, available market liquidity can tighten and amplify price movements.
But one strong inflow should not be treated as a permanent trend. ETF demand can reverse quickly, and Bitcoin remains sensitive to macro conditions, rates, liquidity, and positioning.
The useful signal is therefore not “$999M means BTC must rise.” It is that institutional demand is currently strong enough to become a major force in Bitcoin's price discovery.
When capital changes direction, the chart usually tells the story afterward.
❓Do you think sustained ETF inflows can become the next major engine of Bitcoin's momentum?
Disclaimer: This content is for educational purposes only and is not financial advice.
#Bitcoin #BitcoinETF #GrowWithSAC $KERNEL $ONE
🚨 Bitcoin $BTC Spot ETFs Pull In $999M: Institutional Demand Roars Back 🚨
Picture the market after a long night of hesitation. Then, almost silently, nearly 1 Dollor billion flows through the ETF door in a single session, and suddenly Bitcoin's story looks different.
U.S. spot Bitcoin ETFs recorded roughly $999 million in net inflows, their strongest single-day inflow in about a year. The scale matters because ETF flows offer a direct window into institutional and traditional-market demand for BTC.
This is more than a headline number. Strong ETF buying arrives while Bitcoin has pushed above $85,000, showing that capital is returning alongside the price move rather than simply chasing a distant narrative.
My take: the primary driver here is capital flow, not supply mechanics. When regulated investment vehicles absorb meaningful spot exposure, available market liquidity can tighten and amplify price movements.
But one strong inflow should not be treated as a permanent trend. ETF demand can reverse quickly, and Bitcoin remains sensitive to macro conditions, rates, liquidity, and positioning.
The useful signal is therefore not “$999M means BTC must rise.” It is that institutional demand is currently strong enough to become a major force in Bitcoin's price discovery.
When capital changes direction, the chart usually tells the story afterward.
❓Do you think sustained ETF inflows can become the next major engine of Bitcoin's momentum?
Disclaimer: This content is for educational purposes only and is not financial advice.
#Bitcoin #BitcoinETF #GrowWithSAC $KERNEL $ONE

1
203

·
--
ສັນຍານກະທິງ
#BitcoinSpotETFs$999MNetInflow
🚨 BITCOIN ETF DEMAND JUST EXPLODED! 🔥
U.S. Spot Bitcoin ETFs recorded a massive $999 MILLION net inflow on September 21 — their biggest daily inflow in about a year.
💰 What this means:
• Nearly $1B flowed into spot BTC ETFs in one day
• BlackRock’s IBIT was among the biggest contributors
• Bitcoin surged above $86,000 during the session
• Institutional demand is returning strongly
• ETF buying is adding fresh fuel to the current BTC rally 📈
After heavy ETF outflows earlier in September, this sudden reversal could become a major catalyst for Bitcoin.
🔥 $90K NEXT FOR $BTC ?
#bitcoin #BTC #crypto
#BitcoinSpotETFs$999MNetInflow
🚨 BITCOIN ETF DEMAND JUST EXPLODED! 🔥
U.S. Spot Bitcoin ETFs recorded a massive $999 MILLION net inflow on September 21 — their biggest daily inflow in about a year.
💰 What this means:
• Nearly $1B flowed into spot BTC ETFs in one day
• BlackRock’s IBIT was among the biggest contributors
• Bitcoin surged above $86,000 during the session
• Institutional demand is returning strongly
• ETF buying is adding fresh fuel to the current BTC rally 📈
After heavy ETF outflows earlier in September, this sudden reversal could become a major catalyst for Bitcoin.
🔥 $90K NEXT FOR $BTC ?
#bitcoin #BTC #crypto
🚨 BITCOIN ETF DEMAND JUST EXPLODED! 🔥
U.S. Spot Bitcoin ETFs recorded a massive $999 MILLION net inflow on September 21 — their biggest daily inflow in about a year.
💰 What this means:
• Nearly $1B flowed into spot BTC ETFs in one day
• BlackRock’s IBIT was among the biggest contributors
• Bitcoin surged above $86,000 during the session
• Institutional demand is returning strongly
• ETF buying is adding fresh fuel to the current BTC rally 📈
After heavy ETF outflows earlier in September, this sudden reversal could become a major catalyst for Bitcoin.
🔥 $90K NEXT FOR $BTC ?
#bitcoin #BTC #crypto
BTC+0,45%
IBITETF-0,58%
55

#BitcoinSpotETFs$999MNetInflow
🔥 $BTC BITCOIN ETF FLOWS JUST FIRED A $999M SIGNAL 🚀
Money can whisper for weeks,
then suddenly arrive like a wave nobody can ignore.
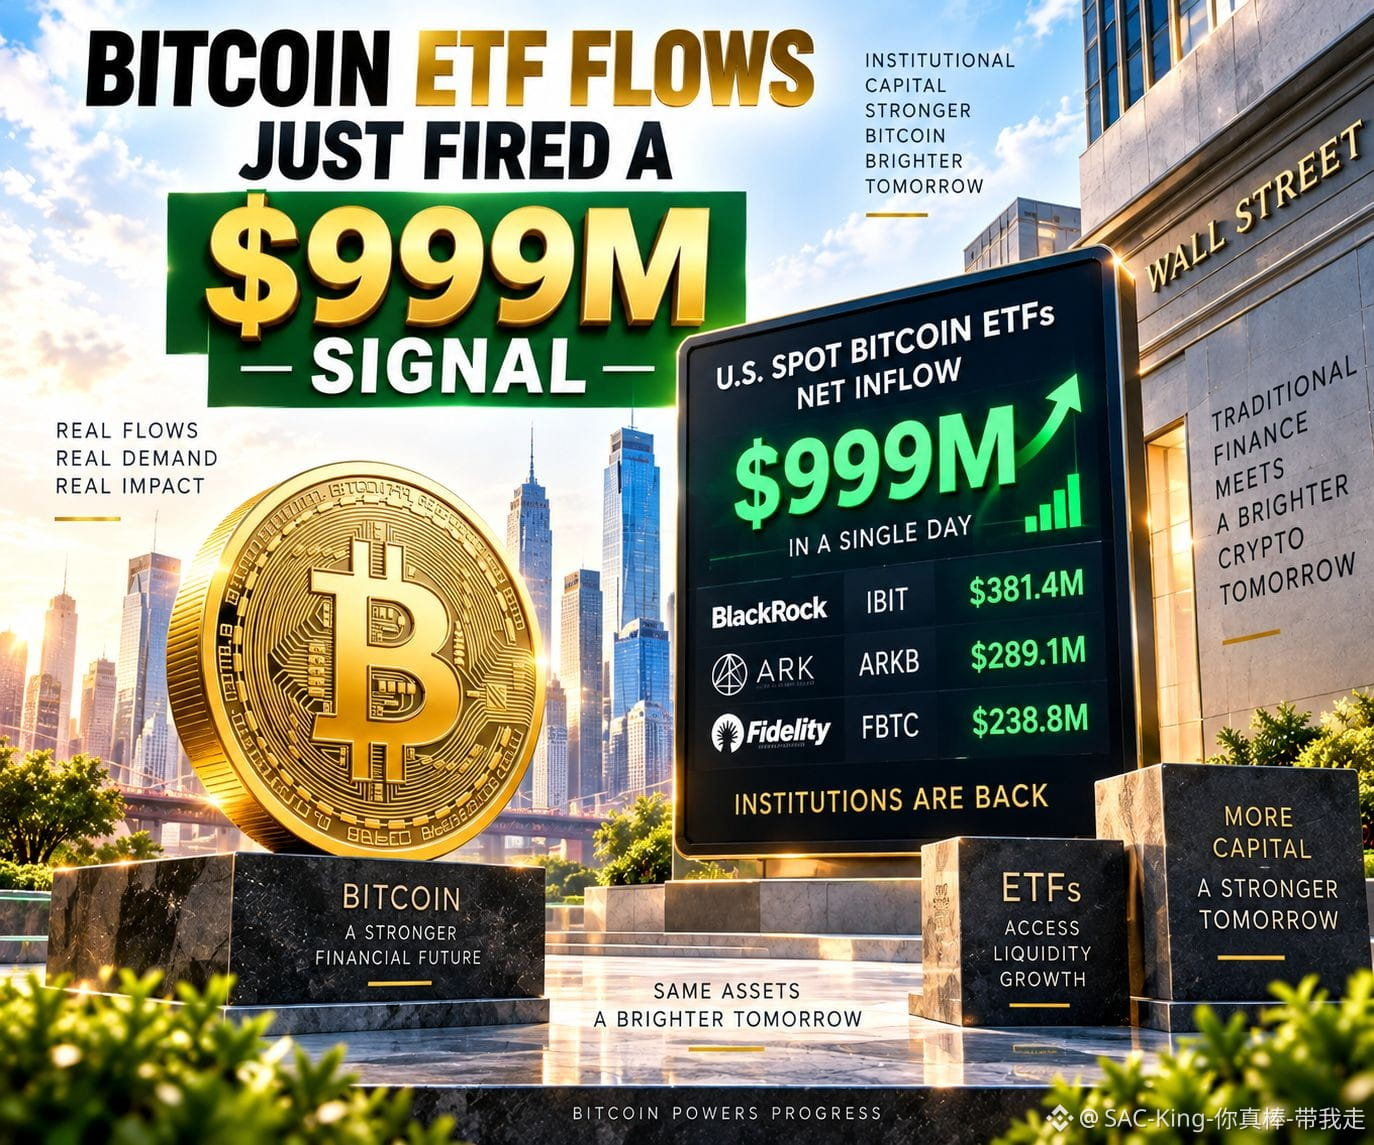
U.S. spot Bitcoin ETFs recorded roughly $999 million in net inflows in a single day, their largest daily inflow in 12 months. BlackRock’s IBIT led with $381.4M, followed by ARKB at $289.1M and Fidelity’s FBTC at $238.8M.
My Take: The important part is not simply the size of the number. It is the speed at which institutional-style exposure returned through regulated investment vehicles.
Bitcoin also surged above $86,000 on September 21, with ETF inflows and broader market participation accompanying the move.
That creates an interesting feedback loop: stronger ETF demand can improve market liquidity and sentiment, while rising prices can attract additional attention. But flows can reverse just as quickly.
One huge inflow does not automatically establish a lasting trend. The next sessions matter because sustained inflows would provide stronger evidence that this was more than a one-day burst of demand.
The real signal is simple: capital is returning to Bitcoin through Wall Street’s regulated gateway.
❓Will ETF demand remain strong enough to support this momentum?
Disclaimer: Informational content only, not financial advice. Crypto markets remain highly volatile.
#Bitcoin #BitcoinETF #GrowWithSAC $AKE $AGT
#BitcoinSpotETFs$999MNetInflow
🔥 $BTC BITCOIN ETF FLOWS JUST FIRED A $999M SIGNAL 🚀
Money can whisper for weeks,
then suddenly arrive like a wave nobody can ignore.
U.S. spot Bitcoin ETFs recorded roughly $999 million in net inflows in a single day, their largest daily inflow in 12 months. BlackRock’s IBIT led with $381.4M, followed by ARKB at $289.1M and Fidelity’s FBTC at $238.8M.
My Take: The important part is not simply the size of the number. It is the speed at which institutional-style exposure returned through regulated investment vehicles.
Bitcoin also surged above $86,000 on September 21, with ETF inflows and broader market participation accompanying the move.
That creates an interesting feedback loop: stronger ETF demand can improve market liquidity and sentiment, while rising prices can attract additional attention. But flows can reverse just as quickly.
One huge inflow does not automatically establish a lasting trend. The next sessions matter because sustained inflows would provide stronger evidence that this was more than a one-day burst of demand.
The real signal is simple: capital is returning to Bitcoin through Wall Street’s regulated gateway.
❓Will ETF demand remain strong enough to support this momentum?
Disclaimer: Informational content only, not financial advice. Crypto markets remain highly volatile.
#Bitcoin #BitcoinETF #GrowWithSAC $AKE $AGT
🔥 $BTC BITCOIN ETF FLOWS JUST FIRED A $999M SIGNAL 🚀
Money can whisper for weeks,
then suddenly arrive like a wave nobody can ignore.
U.S. spot Bitcoin ETFs recorded roughly $999 million in net inflows in a single day, their largest daily inflow in 12 months. BlackRock’s IBIT led with $381.4M, followed by ARKB at $289.1M and Fidelity’s FBTC at $238.8M.
My Take: The important part is not simply the size of the number. It is the speed at which institutional-style exposure returned through regulated investment vehicles.
Bitcoin also surged above $86,000 on September 21, with ETF inflows and broader market participation accompanying the move.
That creates an interesting feedback loop: stronger ETF demand can improve market liquidity and sentiment, while rising prices can attract additional attention. But flows can reverse just as quickly.
One huge inflow does not automatically establish a lasting trend. The next sessions matter because sustained inflows would provide stronger evidence that this was more than a one-day burst of demand.
The real signal is simple: capital is returning to Bitcoin through Wall Street’s regulated gateway.
❓Will ETF demand remain strong enough to support this momentum?
Disclaimer: Informational content only, not financial advice. Crypto markets remain highly volatile.
#Bitcoin #BitcoinETF #GrowWithSAC $AKE $AGT
126

·
--
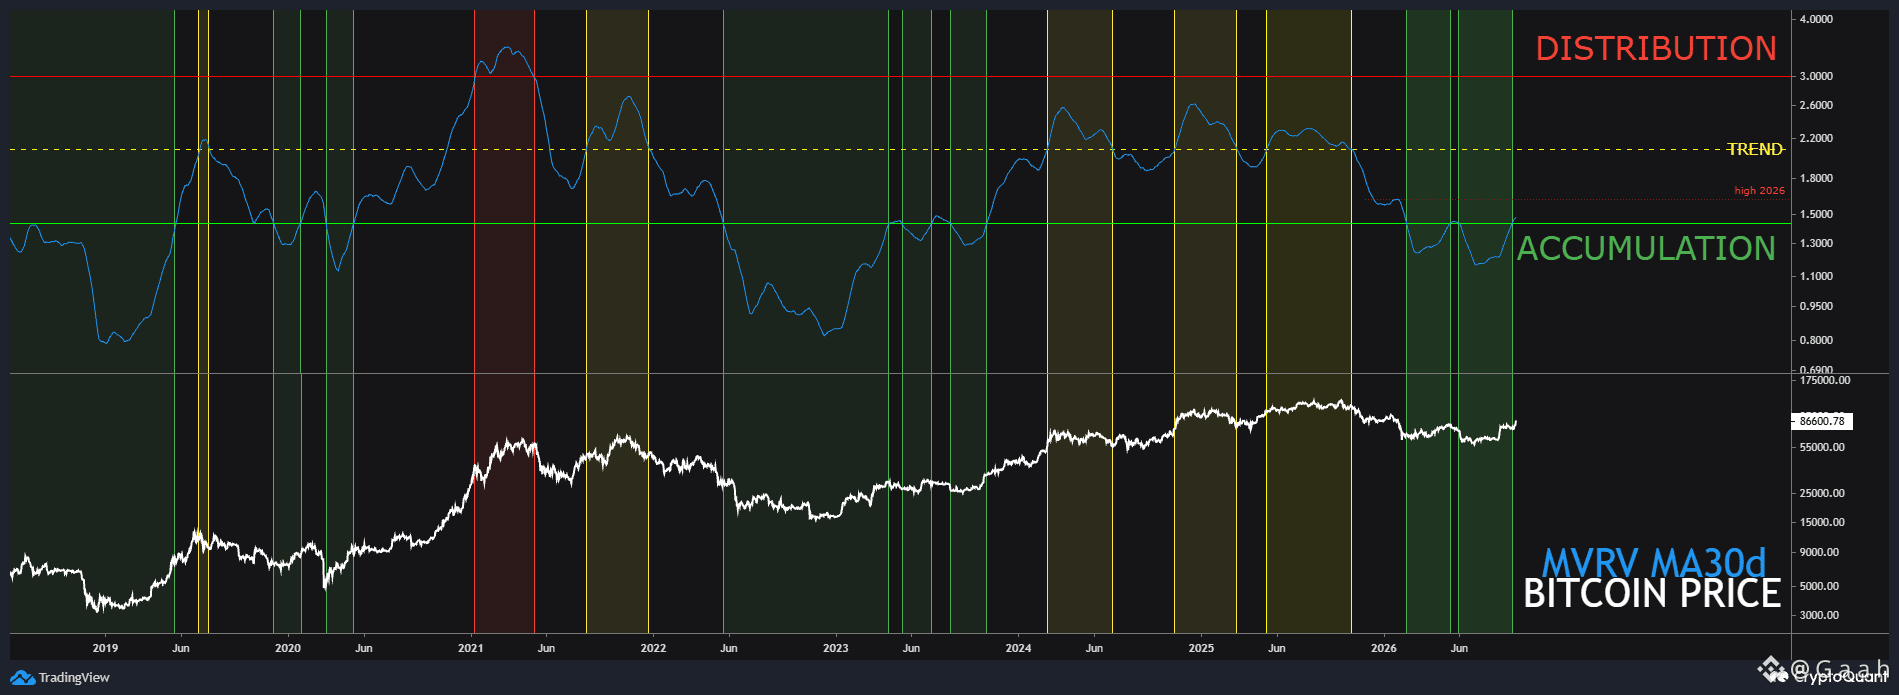
MVRV MA30d breaks out of the Accumulation Zone for second time in 2026 👀
The indicator is once again above the Accumulation Zone🟢 renewing its May high and aiming for the year’s.
For about 6 months in 2026, the MVRV traded within this range, a pattern that, throughout #bitcoin history has signaled periods of intense accumulation followed by excellent returns📈
If the indicator breaks through the year’s high (~1.62), this will confirm the reversal of ongoing bear market and the main price target will be all-time high $126k🎯
Once again, this indicator has signaled an excellent historical window for entering the market, making it easy to gauge #BTC valuation.
#Onchain #BitcoinSpotETFs$999MNetInflow #technicalanalyst $BTC
{spot}(BTCUSDT)
MVRV MA30d breaks out of the Accumulation Zone for second time in 2026 👀
The indicator is once again above the Accumulation Zone🟢 renewing its May high and aiming for the year’s.
For about 6 months in 2026, the MVRV traded within this range, a pattern that, throughout #bitcoin history has signaled periods of intense accumulation followed by excellent returns📈
If the indicator breaks through the year’s high (~1.62), this will confirm the reversal of ongoing bear market and the main price target will be all-time high $126k🎯
Once again, this indicator has signaled an excellent historical window for entering the market, making it easy to gauge #BTC valuation.
#Onchain #BitcoinSpotETFs$999MNetInflow #technicalanalyst $BTC
The indicator is once again above the Accumulation Zone🟢 renewing its May high and aiming for the year’s.
For about 6 months in 2026, the MVRV traded within this range, a pattern that, throughout #bitcoin history has signaled periods of intense accumulation followed by excellent returns📈
If the indicator breaks through the year’s high (~1.62), this will confirm the reversal of ongoing bear market and the main price target will be all-time high $126k🎯
Once again, this indicator has signaled an excellent historical window for entering the market, making it easy to gauge #BTC valuation.
#Onchain #BitcoinSpotETFs$999MNetInflow #technicalanalyst $BTC
1
185

·
--
# Meme Coin Market in September 2026: What's Actually Moving, and How to Size a Position
**Meta desThe Setup: Meme Coins Are Winning Attention and Losing the Race
Here's the number that should frame every meme coin decision you make this month.
Over the 30 days into late August 2026, the top-10 meme coin basket gained 10.24%. A comparable altcoin basket gained 40.28%. That's a 30-percentage-point lag — and it comes with a second data point that's even more telling: over the prior 60 days, meme coins captured only about 70 cents of every dollar the broader altcoin market gained (CoinGecko data, via BeInCrypto, August 27, 2026).
Translation: this is not a meme season. It's a selection market. The rising tide that made 2021 and 2024 meme cycles so forgiving is not lifting all boats — which means the difference between a good and bad meme position in September 2026 is entirely about which coin, how much, and when you exit.
This post breaks down where the market actually stands, what's driving it, what can go wrong, and a tiered framework for sizing positions without gambling your portfolio.
---
## State of the Meme Coin Market: The Numbers
### The macro backdrop
| Metric | Reading (Sept 2026) | Source |
|---|---|---|
| Total crypto market cap | ~$2.79–2.80T | CoinMarketCap / Tokenist, Sept 2026 |
| Bitcoin dominance | 58.2–58.5% | CoinMarketCap, Sept 2026 |
| Ethereum dominance | 11.5–11.6% | CoinMarketCap, Sept 2026 |
| Crypto Fear & Greed Index | ~70–72 (Greed) | CoinMarketCap / Tokenist, Sept 16–22, 2026 |
| Altcoin Season Index | ~30–35% (Bitcoin season) | Bitcoin Foundation, Sept 2026 |
Read that last row carefully. An Altcoin Season Index in the 30s means capital is not rotating broadly into altcoins. Bitcoin dominance near 58% confirms it. Sentiment is greedy, but the money is concentrated — and meme coins are downstream of that concentration.
### Top meme coins by market cap
| Coin | Ticker | Market Cap | Price | Chain | Volatility |
|---|---|---|---|---|---|
| Dogecoin | DOGE | $13.71B | ~$0.089–0.092 | Own (PoW) | Low (for the sector) |
| Shiba Inu | SHIB | $3.56B | ~$0.0000060 | Ethereum / Shibarium | Medium |
| Pepe | PEPE | $1.47B | ~$0.0000034 | Ethereum | High |
| Bonk | BONK | $523.40M | ~$0.0000058 | Solana | High |
| FLOKI | FLOKI | $268.80M | ~$0.000027 | Multi-chain | Medium-High |
| Dogwifhat | WIF | $188.24M | ~$0.18 | Solana | Very High |
| Fartcoin | FARTCOIN | $132.79M | ~$0.13 | Solana | Very High |
Market data per Tokenist, updated September 16, 2026. Prices move constantly — verify against a live feed before acting.
### Recent price action worth noting
- Pudgy Penguins (PENGU) — up 47.45% in 7 days and 60.02% in 30 days, beating the altcoin basket by nearly 20 points without an altcoin season setup. Nansen data showed fresh wallets adding $427K and top-PnL wallets $611K over seven days — but also $7.50M flowing into exchange wallets, a potential sell-pressure signal (BeInCrypto, Aug 27, 2026).
- Shiba Inu (SHIB) — up 13.58% in 7 days but still down 22.26% year-to-date. Underneath, tracked DEX buys exceeded sells by $30.39M over seven days, a +69.82% demand skew (Dune data). The catch: top-PnL wallets cut $824K, so the accumulation case is unconfirmed.
- Official Trump (TRUMP) — up 29.44% in 7 days on volume running 6.5x its monthly norm, with fresh wallets adding $5.85M. But $18.33M moved into exchanges and Binance top-trader conviction fell through the rally. Fresh demand meeting sophisticated selling is the classic fade setup.
### New launches
Pump.fun remains the epicenter of new meme issuance on Solana — zero-code launches for ~0.02 SOL, with Q1 2026 DEX volume exceeding $2 billion. The velocity is staggering: Nietzschean Penguin peaked above $170M market cap within a week of its mid-January 2026 launch. For every one of those, thousands of tokens go to zero.
---
## What's Driving the Trend
1. Institutional legitimacy is real — for the top two only.
On March 17, 2026, a joint SEC–CFTC ruling classified 16 crypto assets as digital commodities, including Dogecoin. That cleared the legal path for spot ETFs, and dedicated Dogecoin ETFs (such as 21Shares' TDOG on Nasdaq) launched in January 2026. Canary Capital filed an S-1 for a spot PEPE ETF in April 2026. This is a genuine structural change — but note that it applies to a handful of names, not the category.
2. The ETF trade is already consolidating.
Bitwise announced it is closing its Dogecoin ETF (BWOW) in September 2026. On June 30, 2026, the SEC opened a proceeding with 27 questions about how ETFs holding unusual assets should reach market. Institutional wrappers are being tested, and not all of them survive.
3. Regulatory clarity is improving, but it's a moving target.
The SEC proposed "Regulation Crypto Assets" on August 18, 2026, following its March 2026 interpretation on when a non-security crypto asset separates from an investment contract. Clearer rules help legitimate projects — and they also raise the compliance bar for exchanges listing speculative tokens.
4. Solana's launchpad flywheel keeps spinning.
Pump.fun's fair-launch model (no presales, no team allocations) removed the friction that used to gate new token creation. The result is an enormous supply of new tokens competing for a fixed pool of attention — which structurally favors established names with real liquidity.
5. Attention is the only fundamental.
Meme coins have no cash flows. Their price is a function of narrative velocity, social reach, and liquidity depth. That's not a flaw to be fixed — it's the asset class. It just means your edge comes from risk management, not from "researching" a coin harder.
---
## The Risk Section: Read This Before You Buy Anything
Volatility. Even DOGE — the most stable name in the category — carries volatility that traditional finance would classify as extreme. WIF and FARTCOIN can move 30–50% in a single session. A single post from a high-follower account can spike or collapse a price before most retail buyers can react.
Liquidity. Quoted prices are not guaranteed execution prices. Coins below $200M market cap can show adequate order-book depth on a calm day and see it evaporate in a sell-off. Thin DEX pools amplify slippage precisely when you most need to exit.
Rug pulls and exit scams. This is not theoretical. Chainalysis's 2026 Crypto Crime Report put on-chain scam receipts at $14 billion for 2025, with a revised projection of $17 billion. The FBI's 2025 Internet Crime Report logged 181,565 crypto-related complaints totaling over $11 billion. Recent examples: $LIBRA drained roughly $100 million from its liquidity pool; $LAPTOP (September 10, 2026) spiked above $300 before surrendering more than 99% of its peak, leaving 4 out of 5 buyers with losses while one wallet netted roughly $930,000. Even $TRUMP, marketed as rug-pull-proof, left most investors down.
Regulatory scrutiny. Rules on listings, custody, and marketing can shift quickly across jurisdictions. A change in treatment can limit access to a token or move sentiment even when the project itself hasn't changed.
Concentration. When a few wallets hold a disproportionate share of supply, one sell decision craters the price. Always check on-chain concentration before sizing.
The honest summary: meme coins are among the most speculative assets in any market. They can lose the majority of their value in hours. They are not investments in the traditional sense, and they are only appropriate as a small, defined slice of a diversified portfolio.
---
## Recommendations: A Tiered Framework
The goal here is not to pick a winner. It's to structure exposure so that being wrong is survivable and being right is meaningful.
Set your total meme sleeve first. Decide the maximum percentage of your portfolio you're willing to see go to zero — for most people that's 2–5% total, across all meme positions combined. Then allocate within that sleeve using the tiers below.
### Tier 1 — Blue-chip meme exposure (largest share of the sleeve)
DOGE, SHIB. These are the only two names with SEC digital-commodity classification, spot ETF products, and Tier-1 exchange liquidity deep enough for institutional-size entries.
- Why: Regulatory clarity, lowest relative volatility in the category, universal availability, deep order books.
- Position sizing: Up to 50–60% of your meme sleeve.
- What to watch: ETF flows and consolidation (Bitwise's BWOW closure is a signal that not every wrapper survives), plus payment-platform integration news.
- Honest caveat: DOGE has no smart-contract utility and infinite supply. SHIB is highly correlated to Ethereum sentiment. Neither is "safe" — they're just the least fragile.
### Tier 2 — Established mid-caps (moderate share)
$PEPE $BONK , FLOKI. Real liquidity, real exchange access, real narratives — but no commodity safety net (except where noted) and materially higher beta.
- Why: PEPE has the highest raw trading momentum in the sector and a pending spot ETF filing. BONK has hundreds of Solana integrations and a fee-driven burn mechanism (roughly 51% of letsBONK.fun platform fees go to buying BONK). FLOKI has live utility via the Valhalla game and FlokiFi, plus MiCAR-compliant documentation and a European ETP.
- **Position sizing:** 25–35% of your meme sleeve, split across at least two names.
- What to watch: For BONK, verify the current status of the DAT/DAO treasury and governance safeguards after a reported 2026 governance incident. For PEPE, whale exits can cause immediate sharp corrections. For FLOKI, Valhalla adoption is still unproven at scale.
### Tier 3 — High-beta satellite plays (smallest share, highest risk)
WIF, FARTCOIN, PENGU, TRUMP. These are momentum instruments, not holdings.
- Why anyone touches them: Asymmetric upside during Solana ecosystem rotations or narrative spikes.
- **Position sizing:** 10–15% of your meme sleeve maximum, and treat each as a trade with a pre-defined exit — not a position you hold through a drawdown.
- What to watch: Exchange inflow data. PENGU's rally is only confirmed if its $7.50M exchange inflow reverses. TRUMP's setup only holds while fresh buyers outrun the exits. FARTCOIN is down over 90% from its January 2025 all-time high of ~$2.52 — a reminder of what "high-beta" actually means.
### What to avoid entirely
- Presales with pseudonymous teams and no independent audit. If you can't verify who built it, you can't assess the risk.
- Anything under ~$50M market cap with no Tier-1 exchange listing. No exit liquidity is a trap, not an opportunity.
- Celebrity and influencer coins. $LAPTOP and $TRUMP are the case studies. Attention spikes are a volatility signal, not a value signal.
- Tokens with retained mint or upgrade authority. If supply rules can change after you buy, you don't own what you think you own.
- Any position sized on a "1000x" thesis. No meme coin can be reliably predicted to deliver that. Treat such claims as speculation, not forecast.
- Buying without a pre-defined exit. Define both a profit target and a stop level before entering. Emotional decisions at the top of a move are how retail buyers crystallize losses.
### Execution checklist
1. Choose a reputable exchange (Coinbase, Kraken, Binance) for the established names.
2. Verify the contract address against the project's official site before buying on a DEX — fake tokens with identical names are common.
3. Check order-book depth and set slippage conservatively before large orders.
4. Size deliberately, before you buy — not after the price moves.
5. Set your exit plan (target and stop) at entry.
6. Move longer holds to a non-custodial wallet where you control the keys.
7. Consider dollar-cost averaging to spread entry timing across conditions.
---
## Bottom Line
September 2026 is a selection market, not a sector bet. Meme coins are lagging the broader altcoin market by 30 percentage points over 30 days, Bitcoin dominance is near 58%, and the Altcoin Season Index sits in the 30s. Meanwhile, institutional legitimacy is real but narrow — DOGE and SHIB have commodity classification and ETF products; almost nothing else does.
The disciplined approach: keep total meme exposure to 2–5% of your portfolio, weight it toward the two names with regulatory clarity, use mid-caps for measured upside, and treat high-beta names as short-horizon trades with hard exits. Screen every position for liquidity, holder concentration, and contract permissions before you commit a dollar.
The upside in this asset class is real. So is the downside. The framework above is how you stay in the game long enough to capture the former.
---
## Risk Disclaimer
This article is for informational purposes only and does not constitute financial, investment, or trading advice. It is not a recommendation to buy, sell, or hold any asset. Cryptoassets are highly volatile and speculative, and capital is at risk — you can lose your entire position. Meme coins in particular can lose the majority of their value in hours and are largely unregulated. Market data cited here was accurate as of the dates noted and changes continuously; verify all figures against a live source before making any decision. Nothing here accounts for your personal financial situation, objectives, or risk tolerance. Consult a licensed financial advisor before making any investment decision. Do your own research.
---
## Sources
- BeInCrypto / Yahoo Finance — "3 Meme Coins to Watch in September 2026: Who Is Buying and Who Is Quietly Selling," Ananda Banerjee, August 27, 2026
- Tokenist — "9 Best Meme Coins to Buy Now in September 2026," Tim Baker, updated September 16, 2026
- CoinMarketCap — Top Memes Tokens by Market Capitalization, September 2026
- Bitcoin Foundation — "Current Altcoin Season Index September 2026"
- Yellow.com — "New Crypto ETF Filings 2026" (SEC–CFTC joint ruling, March 17, 2026)
- Federal Register — "Regulation Crypto Assets," August 21, 2026
- CryptoTicker — "Canary Capital Files for PEPE ETF," April 9, 2026; "Dogecoin ETF Discontinued: Why Bitwise Is Closing BWOW," September 11, 2026
- Chainalysis — 2026 Crypto Crime Report (January 2026)
- FBI Internet Crime Complaint Center — 2025 Internet Crime Report (April 2026)
- Elliptic — memecoin rug-pull analysis ($LIBRA)
- New York Post — "$LAPTOP" collapse analysis, September 10, 2026
- Wikipedia / Bloomberg / BeInCrypto — Pump.fun launchpad volume and activity data, Q1 2026
#BitcoinSpotETFs$999MNetInflow #AMDHits$1TrillionMarketCap #TokenizedStockPlatformsCouldLaunchNextQuarter #AIStocksWhatNext #Bloomberg
# Meme Coin Market in September 2026: What's Actually Moving, and How to Size a Position **Meta des
The Setup: Meme Coins Are Winning Attention and Losing the Race
Here's the number that should frame every meme coin decision you make this month.
Over the 30 days into late August 2026, the top-10 meme coin basket gained 10.24%. A comparable altcoin basket gained 40.28%. That's a 30-percentage-point lag — and it comes with a second data point that's even more telling: over the prior 60 days, meme coins captured only about 70 cents of every dollar the broader altcoin market gained (CoinGecko data, via BeInCrypto, August 27, 2026).
Translation: this is not a meme season. It's a selection market. The rising tide that made 2021 and 2024 meme cycles so forgiving is not lifting all boats — which means the difference between a good and bad meme position in September 2026 is entirely about which coin, how much, and when you exit.
This post breaks down where the market actually stands, what's driving it, what can go wrong, and a tiered framework for sizing positions without gambling your portfolio.
---
## State of the Meme Coin Market: The Numbers
### The macro backdrop
| Metric | Reading (Sept 2026) | Source |
|---|---|---|
| Total crypto market cap | ~$2.79–2.80T | CoinMarketCap / Tokenist, Sept 2026 |
| Bitcoin dominance | 58.2–58.5% | CoinMarketCap, Sept 2026 |
| Ethereum dominance | 11.5–11.6% | CoinMarketCap, Sept 2026 |
| Crypto Fear & Greed Index | ~70–72 (Greed) | CoinMarketCap / Tokenist, Sept 16–22, 2026 |
| Altcoin Season Index | ~30–35% (Bitcoin season) | Bitcoin Foundation, Sept 2026 |
Read that last row carefully. An Altcoin Season Index in the 30s means capital is not rotating broadly into altcoins. Bitcoin dominance near 58% confirms it. Sentiment is greedy, but the money is concentrated — and meme coins are downstream of that concentration.
### Top meme coins by market cap
| Coin | Ticker | Market Cap | Price | Chain | Volatility |
|---|---|---|---|---|---|
| Dogecoin | DOGE | $13.71B | ~$0.089–0.092 | Own (PoW) | Low (for the sector) |
| Shiba Inu | SHIB | $3.56B | ~$0.0000060 | Ethereum / Shibarium | Medium |
| Pepe | PEPE | $1.47B | ~$0.0000034 | Ethereum | High |
| Bonk | BONK | $523.40M | ~$0.0000058 | Solana | High |
| FLOKI | FLOKI | $268.80M | ~$0.000027 | Multi-chain | Medium-High |
| Dogwifhat | WIF | $188.24M | ~$0.18 | Solana | Very High |
| Fartcoin | FARTCOIN | $132.79M | ~$0.13 | Solana | Very High |
Market data per Tokenist, updated September 16, 2026. Prices move constantly — verify against a live feed before acting.
### Recent price action worth noting
- Pudgy Penguins (PENGU) — up 47.45% in 7 days and 60.02% in 30 days, beating the altcoin basket by nearly 20 points without an altcoin season setup. Nansen data showed fresh wallets adding $427K and top-PnL wallets $611K over seven days — but also $7.50M flowing into exchange wallets, a potential sell-pressure signal (BeInCrypto, Aug 27, 2026).
- Shiba Inu (SHIB) — up 13.58% in 7 days but still down 22.26% year-to-date. Underneath, tracked DEX buys exceeded sells by $30.39M over seven days, a +69.82% demand skew (Dune data). The catch: top-PnL wallets cut $824K, so the accumulation case is unconfirmed.
- Official Trump (TRUMP) — up 29.44% in 7 days on volume running 6.5x its monthly norm, with fresh wallets adding $5.85M. But $18.33M moved into exchanges and Binance top-trader conviction fell through the rally. Fresh demand meeting sophisticated selling is the classic fade setup.
### New launches
Pump.fun remains the epicenter of new meme issuance on Solana — zero-code launches for ~0.02 SOL, with Q1 2026 DEX volume exceeding $2 billion. The velocity is staggering: Nietzschean Penguin peaked above $170M market cap within a week of its mid-January 2026 launch. For every one of those, thousands of tokens go to zero.
---
## What's Driving the Trend
1. Institutional legitimacy is real — for the top two only.
On March 17, 2026, a joint SEC–CFTC ruling classified 16 crypto assets as digital commodities, including Dogecoin. That cleared the legal path for spot ETFs, and dedicated Dogecoin ETFs (such as 21Shares' TDOG on Nasdaq) launched in January 2026. Canary Capital filed an S-1 for a spot PEPE ETF in April 2026. This is a genuine structural change — but note that it applies to a handful of names, not the category.
2. The ETF trade is already consolidating.
Bitwise announced it is closing its Dogecoin ETF (BWOW) in September 2026. On June 30, 2026, the SEC opened a proceeding with 27 questions about how ETFs holding unusual assets should reach market. Institutional wrappers are being tested, and not all of them survive.
3. Regulatory clarity is improving, but it's a moving target.
The SEC proposed "Regulation Crypto Assets" on August 18, 2026, following its March 2026 interpretation on when a non-security crypto asset separates from an investment contract. Clearer rules help legitimate projects — and they also raise the compliance bar for exchanges listing speculative tokens.
4. Solana's launchpad flywheel keeps spinning.
Pump.fun's fair-launch model (no presales, no team allocations) removed the friction that used to gate new token creation. The result is an enormous supply of new tokens competing for a fixed pool of attention — which structurally favors established names with real liquidity.
5. Attention is the only fundamental.
Meme coins have no cash flows. Their price is a function of narrative velocity, social reach, and liquidity depth. That's not a flaw to be fixed — it's the asset class. It just means your edge comes from risk management, not from "researching" a coin harder.
---
## The Risk Section: Read This Before You Buy Anything
Volatility. Even DOGE — the most stable name in the category — carries volatility that traditional finance would classify as extreme. WIF and FARTCOIN can move 30–50% in a single session. A single post from a high-follower account can spike or collapse a price before most retail buyers can react.
Liquidity. Quoted prices are not guaranteed execution prices. Coins below $200M market cap can show adequate order-book depth on a calm day and see it evaporate in a sell-off. Thin DEX pools amplify slippage precisely when you most need to exit.
Rug pulls and exit scams. This is not theoretical. Chainalysis's 2026 Crypto Crime Report put on-chain scam receipts at $14 billion for 2025, with a revised projection of $17 billion. The FBI's 2025 Internet Crime Report logged 181,565 crypto-related complaints totaling over $11 billion. Recent examples: $LIBRA drained roughly $100 million from its liquidity pool; $LAPTOP (September 10, 2026) spiked above $300 before surrendering more than 99% of its peak, leaving 4 out of 5 buyers with losses while one wallet netted roughly $930,000. Even $TRUMP , marketed as rug-pull-proof, left most investors down.
Regulatory scrutiny. Rules on listings, custody, and marketing can shift quickly across jurisdictions. A change in treatment can limit access to a token or move sentiment even when the project itself hasn't changed.
Concentration. When a few wallets hold a disproportionate share of supply, one sell decision craters the price. Always check on-chain concentration before sizing.
The honest summary: meme coins are among the most speculative assets in any market. They can lose the majority of their value in hours. They are not investments in the traditional sense, and they are only appropriate as a small, defined slice of a diversified portfolio.
---
## Recommendations: A Tiered Framework
The goal here is not to pick a winner. It's to structure exposure so that being wrong is survivable and being right is meaningful.
Set your total meme sleeve first. Decide the maximum percentage of your portfolio you're willing to see go to zero — for most people that's 2–5% total, across all meme positions combined. Then allocate within that sleeve using the tiers below.
### Tier 1 — Blue-chip meme exposure (largest share of the sleeve)
DOGE, SHIB. These are the only two names with SEC digital-commodity classification, spot ETF products, and Tier-1 exchange liquidity deep enough for institutional-size entries.
- Why: Regulatory clarity, lowest relative volatility in the category, universal availability, deep order books.
- Position sizing: Up to 50–60% of your meme sleeve.
- What to watch: ETF flows and consolidation (Bitwise's BWOW closure is a signal that not every wrapper survives), plus payment-platform integration news.
- Honest caveat: DOGE has no smart-contract utility and infinite supply. SHIB is highly correlated to Ethereum sentiment. Neither is "safe" — they're just the least fragile.
### Tier 2 — Established mid-caps (moderate share)
$PEPE $BONK , FLOKI. Real liquidity, real exchange access, real narratives — but no commodity safety net (except where noted) and materially higher beta.
- Why: PEPE has the highest raw trading momentum in the sector and a pending spot ETF filing. BONK has hundreds of Solana integrations and a fee-driven burn mechanism (roughly 51% of letsBONK.fun platform fees go to buying BONK). FLOKI has live utility via the Valhalla game and FlokiFi, plus MiCAR-compliant documentation and a European ETP.
- **Position sizing:** 25–35% of your meme sleeve, split across at least two names.
- What to watch: For BONK, verify the current status of the DAT/DAO treasury and governance safeguards after a reported 2026 governance incident. For PEPE, whale exits can cause immediate sharp corrections. For FLOKI, Valhalla adoption is still unproven at scale.
### Tier 3 — High-beta satellite plays (smallest share, highest risk)
WIF, FARTCOIN, PENGU, TRUMP. These are momentum instruments, not holdings.
- Why anyone touches them: Asymmetric upside during Solana ecosystem rotations or narrative spikes.
- **Position sizing:** 10–15% of your meme sleeve maximum, and treat each as a trade with a pre-defined exit — not a position you hold through a drawdown.
- What to watch: Exchange inflow data. PENGU's rally is only confirmed if its $7.50M exchange inflow reverses. TRUMP's setup only holds while fresh buyers outrun the exits. FARTCOIN is down over 90% from its January 2025 all-time high of ~$2.52 — a reminder of what "high-beta" actually means.
### What to avoid entirely
- Presales with pseudonymous teams and no independent audit. If you can't verify who built it, you can't assess the risk.
- Anything under ~$50M market cap with no Tier-1 exchange listing. No exit liquidity is a trap, not an opportunity.
- Celebrity and influencer coins. $LAPTOP and $TRUMP are the case studies. Attention spikes are a volatility signal, not a value signal.
- Tokens with retained mint or upgrade authority. If supply rules can change after you buy, you don't own what you think you own.
- Any position sized on a "1000x" thesis. No meme coin can be reliably predicted to deliver that. Treat such claims as speculation, not forecast.
- Buying without a pre-defined exit. Define both a profit target and a stop level before entering. Emotional decisions at the top of a move are how retail buyers crystallize losses.
### Execution checklist
1. Choose a reputable exchange (Coinbase, Kraken, Binance) for the established names.
2. Verify the contract address against the project's official site before buying on a DEX — fake tokens with identical names are common.
3. Check order-book depth and set slippage conservatively before large orders.
4. Size deliberately, before you buy — not after the price moves.
5. Set your exit plan (target and stop) at entry.
6. Move longer holds to a non-custodial wallet where you control the keys.
7. Consider dollar-cost averaging to spread entry timing across conditions.
---
## Bottom Line
September 2026 is a selection market, not a sector bet. Meme coins are lagging the broader altcoin market by 30 percentage points over 30 days, Bitcoin dominance is near 58%, and the Altcoin Season Index sits in the 30s. Meanwhile, institutional legitimacy is real but narrow — DOGE and SHIB have commodity classification and ETF products; almost nothing else does.
The disciplined approach: keep total meme exposure to 2–5% of your portfolio, weight it toward the two names with regulatory clarity, use mid-caps for measured upside, and treat high-beta names as short-horizon trades with hard exits. Screen every position for liquidity, holder concentration, and contract permissions before you commit a dollar.
The upside in this asset class is real. So is the downside. The framework above is how you stay in the game long enough to capture the former.
---
## Risk Disclaimer
This article is for informational purposes only and does not constitute financial, investment, or trading advice. It is not a recommendation to buy, sell, or hold any asset. Cryptoassets are highly volatile and speculative, and capital is at risk — you can lose your entire position. Meme coins in particular can lose the majority of their value in hours and are largely unregulated. Market data cited here was accurate as of the dates noted and changes continuously; verify all figures against a live source before making any decision. Nothing here accounts for your personal financial situation, objectives, or risk tolerance. Consult a licensed financial advisor before making any investment decision. Do your own research.
---
## Sources
- BeInCrypto / Yahoo Finance — "3 Meme Coins to Watch in September 2026: Who Is Buying and Who Is Quietly Selling," Ananda Banerjee, August 27, 2026
- Tokenist — "9 Best Meme Coins to Buy Now in September 2026," Tim Baker, updated September 16, 2026
- CoinMarketCap — Top Memes Tokens by Market Capitalization, September 2026
- Bitcoin Foundation — "Current Altcoin Season Index September 2026"
- Yellow.com — "New Crypto ETF Filings 2026" (SEC–CFTC joint ruling, March 17, 2026)
- Federal Register — "Regulation Crypto Assets," August 21, 2026
- CryptoTicker — "Canary Capital Files for PEPE ETF," April 9, 2026; "Dogecoin ETF Discontinued: Why Bitwise Is Closing BWOW," September 11, 2026
- Chainalysis — 2026 Crypto Crime Report (January 2026)
- FBI Internet Crime Complaint Center — 2025 Internet Crime Report (April 2026)
- Elliptic — memecoin rug-pull analysis ($LIBRA)
- New York Post — "$LAPTOP" collapse analysis, September 10, 2026
- Wikipedia / Bloomberg / BeInCrypto — Pump.fun launchpad volume and activity data, Q1 2026
#BitcoinSpotETFs$999MNetInflow #AMDHits$1TrillionMarketCap #TokenizedStockPlatformsCouldLaunchNextQuarter #AIStocksWhatNext #Bloomberg
Here's the number that should frame every meme coin decision you make this month.
Over the 30 days into late August 2026, the top-10 meme coin basket gained 10.24%. A comparable altcoin basket gained 40.28%. That's a 30-percentage-point lag — and it comes with a second data point that's even more telling: over the prior 60 days, meme coins captured only about 70 cents of every dollar the broader altcoin market gained (CoinGecko data, via BeInCrypto, August 27, 2026).
Translation: this is not a meme season. It's a selection market. The rising tide that made 2021 and 2024 meme cycles so forgiving is not lifting all boats — which means the difference between a good and bad meme position in September 2026 is entirely about which coin, how much, and when you exit.
This post breaks down where the market actually stands, what's driving it, what can go wrong, and a tiered framework for sizing positions without gambling your portfolio.
---
## State of the Meme Coin Market: The Numbers
### The macro backdrop
| Metric | Reading (Sept 2026) | Source |
|---|---|---|
| Total crypto market cap | ~$2.79–2.80T | CoinMarketCap / Tokenist, Sept 2026 |
| Bitcoin dominance | 58.2–58.5% | CoinMarketCap, Sept 2026 |
| Ethereum dominance | 11.5–11.6% | CoinMarketCap, Sept 2026 |
| Crypto Fear & Greed Index | ~70–72 (Greed) | CoinMarketCap / Tokenist, Sept 16–22, 2026 |
| Altcoin Season Index | ~30–35% (Bitcoin season) | Bitcoin Foundation, Sept 2026 |
Read that last row carefully. An Altcoin Season Index in the 30s means capital is not rotating broadly into altcoins. Bitcoin dominance near 58% confirms it. Sentiment is greedy, but the money is concentrated — and meme coins are downstream of that concentration.
### Top meme coins by market cap
| Coin | Ticker | Market Cap | Price | Chain | Volatility |
|---|---|---|---|---|---|
| Dogecoin | DOGE | $13.71B | ~$0.089–0.092 | Own (PoW) | Low (for the sector) |
| Shiba Inu | SHIB | $3.56B | ~$0.0000060 | Ethereum / Shibarium | Medium |
| Pepe | PEPE | $1.47B | ~$0.0000034 | Ethereum | High |
| Bonk | BONK | $523.40M | ~$0.0000058 | Solana | High |
| FLOKI | FLOKI | $268.80M | ~$0.000027 | Multi-chain | Medium-High |
| Dogwifhat | WIF | $188.24M | ~$0.18 | Solana | Very High |
| Fartcoin | FARTCOIN | $132.79M | ~$0.13 | Solana | Very High |
Market data per Tokenist, updated September 16, 2026. Prices move constantly — verify against a live feed before acting.
### Recent price action worth noting
- Pudgy Penguins (PENGU) — up 47.45% in 7 days and 60.02% in 30 days, beating the altcoin basket by nearly 20 points without an altcoin season setup. Nansen data showed fresh wallets adding $427K and top-PnL wallets $611K over seven days — but also $7.50M flowing into exchange wallets, a potential sell-pressure signal (BeInCrypto, Aug 27, 2026).
- Shiba Inu (SHIB) — up 13.58% in 7 days but still down 22.26% year-to-date. Underneath, tracked DEX buys exceeded sells by $30.39M over seven days, a +69.82% demand skew (Dune data). The catch: top-PnL wallets cut $824K, so the accumulation case is unconfirmed.
- Official Trump (TRUMP) — up 29.44% in 7 days on volume running 6.5x its monthly norm, with fresh wallets adding $5.85M. But $18.33M moved into exchanges and Binance top-trader conviction fell through the rally. Fresh demand meeting sophisticated selling is the classic fade setup.
### New launches
Pump.fun remains the epicenter of new meme issuance on Solana — zero-code launches for ~0.02 SOL, with Q1 2026 DEX volume exceeding $2 billion. The velocity is staggering: Nietzschean Penguin peaked above $170M market cap within a week of its mid-January 2026 launch. For every one of those, thousands of tokens go to zero.
---
## What's Driving the Trend
1. Institutional legitimacy is real — for the top two only.
On March 17, 2026, a joint SEC–CFTC ruling classified 16 crypto assets as digital commodities, including Dogecoin. That cleared the legal path for spot ETFs, and dedicated Dogecoin ETFs (such as 21Shares' TDOG on Nasdaq) launched in January 2026. Canary Capital filed an S-1 for a spot PEPE ETF in April 2026. This is a genuine structural change — but note that it applies to a handful of names, not the category.
2. The ETF trade is already consolidating.
Bitwise announced it is closing its Dogecoin ETF (BWOW) in September 2026. On June 30, 2026, the SEC opened a proceeding with 27 questions about how ETFs holding unusual assets should reach market. Institutional wrappers are being tested, and not all of them survive.
3. Regulatory clarity is improving, but it's a moving target.
The SEC proposed "Regulation Crypto Assets" on August 18, 2026, following its March 2026 interpretation on when a non-security crypto asset separates from an investment contract. Clearer rules help legitimate projects — and they also raise the compliance bar for exchanges listing speculative tokens.
4. Solana's launchpad flywheel keeps spinning.
Pump.fun's fair-launch model (no presales, no team allocations) removed the friction that used to gate new token creation. The result is an enormous supply of new tokens competing for a fixed pool of attention — which structurally favors established names with real liquidity.
5. Attention is the only fundamental.
Meme coins have no cash flows. Their price is a function of narrative velocity, social reach, and liquidity depth. That's not a flaw to be fixed — it's the asset class. It just means your edge comes from risk management, not from "researching" a coin harder.
---
## The Risk Section: Read This Before You Buy Anything
Volatility. Even DOGE — the most stable name in the category — carries volatility that traditional finance would classify as extreme. WIF and FARTCOIN can move 30–50% in a single session. A single post from a high-follower account can spike or collapse a price before most retail buyers can react.
Liquidity. Quoted prices are not guaranteed execution prices. Coins below $200M market cap can show adequate order-book depth on a calm day and see it evaporate in a sell-off. Thin DEX pools amplify slippage precisely when you most need to exit.
Rug pulls and exit scams. This is not theoretical. Chainalysis's 2026 Crypto Crime Report put on-chain scam receipts at $14 billion for 2025, with a revised projection of $17 billion. The FBI's 2025 Internet Crime Report logged 181,565 crypto-related complaints totaling over $11 billion. Recent examples: $LIBRA drained roughly $100 million from its liquidity pool; $LAPTOP (September 10, 2026) spiked above $300 before surrendering more than 99% of its peak, leaving 4 out of 5 buyers with losses while one wallet netted roughly $930,000. Even $TRUMP , marketed as rug-pull-proof, left most investors down.
Regulatory scrutiny. Rules on listings, custody, and marketing can shift quickly across jurisdictions. A change in treatment can limit access to a token or move sentiment even when the project itself hasn't changed.
Concentration. When a few wallets hold a disproportionate share of supply, one sell decision craters the price. Always check on-chain concentration before sizing.
The honest summary: meme coins are among the most speculative assets in any market. They can lose the majority of their value in hours. They are not investments in the traditional sense, and they are only appropriate as a small, defined slice of a diversified portfolio.
---
## Recommendations: A Tiered Framework
The goal here is not to pick a winner. It's to structure exposure so that being wrong is survivable and being right is meaningful.
Set your total meme sleeve first. Decide the maximum percentage of your portfolio you're willing to see go to zero — for most people that's 2–5% total, across all meme positions combined. Then allocate within that sleeve using the tiers below.
### Tier 1 — Blue-chip meme exposure (largest share of the sleeve)
DOGE, SHIB. These are the only two names with SEC digital-commodity classification, spot ETF products, and Tier-1 exchange liquidity deep enough for institutional-size entries.
- Why: Regulatory clarity, lowest relative volatility in the category, universal availability, deep order books.
- Position sizing: Up to 50–60% of your meme sleeve.
- What to watch: ETF flows and consolidation (Bitwise's BWOW closure is a signal that not every wrapper survives), plus payment-platform integration news.
- Honest caveat: DOGE has no smart-contract utility and infinite supply. SHIB is highly correlated to Ethereum sentiment. Neither is "safe" — they're just the least fragile.
### Tier 2 — Established mid-caps (moderate share)
$PEPE $BONK , FLOKI. Real liquidity, real exchange access, real narratives — but no commodity safety net (except where noted) and materially higher beta.
- Why: PEPE has the highest raw trading momentum in the sector and a pending spot ETF filing. BONK has hundreds of Solana integrations and a fee-driven burn mechanism (roughly 51% of letsBONK.fun platform fees go to buying BONK). FLOKI has live utility via the Valhalla game and FlokiFi, plus MiCAR-compliant documentation and a European ETP.
- **Position sizing:** 25–35% of your meme sleeve, split across at least two names.
- What to watch: For BONK, verify the current status of the DAT/DAO treasury and governance safeguards after a reported 2026 governance incident. For PEPE, whale exits can cause immediate sharp corrections. For FLOKI, Valhalla adoption is still unproven at scale.
### Tier 3 — High-beta satellite plays (smallest share, highest risk)
WIF, FARTCOIN, PENGU, TRUMP. These are momentum instruments, not holdings.
- Why anyone touches them: Asymmetric upside during Solana ecosystem rotations or narrative spikes.
- **Position sizing:** 10–15% of your meme sleeve maximum, and treat each as a trade with a pre-defined exit — not a position you hold through a drawdown.
- What to watch: Exchange inflow data. PENGU's rally is only confirmed if its $7.50M exchange inflow reverses. TRUMP's setup only holds while fresh buyers outrun the exits. FARTCOIN is down over 90% from its January 2025 all-time high of ~$2.52 — a reminder of what "high-beta" actually means.
### What to avoid entirely
- Presales with pseudonymous teams and no independent audit. If you can't verify who built it, you can't assess the risk.
- Anything under ~$50M market cap with no Tier-1 exchange listing. No exit liquidity is a trap, not an opportunity.
- Celebrity and influencer coins. $LAPTOP and $TRUMP are the case studies. Attention spikes are a volatility signal, not a value signal.
- Tokens with retained mint or upgrade authority. If supply rules can change after you buy, you don't own what you think you own.
- Any position sized on a "1000x" thesis. No meme coin can be reliably predicted to deliver that. Treat such claims as speculation, not forecast.
- Buying without a pre-defined exit. Define both a profit target and a stop level before entering. Emotional decisions at the top of a move are how retail buyers crystallize losses.
### Execution checklist
1. Choose a reputable exchange (Coinbase, Kraken, Binance) for the established names.
2. Verify the contract address against the project's official site before buying on a DEX — fake tokens with identical names are common.
3. Check order-book depth and set slippage conservatively before large orders.
4. Size deliberately, before you buy — not after the price moves.
5. Set your exit plan (target and stop) at entry.
6. Move longer holds to a non-custodial wallet where you control the keys.
7. Consider dollar-cost averaging to spread entry timing across conditions.
---
## Bottom Line
September 2026 is a selection market, not a sector bet. Meme coins are lagging the broader altcoin market by 30 percentage points over 30 days, Bitcoin dominance is near 58%, and the Altcoin Season Index sits in the 30s. Meanwhile, institutional legitimacy is real but narrow — DOGE and SHIB have commodity classification and ETF products; almost nothing else does.
The disciplined approach: keep total meme exposure to 2–5% of your portfolio, weight it toward the two names with regulatory clarity, use mid-caps for measured upside, and treat high-beta names as short-horizon trades with hard exits. Screen every position for liquidity, holder concentration, and contract permissions before you commit a dollar.
The upside in this asset class is real. So is the downside. The framework above is how you stay in the game long enough to capture the former.
---
## Risk Disclaimer
This article is for informational purposes only and does not constitute financial, investment, or trading advice. It is not a recommendation to buy, sell, or hold any asset. Cryptoassets are highly volatile and speculative, and capital is at risk — you can lose your entire position. Meme coins in particular can lose the majority of their value in hours and are largely unregulated. Market data cited here was accurate as of the dates noted and changes continuously; verify all figures against a live source before making any decision. Nothing here accounts for your personal financial situation, objectives, or risk tolerance. Consult a licensed financial advisor before making any investment decision. Do your own research.
---
## Sources
- BeInCrypto / Yahoo Finance — "3 Meme Coins to Watch in September 2026: Who Is Buying and Who Is Quietly Selling," Ananda Banerjee, August 27, 2026
- Tokenist — "9 Best Meme Coins to Buy Now in September 2026," Tim Baker, updated September 16, 2026
- CoinMarketCap — Top Memes Tokens by Market Capitalization, September 2026
- Bitcoin Foundation — "Current Altcoin Season Index September 2026"
- Yellow.com — "New Crypto ETF Filings 2026" (SEC–CFTC joint ruling, March 17, 2026)
- Federal Register — "Regulation Crypto Assets," August 21, 2026
- CryptoTicker — "Canary Capital Files for PEPE ETF," April 9, 2026; "Dogecoin ETF Discontinued: Why Bitwise Is Closing BWOW," September 11, 2026
- Chainalysis — 2026 Crypto Crime Report (January 2026)
- FBI Internet Crime Complaint Center — 2025 Internet Crime Report (April 2026)
- Elliptic — memecoin rug-pull analysis ($LIBRA)
- New York Post — "$LAPTOP" collapse analysis, September 10, 2026
- Wikipedia / Bloomberg / BeInCrypto — Pump.fun launchpad volume and activity data, Q1 2026
#BitcoinSpotETFs$999MNetInflow #AMDHits$1TrillionMarketCap #TokenizedStockPlatformsCouldLaunchNextQuarter #AIStocksWhatNext #Bloomberg
376

·
--
ບົດຄວາມ
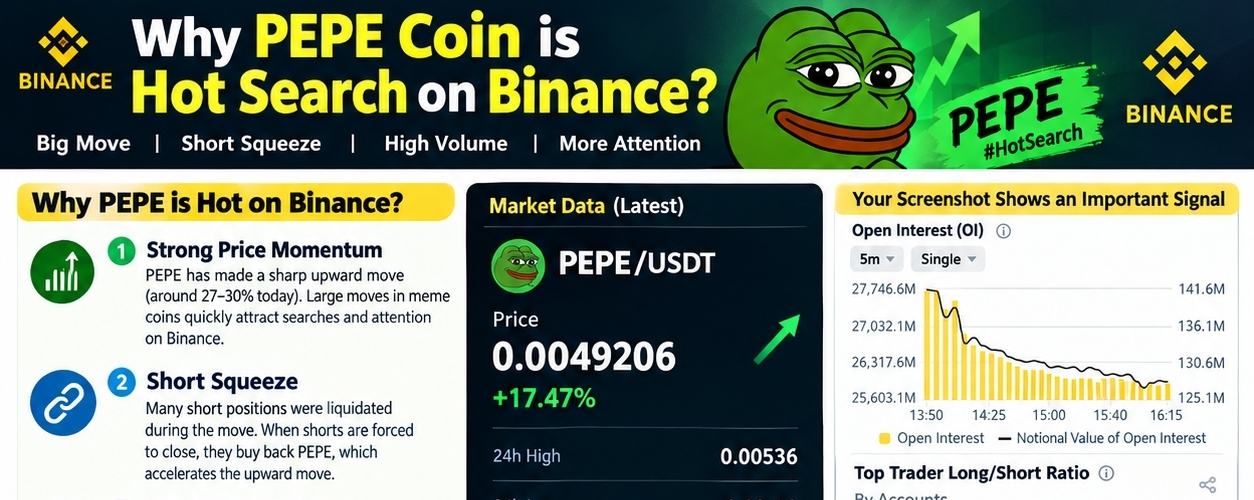
Why PEPE Is Hot Search on Binance🔥 Why PEPE Is Hot Search on Binance
Based on your screenshot and the latest market data:
1. Strong price momentum
PEPE has made a sharp upward move, attracting traders and Binance search activity. Large percentage moves in meme coins often create a sudden increase in searches.
2. Short squeeze
A significant amount of PEPE short positions were liquidated during the move. When shorts are forced to close, they buy PEPE back, which can accelerate the upward move.
3. Very high trading volume
PEPE futures and spot trading volume have increased significantly. High volume + a large price move usually brings more attention from traders.
4. Your screenshot shows an important signal
From your screenshot:
Price: 0.0049206
Change: +17.47%
Open Interest: falling
Top-trader accounts: roughly 68–70% Long vs 30–32% Short
The interesting part is:
Price ↑ while Open Interest ↓
This can indicate that the rally is being driven partly by short covering/liquidations, rather than only by new leveraged longs.
🔮 What to watch next
I would monitor these three things:
1. Resistance / breakout zone
If PEPE continues above the recent high with strong volume, momentum could continue.
2. Open Interest
Price ↑ + OI ↑ = new positions entering
Price ↑ + OI ↓ = possible short covering
Price ↓ + OI ↑ = increasing bearish positioning
3. Volume A breakout with strong volume is generally more meaningful than a low-volume pump.
⚠️ Important
Because PEPE has already moved sharply, chasing the candle can carry high liquidation risk. A pullback/retest is worth watching rather than assuming that the next move must be upward.
If you send me the current PEPE 5-minute or 15-minute chart, I can analyze the latest structure and give you the key support/resistance zones + bullish/bearish scen....
#AIStocksWhatNext #TokenizedStockPlatformsCouldLaunchNextQuarter #CardanoAddedToX402KitForADAPayments #BitcoinSpotETFs$999MNetInflow #Write2Earn $PEPE
{spot}(PEPEUSDT)
$XLM
{spot}(XLMUSDT)
$NVDA.US
{stock_us}(NVDA.US)
Why PEPE Is Hot Search on Binance
🔥 Why PEPE Is Hot Search on Binance
Based on your screenshot and the latest market data:
1. Strong price momentum
PEPE has made a sharp upward move, attracting traders and Binance search activity. Large percentage moves in meme coins often create a sudden increase in searches.
2. Short squeeze
A significant amount of PEPE short positions were liquidated during the move. When shorts are forced to close, they buy PEPE back, which can accelerate the upward move.
3. Very high trading volume
PEPE futures and spot trading volume have increased significantly. High volume + a large price move usually brings more attention from traders.
4. Your screenshot shows an important signal
From your screenshot:
Price: 0.0049206
Change: +17.47%
Open Interest: falling
Top-trader accounts: roughly 68–70% Long vs 30–32% Short
The interesting part is:
Price ↑ while Open Interest ↓
This can indicate that the rally is being driven partly by short covering/liquidations, rather than only by new leveraged longs.
🔮 What to watch next
I would monitor these three things:
1. Resistance / breakout zone
If PEPE continues above the recent high with strong volume, momentum could continue.
2. Open Interest
Price ↑ + OI ↑ = new positions entering
Price ↑ + OI ↓ = possible short covering
Price ↓ + OI ↑ = increasing bearish positioning
3. Volume A breakout with strong volume is generally more meaningful than a low-volume pump.
⚠️ Important
Because PEPE has already moved sharply, chasing the candle can carry high liquidation risk. A pullback/retest is worth watching rather than assuming that the next move must be upward.
If you send me the current PEPE 5-minute or 15-minute chart, I can analyze the latest structure and give you the key support/resistance zones + bullish/bearish scen....
#AIStocksWhatNext #TokenizedStockPlatformsCouldLaunchNextQuarter #CardanoAddedToX402KitForADAPayments #BitcoinSpotETFs$999MNetInflow #Write2Earn $PEPE
$XLM
$NVDA.US
Based on your screenshot and the latest market data:
1. Strong price momentum
PEPE has made a sharp upward move, attracting traders and Binance search activity. Large percentage moves in meme coins often create a sudden increase in searches.
2. Short squeeze
A significant amount of PEPE short positions were liquidated during the move. When shorts are forced to close, they buy PEPE back, which can accelerate the upward move.
3. Very high trading volume
PEPE futures and spot trading volume have increased significantly. High volume + a large price move usually brings more attention from traders.
4. Your screenshot shows an important signal
From your screenshot:
Price: 0.0049206
Change: +17.47%
Open Interest: falling
Top-trader accounts: roughly 68–70% Long vs 30–32% Short
The interesting part is:
Price ↑ while Open Interest ↓
This can indicate that the rally is being driven partly by short covering/liquidations, rather than only by new leveraged longs.
🔮 What to watch next
I would monitor these three things:
1. Resistance / breakout zone
If PEPE continues above the recent high with strong volume, momentum could continue.
2. Open Interest
Price ↑ + OI ↑ = new positions entering
Price ↑ + OI ↓ = possible short covering
Price ↓ + OI ↑ = increasing bearish positioning
3. Volume A breakout with strong volume is generally more meaningful than a low-volume pump.
⚠️ Important
Because PEPE has already moved sharply, chasing the candle can carry high liquidation risk. A pullback/retest is worth watching rather than assuming that the next move must be upward.
If you send me the current PEPE 5-minute or 15-minute chart, I can analyze the latest structure and give you the key support/resistance zones + bullish/bearish scen....
#AIStocksWhatNext #TokenizedStockPlatformsCouldLaunchNextQuarter #CardanoAddedToX402KitForADAPayments #BitcoinSpotETFs$999MNetInflow #Write2Earn $PEPE
$XLM
$NVDA.US
1
125

·
--
ຢືນຢັນແລ້ວ
🧩 NEAR Is Up Nearly 80%. The Price Isn't the Most Interesting Part.
#NEARRisesNearly80%InAWeek
NEAR has surged roughly 78% in a week, dramatically outperforming the broader crypto market.
But underneath the move is a more interesting number:
NEAR Intents now reports more than $29B in cumulative volume across 35 chains.
That's a different story from simply “NEAR is an AI coin.”
Intents is building a chain-abstracted execution layer: users or applications express what they want done, while the system handles cross-chain liquidity and execution.
And AI agents are explicitly part of the architecture.
The network now combines:
cross-chain execution
unified liquidity AI-agent infrastructure confidential execution.
There is also evidence that this isn't purely a narrative trade: NEAR's dashboard currently shows protocol revenue, Intents activity and nearly $98M in confidential TVL.
But that doesn't prove the price surge is justified by fundamentals.
It creates a more useful question:
Is the market repricing NEAR as another L1 — or as infrastructure sitting between users, AI agents and dozens of blockchains?
The price got attention.
The infrastructure is the part worth watching.
$NEAR $ZEC $ETH
DYOR: The rise in NEAR's price does not by itself establish that Intents activity caused the move; the post separates observed network activity from market interpretation.
#AIStocksWhatNext #zcash #BitcoinSpotETFs$999MNetInflow #Write2Earn
🧩 NEAR Is Up Nearly 80%. The Price Isn't the Most Interesting Part.
#NEARRisesNearly80%InAWeek
NEAR has surged roughly 78% in a week, dramatically outperforming the broader crypto market.
But underneath the move is a more interesting number:
NEAR Intents now reports more than $29B in cumulative volume across 35 chains.
That's a different story from simply “NEAR is an AI coin.”
Intents is building a chain-abstracted execution layer: users or applications express what they want done, while the system handles cross-chain liquidity and execution.
And AI agents are explicitly part of the architecture.
The network now combines:
cross-chain execution
unified liquidity AI-agent infrastructure confidential execution.
There is also evidence that this isn't purely a narrative trade: NEAR's dashboard currently shows protocol revenue, Intents activity and nearly $98M in confidential TVL.
But that doesn't prove the price surge is justified by fundamentals.
It creates a more useful question:
Is the market repricing NEAR as another L1 — or as infrastructure sitting between users, AI agents and dozens of blockchains?
The price got attention.
The infrastructure is the part worth watching.
$NEAR $ZEC $ETH
DYOR: The rise in NEAR's price does not by itself establish that Intents activity caused the move; the post separates observed network activity from market interpretation.
#AIStocksWhatNext #zcash #BitcoinSpotETFs$999MNetInflow #Write2Earn
#NEARRisesNearly80%InAWeek
NEAR has surged roughly 78% in a week, dramatically outperforming the broader crypto market.
But underneath the move is a more interesting number:
NEAR Intents now reports more than $29B in cumulative volume across 35 chains.
That's a different story from simply “NEAR is an AI coin.”
Intents is building a chain-abstracted execution layer: users or applications express what they want done, while the system handles cross-chain liquidity and execution.
And AI agents are explicitly part of the architecture.
The network now combines:
cross-chain execution
unified liquidity AI-agent infrastructure confidential execution.
There is also evidence that this isn't purely a narrative trade: NEAR's dashboard currently shows protocol revenue, Intents activity and nearly $98M in confidential TVL.
But that doesn't prove the price surge is justified by fundamentals.
It creates a more useful question:
Is the market repricing NEAR as another L1 — or as infrastructure sitting between users, AI agents and dozens of blockchains?
The price got attention.
The infrastructure is the part worth watching.
$NEAR $ZEC $ETH
DYOR: The rise in NEAR's price does not by itself establish that Intents activity caused the move; the post separates observed network activity from market interpretation.
#AIStocksWhatNext #zcash #BitcoinSpotETFs$999MNetInflow #Write2Earn
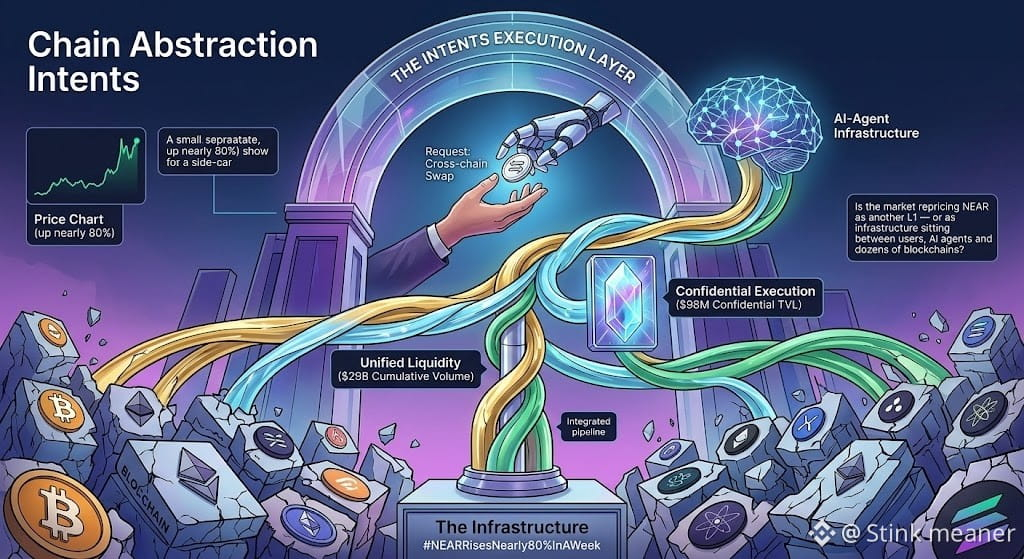
1
331

·
--
🚀 #AIStocksWhatNext :
NEXT BIG CRYPTO OPPORTUNITY? 🤖📈
With Nvidia projecting surging chip demand and Trump proposing an "AI Force" to target 25% GDP impact, the AI boom is unstoppable! 🏛️💻 But as tech stocks hit historic highs, smart capital is moving into decentralized AI protocols. ⚡🌐
Key Highlights : 🔑💡
Long-Term Structural Shift: Compute spend isn't a short-term bounce—it's global infrastructure buildout. 📈💥
State-Level Tailwinds: Official backing keeps the momentum strong while TradFi stock valuations stretch. 🛡️💻
Crypto-AI Convergence: High-throughput chains and GPU networks are capturing institutional capital overflow. 🌊📦
Featured Tokens :
NEAR Protocol ($NEAR ) 🧱: Leading User-Owned AI scaling & decentralized agent infrastructure. 🤖⚡
Render ($RENDER ) 🎨: Decentralized GPU computing solving the global chip scarcity. 🎨⚡
💬 What’s your move? Sticking with AI stocks or shifting gains into crypto AI protocols? Share below! 👇💭✨
#AIStocksWhatNext
#StrategyAdds950Bitcoin
#XRPRises8%
#BitcoinSpotETFs$999MNetInflow
{spot}(RENDERUSDT)
{spot}(NEARUSDT)
🚀 #AIStocksWhatNext :
NEXT BIG CRYPTO OPPORTUNITY? 🤖📈
With Nvidia projecting surging chip demand and Trump proposing an "AI Force" to target 25% GDP impact, the AI boom is unstoppable! 🏛️💻 But as tech stocks hit historic highs, smart capital is moving into decentralized AI protocols. ⚡🌐
Key Highlights : 🔑💡
Long-Term Structural Shift: Compute spend isn't a short-term bounce—it's global infrastructure buildout. 📈💥
State-Level Tailwinds: Official backing keeps the momentum strong while TradFi stock valuations stretch. 🛡️💻
Crypto-AI Convergence: High-throughput chains and GPU networks are capturing institutional capital overflow. 🌊📦
Featured Tokens :
NEAR Protocol ($NEAR ) 🧱: Leading User-Owned AI scaling & decentralized agent infrastructure. 🤖⚡
Render ($RENDER ) 🎨: Decentralized GPU computing solving the global chip scarcity. 🎨⚡
💬 What’s your move? Sticking with AI stocks or shifting gains into crypto AI protocols? Share below! 👇💭✨
#AIStocksWhatNext
#StrategyAdds950Bitcoin
#XRPRises8%
#BitcoinSpotETFs$999MNetInflow
NEXT BIG CRYPTO OPPORTUNITY? 🤖📈
With Nvidia projecting surging chip demand and Trump proposing an "AI Force" to target 25% GDP impact, the AI boom is unstoppable! 🏛️💻 But as tech stocks hit historic highs, smart capital is moving into decentralized AI protocols. ⚡🌐
Key Highlights : 🔑💡
Long-Term Structural Shift: Compute spend isn't a short-term bounce—it's global infrastructure buildout. 📈💥
State-Level Tailwinds: Official backing keeps the momentum strong while TradFi stock valuations stretch. 🛡️💻
Crypto-AI Convergence: High-throughput chains and GPU networks are capturing institutional capital overflow. 🌊📦
Featured Tokens :
NEAR Protocol ($NEAR ) 🧱: Leading User-Owned AI scaling & decentralized agent infrastructure. 🤖⚡
Render ($RENDER ) 🎨: Decentralized GPU computing solving the global chip scarcity. 🎨⚡
💬 What’s your move? Sticking with AI stocks or shifting gains into crypto AI protocols? Share below! 👇💭✨
#AIStocksWhatNext
#StrategyAdds950Bitcoin
#XRPRises8%
#BitcoinSpotETFs$999MNetInflow
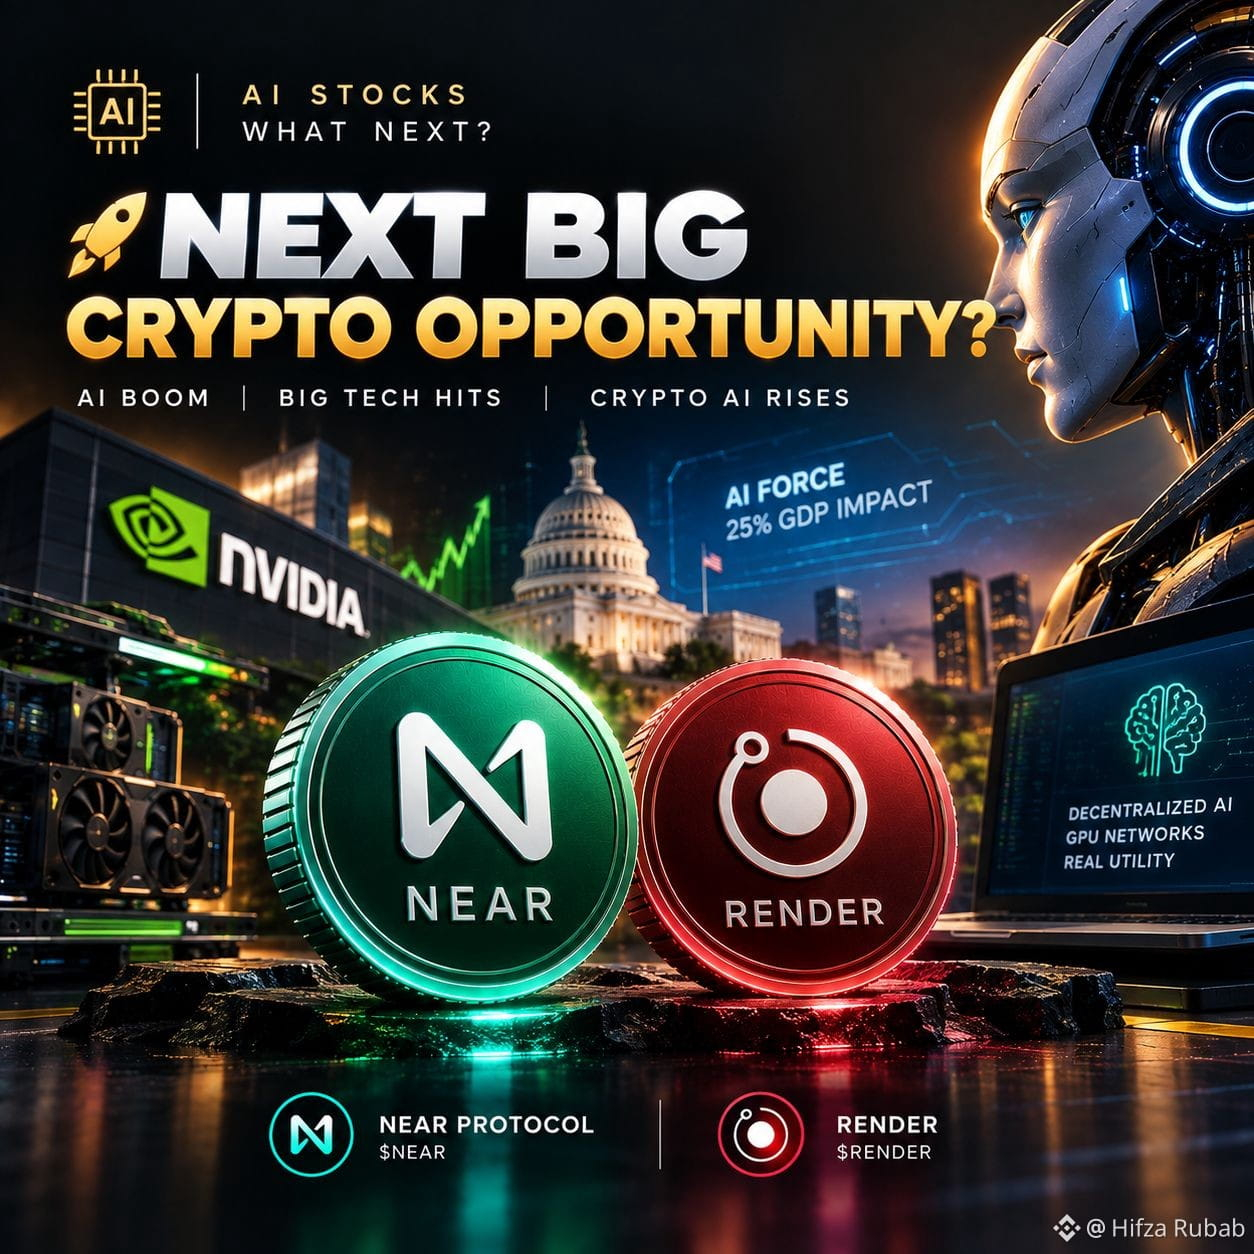
2
192

·
--
ສັນຍານກະທິງ
Buy LPT bulish #LPT/USDT #BitcoinSpotETFs$999MNetInflow
Buy LPT bulish #LPT/USDT #BitcoinSpotETFs$999MNetInflow
302

·
--
ສັນຍານກະທິງ
$TRUMP
$XAU
ثروة زوكربيرغ تقفز نحو 27 مليار دولار بجلسة واحدة.. كيف يتحقق المكسب
الهائل؟
قفز سهم ميتا بلاتفورمز (META) بنسبة تجاوزت 11% في جلسة الاثنين، ليغلق عند نحو 741 دولاراً، في واحدة من أقوى جلساته منذ أسابيع. الأهم من نسبة الصعود هو الرقم المطلق خلفها: أضافت الشركة نحو 207.5 مليار دولار إلى قيمتها السوقية في يوم تداول واحد فقط، لترتفع من نحو 1.695 تريليون دولار إلى ما يقارب 1.902 تريليون دولار — أي أن ميتا "خلقت" في ست ساعات تداول قيمة تعادل أكثر من خمسة أضعاف القيمة السوقية الكاملة لشركة بحجم سابك (التي تدور قيمتها حول 38-40 مليار دولار)، أو ما يقارب القيمة السوقية لشركة كبرى مدرجة بالكامل — في جلسة واحدة فقط.
#AIStocksWhatNext #StrategyAdds950Bitcoin #XRPRises8% #AMDHits$1TrillionMarketCap #BitcoinSpotETFs$999MNetInflow
$TRUMP
$XAU
ثروة زوكربيرغ تقفز نحو 27 مليار دولار بجلسة واحدة.. كيف يتحقق المكسب
الهائل؟
قفز سهم ميتا بلاتفورمز (META) بنسبة تجاوزت 11% في جلسة الاثنين، ليغلق عند نحو 741 دولاراً، في واحدة من أقوى جلساته منذ أسابيع. الأهم من نسبة الصعود هو الرقم المطلق خلفها: أضافت الشركة نحو 207.5 مليار دولار إلى قيمتها السوقية في يوم تداول واحد فقط، لترتفع من نحو 1.695 تريليون دولار إلى ما يقارب 1.902 تريليون دولار — أي أن ميتا "خلقت" في ست ساعات تداول قيمة تعادل أكثر من خمسة أضعاف القيمة السوقية الكاملة لشركة بحجم سابك (التي تدور قيمتها حول 38-40 مليار دولار)، أو ما يقارب القيمة السوقية لشركة كبرى مدرجة بالكامل — في جلسة واحدة فقط.
#AIStocksWhatNext #StrategyAdds950Bitcoin #XRPRises8% #AMDHits$1TrillionMarketCap #BitcoinSpotETFs$999MNetInflow
$XAU
ثروة زوكربيرغ تقفز نحو 27 مليار دولار بجلسة واحدة.. كيف يتحقق المكسب
الهائل؟
قفز سهم ميتا بلاتفورمز (META) بنسبة تجاوزت 11% في جلسة الاثنين، ليغلق عند نحو 741 دولاراً، في واحدة من أقوى جلساته منذ أسابيع. الأهم من نسبة الصعود هو الرقم المطلق خلفها: أضافت الشركة نحو 207.5 مليار دولار إلى قيمتها السوقية في يوم تداول واحد فقط، لترتفع من نحو 1.695 تريليون دولار إلى ما يقارب 1.902 تريليون دولار — أي أن ميتا "خلقت" في ست ساعات تداول قيمة تعادل أكثر من خمسة أضعاف القيمة السوقية الكاملة لشركة بحجم سابك (التي تدور قيمتها حول 38-40 مليار دولار)، أو ما يقارب القيمة السوقية لشركة كبرى مدرجة بالكامل — في جلسة واحدة فقط.
#AIStocksWhatNext #StrategyAdds950Bitcoin #XRPRises8% #AMDHits$1TrillionMarketCap #BitcoinSpotETFs$999MNetInflow

1
99
·
--
ສັນຍານກະທິງ
$TRUMP
$XAU
تاسي اليوم | الأسهم السعودية اليوم:
إعلان من آرامكو وسهم سعودي يصعد
بقوة
يتداول تاسي عند 10,651.47 نقطة، متراجعاً 30.35 نقطة (-0.28%) عن إغلاق أمس عند 10,681.82 نقطة. تحرك المؤشر خلال الجلسة في نطاق بين 10,638.83 (أدنى) و10,695.72 (أعلى)، ضمن مسار هابط مستمر يقترب تدريجياً من أدنى مستوياته لـ52 أسبوعاً عند 10,193.83 نقطة (مقابل أعلى مستوى عند 11,781.68 نقطة) — لا يزال المؤشر يتحرك في منطقة ضغط واضحة دون إشارة تعافٍ حاسمة حتى الآن.
الضغط الخارجي الأبرز يأتي من تراجع في النفط؛ إذ يخسر خام برنت اليوم نحو 1% ليصل إلى 99.09 دولاراً، وخام غرب تكساس نحو 2% إلى 90.60 دولاراً — استمرار لموجة هبوط ممتدة منذ عدة جلسات مدفوعة بتحسن نسبي في إمدادات المنطقة وترقب مسار دبلوماسي محتمل بين واشنطن وطهران. في المقابل، تبدو الأسواق العالمية منقسمة: عقود داو جونز مرتفعة 70 نقطة، بينما يصعد الداكس الألماني (+0.07%) والنيكاي الياباني (+1.38%) بقوة، مدعومين بعودة الشهية لأسهم التقنية والرقائق.
#AIStocksWhatNext #StrategyAdds950Bitcoin #XRPRises8% #AMDHits$1TrillionMarketCap #BitcoinSpotETFs$999MNetInflow
$TRUMP
$XAU
تاسي اليوم | الأسهم السعودية اليوم:
إعلان من آرامكو وسهم سعودي يصعد
بقوة
يتداول تاسي عند 10,651.47 نقطة، متراجعاً 30.35 نقطة (-0.28%) عن إغلاق أمس عند 10,681.82 نقطة. تحرك المؤشر خلال الجلسة في نطاق بين 10,638.83 (أدنى) و10,695.72 (أعلى)، ضمن مسار هابط مستمر يقترب تدريجياً من أدنى مستوياته لـ52 أسبوعاً عند 10,193.83 نقطة (مقابل أعلى مستوى عند 11,781.68 نقطة) — لا يزال المؤشر يتحرك في منطقة ضغط واضحة دون إشارة تعافٍ حاسمة حتى الآن.
الضغط الخارجي الأبرز يأتي من تراجع في النفط؛ إذ يخسر خام برنت اليوم نحو 1% ليصل إلى 99.09 دولاراً، وخام غرب تكساس نحو 2% إلى 90.60 دولاراً — استمرار لموجة هبوط ممتدة منذ عدة جلسات مدفوعة بتحسن نسبي في إمدادات المنطقة وترقب مسار دبلوماسي محتمل بين واشنطن وطهران. في المقابل، تبدو الأسواق العالمية منقسمة: عقود داو جونز مرتفعة 70 نقطة، بينما يصعد الداكس الألماني (+0.07%) والنيكاي الياباني (+1.38%) بقوة، مدعومين بعودة الشهية لأسهم التقنية والرقائق.
#AIStocksWhatNext #StrategyAdds950Bitcoin #XRPRises8% #AMDHits$1TrillionMarketCap #BitcoinSpotETFs$999MNetInflow
$XAU
تاسي اليوم | الأسهم السعودية اليوم:
إعلان من آرامكو وسهم سعودي يصعد
بقوة
يتداول تاسي عند 10,651.47 نقطة، متراجعاً 30.35 نقطة (-0.28%) عن إغلاق أمس عند 10,681.82 نقطة. تحرك المؤشر خلال الجلسة في نطاق بين 10,638.83 (أدنى) و10,695.72 (أعلى)، ضمن مسار هابط مستمر يقترب تدريجياً من أدنى مستوياته لـ52 أسبوعاً عند 10,193.83 نقطة (مقابل أعلى مستوى عند 11,781.68 نقطة) — لا يزال المؤشر يتحرك في منطقة ضغط واضحة دون إشارة تعافٍ حاسمة حتى الآن.
الضغط الخارجي الأبرز يأتي من تراجع في النفط؛ إذ يخسر خام برنت اليوم نحو 1% ليصل إلى 99.09 دولاراً، وخام غرب تكساس نحو 2% إلى 90.60 دولاراً — استمرار لموجة هبوط ممتدة منذ عدة جلسات مدفوعة بتحسن نسبي في إمدادات المنطقة وترقب مسار دبلوماسي محتمل بين واشنطن وطهران. في المقابل، تبدو الأسواق العالمية منقسمة: عقود داو جونز مرتفعة 70 نقطة، بينما يصعد الداكس الألماني (+0.07%) والنيكاي الياباني (+1.38%) بقوة، مدعومين بعودة الشهية لأسهم التقنية والرقائق.
#AIStocksWhatNext #StrategyAdds950Bitcoin #XRPRises8% #AMDHits$1TrillionMarketCap #BitcoinSpotETFs$999MNetInflow
50
·
--
ສັນຍານກະທິງ
🔥 PEPE جاهزة للطيران!
الزخم قوي، والصورة الفنية عم تعطي حركة صاعدة 📈🐸
🚀 الهدف: القمر 🌕
لا تفوّت الحركة إذا استمر الزخم �
#AIStocksWhatNext #StrategyAdds950Bitcoin #CardanoAddedToX402KitForADAPayments #AMDHits$1TrillionMarketCap #BitcoinSpotETFs$999MNetInflow
🔥 PEPE جاهزة للطيران!
الزخم قوي، والصورة الفنية عم تعطي حركة صاعدة 📈🐸
🚀 الهدف: القمر 🌕
لا تفوّت الحركة إذا استمر الزخم �
#AIStocksWhatNext #StrategyAdds950Bitcoin #CardanoAddedToX402KitForADAPayments #AMDHits$1TrillionMarketCap #BitcoinSpotETFs$999MNetInflow
الزخم قوي، والصورة الفنية عم تعطي حركة صاعدة 📈🐸
🚀 الهدف: القمر 🌕
لا تفوّت الحركة إذا استمر الزخم �
#AIStocksWhatNext #StrategyAdds950Bitcoin #CardanoAddedToX402KitForADAPayments #AMDHits$1TrillionMarketCap #BitcoinSpotETFs$999MNetInflow

2
90

·
--
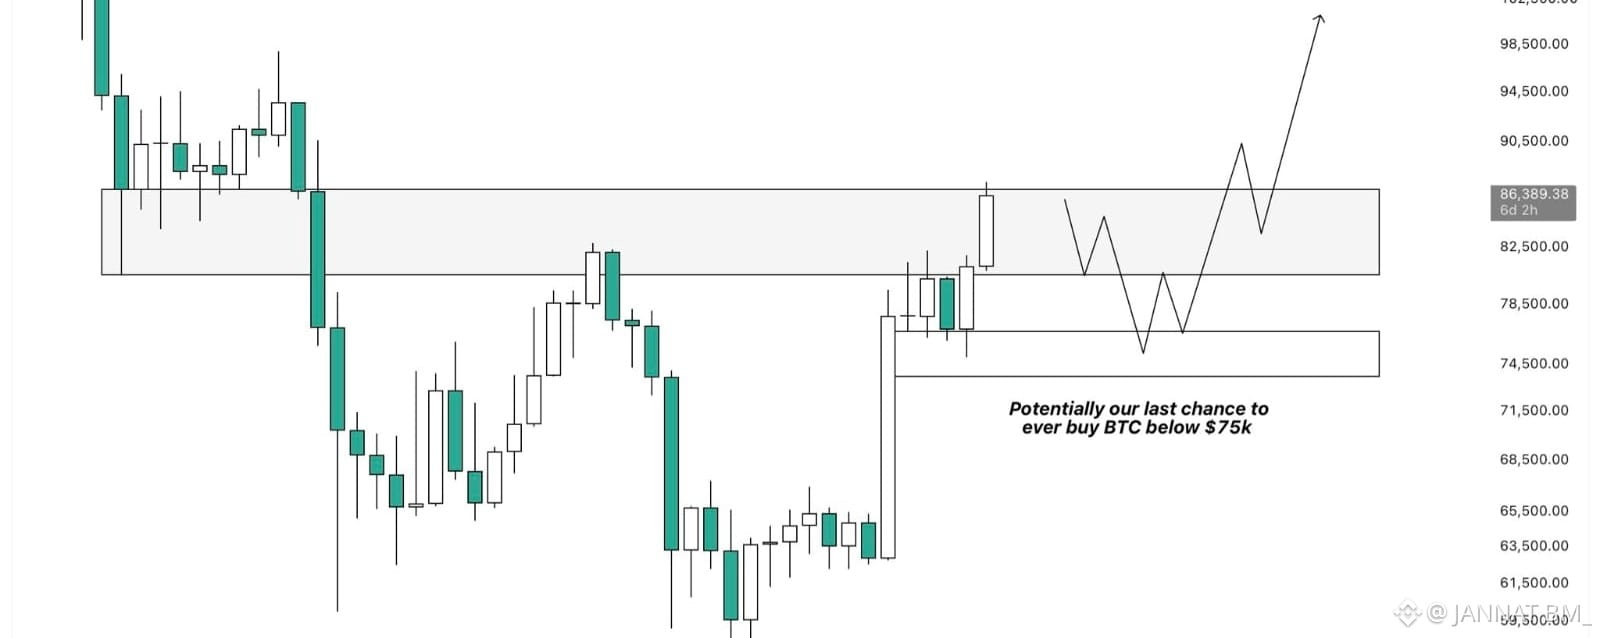
ບົດຄວາມ
BITCOIN’S NEXT BIG MOVE DEPENDS ON THIS KEY ZONESometimes the hardest part of a Bitcoin move isn’t the breakout itself.
It’s figuring out whether the market is actually changing structure, or simply giving traders another temporary push before the next rejection.
That’s what makes the current BTC setup interesting. Bitcoin is curently retesting a resistance zone that has already played an important role in the higher-timeframe structure. This is not just another random level on the chart. It is a previous breakdown area, and it also rejected BTC back in May when the market formed its last major HTF high.
So naturally, I’m paying much more attention here.
The interesting part is that momentum still looks very strong.
Price has pushed higher with enough strength to bring this resistance back into focus, and if BTC can reclaim the zone properly, the next major area I’m watching is around $97K.
But I don’t think simply trading above the level for a few hours would be enough confirmation.
For me, the more important signal would be a weekly close above $87K.
That would show that Bitcoin didn’t just wick through resistance. It would give the market a stronger reason to believe that this old breakdown area is actually being reclaimed.
At the same time, I’m not convinced that the first attempt has to succeed.
In fact, my expectation is still that BTC could face another rejection from this region before the larger move develops.
And this is where the $74K–$76K area becomes interesting. If BTC gets rejected from the current resistance and starts moving lower, that zone could potentially become a place where buyers step back in. It already represents an important support area, but there is another reason I’m watching it closely.
Liquidity.
A large cluster of long liquidations has built up around that region. If price moves into it, the market could potentialy clear some of that liquidity before finding enough demand for another move higher.
That kind of move can be uncomfortable to watch in real time.
But sometimes the market needs to shake out weaker positions before a cleaner trend can develop.
So, in my view, there are two levels that matter a lot right now.
First, whether BTC can reclaim and eventually confirm above the $87K area on the weekly timeframe.
Second, whether a rejection eventually brings price back toward $74K–$76K and whether buyers defend that region.
If that lower zone holds, it could become the higher low I’m looking for before another larger expansion to the upside.
And honestly, that possibility is what makes this setup so interesting to me.
Could $74K–$76K become the final major opportunity to see Bitcoin trading below $75K, or does the market still have another surprise waiting before the next big move?
$BTC
{future}(BTCUSDT)
$AAPLB
{spot}(AAPLBUSDT)
$NVDAB
{spot}(NVDABUSDT)
#BitcoinSpotETFs$999MNetInflow
BITCOIN’S NEXT BIG MOVE DEPENDS ON THIS KEY ZONE
Sometimes the hardest part of a Bitcoin move isn’t the breakout itself.
It’s figuring out whether the market is actually changing structure, or simply giving traders another temporary push before the next rejection.
That’s what makes the current BTC setup interesting. Bitcoin is curently retesting a resistance zone that has already played an important role in the higher-timeframe structure. This is not just another random level on the chart. It is a previous breakdown area, and it also rejected BTC back in May when the market formed its last major HTF high.
So naturally, I’m paying much more attention here.
The interesting part is that momentum still looks very strong.
Price has pushed higher with enough strength to bring this resistance back into focus, and if BTC can reclaim the zone properly, the next major area I’m watching is around $97K.
But I don’t think simply trading above the level for a few hours would be enough confirmation.
For me, the more important signal would be a weekly close above $87K.
That would show that Bitcoin didn’t just wick through resistance. It would give the market a stronger reason to believe that this old breakdown area is actually being reclaimed.
At the same time, I’m not convinced that the first attempt has to succeed.
In fact, my expectation is still that BTC could face another rejection from this region before the larger move develops.
And this is where the $74K–$76K area becomes interesting. If BTC gets rejected from the current resistance and starts moving lower, that zone could potentially become a place where buyers step back in. It already represents an important support area, but there is another reason I’m watching it closely.
Liquidity.
A large cluster of long liquidations has built up around that region. If price moves into it, the market could potentialy clear some of that liquidity before finding enough demand for another move higher.
That kind of move can be uncomfortable to watch in real time.
But sometimes the market needs to shake out weaker positions before a cleaner trend can develop.
So, in my view, there are two levels that matter a lot right now.
First, whether BTC can reclaim and eventually confirm above the $87K area on the weekly timeframe.
Second, whether a rejection eventually brings price back toward $74K–$76K and whether buyers defend that region.
If that lower zone holds, it could become the higher low I’m looking for before another larger expansion to the upside.
And honestly, that possibility is what makes this setup so interesting to me.
Could $74K–$76K become the final major opportunity to see Bitcoin trading below $75K, or does the market still have another surprise waiting before the next big move?
$BTC
$AAPLB
$NVDAB
#BitcoinSpotETFs$999MNetInflow
It’s figuring out whether the market is actually changing structure, or simply giving traders another temporary push before the next rejection.
That’s what makes the current BTC setup interesting. Bitcoin is curently retesting a resistance zone that has already played an important role in the higher-timeframe structure. This is not just another random level on the chart. It is a previous breakdown area, and it also rejected BTC back in May when the market formed its last major HTF high.
So naturally, I’m paying much more attention here.
The interesting part is that momentum still looks very strong.
Price has pushed higher with enough strength to bring this resistance back into focus, and if BTC can reclaim the zone properly, the next major area I’m watching is around $97K.
But I don’t think simply trading above the level for a few hours would be enough confirmation.
For me, the more important signal would be a weekly close above $87K.
That would show that Bitcoin didn’t just wick through resistance. It would give the market a stronger reason to believe that this old breakdown area is actually being reclaimed.
At the same time, I’m not convinced that the first attempt has to succeed.
In fact, my expectation is still that BTC could face another rejection from this region before the larger move develops.
And this is where the $74K–$76K area becomes interesting. If BTC gets rejected from the current resistance and starts moving lower, that zone could potentially become a place where buyers step back in. It already represents an important support area, but there is another reason I’m watching it closely.
Liquidity.
A large cluster of long liquidations has built up around that region. If price moves into it, the market could potentialy clear some of that liquidity before finding enough demand for another move higher.
That kind of move can be uncomfortable to watch in real time.
But sometimes the market needs to shake out weaker positions before a cleaner trend can develop.
So, in my view, there are two levels that matter a lot right now.
First, whether BTC can reclaim and eventually confirm above the $87K area on the weekly timeframe.
Second, whether a rejection eventually brings price back toward $74K–$76K and whether buyers defend that region.
If that lower zone holds, it could become the higher low I’m looking for before another larger expansion to the upside.
And honestly, that possibility is what makes this setup so interesting to me.
Could $74K–$76K become the final major opportunity to see Bitcoin trading below $75K, or does the market still have another surprise waiting before the next big move?
$BTC
$AAPLB
$NVDAB
#BitcoinSpotETFs$999MNetInflow
4
255

·
--
ສັນຍານໝີ
Good Morning, Dear Token Talk Family!
Yesterday was awesome! We had some really good trades throughout the day, and many of them gave us huge moves and great profit opportunities.
Some of the standout trades were $ZEC $SEI $AKE $XRP and $XMR. Each setup gave us a strong move, and it was another day where patience and proper entries really paid off.
Overall, it was a fantastic day for Token Talk. 📈
Now tell me 👇
Which trade did you catch yesterday?
Share your screenshots and results in the comments.
I want to see how your day went!
#BitcoinSpotETFs$999MNetInflow
Good Morning, Dear Token Talk Family!
Yesterday was awesome! We had some really good trades throughout the day, and many of them gave us huge moves and great profit opportunities.
Some of the standout trades were $ZEC $SEI $AKE $XRP and $XMR. Each setup gave us a strong move, and it was another day where patience and proper entries really paid off.
Overall, it was a fantastic day for Token Talk. 📈
Now tell me 👇
Which trade did you catch yesterday?
Share your screenshots and results in the comments.
I want to see how your day went!
#BitcoinSpotETFs$999MNetInflow
Yesterday was awesome! We had some really good trades throughout the day, and many of them gave us huge moves and great profit opportunities.
Some of the standout trades were $ZEC $SEI $AKE $XRP and $XMR. Each setup gave us a strong move, and it was another day where patience and proper entries really paid off.
Overall, it was a fantastic day for Token Talk. 📈
Now tell me 👇
Which trade did you catch yesterday?
Share your screenshots and results in the comments.
I want to see how your day went!
#BitcoinSpotETFs$999MNetInflow
Asmara14:
Can we open Btc short
1
852
ເຂົ້າສູ່ລະບົບເພື່ອສຳຫຼວດເນື້ອຫາເພີ່ມເຕີມ
ເຂົ້າຮ່ວມກຸ່ມຜູ້ໃຊ້ຄຣິບໂຕທົ່ວໂລກໃນ Binance Square.
⚡️ ໄດ້ຮັບຂໍ້ມູນຫຼ້າສຸດ ແລະ ທີ່ມີປະໂຫຍດກ່ຽວກັບຄຣິບໂຕ.
💬 ໄດ້ຮັບຄວາມໄວ້ວາງໃຈຈາກຕະຫຼາດແລກປ່ຽນຄຣິບໂຕທີ່ໃຫຍ່ທີ່ສຸດໃນໂລກ.
👍 ຄົ້ນຫາຂໍ້ມູນເຊີງເລິກທີ່ແທ້ຈາກນັກສ້າງທີ່ໄດ້ຮັບການຢືນຢັນ.
ອີເມວ / ເບີໂທລະສັບ
ຫົວຂໍ້ທີ່ກໍາລັງນິຍົມ
1
#CircleTetherFreezeBitgetHackerWallet
17,697 views
175 ກຳລັງສົນທະນາ
2
#SECSaysTokenBuybacksNotAutoSecurities
1,310 views
66 ກຳລັງສົນທະນາ
3
#ChinaUSAgreeOn$30BTariffCut
140 views
3 ກຳລັງສົນທະນາ
4
#CoinMarketCapCompletesCoinglassAcquisition
21,706 views
228 ກຳລັງສົນທະນາ
5
#CircleMints500MUSDCOnSolana
154,408 views
2,711 ກຳລັງສົນທະນາ
6
#PolymarketBankFailureBetsDrawFDICConcern
136,762 views
2,189 ກຳລັງສົນທະນາ
7
#BlackRockBuildsTokenizedPortfoliosForOndo
130,897 views
1,581 ກຳລັງສົນທະນາ
8
#BitwiseFilesToListNEARETFOnNYSEArca
90,789 views
1,240 ກຳລັງສົນທະນາ
9
#SECSaysBuybacksUpgradesDontMakeTokenSecurity
73,458 views
716 ກຳລັງສົນທະນາ
10
#StrategyProposesDailyDividendsForPreferreds
20,615 views
263 ກຳລັງສົນທະນາ