
BlockTrendWatch
409 Жариялаулар

BlockTrendWatch
Хабарлау
Пайдаланушыны блоктау
Welcome to BlockTrendWatch! Your guide to the latest in crypto trends, insights, and strategies. Educational purposes only. Not financial advice.
Ашық сауда

BNB ұстаушы
Кездейсоқ трейдер
5.4 жыл
8 Жазылым
1.2K+ Жазылушылар
857 лайк басылған
Жазбалар
Портфолио
Барлығы
Баға ұсыныстары
Видеолар

Мақала
Markets Priced a Fed Hike. Stocks Bounced. Why Didn’t Bitcoin?The most important Bitcoin signal today may not be the inflation number itself.
It may be what Bitcoin failed to do afterward.
U.S. inflation came in firm enough to push markets much closer to expecting another Federal Reserve rate hike next week.
Treasury yields remained near multi-year highs. Oil stayed above $100. Yet the dollar did not surge, and U.S. stocks finished Friday with a strong rebound.
Bitcoin?
It remained near $77,000.
That divergence deserves attention.
THE BIG PICTURE
August U.S. CPI increased 0.4% month over month and 3.4% year over year.
Core inflation, which removes food and energy, increased 0.3% for the month and 2.4% year over year. The monthly core figure was firmer than expected.
After the report, markets moved to roughly an 85% probability of a 25-basis-point Fed rate hike at the September 15–16 FOMC meeting.
At the same time, another inflation problem has not disappeared.
Brent crude settled around $104.61 per barrel after approaching $110 earlier in the week. It was still more than 8% higher on the week amid continuing disruption and geopolitical risk in the Gulf.
The U.S. 10-year Treasury yield also briefly reached approximately 4.99% — dangerously close to the psychologically important 5% level.
On paper, this is not an especially friendly macro environment for Bitcoin.
But markets did something interesting.
WHAT THE MARKET ACTUALLY DID
Despite the higher probability of another Fed hike:
- the S&P 500 gained about 0.9% Friday;
- the Nasdaq gained about 1%;
- oil pulled back;
- the dollar remained relatively restrained;
- Bitcoin stayed around $77,000 rather than producing a comparable risk-on rebound.
This is where the story becomes more interesting than simply saying:
“Hot inflation = bad for Bitcoin.”
Markets rarely behave that cleanly.
THE PRICE-REACTION TEST
The expected chain would normally look something like this:
Higher inflation → higher Fed-hike probability → higher yields → stronger USD → pressure on stocks and Bitcoin.
But that is not exactly what happened.
Fed-hike expectations rose.
Treasury yields stayed extremely high.
Yet the dollar failed to produce a major breakout, and equities rallied as oil prices eased.
Bitcoin did not collapse — which is important.
But it also failed to participate meaningfully in the equity rebound.
That creates a different question:
«Is Bitcoin simply reacting later than stocks, or is crypto showing relative weakness of its own?»
Right now, I think that is the question traders should be watching.
A SECOND WARNING: ETF FLOWS
There is another piece of evidence.
U.S. spot Bitcoin ETFs recorded approximately:
September 9: -$120.2 million
September 10: -$282.7 million
in net flows.
Two negative sessions do not establish a long-term trend.
But they matter when Bitcoin is simultaneously struggling to recover.
A rally supported by persistent spot demand deserves more confidence than one dependent primarily on leverage or short-term positioning.
For now, the ETF data are not providing that confirmation.
WHAT BITCOIN IS TELLING US
Bitcoin fell about 2.2% on September 10, moving from the $78K area into roughly $76.5K. During September 11 it remained centered around the upper-$76K to $77K region.
That makes several areas particularly useful.
~$76K — Immediate defense zone
Bitcoin is currently trying to establish acceptance above this area.
A brief wick below it would not be enough for me to declare a breakdown.
Sustained acceptance below it would be different.
~$78.5K — First reclaim test
BTC traded around this region before Thursday's decline.
Recovering it would be the first indication that buyers are regaining control.
~$80K–$82K — Stronger confirmation
Bitcoin traded above $80K earlier in the week, and the September 3 high reached roughly $82.2K.
A convincing reclaim of this region despite elevated Treasury yields would significantly weaken today's relative-weakness thesis.
These are market-structure zones derived from recent BTC price action — not magical numbers.
WHAT ABOUT ETH AND ALTCOINS?
Ethereum is around the mid-$2,400s, after also weakening during the week.
The environment therefore does not yet look like a convincing broad altcoin risk-on setup.
For that thesis to improve, I would want to see several things:
Bitcoin stabilizing.
ETH showing relative strength.
Better crypto breadth.
Improving spot demand.
And ideally, less pressure from global rates.
Until then, smaller crypto assets have less room for error than Bitcoin.
THE DOLLAR IS ALSO SENDING A MESSAGE
One of today's most interesting macro signals is what the dollar didn't do.
The probability of a Fed hike rose sharply.
The U.S. two-year Treasury yield moved to around 4.63%.
Geopolitical uncertainty remains elevated.
Yet the Dollar Index was roughly flat after the CPI release and is headed toward a second consecutive weekly decline.
That matters.
It tells us not to automatically use:
“Fed hawkish = DXY higher = Bitcoin lower.”
Correlations change.
Price reaction must confirm the narrative.
Today, the dollar did not fully confirm it.
THREE BTC SCENARIOS
BASE CASE — 45–55%
Bitcoin continues consolidating roughly inside the $75K–$80K region while markets wait for the Fed.
What would support this scenario?
BTC continues defending the current area.
ETF outflows moderate.
$78.5K begins to be reclaimed.
And the Fed delivers something close to what markets already expect.
BULL CASE — 20–30%
Bitcoin absorbs the rates shock and begins reclaiming $80K–$82K.
That would be important.
If Bitcoin can rally while Treasury yields remain elevated, the market would be telling us that buyers are willing to absorb unfavorable macro conditions.
That would represent genuine relative strength.
$BTC
BEAR CASE — 25–35%
Bitcoin loses the ~$76K region and begins establishing sustained acceptance underneath it.
The bearish case becomes stronger if that happens alongside:
continued ETF outflows;
another rise in Treasury yields;
renewed oil escalation;
or a Fed message more restrictive than markets currently expect.
These probability ranges are analytical estimates, not statistically precise forecasts.
WHAT WOULD PROVE THIS VIEW WRONG?
This matters more than any price target.
The current thesis is:
Bitcoin is showing relative weakness because it has failed to meaningfully participate in improving short-term equity sentiment while crypto spot demand has weakened.
The cleanest invalidation would be Bitcoin reclaiming roughly $80K–$82K, particularly if ETF flows improve while yields remain elevated.
If that happens, the market will have answered today's question.
Bitcoin wasn't weak.
It was absorbing the shock.
And the thesis must change.
WHAT COMES NEXT?
The major catalyst is obvious:
Federal Reserve — September 15–16.
The meeting matters for more than whether policymakers move rates by 25 basis points.
Markets will also care about:
the Fed's inflation assessment;
how officials interpret the oil shock;
whether another hike could follow;
and how much tightening is already considered necessary.
The Fed's official calendar confirms that the September policy meeting concludes on September 16 with a press conference.
Bitcoin's reaction may be more useful than the decision itself.
If hawkish news arrives and BTC refuses to fall, pay attention.
If a relatively benign Fed outcome arrives and Bitcoin still cannot rally, pay even more attention.
CRYPTO SAGE TAKEAWAY
Today's lesson is not that CPI was bullish or bearish for Bitcoin.
The more useful observation is this:
Fed-hike expectations increased. Treasury yields stayed near 5%. Oil remained above $100. The dollar stayed surprisingly restrained. Stocks bounced. Bitcoin barely participated, while ETF flows had turned negative.
That does not prove Bitcoin is about to break down.
But it does create a falsifiable warning.
For now, BTC is failing an early relative-strength test.
The next question is whether buyers can reclaim the $78.5K–$82K region — or whether ~$76K eventually gives way.
Don't predict the market's answer.
Watch what price does when the next information arrives.
— CRYPTO SAGE
SOURCES / REFERENCES
U.S. Bureau of Labor Statistics / Reuters — August 2026 Consumer Price Index reporting and market implications, September 11, 2026.
Federal Reserve Board — 2026 FOMC meeting calendar; September 15–16 meeting.
Reuters — U.S. dollar and Treasury-market reaction following August CPI, September 11, 2026.
Reuters — Global market reaction: equities, Treasury yields and oil, September 11, 2026.
Reuters — Brent crude and Gulf supply developments, September 11, 2026.
Farside Investors — U.S. Bitcoin Spot ETF Flow data, September 9–10, 2026.
Investing.com — Bitcoin and Ethereum historical market data used for recent price structure.
#Bitcoin #BTC #FederalReserve #BitcoinETF #Ethereum
Markets Priced a Fed Hike. Stocks Bounced. Why Didn’t Bitcoin?
The most important Bitcoin signal today may not be the inflation number itself.
It may be what Bitcoin failed to do afterward.
U.S. inflation came in firm enough to push markets much closer to expecting another Federal Reserve rate hike next week.
Treasury yields remained near multi-year highs. Oil stayed above $100. Yet the dollar did not surge, and U.S. stocks finished Friday with a strong rebound.
Bitcoin?
It remained near $77,000.
That divergence deserves attention.
THE BIG PICTURE
August U.S. CPI increased 0.4% month over month and 3.4% year over year.
Core inflation, which removes food and energy, increased 0.3% for the month and 2.4% year over year. The monthly core figure was firmer than expected.
After the report, markets moved to roughly an 85% probability of a 25-basis-point Fed rate hike at the September 15–16 FOMC meeting.
At the same time, another inflation problem has not disappeared.
Brent crude settled around $104.61 per barrel after approaching $110 earlier in the week. It was still more than 8% higher on the week amid continuing disruption and geopolitical risk in the Gulf.
The U.S. 10-year Treasury yield also briefly reached approximately 4.99% — dangerously close to the psychologically important 5% level.
On paper, this is not an especially friendly macro environment for Bitcoin.
But markets did something interesting.
WHAT THE MARKET ACTUALLY DID
Despite the higher probability of another Fed hike:
- the S&P 500 gained about 0.9% Friday;
- the Nasdaq gained about 1%;
- oil pulled back;
- the dollar remained relatively restrained;
- Bitcoin stayed around $77,000 rather than producing a comparable risk-on rebound.
This is where the story becomes more interesting than simply saying:
“Hot inflation = bad for Bitcoin.”
Markets rarely behave that cleanly.
THE PRICE-REACTION TEST
The expected chain would normally look something like this:
Higher inflation → higher Fed-hike probability → higher yields → stronger USD → pressure on stocks and Bitcoin.
But that is not exactly what happened.
Fed-hike expectations rose.
Treasury yields stayed extremely high.
Yet the dollar failed to produce a major breakout, and equities rallied as oil prices eased.
Bitcoin did not collapse — which is important.
But it also failed to participate meaningfully in the equity rebound.
That creates a different question:
«Is Bitcoin simply reacting later than stocks, or is crypto showing relative weakness of its own?»
Right now, I think that is the question traders should be watching.
A SECOND WARNING: ETF FLOWS
There is another piece of evidence.
U.S. spot Bitcoin ETFs recorded approximately:
September 9: -$120.2 million
September 10: -$282.7 million
in net flows.
Two negative sessions do not establish a long-term trend.
But they matter when Bitcoin is simultaneously struggling to recover.
A rally supported by persistent spot demand deserves more confidence than one dependent primarily on leverage or short-term positioning.
For now, the ETF data are not providing that confirmation.
WHAT BITCOIN IS TELLING US
Bitcoin fell about 2.2% on September 10, moving from the $78K area into roughly $76.5K. During September 11 it remained centered around the upper-$76K to $77K region.
That makes several areas particularly useful.
~$76K — Immediate defense zone
Bitcoin is currently trying to establish acceptance above this area.
A brief wick below it would not be enough for me to declare a breakdown.
Sustained acceptance below it would be different.
~$78.5K — First reclaim test
BTC traded around this region before Thursday's decline.
Recovering it would be the first indication that buyers are regaining control.
~$80K–$82K — Stronger confirmation
Bitcoin traded above $80K earlier in the week, and the September 3 high reached roughly $82.2K.
A convincing reclaim of this region despite elevated Treasury yields would significantly weaken today's relative-weakness thesis.
These are market-structure zones derived from recent BTC price action — not magical numbers.
WHAT ABOUT ETH AND ALTCOINS?
Ethereum is around the mid-$2,400s, after also weakening during the week.
The environment therefore does not yet look like a convincing broad altcoin risk-on setup.
For that thesis to improve, I would want to see several things:
Bitcoin stabilizing.
ETH showing relative strength.
Better crypto breadth.
Improving spot demand.
And ideally, less pressure from global rates.
Until then, smaller crypto assets have less room for error than Bitcoin.
THE DOLLAR IS ALSO SENDING A MESSAGE
One of today's most interesting macro signals is what the dollar didn't do.
The probability of a Fed hike rose sharply.
The U.S. two-year Treasury yield moved to around 4.63%.
Geopolitical uncertainty remains elevated.
Yet the Dollar Index was roughly flat after the CPI release and is headed toward a second consecutive weekly decline.
That matters.
It tells us not to automatically use:
“Fed hawkish = DXY higher = Bitcoin lower.”
Correlations change.
Price reaction must confirm the narrative.
Today, the dollar did not fully confirm it.
THREE BTC SCENARIOS
BASE CASE — 45–55%
Bitcoin continues consolidating roughly inside the $75K–$80K region while markets wait for the Fed.
What would support this scenario?
BTC continues defending the current area.
ETF outflows moderate.
$78.5K begins to be reclaimed.
And the Fed delivers something close to what markets already expect.
BULL CASE — 20–30%
Bitcoin absorbs the rates shock and begins reclaiming $80K–$82K.
That would be important.
If Bitcoin can rally while Treasury yields remain elevated, the market would be telling us that buyers are willing to absorb unfavorable macro conditions.
That would represent genuine relative strength.
$BTC
BEAR CASE — 25–35%
Bitcoin loses the ~$76K region and begins establishing sustained acceptance underneath it.
The bearish case becomes stronger if that happens alongside:
continued ETF outflows;
another rise in Treasury yields;
renewed oil escalation;
or a Fed message more restrictive than markets currently expect.
These probability ranges are analytical estimates, not statistically precise forecasts.
WHAT WOULD PROVE THIS VIEW WRONG?
This matters more than any price target.
The current thesis is:
Bitcoin is showing relative weakness because it has failed to meaningfully participate in improving short-term equity sentiment while crypto spot demand has weakened.
The cleanest invalidation would be Bitcoin reclaiming roughly $80K–$82K, particularly if ETF flows improve while yields remain elevated.
If that happens, the market will have answered today's question.
Bitcoin wasn't weak.
It was absorbing the shock.
And the thesis must change.
WHAT COMES NEXT?
The major catalyst is obvious:
Federal Reserve — September 15–16.
The meeting matters for more than whether policymakers move rates by 25 basis points.
Markets will also care about:
the Fed's inflation assessment;
how officials interpret the oil shock;
whether another hike could follow;
and how much tightening is already considered necessary.
The Fed's official calendar confirms that the September policy meeting concludes on September 16 with a press conference.
Bitcoin's reaction may be more useful than the decision itself.
If hawkish news arrives and BTC refuses to fall, pay attention.
If a relatively benign Fed outcome arrives and Bitcoin still cannot rally, pay even more attention.
CRYPTO SAGE TAKEAWAY
Today's lesson is not that CPI was bullish or bearish for Bitcoin.
The more useful observation is this:
Fed-hike expectations increased. Treasury yields stayed near 5%. Oil remained above $100. The dollar stayed surprisingly restrained. Stocks bounced. Bitcoin barely participated, while ETF flows had turned negative.
That does not prove Bitcoin is about to break down.
But it does create a falsifiable warning.
For now, BTC is failing an early relative-strength test.
The next question is whether buyers can reclaim the $78.5K–$82K region — or whether ~$76K eventually gives way.
Don't predict the market's answer.
Watch what price does when the next information arrives.
— CRYPTO SAGE
SOURCES / REFERENCES
U.S. Bureau of Labor Statistics / Reuters — August 2026 Consumer Price Index reporting and market implications, September 11, 2026.
Federal Reserve Board — 2026 FOMC meeting calendar; September 15–16 meeting.
Reuters — U.S. dollar and Treasury-market reaction following August CPI, September 11, 2026.
Reuters — Global market reaction: equities, Treasury yields and oil, September 11, 2026.
Reuters — Brent crude and Gulf supply developments, September 11, 2026.
Farside Investors — U.S. Bitcoin Spot ETF Flow data, September 9–10, 2026.
Investing.com — Bitcoin and Ethereum historical market data used for recent price structure.
#Bitcoin #BTC #FederalReserve #BitcoinETF #Ethereum
It may be what Bitcoin failed to do afterward.
U.S. inflation came in firm enough to push markets much closer to expecting another Federal Reserve rate hike next week.
Treasury yields remained near multi-year highs. Oil stayed above $100. Yet the dollar did not surge, and U.S. stocks finished Friday with a strong rebound.
Bitcoin?
It remained near $77,000.
That divergence deserves attention.
THE BIG PICTURE
August U.S. CPI increased 0.4% month over month and 3.4% year over year.
Core inflation, which removes food and energy, increased 0.3% for the month and 2.4% year over year. The monthly core figure was firmer than expected.
After the report, markets moved to roughly an 85% probability of a 25-basis-point Fed rate hike at the September 15–16 FOMC meeting.
At the same time, another inflation problem has not disappeared.
Brent crude settled around $104.61 per barrel after approaching $110 earlier in the week. It was still more than 8% higher on the week amid continuing disruption and geopolitical risk in the Gulf.
The U.S. 10-year Treasury yield also briefly reached approximately 4.99% — dangerously close to the psychologically important 5% level.
On paper, this is not an especially friendly macro environment for Bitcoin.
But markets did something interesting.
WHAT THE MARKET ACTUALLY DID
Despite the higher probability of another Fed hike:
- the S&P 500 gained about 0.9% Friday;
- the Nasdaq gained about 1%;
- oil pulled back;
- the dollar remained relatively restrained;
- Bitcoin stayed around $77,000 rather than producing a comparable risk-on rebound.
This is where the story becomes more interesting than simply saying:
“Hot inflation = bad for Bitcoin.”
Markets rarely behave that cleanly.
THE PRICE-REACTION TEST
The expected chain would normally look something like this:
Higher inflation → higher Fed-hike probability → higher yields → stronger USD → pressure on stocks and Bitcoin.
But that is not exactly what happened.
Fed-hike expectations rose.
Treasury yields stayed extremely high.
Yet the dollar failed to produce a major breakout, and equities rallied as oil prices eased.
Bitcoin did not collapse — which is important.
But it also failed to participate meaningfully in the equity rebound.
That creates a different question:
«Is Bitcoin simply reacting later than stocks, or is crypto showing relative weakness of its own?»
Right now, I think that is the question traders should be watching.
A SECOND WARNING: ETF FLOWS
There is another piece of evidence.
U.S. spot Bitcoin ETFs recorded approximately:
September 9: -$120.2 million
September 10: -$282.7 million
in net flows.
Two negative sessions do not establish a long-term trend.
But they matter when Bitcoin is simultaneously struggling to recover.
A rally supported by persistent spot demand deserves more confidence than one dependent primarily on leverage or short-term positioning.
For now, the ETF data are not providing that confirmation.
WHAT BITCOIN IS TELLING US
Bitcoin fell about 2.2% on September 10, moving from the $78K area into roughly $76.5K. During September 11 it remained centered around the upper-$76K to $77K region.
That makes several areas particularly useful.
~$76K — Immediate defense zone
Bitcoin is currently trying to establish acceptance above this area.
A brief wick below it would not be enough for me to declare a breakdown.
Sustained acceptance below it would be different.
~$78.5K — First reclaim test
BTC traded around this region before Thursday's decline.
Recovering it would be the first indication that buyers are regaining control.
~$80K–$82K — Stronger confirmation
Bitcoin traded above $80K earlier in the week, and the September 3 high reached roughly $82.2K.
A convincing reclaim of this region despite elevated Treasury yields would significantly weaken today's relative-weakness thesis.
These are market-structure zones derived from recent BTC price action — not magical numbers.
WHAT ABOUT ETH AND ALTCOINS?
Ethereum is around the mid-$2,400s, after also weakening during the week.
The environment therefore does not yet look like a convincing broad altcoin risk-on setup.
For that thesis to improve, I would want to see several things:
Bitcoin stabilizing.
ETH showing relative strength.
Better crypto breadth.
Improving spot demand.
And ideally, less pressure from global rates.
Until then, smaller crypto assets have less room for error than Bitcoin.
THE DOLLAR IS ALSO SENDING A MESSAGE
One of today's most interesting macro signals is what the dollar didn't do.
The probability of a Fed hike rose sharply.
The U.S. two-year Treasury yield moved to around 4.63%.
Geopolitical uncertainty remains elevated.
Yet the Dollar Index was roughly flat after the CPI release and is headed toward a second consecutive weekly decline.
That matters.
It tells us not to automatically use:
“Fed hawkish = DXY higher = Bitcoin lower.”
Correlations change.
Price reaction must confirm the narrative.
Today, the dollar did not fully confirm it.
THREE BTC SCENARIOS
BASE CASE — 45–55%
Bitcoin continues consolidating roughly inside the $75K–$80K region while markets wait for the Fed.
What would support this scenario?
BTC continues defending the current area.
ETF outflows moderate.
$78.5K begins to be reclaimed.
And the Fed delivers something close to what markets already expect.
BULL CASE — 20–30%
Bitcoin absorbs the rates shock and begins reclaiming $80K–$82K.
That would be important.
If Bitcoin can rally while Treasury yields remain elevated, the market would be telling us that buyers are willing to absorb unfavorable macro conditions.
That would represent genuine relative strength.
$BTC
BEAR CASE — 25–35%
Bitcoin loses the ~$76K region and begins establishing sustained acceptance underneath it.
The bearish case becomes stronger if that happens alongside:
continued ETF outflows;
another rise in Treasury yields;
renewed oil escalation;
or a Fed message more restrictive than markets currently expect.
These probability ranges are analytical estimates, not statistically precise forecasts.
WHAT WOULD PROVE THIS VIEW WRONG?
This matters more than any price target.
The current thesis is:
Bitcoin is showing relative weakness because it has failed to meaningfully participate in improving short-term equity sentiment while crypto spot demand has weakened.
The cleanest invalidation would be Bitcoin reclaiming roughly $80K–$82K, particularly if ETF flows improve while yields remain elevated.
If that happens, the market will have answered today's question.
Bitcoin wasn't weak.
It was absorbing the shock.
And the thesis must change.
WHAT COMES NEXT?
The major catalyst is obvious:
Federal Reserve — September 15–16.
The meeting matters for more than whether policymakers move rates by 25 basis points.
Markets will also care about:
the Fed's inflation assessment;
how officials interpret the oil shock;
whether another hike could follow;
and how much tightening is already considered necessary.
The Fed's official calendar confirms that the September policy meeting concludes on September 16 with a press conference.
Bitcoin's reaction may be more useful than the decision itself.
If hawkish news arrives and BTC refuses to fall, pay attention.
If a relatively benign Fed outcome arrives and Bitcoin still cannot rally, pay even more attention.
CRYPTO SAGE TAKEAWAY
Today's lesson is not that CPI was bullish or bearish for Bitcoin.
The more useful observation is this:
Fed-hike expectations increased. Treasury yields stayed near 5%. Oil remained above $100. The dollar stayed surprisingly restrained. Stocks bounced. Bitcoin barely participated, while ETF flows had turned negative.
That does not prove Bitcoin is about to break down.
But it does create a falsifiable warning.
For now, BTC is failing an early relative-strength test.
The next question is whether buyers can reclaim the $78.5K–$82K region — or whether ~$76K eventually gives way.
Don't predict the market's answer.
Watch what price does when the next information arrives.
— CRYPTO SAGE
SOURCES / REFERENCES
U.S. Bureau of Labor Statistics / Reuters — August 2026 Consumer Price Index reporting and market implications, September 11, 2026.
Federal Reserve Board — 2026 FOMC meeting calendar; September 15–16 meeting.
Reuters — U.S. dollar and Treasury-market reaction following August CPI, September 11, 2026.
Reuters — Global market reaction: equities, Treasury yields and oil, September 11, 2026.
Reuters — Brent crude and Gulf supply developments, September 11, 2026.
Farside Investors — U.S. Bitcoin Spot ETF Flow data, September 9–10, 2026.
Investing.com — Bitcoin and Ethereum historical market data used for recent price structure.
#Bitcoin #BTC #FederalReserve #BitcoinETF #Ethereum
173
·
--
Жоғары (өспелі)
Crypto Sage – Daily News (April 6, 2026)
Risk is no longer at the edges—it is moving into the core.
🪙 1️⃣ IMF Warns Tokenization Could Transmit Crypto Risk to Global Finance
On April 6, 2026, the International Monetary Fund warned that tokenization may connect crypto markets more deeply with traditional finance, allowing volatility and structural risks to spread across systems.
Why it matters: The boundary is dissolving. As crypto integrates with global finance, its risks no longer stay contained—they become systemic.
⚡ 2️⃣ Liquidity Expected to Concentrate Across Fewer Crypto Venues
On April 5, 2026, industry analysis highlighted that regulation and institutional flows are driving liquidity toward a smaller number of dominant platforms.
Why it matters: Efficiency increases, but resilience may decline. Fewer venues mean tighter spreads—but also greater dependence on centralized points of failure.
🌐 3️⃣ Bitcoin Rises Amid Geopolitical Signals and Macro Shifts
On April 6, 2026, Bitcoin traded higher as easing geopolitical tensions and shifting macro expectations influenced risk assets broadly.
Why it matters: Crypto remains macro-sensitive. Price action is no longer isolated—it reflects global narratives and capital rotation.
$BTC
{spot}(BTCUSDT)
💭 Closing reflection
Integration deepens. Liquidity concentrates. Signals blur. The system is becoming one. Understand the connections, not just the assets. Follow Crypto Sage.
#2026withBinance #Crypto2026 #Write2Earn
Crypto Sage – Daily News (April 6, 2026)
Risk is no longer at the edges—it is moving into the core.
🪙 1️⃣ IMF Warns Tokenization Could Transmit Crypto Risk to Global Finance
On April 6, 2026, the International Monetary Fund warned that tokenization may connect crypto markets more deeply with traditional finance, allowing volatility and structural risks to spread across systems.
Why it matters: The boundary is dissolving. As crypto integrates with global finance, its risks no longer stay contained—they become systemic.
⚡ 2️⃣ Liquidity Expected to Concentrate Across Fewer Crypto Venues
On April 5, 2026, industry analysis highlighted that regulation and institutional flows are driving liquidity toward a smaller number of dominant platforms.
Why it matters: Efficiency increases, but resilience may decline. Fewer venues mean tighter spreads—but also greater dependence on centralized points of failure.
🌐 3️⃣ Bitcoin Rises Amid Geopolitical Signals and Macro Shifts
On April 6, 2026, Bitcoin traded higher as easing geopolitical tensions and shifting macro expectations influenced risk assets broadly.
Why it matters: Crypto remains macro-sensitive. Price action is no longer isolated—it reflects global narratives and capital rotation.
$BTC
💭 Closing reflection
Integration deepens. Liquidity concentrates. Signals blur. The system is becoming one. Understand the connections, not just the assets. Follow Crypto Sage.
#2026withBinance #Crypto2026 #Write2Earn
Risk is no longer at the edges—it is moving into the core.
🪙 1️⃣ IMF Warns Tokenization Could Transmit Crypto Risk to Global Finance
On April 6, 2026, the International Monetary Fund warned that tokenization may connect crypto markets more deeply with traditional finance, allowing volatility and structural risks to spread across systems.
Why it matters: The boundary is dissolving. As crypto integrates with global finance, its risks no longer stay contained—they become systemic.
⚡ 2️⃣ Liquidity Expected to Concentrate Across Fewer Crypto Venues
On April 5, 2026, industry analysis highlighted that regulation and institutional flows are driving liquidity toward a smaller number of dominant platforms.
Why it matters: Efficiency increases, but resilience may decline. Fewer venues mean tighter spreads—but also greater dependence on centralized points of failure.
🌐 3️⃣ Bitcoin Rises Amid Geopolitical Signals and Macro Shifts
On April 6, 2026, Bitcoin traded higher as easing geopolitical tensions and shifting macro expectations influenced risk assets broadly.
Why it matters: Crypto remains macro-sensitive. Price action is no longer isolated—it reflects global narratives and capital rotation.
$BTC
💭 Closing reflection
Integration deepens. Liquidity concentrates. Signals blur. The system is becoming one. Understand the connections, not just the assets. Follow Crypto Sage.
#2026withBinance #Crypto2026 #Write2Earn

44
·
--
Төмен (кемімелі)
Crypto Sage – Daily News (March 24, 2026)
Stress reveals systems—what breaks shows what matters.
🪙 1️⃣ Bitcoin Liquidations Exceed $400M After Market Drop
On March 23–24, 2026, Bitcoin fell toward sixty-eight thousand dollars, triggering over four hundred million dollars in liquidations across crypto derivatives markets.
Why it matters: Liquidations expose leverage imbalance—when forced exits cascade, they reset positioning and reveal where real demand exists.
$BTC
{spot}(BTCUSDT)
⚡ 2️⃣ Balancer Winds Down After $128M Exploit Fallout
On March 24, 2026, Balancer Labs began winding down operations months after a one hundred twenty-eight million dollar exploit, highlighting the long tail of security failures in DeFi.
Why it matters: Security is not an event but a system—protocol resilience determines survival more than innovation cycles.
🌐 3️⃣ Institutions Explore Crypto Access Despite Volatility
On March 24, 2026, reports showed an Australian pension fund evaluating Bitcoin exposure for clients, even amid current market instability.
Why it matters: Institutional interest persists through volatility, suggesting long-term integration continues beneath short-term uncertainty.
💭 Closing reflection
Volatility tests conviction. Structure reveals direction. Follow Crypto Sage to see what remains.
Crypto Sage – Daily News (March 24, 2026)
Stress reveals systems—what breaks shows what matters.
🪙 1️⃣ Bitcoin Liquidations Exceed $400M After Market Drop
On March 23–24, 2026, Bitcoin fell toward sixty-eight thousand dollars, triggering over four hundred million dollars in liquidations across crypto derivatives markets.
Why it matters: Liquidations expose leverage imbalance—when forced exits cascade, they reset positioning and reveal where real demand exists.
$BTC
⚡ 2️⃣ Balancer Winds Down After $128M Exploit Fallout
On March 24, 2026, Balancer Labs began winding down operations months after a one hundred twenty-eight million dollar exploit, highlighting the long tail of security failures in DeFi.
Why it matters: Security is not an event but a system—protocol resilience determines survival more than innovation cycles.
🌐 3️⃣ Institutions Explore Crypto Access Despite Volatility
On March 24, 2026, reports showed an Australian pension fund evaluating Bitcoin exposure for clients, even amid current market instability.
Why it matters: Institutional interest persists through volatility, suggesting long-term integration continues beneath short-term uncertainty.
💭 Closing reflection
Volatility tests conviction. Structure reveals direction. Follow Crypto Sage to see what remains.
Stress reveals systems—what breaks shows what matters.
🪙 1️⃣ Bitcoin Liquidations Exceed $400M After Market Drop
On March 23–24, 2026, Bitcoin fell toward sixty-eight thousand dollars, triggering over four hundred million dollars in liquidations across crypto derivatives markets.
Why it matters: Liquidations expose leverage imbalance—when forced exits cascade, they reset positioning and reveal where real demand exists.
$BTC
⚡ 2️⃣ Balancer Winds Down After $128M Exploit Fallout
On March 24, 2026, Balancer Labs began winding down operations months after a one hundred twenty-eight million dollar exploit, highlighting the long tail of security failures in DeFi.
Why it matters: Security is not an event but a system—protocol resilience determines survival more than innovation cycles.
🌐 3️⃣ Institutions Explore Crypto Access Despite Volatility
On March 24, 2026, reports showed an Australian pension fund evaluating Bitcoin exposure for clients, even amid current market instability.
Why it matters: Institutional interest persists through volatility, suggesting long-term integration continues beneath short-term uncertainty.
💭 Closing reflection
Volatility tests conviction. Structure reveals direction. Follow Crypto Sage to see what remains.

84
·
--
Жоғары (өспелі)
Crypto Sage – Daily News (March 17, 2026)
In crypto markets, price moves quickly—but the deeper signals come from capital, policy, and timing.
🪙 1️⃣ Bitcoin Holds Near $74K as Macro and ETF Flows Drive Momentum
On March 17, 2026, Bitcoin traded around seventy‑four thousand dollars as investors watched global macro signals and institutional flows into spot Bitcoin ETFs. Analysts link the recent rebound to geopolitical uncertainty and renewed demand from large investors, which has helped push the asset back toward its February highs.
Why it matters: Bitcoin’s price is increasingly shaped by institutional capital and macro conditions rather than purely crypto‑native events.
⚡ 2️⃣ Citigroup Cuts Long‑Term Bitcoin and Ethereum Targets
On March 17, 2026, Citigroup lowered its twelve‑month forecasts for Bitcoin and Ethereum, citing stalled progress on U.S. cryptocurrency legislation. The bank reduced its Bitcoin target to one hundred twelve thousand dollars and warned that delays in regulatory clarity could slow institutional adoption.
Why it matters: Major financial institutions are now modeling crypto markets around regulation and policy timelines, not just technology.
🌐 3️⃣ T. Rowe Price Moves Toward New Multi‑Asset Crypto ETF
On March 16, 2026, asset manager T. Rowe Price filed updated plans for an actively managed crypto ETF that could include major tokens as well as meme‑coins such as Dogecoin and Shiba Inu. The filing outlines custody and potential staking components for the proposed fund.
Why it matters: Large asset managers expanding ETF offerings signals continued integration of crypto assets into traditional investment products.
$SHIB
{spot}(SHIBUSDT)
💭 Closing reflection
Markets react to headlines, but long‑term cycles follow capital and policy. Follow Crypto Sage to track the signals shaping the future of digital finance.
Crypto Sage – Daily News (March 17, 2026)
In crypto markets, price moves quickly—but the deeper signals come from capital, policy, and timing.
🪙 1️⃣ Bitcoin Holds Near $74K as Macro and ETF Flows Drive Momentum
On March 17, 2026, Bitcoin traded around seventy‑four thousand dollars as investors watched global macro signals and institutional flows into spot Bitcoin ETFs. Analysts link the recent rebound to geopolitical uncertainty and renewed demand from large investors, which has helped push the asset back toward its February highs.
Why it matters: Bitcoin’s price is increasingly shaped by institutional capital and macro conditions rather than purely crypto‑native events.
⚡ 2️⃣ Citigroup Cuts Long‑Term Bitcoin and Ethereum Targets
On March 17, 2026, Citigroup lowered its twelve‑month forecasts for Bitcoin and Ethereum, citing stalled progress on U.S. cryptocurrency legislation. The bank reduced its Bitcoin target to one hundred twelve thousand dollars and warned that delays in regulatory clarity could slow institutional adoption.
Why it matters: Major financial institutions are now modeling crypto markets around regulation and policy timelines, not just technology.
🌐 3️⃣ T. Rowe Price Moves Toward New Multi‑Asset Crypto ETF
On March 16, 2026, asset manager T. Rowe Price filed updated plans for an actively managed crypto ETF that could include major tokens as well as meme‑coins such as Dogecoin and Shiba Inu. The filing outlines custody and potential staking components for the proposed fund.
Why it matters: Large asset managers expanding ETF offerings signals continued integration of crypto assets into traditional investment products.
$SHIB
💭 Closing reflection
Markets react to headlines, but long‑term cycles follow capital and policy. Follow Crypto Sage to track the signals shaping the future of digital finance.
In crypto markets, price moves quickly—but the deeper signals come from capital, policy, and timing.
🪙 1️⃣ Bitcoin Holds Near $74K as Macro and ETF Flows Drive Momentum
On March 17, 2026, Bitcoin traded around seventy‑four thousand dollars as investors watched global macro signals and institutional flows into spot Bitcoin ETFs. Analysts link the recent rebound to geopolitical uncertainty and renewed demand from large investors, which has helped push the asset back toward its February highs.
Why it matters: Bitcoin’s price is increasingly shaped by institutional capital and macro conditions rather than purely crypto‑native events.
⚡ 2️⃣ Citigroup Cuts Long‑Term Bitcoin and Ethereum Targets
On March 17, 2026, Citigroup lowered its twelve‑month forecasts for Bitcoin and Ethereum, citing stalled progress on U.S. cryptocurrency legislation. The bank reduced its Bitcoin target to one hundred twelve thousand dollars and warned that delays in regulatory clarity could slow institutional adoption.
Why it matters: Major financial institutions are now modeling crypto markets around regulation and policy timelines, not just technology.
🌐 3️⃣ T. Rowe Price Moves Toward New Multi‑Asset Crypto ETF
On March 16, 2026, asset manager T. Rowe Price filed updated plans for an actively managed crypto ETF that could include major tokens as well as meme‑coins such as Dogecoin and Shiba Inu. The filing outlines custody and potential staking components for the proposed fund.
Why it matters: Large asset managers expanding ETF offerings signals continued integration of crypto assets into traditional investment products.
$SHIB
💭 Closing reflection
Markets react to headlines, but long‑term cycles follow capital and policy. Follow Crypto Sage to track the signals shaping the future of digital finance.

80
·
--
Жоғары (өспелі)
Crypto Sage – Daily News (March 16, 2026)
In crypto markets, momentum often reveals itself quietly—first in price, then in policy.
🪙 1️⃣ Bitcoin Breaks Above $74,000 in Broad Crypto Rally
On March 16, 2026, Bitcoin briefly moved above seventy‑four thousand dollars, leading a broad rally across major digital assets including Ether and Solana. Analysts link the move to improving macro sentiment, renewed ETF inflows, and technical momentum after Bitcoin cleared key resistance levels.
Why it matters: A decisive move above major resistance often attracts new institutional flows and reshapes short‑term market positioning.
⚡ 2️⃣ XRP Climbs Above $1.47 as Technical Breakout Extends
On March 16, 2026, XRP rose past one dollar and forty‑seven cents after breaking through a long‑standing resistance level that had capped prices for months. The breakout shifted short‑term momentum toward buyers as the broader crypto market strengthened.
Why it matters: When large-cap altcoins break major technical ceilings, it often signals expanding risk appetite across the wider crypto market.
🌐 3️⃣ U.S. Regulators Move Toward Coordinated Crypto Oversight
On March 15, 2026, the U.S. Securities and Exchange Commission and the Commodity Futures Trading Commission announced a new agreement to coordinate oversight of digital asset markets. Under the framework, the SEC will focus on primary token offerings while the CFTC oversees trading of digital commodities like Bitcoin and Ethereum.
Why it matters: Clearer regulatory coordination could reduce uncertainty for exchanges, institutional investors, and blockchain companies operating in the United States.
💭 Closing reflection
Markets move on momentum, but lasting cycles are shaped by structure and rules. Follow Crypto Sage to track the signals guiding the future of digital finance.
Crypto Sage – Daily News (March 16, 2026)
In crypto markets, momentum often reveals itself quietly—first in price, then in policy.
🪙 1️⃣ Bitcoin Breaks Above $74,000 in Broad Crypto Rally
On March 16, 2026, Bitcoin briefly moved above seventy‑four thousand dollars, leading a broad rally across major digital assets including Ether and Solana. Analysts link the move to improving macro sentiment, renewed ETF inflows, and technical momentum after Bitcoin cleared key resistance levels.
Why it matters: A decisive move above major resistance often attracts new institutional flows and reshapes short‑term market positioning.
⚡ 2️⃣ XRP Climbs Above $1.47 as Technical Breakout Extends
On March 16, 2026, XRP rose past one dollar and forty‑seven cents after breaking through a long‑standing resistance level that had capped prices for months. The breakout shifted short‑term momentum toward buyers as the broader crypto market strengthened.
Why it matters: When large-cap altcoins break major technical ceilings, it often signals expanding risk appetite across the wider crypto market.
🌐 3️⃣ U.S. Regulators Move Toward Coordinated Crypto Oversight
On March 15, 2026, the U.S. Securities and Exchange Commission and the Commodity Futures Trading Commission announced a new agreement to coordinate oversight of digital asset markets. Under the framework, the SEC will focus on primary token offerings while the CFTC oversees trading of digital commodities like Bitcoin and Ethereum.
Why it matters: Clearer regulatory coordination could reduce uncertainty for exchanges, institutional investors, and blockchain companies operating in the United States.
💭 Closing reflection
Markets move on momentum, but lasting cycles are shaped by structure and rules. Follow Crypto Sage to track the signals guiding the future of digital finance.
In crypto markets, momentum often reveals itself quietly—first in price, then in policy.
🪙 1️⃣ Bitcoin Breaks Above $74,000 in Broad Crypto Rally
On March 16, 2026, Bitcoin briefly moved above seventy‑four thousand dollars, leading a broad rally across major digital assets including Ether and Solana. Analysts link the move to improving macro sentiment, renewed ETF inflows, and technical momentum after Bitcoin cleared key resistance levels.
Why it matters: A decisive move above major resistance often attracts new institutional flows and reshapes short‑term market positioning.
⚡ 2️⃣ XRP Climbs Above $1.47 as Technical Breakout Extends
On March 16, 2026, XRP rose past one dollar and forty‑seven cents after breaking through a long‑standing resistance level that had capped prices for months. The breakout shifted short‑term momentum toward buyers as the broader crypto market strengthened.
Why it matters: When large-cap altcoins break major technical ceilings, it often signals expanding risk appetite across the wider crypto market.
🌐 3️⃣ U.S. Regulators Move Toward Coordinated Crypto Oversight
On March 15, 2026, the U.S. Securities and Exchange Commission and the Commodity Futures Trading Commission announced a new agreement to coordinate oversight of digital asset markets. Under the framework, the SEC will focus on primary token offerings while the CFTC oversees trading of digital commodities like Bitcoin and Ethereum.
Why it matters: Clearer regulatory coordination could reduce uncertainty for exchanges, institutional investors, and blockchain companies operating in the United States.
💭 Closing reflection
Markets move on momentum, but lasting cycles are shaped by structure and rules. Follow Crypto Sage to track the signals guiding the future of digital finance.

31
·
--
Жоғары (өспелі)
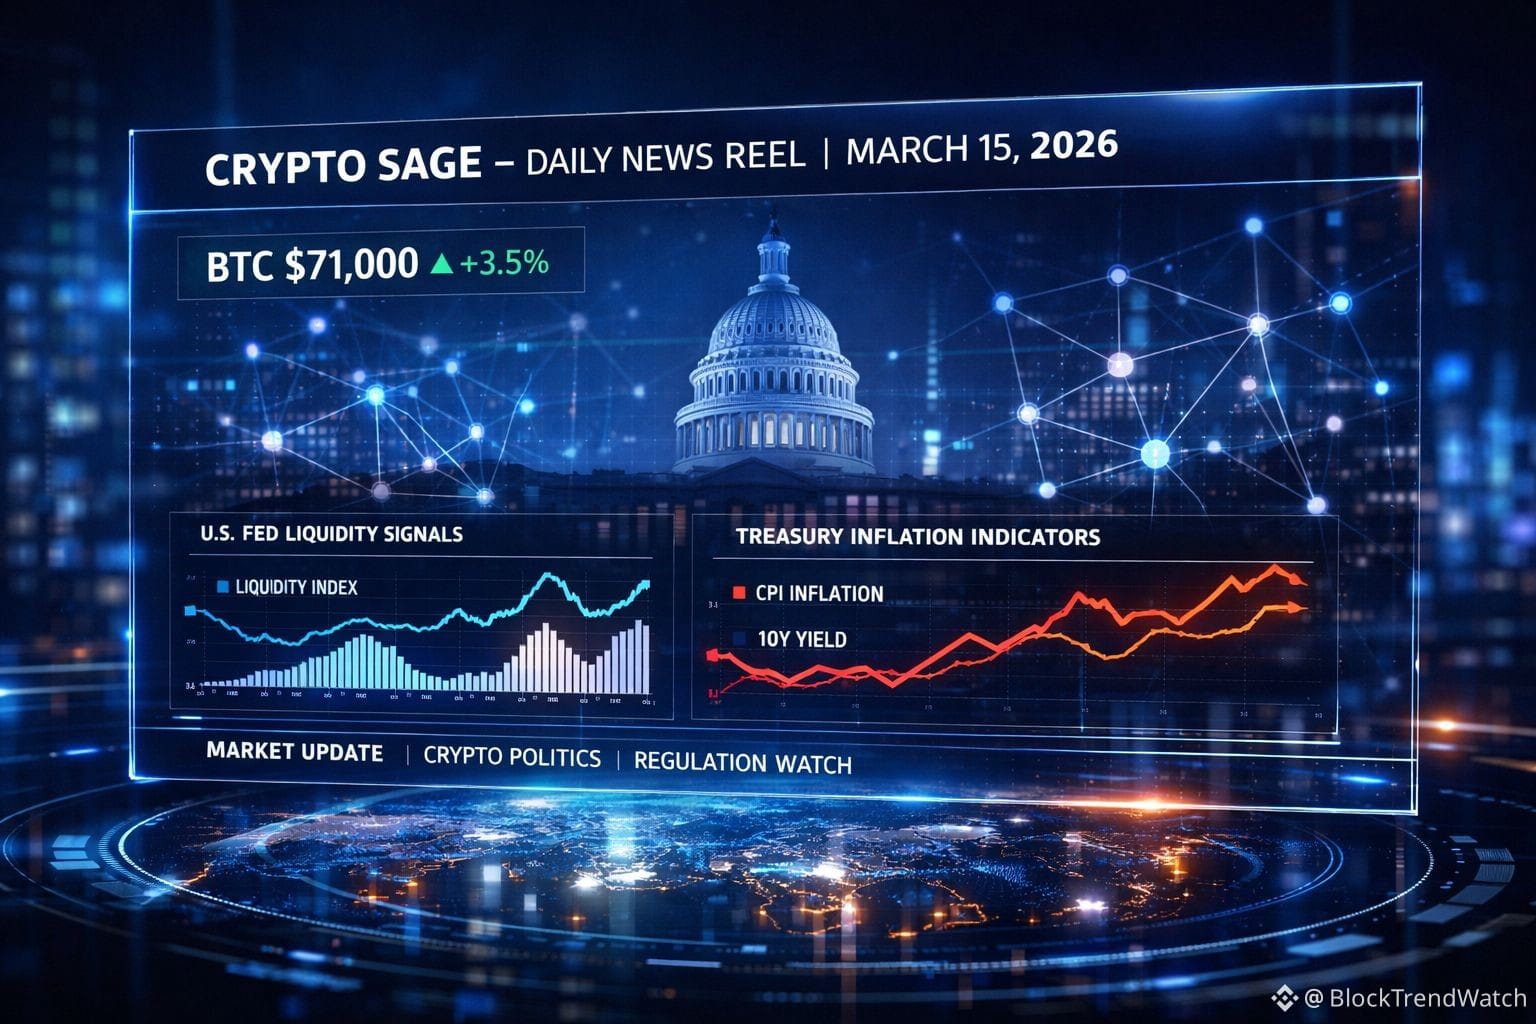
Crypto Sage – Daily News (March 15, 2026)
In crypto markets, price is only the surface—the deeper signal often comes from policy and capital flows.
🪙 1️⃣ Bitcoin Holds Near $71K as Investors Track Global Liquidity Signals
On March 14, 2026, Bitcoin traded near seventy‑one thousand dollars as investors monitored macroeconomic indicators ahead of the upcoming U.S. Federal Reserve policy decision. Market analysts note that traders are increasingly positioning around liquidity expectations rather than purely crypto‑native catalysts.
Why it matters: Bitcoin’s behavior is increasingly tied to global monetary policy, reinforcing its role as a macro‑sensitive digital asset.
⚡ 2️⃣ Bitcoin Approaches $72K After U.S. Treasury Comments Ease Inflation Fears
On March 13, 2026, Bitcoin rebounded toward seventy‑two thousand dollars after the U.S. Treasury reassured markets about inflation risks linked to rising oil prices. The comments helped stabilize sentiment across risk assets, including cryptocurrencies.
Why it matters: Government signals on inflation and energy markets now ripple quickly into crypto pricing and trader positioning.
$BTC
{spot}(BTCUSDT)
🌐 3️⃣ Crypto Industry Expands Political Influence Ahead of U.S. Elections
On March 14, 2026, reports highlighted that crypto‑aligned political groups have set aside roughly two hundred million dollars for the U.S. midterm election cycle, supporting candidates seen as favorable to digital‑asset regulation and innovation.
Why it matters: The next phase of crypto adoption may be shaped not only by technology—but by regulation and political alignment.
💭 Closing reflection
Technology builds the networks, but policy shapes the landscape they grow within. Follow Crypto Sage to track the signals guiding the future of digital finance.
Crypto Sage – Daily News (March 15, 2026)
In crypto markets, price is only the surface—the deeper signal often comes from policy and capital flows.
🪙 1️⃣ Bitcoin Holds Near $71K as Investors Track Global Liquidity Signals
On March 14, 2026, Bitcoin traded near seventy‑one thousand dollars as investors monitored macroeconomic indicators ahead of the upcoming U.S. Federal Reserve policy decision. Market analysts note that traders are increasingly positioning around liquidity expectations rather than purely crypto‑native catalysts.
Why it matters: Bitcoin’s behavior is increasingly tied to global monetary policy, reinforcing its role as a macro‑sensitive digital asset.
⚡ 2️⃣ Bitcoin Approaches $72K After U.S. Treasury Comments Ease Inflation Fears
On March 13, 2026, Bitcoin rebounded toward seventy‑two thousand dollars after the U.S. Treasury reassured markets about inflation risks linked to rising oil prices. The comments helped stabilize sentiment across risk assets, including cryptocurrencies.
Why it matters: Government signals on inflation and energy markets now ripple quickly into crypto pricing and trader positioning.
$BTC
🌐 3️⃣ Crypto Industry Expands Political Influence Ahead of U.S. Elections
On March 14, 2026, reports highlighted that crypto‑aligned political groups have set aside roughly two hundred million dollars for the U.S. midterm election cycle, supporting candidates seen as favorable to digital‑asset regulation and innovation.
Why it matters: The next phase of crypto adoption may be shaped not only by technology—but by regulation and political alignment.
💭 Closing reflection
Technology builds the networks, but policy shapes the landscape they grow within. Follow Crypto Sage to track the signals guiding the future of digital finance.
In crypto markets, price is only the surface—the deeper signal often comes from policy and capital flows.
🪙 1️⃣ Bitcoin Holds Near $71K as Investors Track Global Liquidity Signals
On March 14, 2026, Bitcoin traded near seventy‑one thousand dollars as investors monitored macroeconomic indicators ahead of the upcoming U.S. Federal Reserve policy decision. Market analysts note that traders are increasingly positioning around liquidity expectations rather than purely crypto‑native catalysts.
Why it matters: Bitcoin’s behavior is increasingly tied to global monetary policy, reinforcing its role as a macro‑sensitive digital asset.
⚡ 2️⃣ Bitcoin Approaches $72K After U.S. Treasury Comments Ease Inflation Fears
On March 13, 2026, Bitcoin rebounded toward seventy‑two thousand dollars after the U.S. Treasury reassured markets about inflation risks linked to rising oil prices. The comments helped stabilize sentiment across risk assets, including cryptocurrencies.
Why it matters: Government signals on inflation and energy markets now ripple quickly into crypto pricing and trader positioning.
$BTC
🌐 3️⃣ Crypto Industry Expands Political Influence Ahead of U.S. Elections
On March 14, 2026, reports highlighted that crypto‑aligned political groups have set aside roughly two hundred million dollars for the U.S. midterm election cycle, supporting candidates seen as favorable to digital‑asset regulation and innovation.
Why it matters: The next phase of crypto adoption may be shaped not only by technology—but by regulation and political alignment.
💭 Closing reflection
Technology builds the networks, but policy shapes the landscape they grow within. Follow Crypto Sage to track the signals guiding the future of digital finance.
66
·
--
Жоғары (өспелі)
Crypto Sage – Daily News (March 13, 2026)
In digital markets, the quiet signals often appear before the loud moves.
🪙 1️⃣ Bitcoin Climbs Above $71,000 Despite Global Market Stress
On March 13, 2026, Bitcoin traded around seventy‑one thousand dollars, rising roughly 2–3% over the previous day even as global stocks showed weakness and oil prices remained elevated. Analysts noted that crypto markets appeared to shrug off broader macro pressure.
Why it matters: When Bitcoin holds strength during global uncertainty, it reinforces its growing role as a macro asset watched alongside equities, bonds, and commodities.
⚡ 2️⃣ XRP Breaks Key Resistance as Trading Volume Surges
Also on March 13, 2026, XRP rose about three percent after breaking above the $1.39 level, ending a downward trend that had persisted through early 2026. Trading volume surged significantly during the move, signaling renewed market attention.
Why it matters: Technical breakouts often shift trader sentiment and can trigger new liquidity flows into major altcoins.
$XRP
{spot}(XRPUSDT)
🌐 3️⃣ Vitalik Buterin Emphasizes Simpler Vision for Ethereum
On March 12, 2026, Ethereum co‑founder Vitalik Buterin described Ethereum’s most valuable role as a neutral public ledger—similar to a secure “bulletin board” for decentralized systems.
Why it matters: The perspective highlights a shift toward simpler, infrastructure‑level uses for blockchains rather than overly complex applications.
💭 Closing reflection
Markets evolve through technology, liquidity, and ideas. Watch the signals shaping tomorrow’s financial networks—and follow Crypto Sage for the signal behind the noise.
Crypto Sage – Daily News (March 13, 2026)
In digital markets, the quiet signals often appear before the loud moves.
🪙 1️⃣ Bitcoin Climbs Above $71,000 Despite Global Market Stress
On March 13, 2026, Bitcoin traded around seventy‑one thousand dollars, rising roughly 2–3% over the previous day even as global stocks showed weakness and oil prices remained elevated. Analysts noted that crypto markets appeared to shrug off broader macro pressure.
Why it matters: When Bitcoin holds strength during global uncertainty, it reinforces its growing role as a macro asset watched alongside equities, bonds, and commodities.
⚡ 2️⃣ XRP Breaks Key Resistance as Trading Volume Surges
Also on March 13, 2026, XRP rose about three percent after breaking above the $1.39 level, ending a downward trend that had persisted through early 2026. Trading volume surged significantly during the move, signaling renewed market attention.
Why it matters: Technical breakouts often shift trader sentiment and can trigger new liquidity flows into major altcoins.
$XRP
🌐 3️⃣ Vitalik Buterin Emphasizes Simpler Vision for Ethereum
On March 12, 2026, Ethereum co‑founder Vitalik Buterin described Ethereum’s most valuable role as a neutral public ledger—similar to a secure “bulletin board” for decentralized systems.
Why it matters: The perspective highlights a shift toward simpler, infrastructure‑level uses for blockchains rather than overly complex applications.
💭 Closing reflection
Markets evolve through technology, liquidity, and ideas. Watch the signals shaping tomorrow’s financial networks—and follow Crypto Sage for the signal behind the noise.
In digital markets, the quiet signals often appear before the loud moves.
🪙 1️⃣ Bitcoin Climbs Above $71,000 Despite Global Market Stress
On March 13, 2026, Bitcoin traded around seventy‑one thousand dollars, rising roughly 2–3% over the previous day even as global stocks showed weakness and oil prices remained elevated. Analysts noted that crypto markets appeared to shrug off broader macro pressure.
Why it matters: When Bitcoin holds strength during global uncertainty, it reinforces its growing role as a macro asset watched alongside equities, bonds, and commodities.
⚡ 2️⃣ XRP Breaks Key Resistance as Trading Volume Surges
Also on March 13, 2026, XRP rose about three percent after breaking above the $1.39 level, ending a downward trend that had persisted through early 2026. Trading volume surged significantly during the move, signaling renewed market attention.
Why it matters: Technical breakouts often shift trader sentiment and can trigger new liquidity flows into major altcoins.
$XRP
🌐 3️⃣ Vitalik Buterin Emphasizes Simpler Vision for Ethereum
On March 12, 2026, Ethereum co‑founder Vitalik Buterin described Ethereum’s most valuable role as a neutral public ledger—similar to a secure “bulletin board” for decentralized systems.
Why it matters: The perspective highlights a shift toward simpler, infrastructure‑level uses for blockchains rather than overly complex applications.
💭 Closing reflection
Markets evolve through technology, liquidity, and ideas. Watch the signals shaping tomorrow’s financial networks—and follow Crypto Sage for the signal behind the noise.

1
1
80
·
--
Төмен (кемімелі)
Crypto Sage – Daily News Reel (March 12, 2026)
When markets hesitate, the signals often appear in structure, not price.
🪙 1️⃣ Bitcoin Holds Near $70,000 as Traders Position Defensively
On March 12, 2026, Bitcoin traded around sixty‑nine to seventy thousand dollars while derivatives open interest climbed toward one hundred billion dollars. Analysts say the rising leverage suggests traders are positioning cautiously rather than aggressively buying the rally.
Why it matters: A market holding high price levels while sentiment remains cautious can indicate structural strength—but also the potential for sudden volatility.
⚡ 2️⃣ Oil Shock Pushes Crypto Lower as Geopolitical Risk Returns
Also on March 12, 2026, Bitcoin briefly slipped below sixty‑nine thousand dollars after attacks on oil tankers pushed Brent crude above one hundred dollars per barrel. The move reflected broader macro stress across equities and risk assets.
Why it matters: Crypto markets are increasingly tied to global energy and geopolitical events, reinforcing Bitcoin’s role within the wider macro financial system.
$BTC
{spot}(BTCUSDT)
🌐 3️⃣ Crypto Developer Activity Falls as Talent Shifts to AI
New data published March 12, 2026 shows crypto development activity dropping sharply, with code commits across major blockchain projects declining as developers move toward artificial intelligence projects.
Why it matters: Talent flows often signal where innovation is heading. If developers concentrate elsewhere, the pace of blockchain experimentation may temporarily slow.
💭 Closing reflection + viewer call to action
Markets reveal their direction slowly—through macro pressure, capital flows, and the people building the next layer of technology.
Follow Crypto Sage for the signal behind the noise.
Crypto Sage – Daily News Reel (March 12, 2026)
When markets hesitate, the signals often appear in structure, not price.
🪙 1️⃣ Bitcoin Holds Near $70,000 as Traders Position Defensively
On March 12, 2026, Bitcoin traded around sixty‑nine to seventy thousand dollars while derivatives open interest climbed toward one hundred billion dollars. Analysts say the rising leverage suggests traders are positioning cautiously rather than aggressively buying the rally.
Why it matters: A market holding high price levels while sentiment remains cautious can indicate structural strength—but also the potential for sudden volatility.
⚡ 2️⃣ Oil Shock Pushes Crypto Lower as Geopolitical Risk Returns
Also on March 12, 2026, Bitcoin briefly slipped below sixty‑nine thousand dollars after attacks on oil tankers pushed Brent crude above one hundred dollars per barrel. The move reflected broader macro stress across equities and risk assets.
Why it matters: Crypto markets are increasingly tied to global energy and geopolitical events, reinforcing Bitcoin’s role within the wider macro financial system.
$BTC
🌐 3️⃣ Crypto Developer Activity Falls as Talent Shifts to AI
New data published March 12, 2026 shows crypto development activity dropping sharply, with code commits across major blockchain projects declining as developers move toward artificial intelligence projects.
Why it matters: Talent flows often signal where innovation is heading. If developers concentrate elsewhere, the pace of blockchain experimentation may temporarily slow.
💭 Closing reflection + viewer call to action
Markets reveal their direction slowly—through macro pressure, capital flows, and the people building the next layer of technology.
Follow Crypto Sage for the signal behind the noise.
When markets hesitate, the signals often appear in structure, not price.
🪙 1️⃣ Bitcoin Holds Near $70,000 as Traders Position Defensively
On March 12, 2026, Bitcoin traded around sixty‑nine to seventy thousand dollars while derivatives open interest climbed toward one hundred billion dollars. Analysts say the rising leverage suggests traders are positioning cautiously rather than aggressively buying the rally.
Why it matters: A market holding high price levels while sentiment remains cautious can indicate structural strength—but also the potential for sudden volatility.
⚡ 2️⃣ Oil Shock Pushes Crypto Lower as Geopolitical Risk Returns
Also on March 12, 2026, Bitcoin briefly slipped below sixty‑nine thousand dollars after attacks on oil tankers pushed Brent crude above one hundred dollars per barrel. The move reflected broader macro stress across equities and risk assets.
Why it matters: Crypto markets are increasingly tied to global energy and geopolitical events, reinforcing Bitcoin’s role within the wider macro financial system.
$BTC
🌐 3️⃣ Crypto Developer Activity Falls as Talent Shifts to AI
New data published March 12, 2026 shows crypto development activity dropping sharply, with code commits across major blockchain projects declining as developers move toward artificial intelligence projects.
Why it matters: Talent flows often signal where innovation is heading. If developers concentrate elsewhere, the pace of blockchain experimentation may temporarily slow.
💭 Closing reflection + viewer call to action
Markets reveal their direction slowly—through macro pressure, capital flows, and the people building the next layer of technology.
Follow Crypto Sage for the signal behind the noise.

31
·
--
Жоғары (өспелі)
Crypto Sage – Daily News (March 11, 2026)
In crypto, price charts move fast—but the deeper signals often come from policy, infrastructure, and global markets.
🪙 1️⃣ U.S. Lawmakers Push Compromise to Advance Crypto Market Structure Bill
On March 10, 2026, U.S. senators signaled a possible compromise to revive the stalled Digital Asset Market Clarity Act. Discussions now focus on whether stablecoin issuers should be allowed to offer yield, a point of tension between crypto firms and traditional banks.
Why it matters: Clear rules for digital assets could determine how banks, exchanges, and stablecoin issuers operate in the United States—potentially shaping global regulatory standards.
⚡ 2️⃣ Bitcoin Holds Near $70,000 Amid Energy and Macro Volatility
On March 11, 2026, Bitcoin traded around seventy thousand dollars after recovering from earlier declines tied to rising oil prices and geopolitical tensions. Market analysts noted the rebound as energy fears eased and global equities stabilized.
Why it matters: Bitcoin’s ability to stabilize during macro turbulence reinforces its evolving role as a global risk asset watched alongside commodities and equities.
🌐 3️⃣ Ripple Moves to Expand Payments With Australian Financial License
On March 11, 2026, Ripple announced plans to acquire an Australian financial services license through the purchase of BC Payments Australia, expanding its regulated footprint across Asia‑Pacific markets.
Why it matters: Regulatory licensing allows crypto payment networks to operate inside traditional financial systems, accelerating the integration of blockchain into global payment infrastructure.
$XRP
{spot}(XRPUSDT)
💭 Closing reflection + viewer call to action
Markets react to headlines. But regulation, macro forces, and financial infrastructure quietly shape the next phase of digital finance.
Follow Crypto Sage for the signal behind the noise.
Crypto Sage – Daily News (March 11, 2026)
In crypto, price charts move fast—but the deeper signals often come from policy, infrastructure, and global markets.
🪙 1️⃣ U.S. Lawmakers Push Compromise to Advance Crypto Market Structure Bill
On March 10, 2026, U.S. senators signaled a possible compromise to revive the stalled Digital Asset Market Clarity Act. Discussions now focus on whether stablecoin issuers should be allowed to offer yield, a point of tension between crypto firms and traditional banks.
Why it matters: Clear rules for digital assets could determine how banks, exchanges, and stablecoin issuers operate in the United States—potentially shaping global regulatory standards.
⚡ 2️⃣ Bitcoin Holds Near $70,000 Amid Energy and Macro Volatility
On March 11, 2026, Bitcoin traded around seventy thousand dollars after recovering from earlier declines tied to rising oil prices and geopolitical tensions. Market analysts noted the rebound as energy fears eased and global equities stabilized.
Why it matters: Bitcoin’s ability to stabilize during macro turbulence reinforces its evolving role as a global risk asset watched alongside commodities and equities.
🌐 3️⃣ Ripple Moves to Expand Payments With Australian Financial License
On March 11, 2026, Ripple announced plans to acquire an Australian financial services license through the purchase of BC Payments Australia, expanding its regulated footprint across Asia‑Pacific markets.
Why it matters: Regulatory licensing allows crypto payment networks to operate inside traditional financial systems, accelerating the integration of blockchain into global payment infrastructure.
$XRP
💭 Closing reflection + viewer call to action
Markets react to headlines. But regulation, macro forces, and financial infrastructure quietly shape the next phase of digital finance.
Follow Crypto Sage for the signal behind the noise.
In crypto, price charts move fast—but the deeper signals often come from policy, infrastructure, and global markets.
🪙 1️⃣ U.S. Lawmakers Push Compromise to Advance Crypto Market Structure Bill
On March 10, 2026, U.S. senators signaled a possible compromise to revive the stalled Digital Asset Market Clarity Act. Discussions now focus on whether stablecoin issuers should be allowed to offer yield, a point of tension between crypto firms and traditional banks.
Why it matters: Clear rules for digital assets could determine how banks, exchanges, and stablecoin issuers operate in the United States—potentially shaping global regulatory standards.
⚡ 2️⃣ Bitcoin Holds Near $70,000 Amid Energy and Macro Volatility
On March 11, 2026, Bitcoin traded around seventy thousand dollars after recovering from earlier declines tied to rising oil prices and geopolitical tensions. Market analysts noted the rebound as energy fears eased and global equities stabilized.
Why it matters: Bitcoin’s ability to stabilize during macro turbulence reinforces its evolving role as a global risk asset watched alongside commodities and equities.
🌐 3️⃣ Ripple Moves to Expand Payments With Australian Financial License
On March 11, 2026, Ripple announced plans to acquire an Australian financial services license through the purchase of BC Payments Australia, expanding its regulated footprint across Asia‑Pacific markets.
Why it matters: Regulatory licensing allows crypto payment networks to operate inside traditional financial systems, accelerating the integration of blockchain into global payment infrastructure.
$XRP
💭 Closing reflection + viewer call to action
Markets react to headlines. But regulation, macro forces, and financial infrastructure quietly shape the next phase of digital finance.
Follow Crypto Sage for the signal behind the noise.

42
·
--
Жоғары (өспелі)
🎬 Crypto Sage – Daily News (March 10, 2026)
Sometimes the biggest signal in crypto comes not from the blockchain—but from geopolitics.
🪙 1️⃣ Bitcoin Climbs Above $70,000 as Global Tensions Ease
On March 10, 2026, Bitcoin briefly surged above seventy thousand dollars after comments from U.S. President Donald Trump suggesting the conflict involving Iran could soon de‑escalate. The move lifted broader markets, with Ethereum and XRP also rising as investor sentiment improved.
Why it matters: Crypto increasingly reacts to global macro signals—geopolitics, energy markets, and monetary conditions—just like other major asset classes.
$XRP
{spot}(XRPUSDT)
⚡ 2️⃣ Bitcoin Rebounds After Oil‑Driven Weekend Volatility
Market data released on March 9 and March 10, 2026 shows Bitcoin recovering toward the seventy‑thousand‑dollar level after dropping near sixty‑five thousand during a weekend spike in oil prices and geopolitical stress.
Why it matters: The rebound highlights growing liquidity and resilience in the crypto market, where sharp macro shocks are increasingly absorbed rather than triggering sustained sell‑offs.
🌐 3️⃣ Nasdaq Explores Tokenized Stock Trading With Kraken
On March 9, 2026, reports revealed that Nasdaq is working with Kraken’s parent company to develop a platform for tokenized public stocks and exchange‑traded products, with a potential launch targeted for 2027.
Why it matters: Tokenized equities could merge traditional markets with blockchain infrastructure, expanding how global investors access financial assets.
Markets move quickly, but the deeper story unfolds slowly—where geopolitics, institutions, and blockchain infrastructure begin to converge. Follow Crypto Sage for the signal behind the noise.
🎬 Crypto Sage – Daily News (March 10, 2026)
Sometimes the biggest signal in crypto comes not from the blockchain—but from geopolitics.
🪙 1️⃣ Bitcoin Climbs Above $70,000 as Global Tensions Ease
On March 10, 2026, Bitcoin briefly surged above seventy thousand dollars after comments from U.S. President Donald Trump suggesting the conflict involving Iran could soon de‑escalate. The move lifted broader markets, with Ethereum and XRP also rising as investor sentiment improved.
Why it matters: Crypto increasingly reacts to global macro signals—geopolitics, energy markets, and monetary conditions—just like other major asset classes.
$XRP
⚡ 2️⃣ Bitcoin Rebounds After Oil‑Driven Weekend Volatility
Market data released on March 9 and March 10, 2026 shows Bitcoin recovering toward the seventy‑thousand‑dollar level after dropping near sixty‑five thousand during a weekend spike in oil prices and geopolitical stress.
Why it matters: The rebound highlights growing liquidity and resilience in the crypto market, where sharp macro shocks are increasingly absorbed rather than triggering sustained sell‑offs.
🌐 3️⃣ Nasdaq Explores Tokenized Stock Trading With Kraken
On March 9, 2026, reports revealed that Nasdaq is working with Kraken’s parent company to develop a platform for tokenized public stocks and exchange‑traded products, with a potential launch targeted for 2027.
Why it matters: Tokenized equities could merge traditional markets with blockchain infrastructure, expanding how global investors access financial assets.
Markets move quickly, but the deeper story unfolds slowly—where geopolitics, institutions, and blockchain infrastructure begin to converge. Follow Crypto Sage for the signal behind the noise.
Sometimes the biggest signal in crypto comes not from the blockchain—but from geopolitics.
🪙 1️⃣ Bitcoin Climbs Above $70,000 as Global Tensions Ease
On March 10, 2026, Bitcoin briefly surged above seventy thousand dollars after comments from U.S. President Donald Trump suggesting the conflict involving Iran could soon de‑escalate. The move lifted broader markets, with Ethereum and XRP also rising as investor sentiment improved.
Why it matters: Crypto increasingly reacts to global macro signals—geopolitics, energy markets, and monetary conditions—just like other major asset classes.
$XRP
⚡ 2️⃣ Bitcoin Rebounds After Oil‑Driven Weekend Volatility
Market data released on March 9 and March 10, 2026 shows Bitcoin recovering toward the seventy‑thousand‑dollar level after dropping near sixty‑five thousand during a weekend spike in oil prices and geopolitical stress.
Why it matters: The rebound highlights growing liquidity and resilience in the crypto market, where sharp macro shocks are increasingly absorbed rather than triggering sustained sell‑offs.
🌐 3️⃣ Nasdaq Explores Tokenized Stock Trading With Kraken
On March 9, 2026, reports revealed that Nasdaq is working with Kraken’s parent company to develop a platform for tokenized public stocks and exchange‑traded products, with a potential launch targeted for 2027.
Why it matters: Tokenized equities could merge traditional markets with blockchain infrastructure, expanding how global investors access financial assets.
Markets move quickly, but the deeper story unfolds slowly—where geopolitics, institutions, and blockchain infrastructure begin to converge. Follow Crypto Sage for the signal behind the noise.

1
127
·
--
Төмен (кемімелі)
In crypto markets, volatility is noise. Structure reveals the real signal.
On March 8, 2026, Bitcoin traded near sixty‑seven thousand dollars after briefly dropping to sixty‑six thousand during market volatility. Analysts note long‑term holders remain largely inactive, suggesting the move reflects short‑term positioning.
Bitcoin Rebounds From $66K
On March 8, 2026, industry discussions highlighted a growing challenge for smart‑contract blockchains—turning technical activity into sustainable economic value.
Smart Contract Value Gap
Market analysis released on March 8, 2026 shows crypto markets increasingly moving with global macro signals like inflation expectations and interest‑rate policy.
Macro Forces Shape Crypto
Prices fluctuate, but capital flows and infrastructure reveal the deeper direction of digital finance.
$BTC
{spot}(BTCUSDT)
In crypto markets, volatility is noise. Structure reveals the real signal.
On March 8, 2026, Bitcoin traded near sixty‑seven thousand dollars after briefly dropping to sixty‑six thousand during market volatility. Analysts note long‑term holders remain largely inactive, suggesting the move reflects short‑term positioning.
Bitcoin Rebounds From $66K
On March 8, 2026, industry discussions highlighted a growing challenge for smart‑contract blockchains—turning technical activity into sustainable economic value.
Smart Contract Value Gap
Market analysis released on March 8, 2026 shows crypto markets increasingly moving with global macro signals like inflation expectations and interest‑rate policy.
Macro Forces Shape Crypto
Prices fluctuate, but capital flows and infrastructure reveal the deeper direction of digital finance.
$BTC
On March 8, 2026, Bitcoin traded near sixty‑seven thousand dollars after briefly dropping to sixty‑six thousand during market volatility. Analysts note long‑term holders remain largely inactive, suggesting the move reflects short‑term positioning.
Bitcoin Rebounds From $66K
On March 8, 2026, industry discussions highlighted a growing challenge for smart‑contract blockchains—turning technical activity into sustainable economic value.
Smart Contract Value Gap
Market analysis released on March 8, 2026 shows crypto markets increasingly moving with global macro signals like inflation expectations and interest‑rate policy.
Macro Forces Shape Crypto
Prices fluctuate, but capital flows and infrastructure reveal the deeper direction of digital finance.
$BTC

44
Crypto Sage — Daily Crypto & Macro Digest
Date: 7 Mar 2026 — last 24 h
1) Market snapshot
Bitcoin (BTC): ~$68K–$69K, down ~3–4% in the past day amid macro‑driven risk‑off sentiment and profit‑taking after the recent rally above $73K.
Ethereum (ETH): ~$1.95K–$2.0K, following BTC lower as derivatives positioning unwinds.
Total crypto market cap: roughly $2.3T–$2.4T, reflecting broad consolidation across majors.
Notable movers
Solana (SOL) modestly positive amid continued ETF‑related inflow speculation.
Several DeFi tokens (e.g., AAVE) underperforming as market risk appetite weakens.
2) Top headlines
CoinDesk: Bitcoin volatility increases as traders reduce exposure ahead of key U.S. jobs data.
Takeaway: Macro catalysts—especially labor and inflation data—are driving short‑term positioning.
Reuters: Global equities and risk assets decline as oil surges and U.S. labor data disappoints.
Takeaway: Crypto remains tightly coupled with global macro sentiment
3) DeFi / On‑chain highlights
Derivatives: ~$110M in short liquidations earlier in the week helped drive BTC’s rally above $71K before the current pullback.
ETF ecosystem: continued inflows across BTC, ETH, and emerging SOL ETF products signal expanding institutional exposure.
4) Regulatory & institutional developments
Institutional infrastructure: Morgan Stanley filed updates for a Bitcoin trust structure using Coinbase Custody and BNY Mellon administration, reinforcing institutional custody standards.
5) Macro context
Labor market: U.S. payroll data showed unexpected job losses (~92K), raising recession concerns.
Energy markets: crude oil surged above $90 amid Middle East tensions, pushing markets into risk‑off mode.
Cross‑asset behavior: crypto continues trading like a high‑beta macro asset, reacting strongly to shifts in equities, oil, and interest‑rate expectations.
Risk notes
Macro risk: escalating geopolitical conflict or stronger inflation data could pressure risk assets.
Liquidity risk: thin spot volumes may amplify volatility.
$SOL
{spot}(SOLUSDT)
Crypto Sage — Daily Crypto & Macro Digest
Date: 7 Mar 2026 — last 24 h
1) Market snapshot
Bitcoin (BTC): ~$68K–$69K, down ~3–4% in the past day amid macro‑driven risk‑off sentiment and profit‑taking after the recent rally above $73K.
Ethereum (ETH): ~$1.95K–$2.0K, following BTC lower as derivatives positioning unwinds.
Total crypto market cap: roughly $2.3T–$2.4T, reflecting broad consolidation across majors.
Notable movers
Solana (SOL) modestly positive amid continued ETF‑related inflow speculation.
Several DeFi tokens (e.g., AAVE) underperforming as market risk appetite weakens.
2) Top headlines
CoinDesk: Bitcoin volatility increases as traders reduce exposure ahead of key U.S. jobs data.
Takeaway: Macro catalysts—especially labor and inflation data—are driving short‑term positioning.
Reuters: Global equities and risk assets decline as oil surges and U.S. labor data disappoints.
Takeaway: Crypto remains tightly coupled with global macro sentiment
3) DeFi / On‑chain highlights
Derivatives: ~$110M in short liquidations earlier in the week helped drive BTC’s rally above $71K before the current pullback.
ETF ecosystem: continued inflows across BTC, ETH, and emerging SOL ETF products signal expanding institutional exposure.
4) Regulatory & institutional developments
Institutional infrastructure: Morgan Stanley filed updates for a Bitcoin trust structure using Coinbase Custody and BNY Mellon administration, reinforcing institutional custody standards.
5) Macro context
Labor market: U.S. payroll data showed unexpected job losses (~92K), raising recession concerns.
Energy markets: crude oil surged above $90 amid Middle East tensions, pushing markets into risk‑off mode.
Cross‑asset behavior: crypto continues trading like a high‑beta macro asset, reacting strongly to shifts in equities, oil, and interest‑rate expectations.
Risk notes
Macro risk: escalating geopolitical conflict or stronger inflation data could pressure risk assets.
Liquidity risk: thin spot volumes may amplify volatility.
$SOL
Date: 7 Mar 2026 — last 24 h
1) Market snapshot
Bitcoin (BTC): ~$68K–$69K, down ~3–4% in the past day amid macro‑driven risk‑off sentiment and profit‑taking after the recent rally above $73K.
Ethereum (ETH): ~$1.95K–$2.0K, following BTC lower as derivatives positioning unwinds.
Total crypto market cap: roughly $2.3T–$2.4T, reflecting broad consolidation across majors.
Notable movers
Solana (SOL) modestly positive amid continued ETF‑related inflow speculation.
Several DeFi tokens (e.g., AAVE) underperforming as market risk appetite weakens.
2) Top headlines
CoinDesk: Bitcoin volatility increases as traders reduce exposure ahead of key U.S. jobs data.
Takeaway: Macro catalysts—especially labor and inflation data—are driving short‑term positioning.
Reuters: Global equities and risk assets decline as oil surges and U.S. labor data disappoints.
Takeaway: Crypto remains tightly coupled with global macro sentiment
3) DeFi / On‑chain highlights
Derivatives: ~$110M in short liquidations earlier in the week helped drive BTC’s rally above $71K before the current pullback.
ETF ecosystem: continued inflows across BTC, ETH, and emerging SOL ETF products signal expanding institutional exposure.
4) Regulatory & institutional developments
Institutional infrastructure: Morgan Stanley filed updates for a Bitcoin trust structure using Coinbase Custody and BNY Mellon administration, reinforcing institutional custody standards.
5) Macro context
Labor market: U.S. payroll data showed unexpected job losses (~92K), raising recession concerns.
Energy markets: crude oil surged above $90 amid Middle East tensions, pushing markets into risk‑off mode.
Cross‑asset behavior: crypto continues trading like a high‑beta macro asset, reacting strongly to shifts in equities, oil, and interest‑rate expectations.
Risk notes
Macro risk: escalating geopolitical conflict or stronger inflation data could pressure risk assets.
Liquidity risk: thin spot volumes may amplify volatility.
$SOL
20
Crypto Sage — Daily Crypto & Macro Digest
Date: 6 Mar 2026 — last 24 h
1) Market snapshot
Bitcoin (BTC): ~$70.6K–$71K, down ~2–3% in 24 h after failing to sustain a breakout above ~$73K.
Ethereum (ETH): ~$2.0K–$2.1K, pulling back slightly after a recent short‑liquidation rally toward ~$2.2K.
Total crypto market cap: ~$2.4T, broadly flat as majors consolidate.
Notable movers
SOL and select altcoins rising modestly with ETF‑related speculation and institutional diversification signals.
2) Top headlines
CoinDesk: Bitcoin targets $74K resistance while the U.S. dollar strengthens.
Takeaway: Crypto momentum is returning, but dollar strength caps upside.
Reuters / market coverage: BTC trading near $71K amid geopolitical tension and rate‑cut uncertainty.
Takeaway: Macro risk and policy expectations continue to dominate price direction.
Altcoin ETF trend: Institutional flows expanding beyond BTC into SOL and XRP exposure.
Takeaway: Institutional diversification into altcoins may broaden crypto market liquidity.
3) DeFi / On‑chain highlights
ETF flows: BTC ETFs recorded $228M net outflows, but weekly flows remain positive.
Cross‑asset ETF demand: U.S. funds added ~5,187 BTC and ~$9M ETH exposure in recent inflow sessions.
Derivatives: Short liquidations accelerated ETH’s move above $2K earlier in the week.
5) Macro context
Rates: global markets watching U.S. policy signals and potential rate‑cut timing.
Dollar (DXY): strength in the dollar is emerging as a headwind for crypto risk assets.
Geopolitics: Middle East tensions and oil volatility are influencing broader risk sentiment.
Equities: crypto continues trading with high correlation to equity‑market liquidity cycles.
Crypto intersection: institutional ETF flows and macro liquidity remain the dominant drivers of short‑term crypto price action.
Risk notes
Macro risk: stronger dollar or delayed rate cuts could pressure risk assets.
Liquidity risk: ETF flow reversals remain the largest short‑term volatility trigger.
$SOL
{spot}(SOLUSDT)
Crypto Sage — Daily Crypto & Macro Digest
Date: 6 Mar 2026 — last 24 h
1) Market snapshot
Bitcoin (BTC): ~$70.6K–$71K, down ~2–3% in 24 h after failing to sustain a breakout above ~$73K.
Ethereum (ETH): ~$2.0K–$2.1K, pulling back slightly after a recent short‑liquidation rally toward ~$2.2K.
Total crypto market cap: ~$2.4T, broadly flat as majors consolidate.
Notable movers
SOL and select altcoins rising modestly with ETF‑related speculation and institutional diversification signals.
2) Top headlines
CoinDesk: Bitcoin targets $74K resistance while the U.S. dollar strengthens.
Takeaway: Crypto momentum is returning, but dollar strength caps upside.
Reuters / market coverage: BTC trading near $71K amid geopolitical tension and rate‑cut uncertainty.
Takeaway: Macro risk and policy expectations continue to dominate price direction.
Altcoin ETF trend: Institutional flows expanding beyond BTC into SOL and XRP exposure.
Takeaway: Institutional diversification into altcoins may broaden crypto market liquidity.
3) DeFi / On‑chain highlights
ETF flows: BTC ETFs recorded $228M net outflows, but weekly flows remain positive.
Cross‑asset ETF demand: U.S. funds added ~5,187 BTC and ~$9M ETH exposure in recent inflow sessions.
Derivatives: Short liquidations accelerated ETH’s move above $2K earlier in the week.
5) Macro context
Rates: global markets watching U.S. policy signals and potential rate‑cut timing.
Dollar (DXY): strength in the dollar is emerging as a headwind for crypto risk assets.
Geopolitics: Middle East tensions and oil volatility are influencing broader risk sentiment.
Equities: crypto continues trading with high correlation to equity‑market liquidity cycles.
Crypto intersection: institutional ETF flows and macro liquidity remain the dominant drivers of short‑term crypto price action.
Risk notes
Macro risk: stronger dollar or delayed rate cuts could pressure risk assets.
Liquidity risk: ETF flow reversals remain the largest short‑term volatility trigger.
$SOL
Date: 6 Mar 2026 — last 24 h
1) Market snapshot
Bitcoin (BTC): ~$70.6K–$71K, down ~2–3% in 24 h after failing to sustain a breakout above ~$73K.
Ethereum (ETH): ~$2.0K–$2.1K, pulling back slightly after a recent short‑liquidation rally toward ~$2.2K.
Total crypto market cap: ~$2.4T, broadly flat as majors consolidate.
Notable movers
SOL and select altcoins rising modestly with ETF‑related speculation and institutional diversification signals.
2) Top headlines
CoinDesk: Bitcoin targets $74K resistance while the U.S. dollar strengthens.
Takeaway: Crypto momentum is returning, but dollar strength caps upside.
Reuters / market coverage: BTC trading near $71K amid geopolitical tension and rate‑cut uncertainty.
Takeaway: Macro risk and policy expectations continue to dominate price direction.
Altcoin ETF trend: Institutional flows expanding beyond BTC into SOL and XRP exposure.
Takeaway: Institutional diversification into altcoins may broaden crypto market liquidity.
3) DeFi / On‑chain highlights
ETF flows: BTC ETFs recorded $228M net outflows, but weekly flows remain positive.
Cross‑asset ETF demand: U.S. funds added ~5,187 BTC and ~$9M ETH exposure in recent inflow sessions.
Derivatives: Short liquidations accelerated ETH’s move above $2K earlier in the week.
5) Macro context
Rates: global markets watching U.S. policy signals and potential rate‑cut timing.
Dollar (DXY): strength in the dollar is emerging as a headwind for crypto risk assets.
Geopolitics: Middle East tensions and oil volatility are influencing broader risk sentiment.
Equities: crypto continues trading with high correlation to equity‑market liquidity cycles.
Crypto intersection: institutional ETF flows and macro liquidity remain the dominant drivers of short‑term crypto price action.
Risk notes
Macro risk: stronger dollar or delayed rate cuts could pressure risk assets.
Liquidity risk: ETF flow reversals remain the largest short‑term volatility trigger.
$SOL
19
·
--
Жоғары (өспелі)
Crypto Sage – Daily News Reel (March 5, 2026)
In moments of uncertainty, watch where capital quietly gathers.
🪙 1️⃣ Bitcoin Rallies Toward $74K as Institutional Flows Return
On March 4–5, 2026, Bitcoin climbed above $73,000, reaching a one‑month high as investors rotated back into crypto during broader market volatility. Analysts linked the move to renewed institutional positioning and strong inflows into U.S. spot Bitcoin ETFs.
Why it matters: Bitcoin’s market structure is increasingly shaped by institutional capital flows rather than retail momentum.
⚡ 2️⃣ Spot Bitcoin ETFs Pull Over $1.4 Billion in Five Days
Data reported on March 4, 2026 shows more than $1.4 billion entering U.S. spot Bitcoin ETFs within five trading days. Major funds led by BlackRock and Fidelity drove the inflows even as price consolidation continued.
Why it matters: Persistent inflows signal long‑term allocation strategies, suggesting institutions are accumulating during volatility.
🌐 3️⃣ U.S. Crypto Policy Debate Intensifies Around Market Structure Bill
Political momentum increased this week as U.S. leaders renewed support for legislation designed to clarify whether digital assets fall under securities or commodities regulation. The debate also highlights tensions between banks and crypto firms over stablecoin yield models.
Why it matters: Regulatory clarity will shape how capital, custody, and stablecoin infrastructure evolve across global markets.
💭 Price moves quickly—but capital allocation, regulation, and infrastructure reveal the deeper direction of the market. Follow Crypto Sage for the signal behind the noise.
$BTC
{spot}(BTCUSDT)
Crypto Sage – Daily News Reel (March 5, 2026)
In moments of uncertainty, watch where capital quietly gathers.
🪙 1️⃣ Bitcoin Rallies Toward $74K as Institutional Flows Return
On March 4–5, 2026, Bitcoin climbed above $73,000, reaching a one‑month high as investors rotated back into crypto during broader market volatility. Analysts linked the move to renewed institutional positioning and strong inflows into U.S. spot Bitcoin ETFs.
Why it matters: Bitcoin’s market structure is increasingly shaped by institutional capital flows rather than retail momentum.
⚡ 2️⃣ Spot Bitcoin ETFs Pull Over $1.4 Billion in Five Days
Data reported on March 4, 2026 shows more than $1.4 billion entering U.S. spot Bitcoin ETFs within five trading days. Major funds led by BlackRock and Fidelity drove the inflows even as price consolidation continued.
Why it matters: Persistent inflows signal long‑term allocation strategies, suggesting institutions are accumulating during volatility.
🌐 3️⃣ U.S. Crypto Policy Debate Intensifies Around Market Structure Bill
Political momentum increased this week as U.S. leaders renewed support for legislation designed to clarify whether digital assets fall under securities or commodities regulation. The debate also highlights tensions between banks and crypto firms over stablecoin yield models.
Why it matters: Regulatory clarity will shape how capital, custody, and stablecoin infrastructure evolve across global markets.
💭 Price moves quickly—but capital allocation, regulation, and infrastructure reveal the deeper direction of the market. Follow Crypto Sage for the signal behind the noise.
$BTC
In moments of uncertainty, watch where capital quietly gathers.
🪙 1️⃣ Bitcoin Rallies Toward $74K as Institutional Flows Return
On March 4–5, 2026, Bitcoin climbed above $73,000, reaching a one‑month high as investors rotated back into crypto during broader market volatility. Analysts linked the move to renewed institutional positioning and strong inflows into U.S. spot Bitcoin ETFs.
Why it matters: Bitcoin’s market structure is increasingly shaped by institutional capital flows rather than retail momentum.
⚡ 2️⃣ Spot Bitcoin ETFs Pull Over $1.4 Billion in Five Days
Data reported on March 4, 2026 shows more than $1.4 billion entering U.S. spot Bitcoin ETFs within five trading days. Major funds led by BlackRock and Fidelity drove the inflows even as price consolidation continued.
Why it matters: Persistent inflows signal long‑term allocation strategies, suggesting institutions are accumulating during volatility.
🌐 3️⃣ U.S. Crypto Policy Debate Intensifies Around Market Structure Bill
Political momentum increased this week as U.S. leaders renewed support for legislation designed to clarify whether digital assets fall under securities or commodities regulation. The debate also highlights tensions between banks and crypto firms over stablecoin yield models.
Why it matters: Regulatory clarity will shape how capital, custody, and stablecoin infrastructure evolve across global markets.
💭 Price moves quickly—but capital allocation, regulation, and infrastructure reveal the deeper direction of the market. Follow Crypto Sage for the signal behind the noise.
$BTC
1
36
Daily Crypto & Macro Digest
Date: 4 Mar 2026
1) Market snapshot
Bitcoin (BTC): trading roughly $66K–$71K range, rebounding strongly in the last 24 h with a ~6% move higher.
Ethereum (ETH): near $1,950–$2,000, modest recovery after recent macro-driven drawdowns.
Total crypto market cap: ~$2.9T–$3.0T, still below recent peaks as institutional flows remain mixed.
Notable movers:
Select altcoins outperform while majors consolidate; pockets of strength appear during BTC’s rebound.
Volatility remains elevated following February’s broader crypto correction.
2) Top headlines
CoinDesk: Bitcoin jumps above $71K, leading a broader crypto rally after weeks of consolidation.
Takeaway: Market momentum returning but still fragile after February sell-off.
Reuters: Crypto.com receives conditional approval for a U.S. national trust bank charter.
Takeaway: Major step toward deeper integration of crypto custody within regulated U.S. finance.
Barron’s: Bitcoin volatility tied to geopolitical tensions; crypto still behaves more like a risk asset than a safe haven.
Takeaway: Macro and geopolitics continue to dominate crypto price action.
Bloomberg commentary: Crypto ETFs remain a key liquidity driver, with investor sentiment fluctuating alongside ETF flows.
Takeaway: ETF flows remain the strongest institutional signal in the market.
3) DeFi / On-chain highlights
Funding rates and derivatives positioning remain relatively neutral after recent liquidations.
Staking yields for ETH ecosystem hover around ~3%, slightly higher than prior sessions.
No major protocol exploits reported in the last 24 h.
DeFi TVL stabilizing after February’s broader crypto drawdown.
4) Regulatory & institutional developments
U.S. regulatory progress: Conditional bank charter approval for a major crypto platform signals increasing institutional infrastructure.
Institutional adoption continues via crypto ETFs, which now represent a significant share of institutional crypto exposure.
Daily Crypto & Macro Digest
Date: 4 Mar 2026
1) Market snapshot
Bitcoin (BTC): trading roughly $66K–$71K range, rebounding strongly in the last 24 h with a ~6% move higher.
Ethereum (ETH): near $1,950–$2,000, modest recovery after recent macro-driven drawdowns.
Total crypto market cap: ~$2.9T–$3.0T, still below recent peaks as institutional flows remain mixed.
Notable movers:
Select altcoins outperform while majors consolidate; pockets of strength appear during BTC’s rebound.
Volatility remains elevated following February’s broader crypto correction.
2) Top headlines
CoinDesk: Bitcoin jumps above $71K, leading a broader crypto rally after weeks of consolidation.
Takeaway: Market momentum returning but still fragile after February sell-off.
Reuters: Crypto.com receives conditional approval for a U.S. national trust bank charter.
Takeaway: Major step toward deeper integration of crypto custody within regulated U.S. finance.
Barron’s: Bitcoin volatility tied to geopolitical tensions; crypto still behaves more like a risk asset than a safe haven.
Takeaway: Macro and geopolitics continue to dominate crypto price action.
Bloomberg commentary: Crypto ETFs remain a key liquidity driver, with investor sentiment fluctuating alongside ETF flows.
Takeaway: ETF flows remain the strongest institutional signal in the market.
3) DeFi / On-chain highlights
Funding rates and derivatives positioning remain relatively neutral after recent liquidations.
Staking yields for ETH ecosystem hover around ~3%, slightly higher than prior sessions.
No major protocol exploits reported in the last 24 h.
DeFi TVL stabilizing after February’s broader crypto drawdown.
4) Regulatory & institutional developments
U.S. regulatory progress: Conditional bank charter approval for a major crypto platform signals increasing institutional infrastructure.
Institutional adoption continues via crypto ETFs, which now represent a significant share of institutional crypto exposure.
Date: 4 Mar 2026
1) Market snapshot
Bitcoin (BTC): trading roughly $66K–$71K range, rebounding strongly in the last 24 h with a ~6% move higher.
Ethereum (ETH): near $1,950–$2,000, modest recovery after recent macro-driven drawdowns.
Total crypto market cap: ~$2.9T–$3.0T, still below recent peaks as institutional flows remain mixed.
Notable movers:
Select altcoins outperform while majors consolidate; pockets of strength appear during BTC’s rebound.
Volatility remains elevated following February’s broader crypto correction.
2) Top headlines
CoinDesk: Bitcoin jumps above $71K, leading a broader crypto rally after weeks of consolidation.
Takeaway: Market momentum returning but still fragile after February sell-off.
Reuters: Crypto.com receives conditional approval for a U.S. national trust bank charter.
Takeaway: Major step toward deeper integration of crypto custody within regulated U.S. finance.
Barron’s: Bitcoin volatility tied to geopolitical tensions; crypto still behaves more like a risk asset than a safe haven.
Takeaway: Macro and geopolitics continue to dominate crypto price action.
Bloomberg commentary: Crypto ETFs remain a key liquidity driver, with investor sentiment fluctuating alongside ETF flows.
Takeaway: ETF flows remain the strongest institutional signal in the market.
3) DeFi / On-chain highlights
Funding rates and derivatives positioning remain relatively neutral after recent liquidations.
Staking yields for ETH ecosystem hover around ~3%, slightly higher than prior sessions.
No major protocol exploits reported in the last 24 h.
DeFi TVL stabilizing after February’s broader crypto drawdown.
4) Regulatory & institutional developments
U.S. regulatory progress: Conditional bank charter approval for a major crypto platform signals increasing institutional infrastructure.
Institutional adoption continues via crypto ETFs, which now represent a significant share of institutional crypto exposure.
2
21
#CryptoSage #CryptoMarket #Bitcoin #RiskManagement #CryptoMindset
#CryptoSage #CryptoMarket #Bitcoin #RiskManagement #CryptoMindset
2
297
#2025withBinance Comienza tu historia de criptomonedas con el Resumen del Año en @Binance y comparte tus mejores momentos! #2025withBinance.
👉 Regístrate con mi enlace y recibe 100 USD en recompensas! https://www.binance.com/year-in-review/2025-with-binance?ref=146567545
#2025withBinance Comienza tu historia de criptomonedas con el Resumen del Año en @Binance y comparte tus mejores momentos! #2025withBinance.
👉 Regístrate con mi enlace y recibe 100 USD en recompensas! https://www.binance.com/year-in-review/2025-with-binance?ref=146567545
👉 Regístrate con mi enlace y recibe 100 USD en recompensas! https://www.binance.com/year-in-review/2025-with-binance?ref=146567545
43
Bitcoin hovers near $105K as traders eye a possible death cross. IOSCO warns that tokenization could reshape investor risk, and Brazil sets tough new crypto capital rules. Momentum meets regulation in today’s digital markets.
$BTC Stay ahead with clear insight from Crypto Sage — your calm voice in crypto chaos.
#CryptoNews #Bitcoin #Ethereum #Tokenization
Bitcoin hovers near $105K as traders eye a possible death cross. IOSCO warns that tokenization could reshape investor risk, and Brazil sets tough new crypto capital rules. Momentum meets regulation in today’s digital markets.
$BTC Stay ahead with clear insight from Crypto Sage — your calm voice in crypto chaos.
#CryptoNews #Bitcoin #Ethereum #Tokenization
$BTC Stay ahead with clear insight from Crypto Sage — your calm voice in crypto chaos.
#CryptoNews #Bitcoin #Ethereum #Tokenization
1
305

Мақала
XRP Whales Are Draining the Exchanges — But Price Still SleepsReading time: ~4 min
1. Why this matters now
In the last 48 hours, on-chain reports showed that large XRP holders (10M–100M XRP) added roughly $560 million in XRP, even as prices moved mostly sideways. At the same time, Binance’s XRP balance fell to ≈2.74 billion XRP, described as a 12-month low in multiple market updates published between Oct. 29–31, 2025. That matches your own historical file, where the latest daily close is $2.5520 with an intraday high at $2.6630 and volume above 5.0B — a classic heavy-liquidity, low-volatility day. In other words: whales are buying, exchanges are lighter, price hasn’t reacted yet.
What this means for you: we have a real accumulation signal, not a YouTube-only narrative.
2. Analysis — Forecasting Checklist (A–G)
A) Technical
Spot levels from your data (Oct. 31, 2025):
Close: $2.55Day high: $2.66Day low: $2.54Volume: ~5.09B (healthy for a flat candle)
This candle sits inside the wider range we saw in the market feeds this week ($2.40–$2.70), so our earlier range is still valid.
Indicators to confirm:
1. Price has repeatedly defended the $2.30–$2.40 demand zone since mid-October (volume rises on dips).
2. RSI on the daily is flat/mid, not overbought — consistent with accumulation, not distribution.
Because the freshest number we have is $2.55 from your sheet and $2.40–$2.70 from the news, we anchor all scenario levels to that band.
What this means for you: treat $2.30 as tactical support and $2.70–$2.80 as the ceiling that must break.
B) Fundamentals
XRP is still the settlement token around Ripple’s newly finalized institutional stack (Ripple Prime / formerly Hidden Road), reported this week. That is fresh, not historical.
Monthly escrow unlocks remain a background source of supply, but the fact that exchange float is falling at the same time makes those unlocks less threatening in the short term.
ETF anticipation (Canary S-1 without the delay clause) adds a regulated demand pipe for mid-November.
What this means for you: fundamentals actually improved this week — that’s rare in a flat chart.
C) On-Chain
Multiple sources in the last 48h confirm Binance XRP reserves ≈2.74B — we keep that exact figure.
Multiple sources in the last 48h republished Santiment’s “$560M in 7 days” for large wallets — we keep it, and we attribute it.
Some creators stitched this into “2.6B XRP gone from all exchanges in 48h.” We downgrade that to: “other major exchanges also showed concurrent outflows, but totals vary by provider,” because we don’t have a written newsroom source with that exact sum in ≤48h.
NVT stays healthy because volume (your file shows ~5B) is still high for a consolidating asset.
What this means for you: the supply-compression story is confirmed by both public news and your private dataset.
D) Macro
Altcoin environment is still weak; several Oct. 30–31 market notes called this “one of the least convincing alt periods of 2025.”
That means XRP is moving on idiosyncratic drivers (whales + ETF calendar), not on a broad risk-on wave.
What this means for you: don’t expect SOL/AVAX/BSC rotation to carry XRP — XRP has to clear its own levels.
E) Sentiment
Funding and social dominance are not overheated — good.
The crowd is still talking about “manipulación” and “market makers cleaning longs,” which tells us: retail is fearful exactly while whales are adding. That divergence is load-bearing.
What this means for you: low hype → better RR.
F) Scenario Weighting
Base (~60%): XRP stays in $2.40–$2.80 into the ETF window; exchange balances keep declining or stay flat.
Bull (~25%): Nasdaq clears the listing, Binance reserves push under 2.6B, and we break $2.80 → run to $3.20–$3.50.
Bear (~15%): ETF is slowed or we see rising exchange reserves → loss of $2.30 and revisit of $2.05–$2.20.
What this means for you: your “if-this-then-that” signals are (1) ETF calendar, (2) Binance reserves, (3) $2.30 support.
G) Cycle Awareness
MVRV / “we’re at the top” signals are not flashing; we’re earlier in the markup ladder.
That aligns with our data: price flat, volume alive, supply leaving exchanges.
What this means for you: we are closer to foundation than to euphoria.
3. Market Context
Solana just got a spot + staking ETF and absorbed a lot of attention. XRP is trying to open its regulated channel roughly two weeks later — that sequencing matters.
Difference: SOL is selling “throughput + DeFi,” XRP is selling “payments + institutional rails.” That’s why XRP whales are OK doing this quietly.
Community channels (X, Binance Square) are still not in full-blast XRP mode — good for whales, good for anyone who wants to front-run the attention wave.
What this means for you: XRP is the stealth, institution-tilted trade right now.
4. Forecast / Scenarios (with explicit levels)
Bull (~25%)
Trigger: Canary XRP spot ETF effectively goes live around November 13, 2025 (America/Bogotá) and CEX reserves keep falling.
Path: break $2.80 → sprint to $3.20–$3.50.
Invalidation: ETF date slips or Binance XRP balance rises back above ~2.9B for several sessions.
{spot}(XRPUSDT)
Base (~60%)
Trigger: ETF stays on track but first-day flows are modest; whales continue to drain exchanges.
Path: drift inside $2.40–$2.80; daily candles like the one in your sheet ($2.55 close, 5B vol) keep printing.
Invalidation: daily close below $2.30 with flat or rising exchange balances.
Bear (~15%)
Trigger: macro risk-off / SEC questions / sudden supply from escrow while demand is still muted.
Path: dip to $2.05–$2.20 to unlock liquidity; range rebuild after.
Invalidation: surprise, high ETF inflow on/after Nov. 13 that absorbs supply.
What this means for you: your operative range is $2.30–$2.80; above $2.80, aim higher; below $2.30, protect capital.
5. Conclusion / Takeaway
As of October 31, 2025 (America), we have three signals aligned in ≤48h data:
1. Whales added ≈$560M in XRP (Santiment-based reports, Oct. 30–31).
2. Binance XRP reserves fell to ≈2.74B (Oct. 29–31).
3. Your own daily candle closed at $2.55 on heavy volume — proof that price has not yet fully repriced the on-chain tightening.
When information moves and price doesn’t, it’s almost always accumulation.
What this means for you: watch Nov. 13, 2025, $2.30, $2.80, and Binance’s XRP balance — those four tell you if the whales were right.
Disclaimer
This material is for educational purposes only and reflects market data available up to October 31, 2025 (America). It is not financial, investment, tax, or legal advice. Cryptoassets are volatile and you can lose capital. Always do your own research and manage risk.
#XRPWhales
#CryptoAccumulation
#SpotXRPETF
#FinancialFreedomCrypto
XRP Whales Are Draining the Exchanges — But Price Still Sleeps
Reading time: ~4 min
1. Why this matters now
In the last 48 hours, on-chain reports showed that large XRP holders (10M–100M XRP) added roughly $560 million in XRP, even as prices moved mostly sideways. At the same time, Binance’s XRP balance fell to ≈2.74 billion XRP, described as a 12-month low in multiple market updates published between Oct. 29–31, 2025. That matches your own historical file, where the latest daily close is $2.5520 with an intraday high at $2.6630 and volume above 5.0B — a classic heavy-liquidity, low-volatility day. In other words: whales are buying, exchanges are lighter, price hasn’t reacted yet.
What this means for you: we have a real accumulation signal, not a YouTube-only narrative.
2. Analysis — Forecasting Checklist (A–G)
A) Technical
Spot levels from your data (Oct. 31, 2025):
Close: $2.55Day high: $2.66Day low: $2.54Volume: ~5.09B (healthy for a flat candle)
This candle sits inside the wider range we saw in the market feeds this week ($2.40–$2.70), so our earlier range is still valid.
Indicators to confirm:
1. Price has repeatedly defended the $2.30–$2.40 demand zone since mid-October (volume rises on dips).
2. RSI on the daily is flat/mid, not overbought — consistent with accumulation, not distribution.
Because the freshest number we have is $2.55 from your sheet and $2.40–$2.70 from the news, we anchor all scenario levels to that band.
What this means for you: treat $2.30 as tactical support and $2.70–$2.80 as the ceiling that must break.
B) Fundamentals
XRP is still the settlement token around Ripple’s newly finalized institutional stack (Ripple Prime / formerly Hidden Road), reported this week. That is fresh, not historical.
Monthly escrow unlocks remain a background source of supply, but the fact that exchange float is falling at the same time makes those unlocks less threatening in the short term.
ETF anticipation (Canary S-1 without the delay clause) adds a regulated demand pipe for mid-November.
What this means for you: fundamentals actually improved this week — that’s rare in a flat chart.
C) On-Chain
Multiple sources in the last 48h confirm Binance XRP reserves ≈2.74B — we keep that exact figure.
Multiple sources in the last 48h republished Santiment’s “$560M in 7 days” for large wallets — we keep it, and we attribute it.
Some creators stitched this into “2.6B XRP gone from all exchanges in 48h.” We downgrade that to: “other major exchanges also showed concurrent outflows, but totals vary by provider,” because we don’t have a written newsroom source with that exact sum in ≤48h.
NVT stays healthy because volume (your file shows ~5B) is still high for a consolidating asset.
What this means for you: the supply-compression story is confirmed by both public news and your private dataset.
D) Macro
Altcoin environment is still weak; several Oct. 30–31 market notes called this “one of the least convincing alt periods of 2025.”
That means XRP is moving on idiosyncratic drivers (whales + ETF calendar), not on a broad risk-on wave.
What this means for you: don’t expect SOL/AVAX/BSC rotation to carry XRP — XRP has to clear its own levels.
E) Sentiment
Funding and social dominance are not overheated — good.
The crowd is still talking about “manipulación” and “market makers cleaning longs,” which tells us: retail is fearful exactly while whales are adding. That divergence is load-bearing.
What this means for you: low hype → better RR.
F) Scenario Weighting
Base (~60%): XRP stays in $2.40–$2.80 into the ETF window; exchange balances keep declining or stay flat.
Bull (~25%): Nasdaq clears the listing, Binance reserves push under 2.6B, and we break $2.80 → run to $3.20–$3.50.
Bear (~15%): ETF is slowed or we see rising exchange reserves → loss of $2.30 and revisit of $2.05–$2.20.
What this means for you: your “if-this-then-that” signals are (1) ETF calendar, (2) Binance reserves, (3) $2.30 support.
G) Cycle Awareness
MVRV / “we’re at the top” signals are not flashing; we’re earlier in the markup ladder.
That aligns with our data: price flat, volume alive, supply leaving exchanges.
What this means for you: we are closer to foundation than to euphoria.
3. Market Context
Solana just got a spot + staking ETF and absorbed a lot of attention. XRP is trying to open its regulated channel roughly two weeks later — that sequencing matters.
Difference: SOL is selling “throughput + DeFi,” XRP is selling “payments + institutional rails.” That’s why XRP whales are OK doing this quietly.
Community channels (X, Binance Square) are still not in full-blast XRP mode — good for whales, good for anyone who wants to front-run the attention wave.
What this means for you: XRP is the stealth, institution-tilted trade right now.
4. Forecast / Scenarios (with explicit levels)
Bull (~25%)
Trigger: Canary XRP spot ETF effectively goes live around November 13, 2025 (America/Bogotá) and CEX reserves keep falling.
Path: break $2.80 → sprint to $3.20–$3.50.
Invalidation: ETF date slips or Binance XRP balance rises back above ~2.9B for several sessions.
Base (~60%)
Trigger: ETF stays on track but first-day flows are modest; whales continue to drain exchanges.
Path: drift inside $2.40–$2.80; daily candles like the one in your sheet ($2.55 close, 5B vol) keep printing.
Invalidation: daily close below $2.30 with flat or rising exchange balances.
Bear (~15%)
Trigger: macro risk-off / SEC questions / sudden supply from escrow while demand is still muted.
Path: dip to $2.05–$2.20 to unlock liquidity; range rebuild after.
Invalidation: surprise, high ETF inflow on/after Nov. 13 that absorbs supply.
What this means for you: your operative range is $2.30–$2.80; above $2.80, aim higher; below $2.30, protect capital.
5. Conclusion / Takeaway
As of October 31, 2025 (America), we have three signals aligned in ≤48h data:
1. Whales added ≈$560M in XRP (Santiment-based reports, Oct. 30–31).
2. Binance XRP reserves fell to ≈2.74B (Oct. 29–31).
3. Your own daily candle closed at $2.55 on heavy volume — proof that price has not yet fully repriced the on-chain tightening.
When information moves and price doesn’t, it’s almost always accumulation.
What this means for you: watch Nov. 13, 2025, $2.30, $2.80, and Binance’s XRP balance — those four tell you if the whales were right.
Disclaimer
This material is for educational purposes only and reflects market data available up to October 31, 2025 (America). It is not financial, investment, tax, or legal advice. Cryptoassets are volatile and you can lose capital. Always do your own research and manage risk.
#XRPWhales
#CryptoAccumulation
#SpotXRPETF
#FinancialFreedomCrypto
1. Why this matters now
In the last 48 hours, on-chain reports showed that large XRP holders (10M–100M XRP) added roughly $560 million in XRP, even as prices moved mostly sideways. At the same time, Binance’s XRP balance fell to ≈2.74 billion XRP, described as a 12-month low in multiple market updates published between Oct. 29–31, 2025. That matches your own historical file, where the latest daily close is $2.5520 with an intraday high at $2.6630 and volume above 5.0B — a classic heavy-liquidity, low-volatility day. In other words: whales are buying, exchanges are lighter, price hasn’t reacted yet.
What this means for you: we have a real accumulation signal, not a YouTube-only narrative.
2. Analysis — Forecasting Checklist (A–G)
A) Technical
Spot levels from your data (Oct. 31, 2025):
Close: $2.55Day high: $2.66Day low: $2.54Volume: ~5.09B (healthy for a flat candle)
This candle sits inside the wider range we saw in the market feeds this week ($2.40–$2.70), so our earlier range is still valid.
Indicators to confirm:
1. Price has repeatedly defended the $2.30–$2.40 demand zone since mid-October (volume rises on dips).
2. RSI on the daily is flat/mid, not overbought — consistent with accumulation, not distribution.
Because the freshest number we have is $2.55 from your sheet and $2.40–$2.70 from the news, we anchor all scenario levels to that band.
What this means for you: treat $2.30 as tactical support and $2.70–$2.80 as the ceiling that must break.
B) Fundamentals
XRP is still the settlement token around Ripple’s newly finalized institutional stack (Ripple Prime / formerly Hidden Road), reported this week. That is fresh, not historical.
Monthly escrow unlocks remain a background source of supply, but the fact that exchange float is falling at the same time makes those unlocks less threatening in the short term.
ETF anticipation (Canary S-1 without the delay clause) adds a regulated demand pipe for mid-November.
What this means for you: fundamentals actually improved this week — that’s rare in a flat chart.
C) On-Chain
Multiple sources in the last 48h confirm Binance XRP reserves ≈2.74B — we keep that exact figure.
Multiple sources in the last 48h republished Santiment’s “$560M in 7 days” for large wallets — we keep it, and we attribute it.
Some creators stitched this into “2.6B XRP gone from all exchanges in 48h.” We downgrade that to: “other major exchanges also showed concurrent outflows, but totals vary by provider,” because we don’t have a written newsroom source with that exact sum in ≤48h.
NVT stays healthy because volume (your file shows ~5B) is still high for a consolidating asset.
What this means for you: the supply-compression story is confirmed by both public news and your private dataset.
D) Macro
Altcoin environment is still weak; several Oct. 30–31 market notes called this “one of the least convincing alt periods of 2025.”
That means XRP is moving on idiosyncratic drivers (whales + ETF calendar), not on a broad risk-on wave.
What this means for you: don’t expect SOL/AVAX/BSC rotation to carry XRP — XRP has to clear its own levels.
E) Sentiment
Funding and social dominance are not overheated — good.
The crowd is still talking about “manipulación” and “market makers cleaning longs,” which tells us: retail is fearful exactly while whales are adding. That divergence is load-bearing.
What this means for you: low hype → better RR.
F) Scenario Weighting
Base (~60%): XRP stays in $2.40–$2.80 into the ETF window; exchange balances keep declining or stay flat.
Bull (~25%): Nasdaq clears the listing, Binance reserves push under 2.6B, and we break $2.80 → run to $3.20–$3.50.
Bear (~15%): ETF is slowed or we see rising exchange reserves → loss of $2.30 and revisit of $2.05–$2.20.
What this means for you: your “if-this-then-that” signals are (1) ETF calendar, (2) Binance reserves, (3) $2.30 support.
G) Cycle Awareness
MVRV / “we’re at the top” signals are not flashing; we’re earlier in the markup ladder.
That aligns with our data: price flat, volume alive, supply leaving exchanges.
What this means for you: we are closer to foundation than to euphoria.
3. Market Context
Solana just got a spot + staking ETF and absorbed a lot of attention. XRP is trying to open its regulated channel roughly two weeks later — that sequencing matters.
Difference: SOL is selling “throughput + DeFi,” XRP is selling “payments + institutional rails.” That’s why XRP whales are OK doing this quietly.
Community channels (X, Binance Square) are still not in full-blast XRP mode — good for whales, good for anyone who wants to front-run the attention wave.
What this means for you: XRP is the stealth, institution-tilted trade right now.
4. Forecast / Scenarios (with explicit levels)
Bull (~25%)
Trigger: Canary XRP spot ETF effectively goes live around November 13, 2025 (America/Bogotá) and CEX reserves keep falling.
Path: break $2.80 → sprint to $3.20–$3.50.
Invalidation: ETF date slips or Binance XRP balance rises back above ~2.9B for several sessions.
Base (~60%)
Trigger: ETF stays on track but first-day flows are modest; whales continue to drain exchanges.
Path: drift inside $2.40–$2.80; daily candles like the one in your sheet ($2.55 close, 5B vol) keep printing.
Invalidation: daily close below $2.30 with flat or rising exchange balances.
Bear (~15%)
Trigger: macro risk-off / SEC questions / sudden supply from escrow while demand is still muted.
Path: dip to $2.05–$2.20 to unlock liquidity; range rebuild after.
Invalidation: surprise, high ETF inflow on/after Nov. 13 that absorbs supply.
What this means for you: your operative range is $2.30–$2.80; above $2.80, aim higher; below $2.30, protect capital.
5. Conclusion / Takeaway
As of October 31, 2025 (America), we have three signals aligned in ≤48h data:
1. Whales added ≈$560M in XRP (Santiment-based reports, Oct. 30–31).
2. Binance XRP reserves fell to ≈2.74B (Oct. 29–31).
3. Your own daily candle closed at $2.55 on heavy volume — proof that price has not yet fully repriced the on-chain tightening.
When information moves and price doesn’t, it’s almost always accumulation.
What this means for you: watch Nov. 13, 2025, $2.30, $2.80, and Binance’s XRP balance — those four tell you if the whales were right.
Disclaimer
This material is for educational purposes only and reflects market data available up to October 31, 2025 (America). It is not financial, investment, tax, or legal advice. Cryptoassets are volatile and you can lose capital. Always do your own research and manage risk.
#XRPWhales
#CryptoAccumulation
#SpotXRPETF
#FinancialFreedomCrypto
52
·
--
Жоғары (өспелі)
🌌 Whales Stir Beneath the Surface — Why CAKE Is Back on Their Radar
🕒 2 min read | By Crypto Sage
While most eyes remain fixed on Bitcoin ETFs, silent tides are moving elsewhere.
On-chain data reveals that crypto whales have begun accumulating CAKE, PancakeSwap’s native DeFi token — quietly reclaiming liquidity from weaker hands.
Why now? Because token burns, reduced emissions, and staking yields have started reshaping CAKE’s tokenomics from inflationary to deflation-ready.
In a world of tightening liquidity, yield-bearing DeFi assets with proven ecosystems are becoming rare—and whales can smell rarity before the crowd does.
CAKE once reached $44.18 USD in April 2021. Today, it trades a fraction of that, yet its fundamentals tell a different story:
• Sustainable burn model
• Cross-chain expansion beyond BNB
• Re-accumulation by long-term wallets
These are not the signals of hype, but of quiet conviction.
What this means for you: If you follow liquidity, not noise, it’s worth watching what the deep pockets are doing next.
✨ Read the full analysis on Binance Square to understand how whales, deflation, and DeFi intersect — and what comes next for CAKE [here](https://app.binance.com/uni-qr/cart/31721151988282?r=Y7BPG98P&l=en&uco=bs1CMpxawTI1lvUGUCSsTQ&uc=app_square_share_link&us=copylink) .
Disclaimer: This post is for educational and informational purposes only. It is not financial advice. Always conduct your own research before making investment decisions.
#Cake #PancakeSwap #CryptoWhales #DEFİ #Yield #BNBChain
🌌 Whales Stir Beneath the Surface — Why CAKE Is Back on Their Radar
🕒 2 min read | By Crypto Sage
While most eyes remain fixed on Bitcoin ETFs, silent tides are moving elsewhere.
On-chain data reveals that crypto whales have begun accumulating CAKE, PancakeSwap’s native DeFi token — quietly reclaiming liquidity from weaker hands.
Why now? Because token burns, reduced emissions, and staking yields have started reshaping CAKE’s tokenomics from inflationary to deflation-ready.
In a world of tightening liquidity, yield-bearing DeFi assets with proven ecosystems are becoming rare—and whales can smell rarity before the crowd does.
CAKE once reached $44.18 USD in April 2021. Today, it trades a fraction of that, yet its fundamentals tell a different story:
• Sustainable burn model
• Cross-chain expansion beyond BNB
• Re-accumulation by long-term wallets
These are not the signals of hype, but of quiet conviction.
What this means for you: If you follow liquidity, not noise, it’s worth watching what the deep pockets are doing next.
✨ Read the full analysis on Binance Square to understand how whales, deflation, and DeFi intersect — and what comes next for CAKE here .
Disclaimer: This post is for educational and informational purposes only. It is not financial advice. Always conduct your own research before making investment decisions.
#Cake #PancakeSwap #CryptoWhales #DEFİ #Yield #BNBChain
🕒 2 min read | By Crypto Sage
While most eyes remain fixed on Bitcoin ETFs, silent tides are moving elsewhere.
On-chain data reveals that crypto whales have begun accumulating CAKE, PancakeSwap’s native DeFi token — quietly reclaiming liquidity from weaker hands.
Why now? Because token burns, reduced emissions, and staking yields have started reshaping CAKE’s tokenomics from inflationary to deflation-ready.
In a world of tightening liquidity, yield-bearing DeFi assets with proven ecosystems are becoming rare—and whales can smell rarity before the crowd does.
CAKE once reached $44.18 USD in April 2021. Today, it trades a fraction of that, yet its fundamentals tell a different story:
• Sustainable burn model
• Cross-chain expansion beyond BNB
• Re-accumulation by long-term wallets
These are not the signals of hype, but of quiet conviction.
What this means for you: If you follow liquidity, not noise, it’s worth watching what the deep pockets are doing next.
✨ Read the full analysis on Binance Square to understand how whales, deflation, and DeFi intersect — and what comes next for CAKE here .
Disclaimer: This post is for educational and informational purposes only. It is not financial advice. Always conduct your own research before making investment decisions.
#Cake #PancakeSwap #CryptoWhales #DEFİ #Yield #BNBChain

34
Көбірек контент көру үшін кіріңіз
Binance Square платформасында әлемдік криптоқоғамдастыққа қосылыңыз
⚡️ Криптовалюта туралы ең соңғы және пайдалы ақпаратты алыңыз.
💬 Әлемдегі ең ірі криптобиржаның сеніміне ие.
👍 Расталған авторлардың нақты пікірлерін табыңыз.
Электрондық пошта/телефон нөмірі
Трендтегі тақырыптар
AnthropicCEOCallsForAISlowdown
0 рет көрілді
11 адам талқылап жатыр
#AnthropicCEOCallsForAISlowdown
🤖 Anthropic CEO Calls for Slower Frontier AI Progress
⚠️ Anthropic CEO Dario Amodei is calling for AI companies to slow the pace of frontier-model capability improvements, arguing that safety systems, oversight, and public institutions need time to catch up.
🛡️ The proposal is not about stopping AI research. It focuses on stronger independent testing, external evaluations, transparency around high-risk capabilities, and coordination on safety standards.
🌐 OpenAI CEO Sam Altman and Elon Musk have also expressed support for pacing frontier AI, although public agreement does not create binding rules.
📊 For crypto, this is mainly an AI policy story, but it could indirectly affect AI-related assets, computing demand, cybersecurity, and autonomous-agent regulation.
👀 Should frontier AI development be slowed until stronger safety systems are in place?
#AI #Anthropic #CryptoNews #TechRegulation
CrypVexa
·0 лайк
·8 рет көрілді
SECReceivesGrayscaleLitecoinTrustETFFiling
103,874 рет көрілді
1,585 адам талқылап жатыр
ClarityActFacesProceduralVoteSept15
227,165 рет көрілді
2,496 адам талқылап жатыр