
Mastering Market Moves with jacob
877 Жариялаулар

Mastering Market Moves with jacob
Хабарлау
Пайдаланушыны блоктау
Sharing deep insights market knowledge news proven trading strategies and indicators
Кездейсоқ трейдер
2.9 жыл
8.2K+ Жазылым
3.3K+ Жазылушылар
1.9K+ лайк басылған
Жазбалар
Барлығы
Баға ұсыныстары
Видеолар
PINNED
🇺🇸 U.S INFLATION IS UP TO 3% LOWER THAN EXPECTED YOU KNOW WHAT HAPPENS NEXT #CPIWatch #Inflation #APRBinanceTGE #MarketRebound
🇺🇸 U.S INFLATION IS UP TO 3% LOWER THAN EXPECTED YOU KNOW WHAT HAPPENS NEXT #CPIWatch #Inflation #APRBinanceTGE #MarketRebound
3
1
48
20.8k
PINNED
SEPTEMBER CPI REPORT INFLASTION LOWER THAN EXPECTED
#Inflation #CPIWatch #MarketRebound #BitcoinETFNetInflows
SEPTEMBER CPI REPORT INFLASTION LOWER THAN EXPECTED
#Inflation #CPIWatch #MarketRebound #BitcoinETFNetInflows
#Inflation #CPIWatch #MarketRebound #BitcoinETFNetInflows
9
3.5k
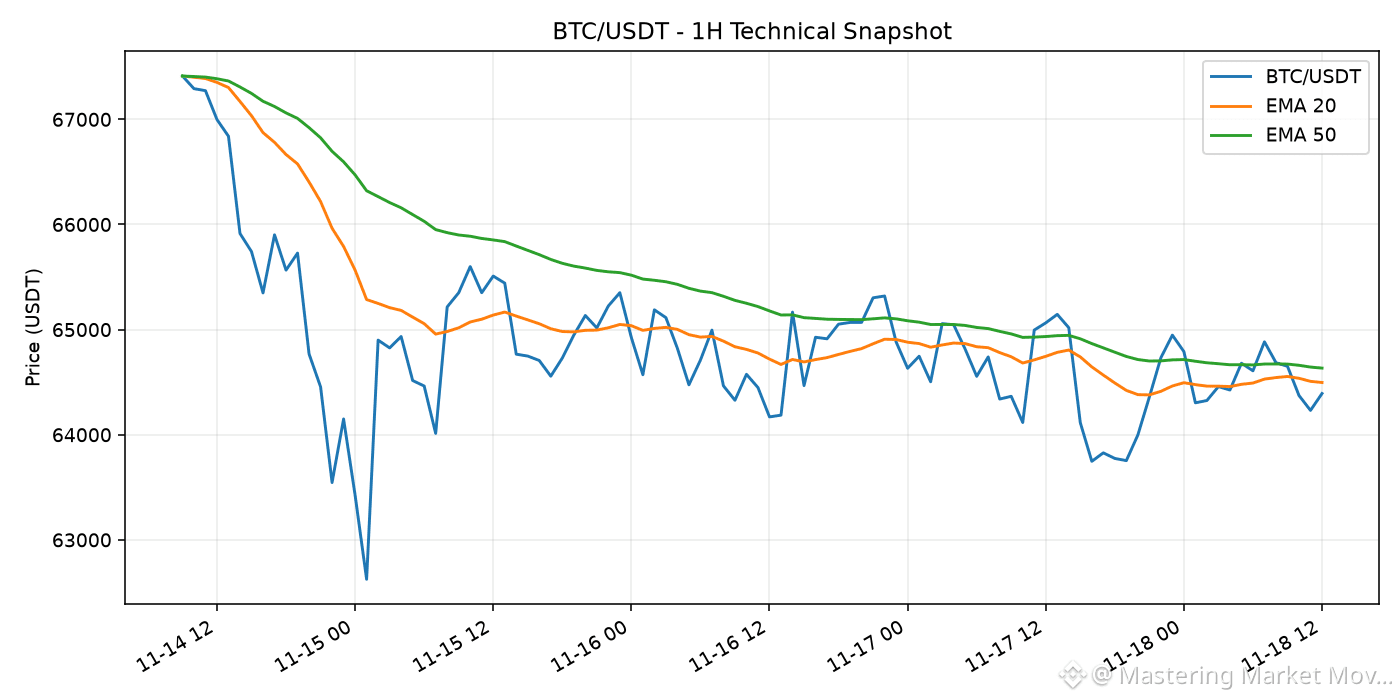
CRYPTO MARKET SNAPSHOT
Data timestamp: 2026-11-18 12:23 UTC. BTC/USDT is $64,392.01 (-0.80% over 24h). Market direction can vary by asset and timeframe, so review liquidity and your own risk limits before making decisions.
Watchlist: $BTC $ETH
#CryptoMarket #Bitcoin #Ethereum
Educational commentary only; not financial advice.
CRYPTO MARKET SNAPSHOT
Data timestamp: 2026-11-18 12:23 UTC. BTC/USDT is $64,392.01 (-0.80% over 24h). Market direction can vary by asset and timeframe, so review liquidity and your own risk limits before making decisions.
Watchlist: $BTC $ETH
#CryptoMarket #Bitcoin #Ethereum
Educational commentary only; not financial advice.
Data timestamp: 2026-11-18 12:23 UTC. BTC/USDT is $64,392.01 (-0.80% over 24h). Market direction can vary by asset and timeframe, so review liquidity and your own risk limits before making decisions.
Watchlist: $BTC $ETH
#CryptoMarket #Bitcoin #Ethereum
Educational commentary only; not financial advice.
59
Crypto News Daily: MIT Brothers Acquitted in $25M MEV Case, Wells Fargo Doubles Bitcoin ETF StakeHere are the key crypto stories:
1. MIT Brothers Cleared in $25 Million Case
• What happened: A U.S. judge acquitted two MIT brothers of fraud charges stemming from a $25 million MEV exploit, noting Ethereum has no terms of use.
• Why it matters: Sets an important legal precedent regarding how code execution and smart contracts are treated under federal fraud laws for $ETH.
• Source: CoinDesk
2. Wells Fargo Surges Bitcoin ETF Holdings
• What happened: Wells Fargo reported a 103% increase in its BlackRock spot Bitcoin ETF holdings, reaching $2.35 billion.
• Why it matters: Demonstrates accelerating institutional adoption and growing exposure to $BTC among top-tier U.S. banking institutions.
• Source: Crypto News
3. Chase Banking Outage Sparks Crypto Dialogue
• What happened: A major software bug temporarily froze access to Chase Bank accounts.
• Why it matters: Draws attention to traditional financial system single-point-of-failure risks relative to decentralized networks.
• Source: Yahoo Finance
#CryptoNews #Bitcoin #Ethereum
Crypto News Daily: MIT Brothers Acquitted in $25M MEV Case, Wells Fargo Doubles Bitcoin ETF Stake
Here are the key crypto stories:
1. MIT Brothers Cleared in $25 Million Case
• What happened: A U.S. judge acquitted two MIT brothers of fraud charges stemming from a $25 million MEV exploit, noting Ethereum has no terms of use.
• Why it matters: Sets an important legal precedent regarding how code execution and smart contracts are treated under federal fraud laws for $ETH .
• Source: CoinDesk
2. Wells Fargo Surges Bitcoin ETF Holdings
• What happened: Wells Fargo reported a 103% increase in its BlackRock spot Bitcoin ETF holdings, reaching $2.35 billion.
• Why it matters: Demonstrates accelerating institutional adoption and growing exposure to $BTC among top-tier U.S. banking institutions.
• Source: Crypto News
3. Chase Banking Outage Sparks Crypto Dialogue
• What happened: A major software bug temporarily froze access to Chase Bank accounts.
• Why it matters: Draws attention to traditional financial system single-point-of-failure risks relative to decentralized networks.
• Source: Yahoo Finance
#CryptoNews #Bitcoin #Ethereum
1. MIT Brothers Cleared in $25 Million Case
• What happened: A U.S. judge acquitted two MIT brothers of fraud charges stemming from a $25 million MEV exploit, noting Ethereum has no terms of use.
• Why it matters: Sets an important legal precedent regarding how code execution and smart contracts are treated under federal fraud laws for $ETH .
• Source: CoinDesk
2. Wells Fargo Surges Bitcoin ETF Holdings
• What happened: Wells Fargo reported a 103% increase in its BlackRock spot Bitcoin ETF holdings, reaching $2.35 billion.
• Why it matters: Demonstrates accelerating institutional adoption and growing exposure to $BTC among top-tier U.S. banking institutions.
• Source: Crypto News
3. Chase Banking Outage Sparks Crypto Dialogue
• What happened: A major software bug temporarily froze access to Chase Bank accounts.
• Why it matters: Draws attention to traditional financial system single-point-of-failure risks relative to decentralized networks.
• Source: Yahoo Finance
#CryptoNews #Bitcoin #Ethereum
96
HIGH-VOLUME ALTCOIN WATCH
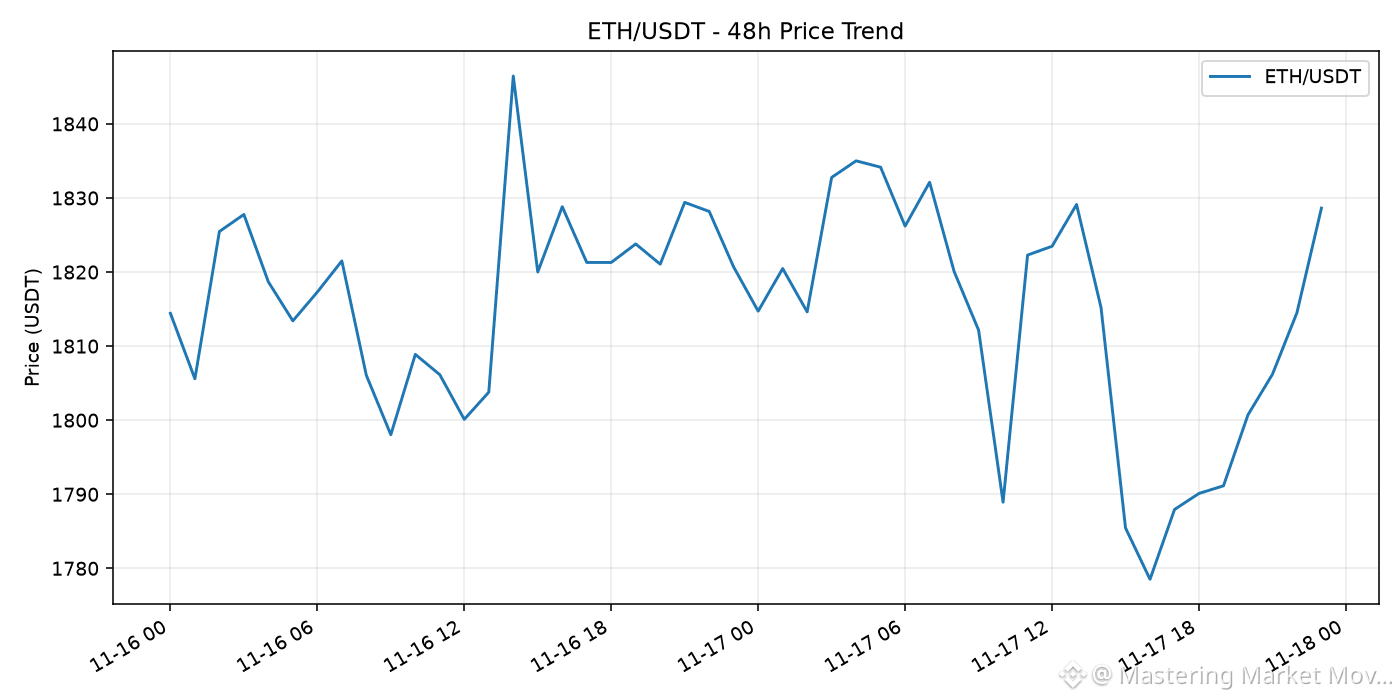
Snapshot: 2026-11-17 23:41 UTC. $ETH/USDT is among the highest-volume eligible USDT spot pairs in this snapshot. Last price: $1,828.63; 24h change: +0.65%; 24h quote volume: $658,044,349.
High volume signals activity, not guaranteed continuation. Check the chart, official announcements and downside scenarios independently.
$ETH #Crypto #Altcoins #MarketAnalysis
Educational commentary only; not financial advice.
HIGH-VOLUME ALTCOIN WATCH
Snapshot: 2026-11-17 23:41 UTC. $ETH /USDT is among the highest-volume eligible USDT spot pairs in this snapshot. Last price: $1,828.63; 24h change: +0.65%; 24h quote volume: $658,044,349.
High volume signals activity, not guaranteed continuation. Check the chart, official announcements and downside scenarios independently.
$ETH #Crypto #Altcoins #MarketAnalysis
Educational commentary only; not financial advice.
Snapshot: 2026-11-17 23:41 UTC. $ETH /USDT is among the highest-volume eligible USDT spot pairs in this snapshot. Last price: $1,828.63; 24h change: +0.65%; 24h quote volume: $658,044,349.
High volume signals activity, not guaranteed continuation. Check the chart, official announcements and downside scenarios independently.
$ETH #Crypto #Altcoins #MarketAnalysis
Educational commentary only; not financial advice.
23
BTC/USDT TECHNICAL CHECK - 1H
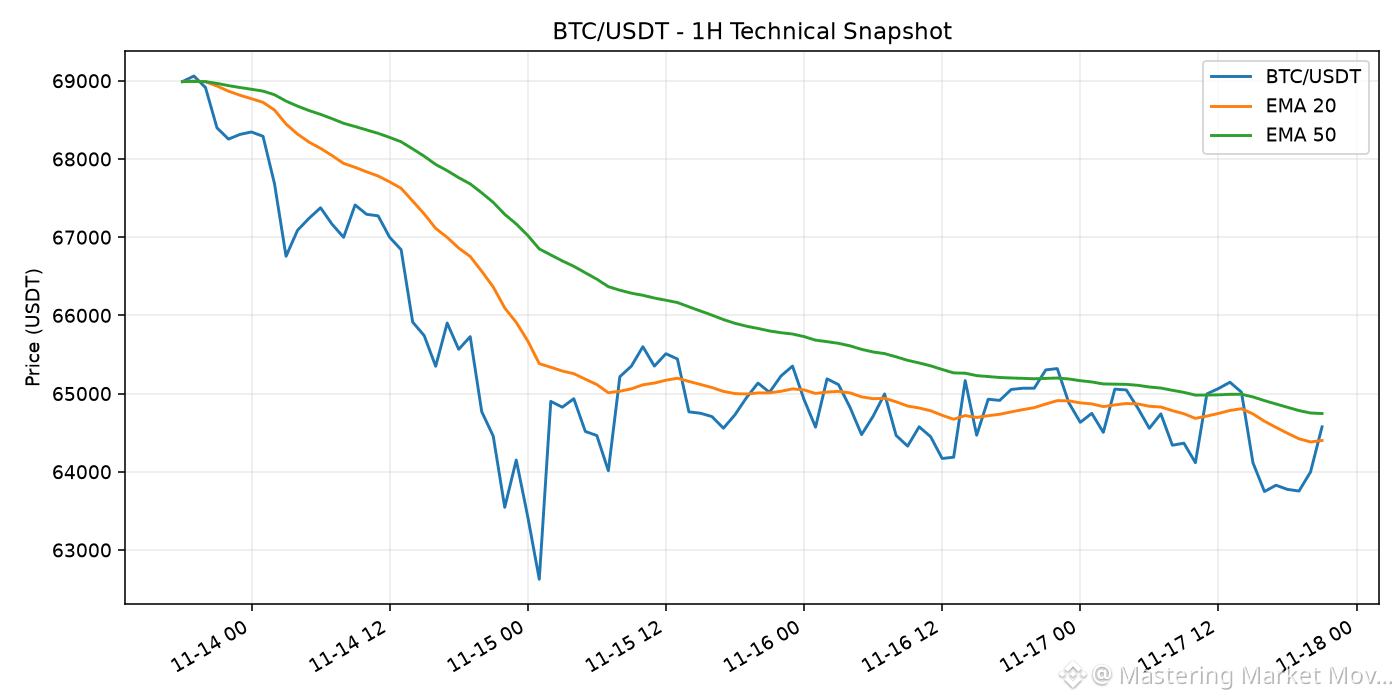
Snapshot: 2026-11-17 21:31 UTC. Latest close: $64,574.00. RSI(14): 48.0. EMA20 is below EMA50 on this snapshot. This is a momentum observation, not a standalone buy or sell signal. RSI can remain elevated or depressed during strong trends; confirm with price structure and risk management.
$BTC #Bitcoin #TechnicalAnalysis
Educational commentary only; not financial advice.
BTC/USDT TECHNICAL CHECK - 1H
Snapshot: 2026-11-17 21:31 UTC. Latest close: $64,574.00. RSI(14): 48.0. EMA20 is below EMA50 on this snapshot. This is a momentum observation, not a standalone buy or sell signal. RSI can remain elevated or depressed during strong trends; confirm with price structure and risk management.
$BTC #Bitcoin #TechnicalAnalysis
Educational commentary only; not financial advice.
Snapshot: 2026-11-17 21:31 UTC. Latest close: $64,574.00. RSI(14): 48.0. EMA20 is below EMA50 on this snapshot. This is a momentum observation, not a standalone buy or sell signal. RSI can remain elevated or depressed during strong trends; confirm with price structure and risk management.
$BTC #Bitcoin #TechnicalAnalysis
Educational commentary only; not financial advice.
52
Мақала
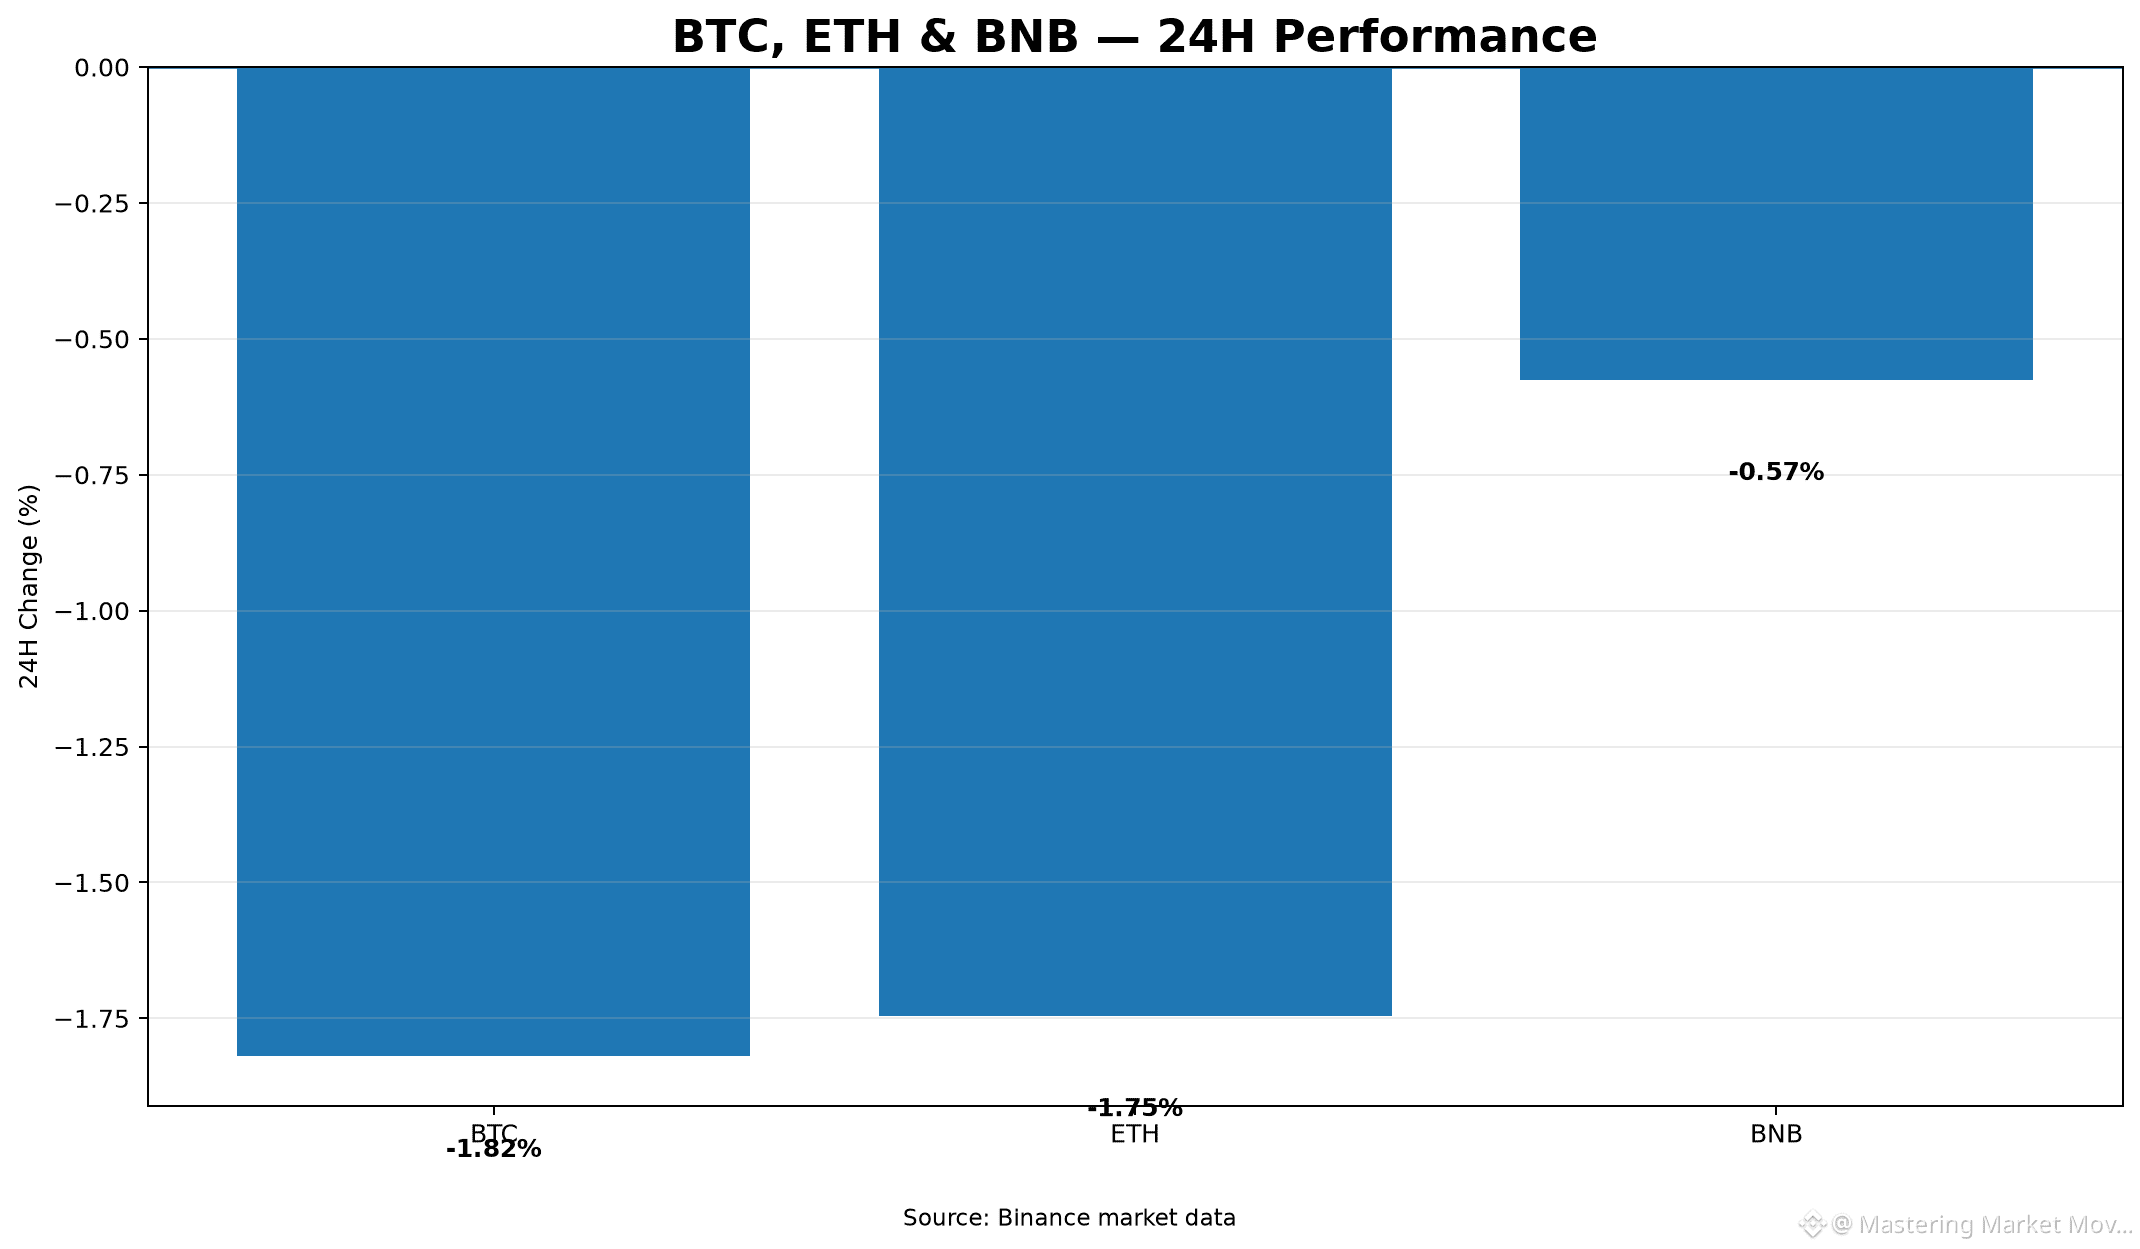
Daily Market Overview: BTC, ETH, and BNB Price AnalysisThe crypto market experienced mild downward pressure over the past 24 hours. $BTC is currently trading at $63,913.26, reflecting a -1.82% decline within a 24-hour range of $63,336.00 to $65,534.94. $ETH dropped -1.745% to $1,793.06, recording a intraday range between $1,751.39 and $1,843.49. Meanwhile, $BNB showed relative strength, easing just -0.575% to $588.30 while oscillating between $580.78 and $595.50.
Volume & Volatility Analysis:
Total 24-hour turnover was led by Bitcoin with $1.84B in quote volume (28,538.60 tokens), followed by Ethereum at $613.53M (339,399.48 tokens), and BNB at $66.13M (111,946.20 tokens). Volatility remains moderate across top assets, with prices testing the lower boundary of their daily high/low channels.
Potential Scenarios:
- Bullish Scenario: Rebounding from current levels and reclaiming intraday highs ($65,534.94 for Bitcoin, $1,843.49 for Ethereum, and $595.50 for BNB) on expanding volume could signal renewed upward momentum.
- Bearish Scenario: A breach below established 24-hour support lows ($63,336.00, $1,751.39, and $580.78) may trigger further consolidation or downside retests.
Risks & What to Watch:
Key risks include elevated short-term volatility and potential sudden liquidity shifts around local support zones. Market participants should monitor volume surges near critical daily low boundaries and observe whether BNB maintains its relative stability during further market testing.
#CryptoAnalysis #MarketUpdate #BinanceSquare
Daily Market Overview: BTC, ETH, and BNB Price Analysis
The crypto market experienced mild downward pressure over the past 24 hours. $BTC is currently trading at $63,913.26, reflecting a -1.82% decline within a 24-hour range of $63,336.00 to $65,534.94. $ETH dropped -1.745% to $1,793.06, recording a intraday range between $1,751.39 and $1,843.49. Meanwhile, $BNB showed relative strength, easing just -0.575% to $588.30 while oscillating between $580.78 and $595.50.
Volume & Volatility Analysis:
Total 24-hour turnover was led by Bitcoin with $1.84B in quote volume (28,538.60 tokens), followed by Ethereum at $613.53M (339,399.48 tokens), and BNB at $66.13M (111,946.20 tokens). Volatility remains moderate across top assets, with prices testing the lower boundary of their daily high/low channels.
Potential Scenarios:
- Bullish Scenario: Rebounding from current levels and reclaiming intraday highs ($65,534.94 for Bitcoin, $1,843.49 for Ethereum, and $595.50 for BNB) on expanding volume could signal renewed upward momentum.
- Bearish Scenario: A breach below established 24-hour support lows ($63,336.00, $1,751.39, and $580.78) may trigger further consolidation or downside retests.
Risks & What to Watch:
Key risks include elevated short-term volatility and potential sudden liquidity shifts around local support zones. Market participants should monitor volume surges near critical daily low boundaries and observe whether BNB maintains its relative stability during further market testing.
#CryptoAnalysis #MarketUpdate #BinanceSquare
Volume & Volatility Analysis:
Total 24-hour turnover was led by Bitcoin with $1.84B in quote volume (28,538.60 tokens), followed by Ethereum at $613.53M (339,399.48 tokens), and BNB at $66.13M (111,946.20 tokens). Volatility remains moderate across top assets, with prices testing the lower boundary of their daily high/low channels.
Potential Scenarios:
- Bullish Scenario: Rebounding from current levels and reclaiming intraday highs ($65,534.94 for Bitcoin, $1,843.49 for Ethereum, and $595.50 for BNB) on expanding volume could signal renewed upward momentum.
- Bearish Scenario: A breach below established 24-hour support lows ($63,336.00, $1,751.39, and $580.78) may trigger further consolidation or downside retests.
Risks & What to Watch:
Key risks include elevated short-term volatility and potential sudden liquidity shifts around local support zones. Market participants should monitor volume surges near critical daily low boundaries and observe whether BNB maintains its relative stability during further market testing.
#CryptoAnalysis #MarketUpdate #BinanceSquare
68
Crypto News Digest: $63M Ether Moved, $25M Acquittal, and Strategy Buys BTC DipHere are today's top crypto headlines:
1. Hackers Transfer $63 Million in Stolen Ether
• What happened: Wallet addresses tied to a historical Binance breach transferred $63 million worth of Ether following DOJ seizures.
• Why it matters: Signals renewed activity in previously dormant illicit funds amidst ongoing regulatory enforcement.
• Source: CoinDesk
2. Judge Acquits Crypto Trading Brothers
• What happened: A judge acquitted two brothers accused of allegedly stealing $25 million through crypto trading.
• Why it matters: Sets a notable legal precedent regarding criminal charges in complex cryptocurrency trading activities.
• Source: Gizmodo
3. Strategy Purchases Bitcoin Decline at $62,000
• What happened: Strategy acquired additional Bitcoin as market prices fell toward the $62,000 level.
• Why it matters: Demonstrates continued institutional accumulation in $BTC despite recent broader market downturns.
• Source: Barron's
$BTC $ETH
#CryptoNews #Bitcoin #Ethereum
Crypto News Digest: $63M Ether Moved, $25M Acquittal, and Strategy Buys BTC Dip
Here are today's top crypto headlines:
1. Hackers Transfer $63 Million in Stolen Ether
• What happened: Wallet addresses tied to a historical Binance breach transferred $63 million worth of Ether following DOJ seizures.
• Why it matters: Signals renewed activity in previously dormant illicit funds amidst ongoing regulatory enforcement.
• Source: CoinDesk
2. Judge Acquits Crypto Trading Brothers
• What happened: A judge acquitted two brothers accused of allegedly stealing $25 million through crypto trading.
• Why it matters: Sets a notable legal precedent regarding criminal charges in complex cryptocurrency trading activities.
• Source: Gizmodo
3. Strategy Purchases Bitcoin Decline at $62,000
• What happened: Strategy acquired additional Bitcoin as market prices fell toward the $62,000 level.
• Why it matters: Demonstrates continued institutional accumulation in $BTC despite recent broader market downturns.
• Source: Barron's
$BTC $ETH
#CryptoNews #Bitcoin #Ethereum
1. Hackers Transfer $63 Million in Stolen Ether
• What happened: Wallet addresses tied to a historical Binance breach transferred $63 million worth of Ether following DOJ seizures.
• Why it matters: Signals renewed activity in previously dormant illicit funds amidst ongoing regulatory enforcement.
• Source: CoinDesk
2. Judge Acquits Crypto Trading Brothers
• What happened: A judge acquitted two brothers accused of allegedly stealing $25 million through crypto trading.
• Why it matters: Sets a notable legal precedent regarding criminal charges in complex cryptocurrency trading activities.
• Source: Gizmodo
3. Strategy Purchases Bitcoin Decline at $62,000
• What happened: Strategy acquired additional Bitcoin as market prices fell toward the $62,000 level.
• Why it matters: Demonstrates continued institutional accumulation in $BTC despite recent broader market downturns.
• Source: Barron's
$BTC $ETH
#CryptoNews #Bitcoin #Ethereum
235
CRYPTO MARKET SNAPSHOT
Data timestamp: 2026-11-17 12:35 UTC. BTC/USDT is $64,897.54 (+1.21% over 24h). Market direction can vary by asset and timeframe, so review liquidity and your own risk limits before making decisions.
Watchlist: $BTC $ETH
#CryptoMarket #Bitcoin #Ethereum
Educational commentary only; not financial advice.
CRYPTO MARKET SNAPSHOT
Data timestamp: 2026-11-17 12:35 UTC. BTC/USDT is $64,897.54 (+1.21% over 24h). Market direction can vary by asset and timeframe, so review liquidity and your own risk limits before making decisions.
Watchlist: $BTC $ETH
#CryptoMarket #Bitcoin #Ethereum
Educational commentary only; not financial advice.
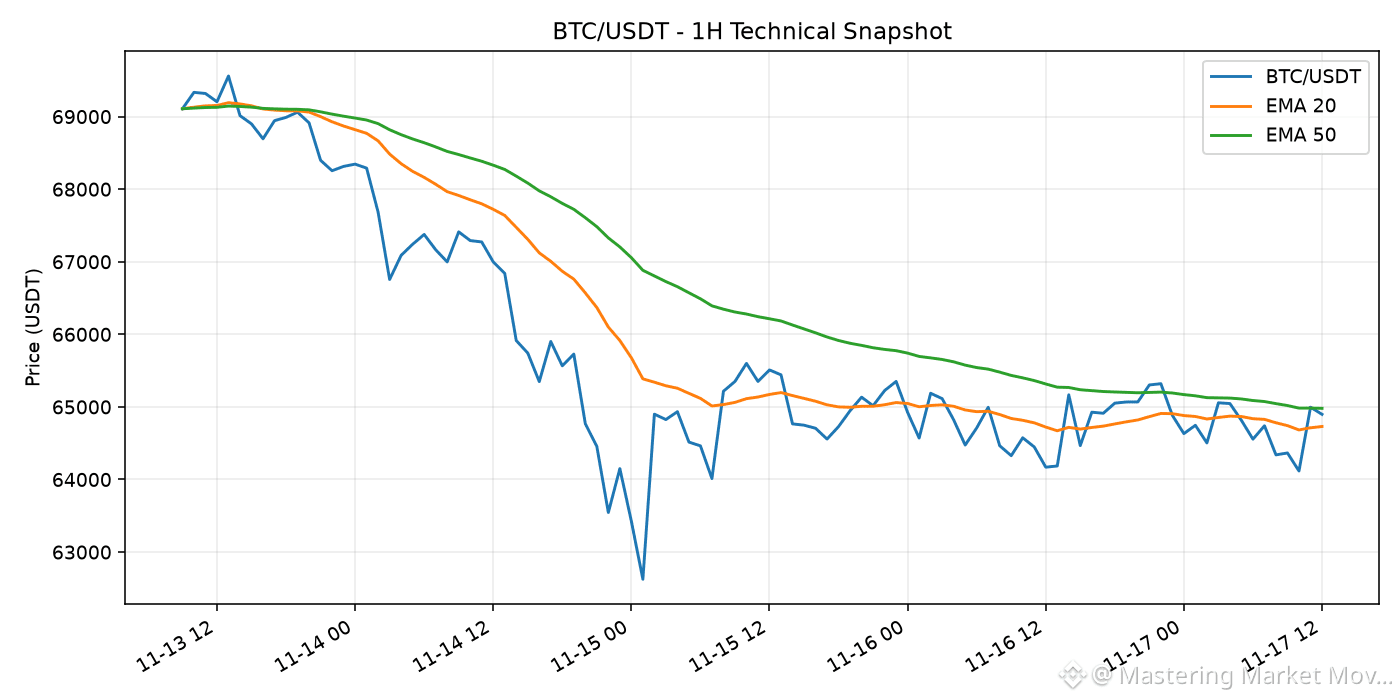
Data timestamp: 2026-11-17 12:35 UTC. BTC/USDT is $64,897.54 (+1.21% over 24h). Market direction can vary by asset and timeframe, so review liquidity and your own risk limits before making decisions.
Watchlist: $BTC $ETH
#CryptoMarket #Bitcoin #Ethereum
Educational commentary only; not financial advice.
87
HIGH-VOLUME ALTCOIN WATCH
Snapshot: 2026-11-17 00:33 UTC. $ETH/USDT is among the highest-volume eligible USDT spot pairs in this snapshot. Last price: $1,812.26; 24h change: -0.54%; 24h quote volume: $551,174,218.
High volume signals activity, not guaranteed continuation. Check the chart, official announcements and downside scenarios independently.
$ETH #Crypto #Altcoins #MarketAnalysis
Educational commentary only; not financial advice.
HIGH-VOLUME ALTCOIN WATCH
Snapshot: 2026-11-17 00:33 UTC. $ETH /USDT is among the highest-volume eligible USDT spot pairs in this snapshot. Last price: $1,812.26; 24h change: -0.54%; 24h quote volume: $551,174,218.
High volume signals activity, not guaranteed continuation. Check the chart, official announcements and downside scenarios independently.
$ETH #Crypto #Altcoins #MarketAnalysis
Educational commentary only; not financial advice.
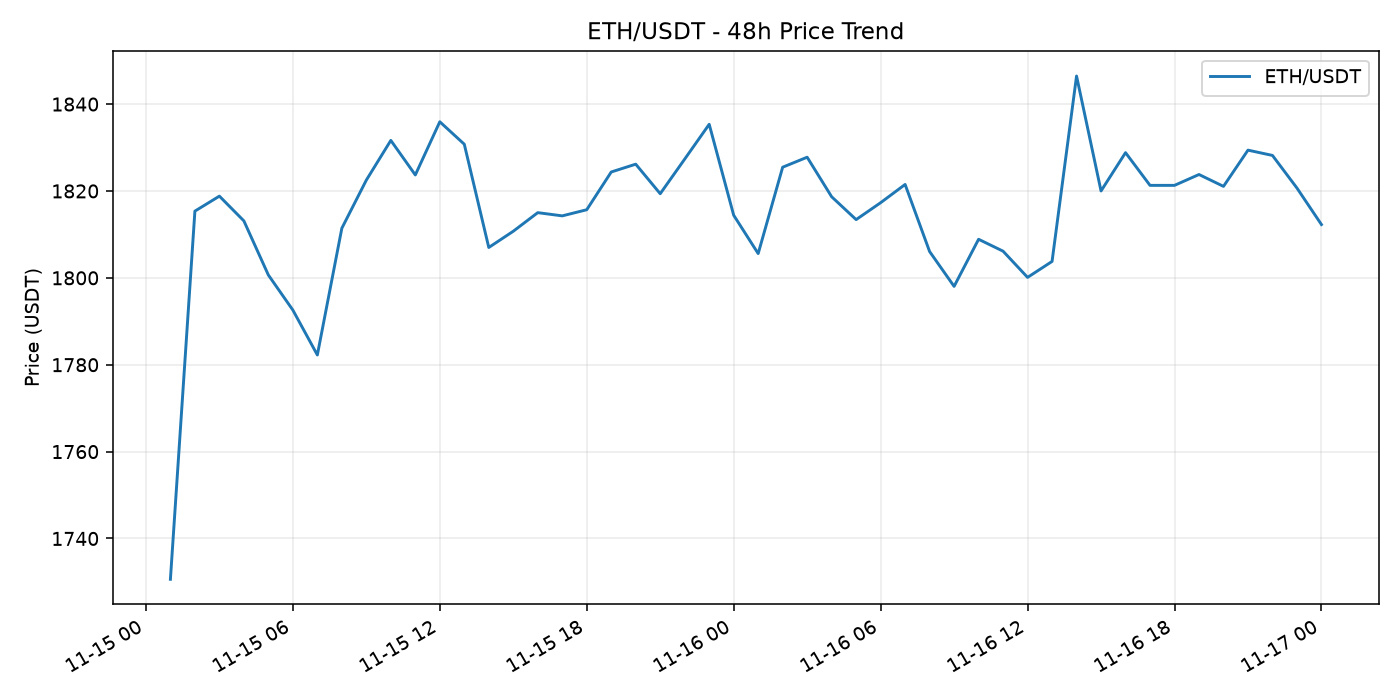
Snapshot: 2026-11-17 00:33 UTC. $ETH /USDT is among the highest-volume eligible USDT spot pairs in this snapshot. Last price: $1,812.26; 24h change: -0.54%; 24h quote volume: $551,174,218.
High volume signals activity, not guaranteed continuation. Check the chart, official announcements and downside scenarios independently.
$ETH #Crypto #Altcoins #MarketAnalysis
Educational commentary only; not financial advice.
6
Deconstructing Market Depth: How Order Books Shape Crypto Price Execution and LiquidityWhen stepping into crypto trading, most market participants begin by analyzing candlestick charts. A standard price chart tells a clear story of historical transactions: where the price opened, how high or low it moved, and where it ultimately closed over a specific timeframe. However, candlestick charts only tell you where the market has already been. They do not reveal the structural mechanics currently holding the market up or pressing it down.
To understand how prices actually move in real time, traders must look beneath the surface of price charts and examine market depth. Market depth offers a direct view into an exchange’s order book, displaying the real-time supply and demand waiting to be executed at various price levels.
Whether you are executing small routine trades or managing larger positions, understanding market depth is crucial for evaluating execution quality, measuring actual market liquidity, and avoiding costly mistakes like unexpected slippage.
---
### 1. The Anatomy of an Order Book
Before analyzing market depth, it is necessary to break down the core component of centralized crypto exchanges: the open order book.
An order book is a real-time, continuously updated ledger of unexecuted buy and sell limit orders. It is divided into two main sides:
- **The Bid Side (Buyers):** Represents traders who wish to buy an asset at a specified price or lower. Bids are listed in descending order, with the highest bid sitting at the very top of the buy column.
- **The Ask/Offer Side (Sellers):** Represents traders who wish to sell an asset at a specified price or higher. Asks are listed in ascending order, with the lowest ask sitting at the top of the sell column.
The difference between the highest bid price and the lowest ask price is known as the **bid-ask spread**.
In highly liquid markets featuring assets like Bitcoin or Ethereum, this spread is often a fraction of a cent or a single tick size. In less liquid markets, such as micro-cap altcoins, the spread can be significantly wider. A narrow spread generally indicates a healthy, competitive market with high continuous liquidity, whereas a wide spread points to lower trader activity or higher market uncertainty.
---
### 2. What Is Market Depth?
While the order book lists individual limit orders, **market depth** measures the market's capacity to absorb relatively large market orders without causing significant price fluctuations.
Market depth visualizes the cumulative volume of pending limit orders placed at incremental price steps away from the current market price. On most trading interfaces, this data is displayed visually as a **Depth Chart**.
A depth chart features two colored slopes converging at the center market price:
- **The Bid Wall (Green):** Displays the cumulative total of buy orders accumulating at lower price levels.
- **The Ask Wall (Red):** Displays the cumulative total of sell orders accumulating at higher price levels.
The steepness and height of these slopes reveal where liquidity is concentrated:
- **A Deep Market:** Characterized by thick, gradual slopes with high cumulative order volume close to the mid-price. In a deep market, large orders can be filled with minimal impact on price.
- **A Shallow Market:** Characterized by flat or thin lines, showing sparse order volume. In a shallow market, even moderate order sizes can cut through multiple price levels instantly, causing sudden price moves.
---
### 3. Practical Mechanics: How Market Depth Controls Slippage
To grasp why market depth matters in practical trading, consider the difference between placing a **limit order** and a **market order**.
A limit order adds liquidity to the book (making you a "maker"). You specify the maximum price you are willing to pay or the minimum price you are willing to accept. Your order sits in the order book until a matching counterparty executes against it.
A market order removes liquidity from the book (making you a "taker"). You demand immediate execution at the best currently available price.
When a market order is placed, it does not execute at a single price point if the order size exceeds the volume available at the top of the book. Instead, it systematically consumes the order book line by line until the order is entirely filled.
#### A Concrete Numerical Example
Imagine Asset X is trading at a current market price of $100. The ask side of the order book looks like this:
- **Level 1:** 2.0 units available at $100.00
- **Level 2:** 3.0 units available at $100.50
- **Level 3:** 5.0 units available at $101.00
If a trader submits a market buy order for **10 units** of Asset X:
1. The order fills 2.0 units at $100.00 (Cost: $200)
2. The order fills 3.0 units at $100.50 (Cost: $301.50)
3. The order fills the remaining 5.0 units at $101.00 (Cost: $505)
- **Total spent:** $1,006.50
- **Average execution price per unit:** $100.65
Although the quoted market price was $100.00 when the order was placed, the average execution price was $100.65 due to market depth constraints. This difference between the expected execution price and the actual execution price is called **slippage**.
In a deep market, Level 1 might have held 100 units at $100.00, allowing the market buy order to fill entirely at $100.00 with zero slippage. This illustrates why checking market depth is critical before executing large market trades.
---
### 4. Advanced Dynamics: Order Book Illusions and Manipulation
While market depth provides valuable insights, relying blindly on visual order book data introduces significant risks. The order book is not a static representation of committed capital; it is a dynamic, fast-changing environment influenced by market participants using various execution strategies.
#### Spoofing and Fake Walls
Large market participants or algorithmic systems can place substantial limit buy or sell orders far enough from the current price to avoid immediate execution. These massive visible orders form large "walls" on the depth chart, creating an illusion of massive support or resistance.
The goal of spoofing is often to influence the sentiment of retail traders—encouraging them to buy ahead of a massive buy wall or sell ahead of a massive sell wall. Once the market price approaches the wall, the entity quickly cancels the unexecuted order.
#### Iceberg Orders
Conversely, institutional traders seeking to enter or exit large positions often aim to conceal their intentions to prevent the market from moving against them. They utilize **iceberg orders**, which are automated orders that divide a massive trade into small, visible tranches.
As soon as one visible tranche is filled from the order book, the algorithm automatically places the next tranche at the same price level. A trader relying strictly on visible market depth might see a small, easily breakable level, unaware that a massive hidden iceberg order is absorbing all incoming volume.
---
### 5. Practical Framework for Intermediate Traders
To integrate market depth analysis effectively into a broader market workflow, intermediate traders typically focus on three core practices:
1. **Assess Order Book Thickness Before Size Placement:** Before executing market orders, calculate whether the target order size significantly exceeds the aggregate liquidity within a 1% to 2% depth boundary of the current mid-price.
2. **Combine Depth with Volume Indicators:** Cross-examine visible support walls on the depth chart with historical volume profile data. A bid wall placed at a historical price node carries more structural weight than an isolated bid wall appearing out of nowhere on a low-volume price level.
3. **Use Limit and Algorithmic Execution for Large Trades:** To mitigate execution costs in thin markets, split orders across time using Time-Weighted Average Price (TWAP) execution algorithms or utilize limit orders to earn maker rebates rather than crossing the spread.
---
### 6. Risks, Limitations, and Reality Checks
Analyzing market depth provides clarity on immediate liquidity, but it comes with distinct limitations that every market participant must understand:
- **Extreme Volatility Vaporization:** During high-volatility events, automated market makers and high-frequency trading (HFT) algorithms routinely pull their limit orders from the book to avoid toxic flow. Consequently, order book depth can evaporate within seconds, drastically increasing slippage precisely when traders demand execution most.
- **Off-Book Liquidity (OTC):** A significant portion of crypto volume, particularly institutional transactions, occurs over-the-counter (OTC) or through private liquidity networks. The exchange order book reflects public retail and market-maker liquidity, not total global supply and demand.
- **No Predictive Guarantees:** Order book depth shows current order placement, not future price direction. A heavy bid side does not guarantee price appreciation; if aggressive market sellers outweigh passive limit buyers, even deep buy walls will crumble.
Market depth analysis is a risk management tool designed to optimize execution efficiency and evaluate short-term liquidity conditions. It is not a standalone trading system, nor does it guarantee profitable outcomes.
---
### Conclusion
Understanding market depth elevates a trader's perspective from basic price observation to practical structural analysis. By analyzing bid-ask spreads, reading order book density, evaluating slippage dynamics, and recognizing order book illusions, intermediate traders can make far more informed decisions about how, when, and where to execute trades safely.
#CryptoEducation #MarketDepth #TradingStrategy
Deconstructing Market Depth: How Order Books Shape Crypto Price Execution and Liquidity
When stepping into crypto trading, most market participants begin by analyzing candlestick charts. A standard price chart tells a clear story of historical transactions: where the price opened, how high or low it moved, and where it ultimately closed over a specific timeframe. However, candlestick charts only tell you where the market has already been. They do not reveal the structural mechanics currently holding the market up or pressing it down.
To understand how prices actually move in real time, traders must look beneath the surface of price charts and examine market depth. Market depth offers a direct view into an exchange’s order book, displaying the real-time supply and demand waiting to be executed at various price levels.
Whether you are executing small routine trades or managing larger positions, understanding market depth is crucial for evaluating execution quality, measuring actual market liquidity, and avoiding costly mistakes like unexpected slippage.
---
### 1. The Anatomy of an Order Book
Before analyzing market depth, it is necessary to break down the core component of centralized crypto exchanges: the open order book.
An order book is a real-time, continuously updated ledger of unexecuted buy and sell limit orders. It is divided into two main sides:
- **The Bid Side (Buyers):** Represents traders who wish to buy an asset at a specified price or lower. Bids are listed in descending order, with the highest bid sitting at the very top of the buy column.
- **The Ask/Offer Side (Sellers):** Represents traders who wish to sell an asset at a specified price or higher. Asks are listed in ascending order, with the lowest ask sitting at the top of the sell column.
The difference between the highest bid price and the lowest ask price is known as the **bid-ask spread**.
In highly liquid markets featuring assets like Bitcoin or Ethereum, this spread is often a fraction of a cent or a single tick size. In less liquid markets, such as micro-cap altcoins, the spread can be significantly wider. A narrow spread generally indicates a healthy, competitive market with high continuous liquidity, whereas a wide spread points to lower trader activity or higher market uncertainty.
---
### 2. What Is Market Depth?
While the order book lists individual limit orders, **market depth** measures the market's capacity to absorb relatively large market orders without causing significant price fluctuations.
Market depth visualizes the cumulative volume of pending limit orders placed at incremental price steps away from the current market price. On most trading interfaces, this data is displayed visually as a **Depth Chart**.
A depth chart features two colored slopes converging at the center market price:
- **The Bid Wall (Green):** Displays the cumulative total of buy orders accumulating at lower price levels.
- **The Ask Wall (Red):** Displays the cumulative total of sell orders accumulating at higher price levels.
The steepness and height of these slopes reveal where liquidity is concentrated:
- **A Deep Market:** Characterized by thick, gradual slopes with high cumulative order volume close to the mid-price. In a deep market, large orders can be filled with minimal impact on price.
- **A Shallow Market:** Characterized by flat or thin lines, showing sparse order volume. In a shallow market, even moderate order sizes can cut through multiple price levels instantly, causing sudden price moves.
---
### 3. Practical Mechanics: How Market Depth Controls Slippage
To grasp why market depth matters in practical trading, consider the difference between placing a **limit order** and a **market order**.
A limit order adds liquidity to the book (making you a "maker"). You specify the maximum price you are willing to pay or the minimum price you are willing to accept. Your order sits in the order book until a matching counterparty executes against it.
A market order removes liquidity from the book (making you a "taker"). You demand immediate execution at the best currently available price.
When a market order is placed, it does not execute at a single price point if the order size exceeds the volume available at the top of the book. Instead, it systematically consumes the order book line by line until the order is entirely filled.
#### A Concrete Numerical Example
Imagine Asset X is trading at a current market price of $100. The ask side of the order book looks like this:
- **Level 1:** 2.0 units available at $100.00
- **Level 2:** 3.0 units available at $100.50
- **Level 3:** 5.0 units available at $101.00
If a trader submits a market buy order for **10 units** of Asset X:
1. The order fills 2.0 units at $100.00 (Cost: $200)
2. The order fills 3.0 units at $100.50 (Cost: $301.50)
3. The order fills the remaining 5.0 units at $101.00 (Cost: $505)
- **Total spent:** $1,006.50
- **Average execution price per unit:** $100.65
Although the quoted market price was $100.00 when the order was placed, the average execution price was $100.65 due to market depth constraints. This difference between the expected execution price and the actual execution price is called **slippage**.
In a deep market, Level 1 might have held 100 units at $100.00, allowing the market buy order to fill entirely at $100.00 with zero slippage. This illustrates why checking market depth is critical before executing large market trades.
---
### 4. Advanced Dynamics: Order Book Illusions and Manipulation
While market depth provides valuable insights, relying blindly on visual order book data introduces significant risks. The order book is not a static representation of committed capital; it is a dynamic, fast-changing environment influenced by market participants using various execution strategies.
#### Spoofing and Fake Walls
Large market participants or algorithmic systems can place substantial limit buy or sell orders far enough from the current price to avoid immediate execution. These massive visible orders form large "walls" on the depth chart, creating an illusion of massive support or resistance.
The goal of spoofing is often to influence the sentiment of retail traders—encouraging them to buy ahead of a massive buy wall or sell ahead of a massive sell wall. Once the market price approaches the wall, the entity quickly cancels the unexecuted order.
#### Iceberg Orders
Conversely, institutional traders seeking to enter or exit large positions often aim to conceal their intentions to prevent the market from moving against them. They utilize **iceberg orders**, which are automated orders that divide a massive trade into small, visible tranches.
As soon as one visible tranche is filled from the order book, the algorithm automatically places the next tranche at the same price level. A trader relying strictly on visible market depth might see a small, easily breakable level, unaware that a massive hidden iceberg order is absorbing all incoming volume.
---
### 5. Practical Framework for Intermediate Traders
To integrate market depth analysis effectively into a broader market workflow, intermediate traders typically focus on three core practices:
1. **Assess Order Book Thickness Before Size Placement:** Before executing market orders, calculate whether the target order size significantly exceeds the aggregate liquidity within a 1% to 2% depth boundary of the current mid-price.
2. **Combine Depth with Volume Indicators:** Cross-examine visible support walls on the depth chart with historical volume profile data. A bid wall placed at a historical price node carries more structural weight than an isolated bid wall appearing out of nowhere on a low-volume price level.
3. **Use Limit and Algorithmic Execution for Large Trades:** To mitigate execution costs in thin markets, split orders across time using Time-Weighted Average Price (TWAP) execution algorithms or utilize limit orders to earn maker rebates rather than crossing the spread.
---
### 6. Risks, Limitations, and Reality Checks
Analyzing market depth provides clarity on immediate liquidity, but it comes with distinct limitations that every market participant must understand:
- **Extreme Volatility Vaporization:** During high-volatility events, automated market makers and high-frequency trading (HFT) algorithms routinely pull their limit orders from the book to avoid toxic flow. Consequently, order book depth can evaporate within seconds, drastically increasing slippage precisely when traders demand execution most.
- **Off-Book Liquidity (OTC):** A significant portion of crypto volume, particularly institutional transactions, occurs over-the-counter (OTC) or through private liquidity networks. The exchange order book reflects public retail and market-maker liquidity, not total global supply and demand.
- **No Predictive Guarantees:** Order book depth shows current order placement, not future price direction. A heavy bid side does not guarantee price appreciation; if aggressive market sellers outweigh passive limit buyers, even deep buy walls will crumble.
Market depth analysis is a risk management tool designed to optimize execution efficiency and evaluate short-term liquidity conditions. It is not a standalone trading system, nor does it guarantee profitable outcomes.
---
### Conclusion
Understanding market depth elevates a trader's perspective from basic price observation to practical structural analysis. By analyzing bid-ask spreads, reading order book density, evaluating slippage dynamics, and recognizing order book illusions, intermediate traders can make far more informed decisions about how, when, and where to execute trades safely.
#CryptoEducation #MarketDepth #TradingStrategy
To understand how prices actually move in real time, traders must look beneath the surface of price charts and examine market depth. Market depth offers a direct view into an exchange’s order book, displaying the real-time supply and demand waiting to be executed at various price levels.
Whether you are executing small routine trades or managing larger positions, understanding market depth is crucial for evaluating execution quality, measuring actual market liquidity, and avoiding costly mistakes like unexpected slippage.
---
### 1. The Anatomy of an Order Book
Before analyzing market depth, it is necessary to break down the core component of centralized crypto exchanges: the open order book.
An order book is a real-time, continuously updated ledger of unexecuted buy and sell limit orders. It is divided into two main sides:
- **The Bid Side (Buyers):** Represents traders who wish to buy an asset at a specified price or lower. Bids are listed in descending order, with the highest bid sitting at the very top of the buy column.
- **The Ask/Offer Side (Sellers):** Represents traders who wish to sell an asset at a specified price or higher. Asks are listed in ascending order, with the lowest ask sitting at the top of the sell column.
The difference between the highest bid price and the lowest ask price is known as the **bid-ask spread**.
In highly liquid markets featuring assets like Bitcoin or Ethereum, this spread is often a fraction of a cent or a single tick size. In less liquid markets, such as micro-cap altcoins, the spread can be significantly wider. A narrow spread generally indicates a healthy, competitive market with high continuous liquidity, whereas a wide spread points to lower trader activity or higher market uncertainty.
---
### 2. What Is Market Depth?
While the order book lists individual limit orders, **market depth** measures the market's capacity to absorb relatively large market orders without causing significant price fluctuations.
Market depth visualizes the cumulative volume of pending limit orders placed at incremental price steps away from the current market price. On most trading interfaces, this data is displayed visually as a **Depth Chart**.
A depth chart features two colored slopes converging at the center market price:
- **The Bid Wall (Green):** Displays the cumulative total of buy orders accumulating at lower price levels.
- **The Ask Wall (Red):** Displays the cumulative total of sell orders accumulating at higher price levels.
The steepness and height of these slopes reveal where liquidity is concentrated:
- **A Deep Market:** Characterized by thick, gradual slopes with high cumulative order volume close to the mid-price. In a deep market, large orders can be filled with minimal impact on price.
- **A Shallow Market:** Characterized by flat or thin lines, showing sparse order volume. In a shallow market, even moderate order sizes can cut through multiple price levels instantly, causing sudden price moves.
---
### 3. Practical Mechanics: How Market Depth Controls Slippage
To grasp why market depth matters in practical trading, consider the difference between placing a **limit order** and a **market order**.
A limit order adds liquidity to the book (making you a "maker"). You specify the maximum price you are willing to pay or the minimum price you are willing to accept. Your order sits in the order book until a matching counterparty executes against it.
A market order removes liquidity from the book (making you a "taker"). You demand immediate execution at the best currently available price.
When a market order is placed, it does not execute at a single price point if the order size exceeds the volume available at the top of the book. Instead, it systematically consumes the order book line by line until the order is entirely filled.
#### A Concrete Numerical Example
Imagine Asset X is trading at a current market price of $100. The ask side of the order book looks like this:
- **Level 1:** 2.0 units available at $100.00
- **Level 2:** 3.0 units available at $100.50
- **Level 3:** 5.0 units available at $101.00
If a trader submits a market buy order for **10 units** of Asset X:
1. The order fills 2.0 units at $100.00 (Cost: $200)
2. The order fills 3.0 units at $100.50 (Cost: $301.50)
3. The order fills the remaining 5.0 units at $101.00 (Cost: $505)
- **Total spent:** $1,006.50
- **Average execution price per unit:** $100.65
Although the quoted market price was $100.00 when the order was placed, the average execution price was $100.65 due to market depth constraints. This difference between the expected execution price and the actual execution price is called **slippage**.
In a deep market, Level 1 might have held 100 units at $100.00, allowing the market buy order to fill entirely at $100.00 with zero slippage. This illustrates why checking market depth is critical before executing large market trades.
---
### 4. Advanced Dynamics: Order Book Illusions and Manipulation
While market depth provides valuable insights, relying blindly on visual order book data introduces significant risks. The order book is not a static representation of committed capital; it is a dynamic, fast-changing environment influenced by market participants using various execution strategies.
#### Spoofing and Fake Walls
Large market participants or algorithmic systems can place substantial limit buy or sell orders far enough from the current price to avoid immediate execution. These massive visible orders form large "walls" on the depth chart, creating an illusion of massive support or resistance.
The goal of spoofing is often to influence the sentiment of retail traders—encouraging them to buy ahead of a massive buy wall or sell ahead of a massive sell wall. Once the market price approaches the wall, the entity quickly cancels the unexecuted order.
#### Iceberg Orders
Conversely, institutional traders seeking to enter or exit large positions often aim to conceal their intentions to prevent the market from moving against them. They utilize **iceberg orders**, which are automated orders that divide a massive trade into small, visible tranches.
As soon as one visible tranche is filled from the order book, the algorithm automatically places the next tranche at the same price level. A trader relying strictly on visible market depth might see a small, easily breakable level, unaware that a massive hidden iceberg order is absorbing all incoming volume.
---
### 5. Practical Framework for Intermediate Traders
To integrate market depth analysis effectively into a broader market workflow, intermediate traders typically focus on three core practices:
1. **Assess Order Book Thickness Before Size Placement:** Before executing market orders, calculate whether the target order size significantly exceeds the aggregate liquidity within a 1% to 2% depth boundary of the current mid-price.
2. **Combine Depth with Volume Indicators:** Cross-examine visible support walls on the depth chart with historical volume profile data. A bid wall placed at a historical price node carries more structural weight than an isolated bid wall appearing out of nowhere on a low-volume price level.
3. **Use Limit and Algorithmic Execution for Large Trades:** To mitigate execution costs in thin markets, split orders across time using Time-Weighted Average Price (TWAP) execution algorithms or utilize limit orders to earn maker rebates rather than crossing the spread.
---
### 6. Risks, Limitations, and Reality Checks
Analyzing market depth provides clarity on immediate liquidity, but it comes with distinct limitations that every market participant must understand:
- **Extreme Volatility Vaporization:** During high-volatility events, automated market makers and high-frequency trading (HFT) algorithms routinely pull their limit orders from the book to avoid toxic flow. Consequently, order book depth can evaporate within seconds, drastically increasing slippage precisely when traders demand execution most.
- **Off-Book Liquidity (OTC):** A significant portion of crypto volume, particularly institutional transactions, occurs over-the-counter (OTC) or through private liquidity networks. The exchange order book reflects public retail and market-maker liquidity, not total global supply and demand.
- **No Predictive Guarantees:** Order book depth shows current order placement, not future price direction. A heavy bid side does not guarantee price appreciation; if aggressive market sellers outweigh passive limit buyers, even deep buy walls will crumble.
Market depth analysis is a risk management tool designed to optimize execution efficiency and evaluate short-term liquidity conditions. It is not a standalone trading system, nor does it guarantee profitable outcomes.
---
### Conclusion
Understanding market depth elevates a trader's perspective from basic price observation to practical structural analysis. By analyzing bid-ask spreads, reading order book density, evaluating slippage dynamics, and recognizing order book illusions, intermediate traders can make far more informed decisions about how, when, and where to execute trades safely.
#CryptoEducation #MarketDepth #TradingStrategy
23
BTC/USDT TECHNICAL CHECK - 1H
Snapshot: 2026-11-16 22:45 UTC. Latest close: $65,522.47. RSI(14): 64.8. EMA20 is below EMA50 on this snapshot. This is a momentum observation, not a standalone buy or sell signal. RSI can remain elevated or depressed during strong trends; confirm with price structure and risk management.
$BTC #Bitcoin #TechnicalAnalysis
Educational commentary only; not financial advice.
BTC/USDT TECHNICAL CHECK - 1H
Snapshot: 2026-11-16 22:45 UTC. Latest close: $65,522.47. RSI(14): 64.8. EMA20 is below EMA50 on this snapshot. This is a momentum observation, not a standalone buy or sell signal. RSI can remain elevated or depressed during strong trends; confirm with price structure and risk management.
$BTC #Bitcoin #TechnicalAnalysis
Educational commentary only; not financial advice.
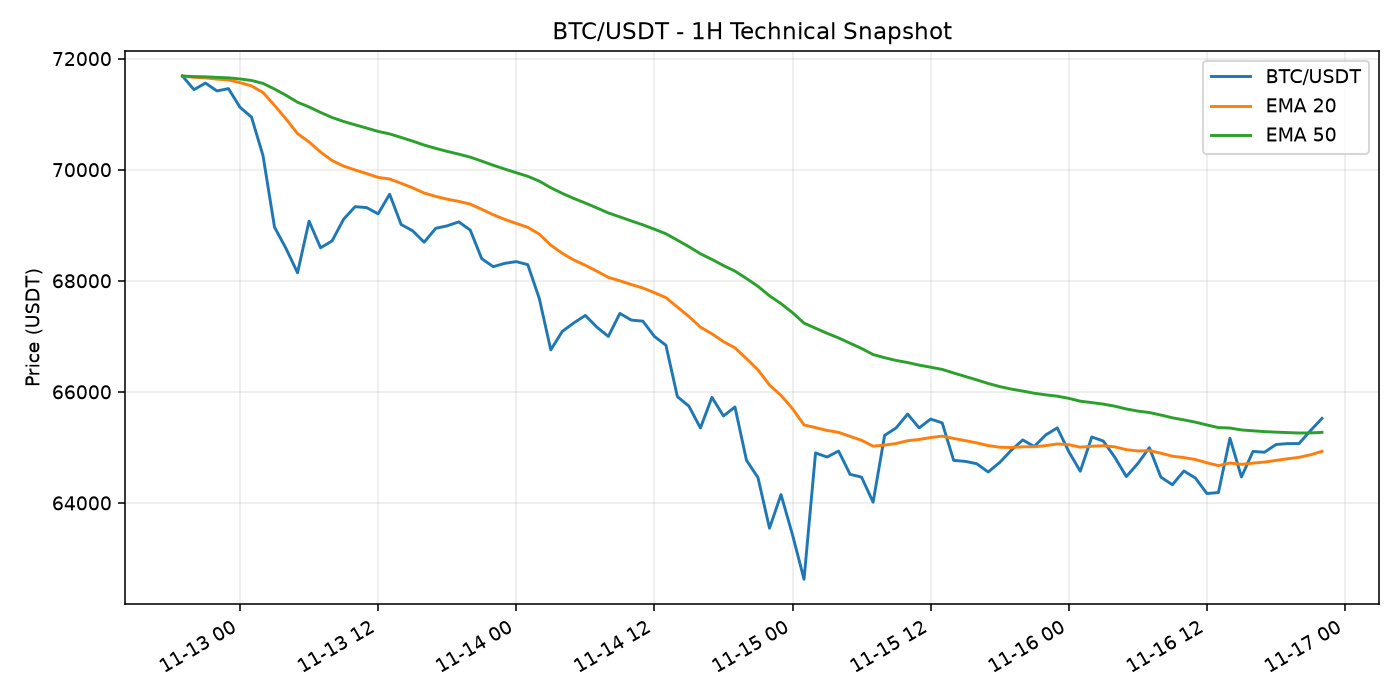
Snapshot: 2026-11-16 22:45 UTC. Latest close: $65,522.47. RSI(14): 64.8. EMA20 is below EMA50 on this snapshot. This is a momentum observation, not a standalone buy or sell signal. RSI can remain elevated or depressed during strong trends; confirm with price structure and risk management.
$BTC #Bitcoin #TechnicalAnalysis
Educational commentary only; not financial advice.
23
Мақала
Crypto Market Overview: Compression and Consolidation in Major AssetsMarket Overview & Price Performance:
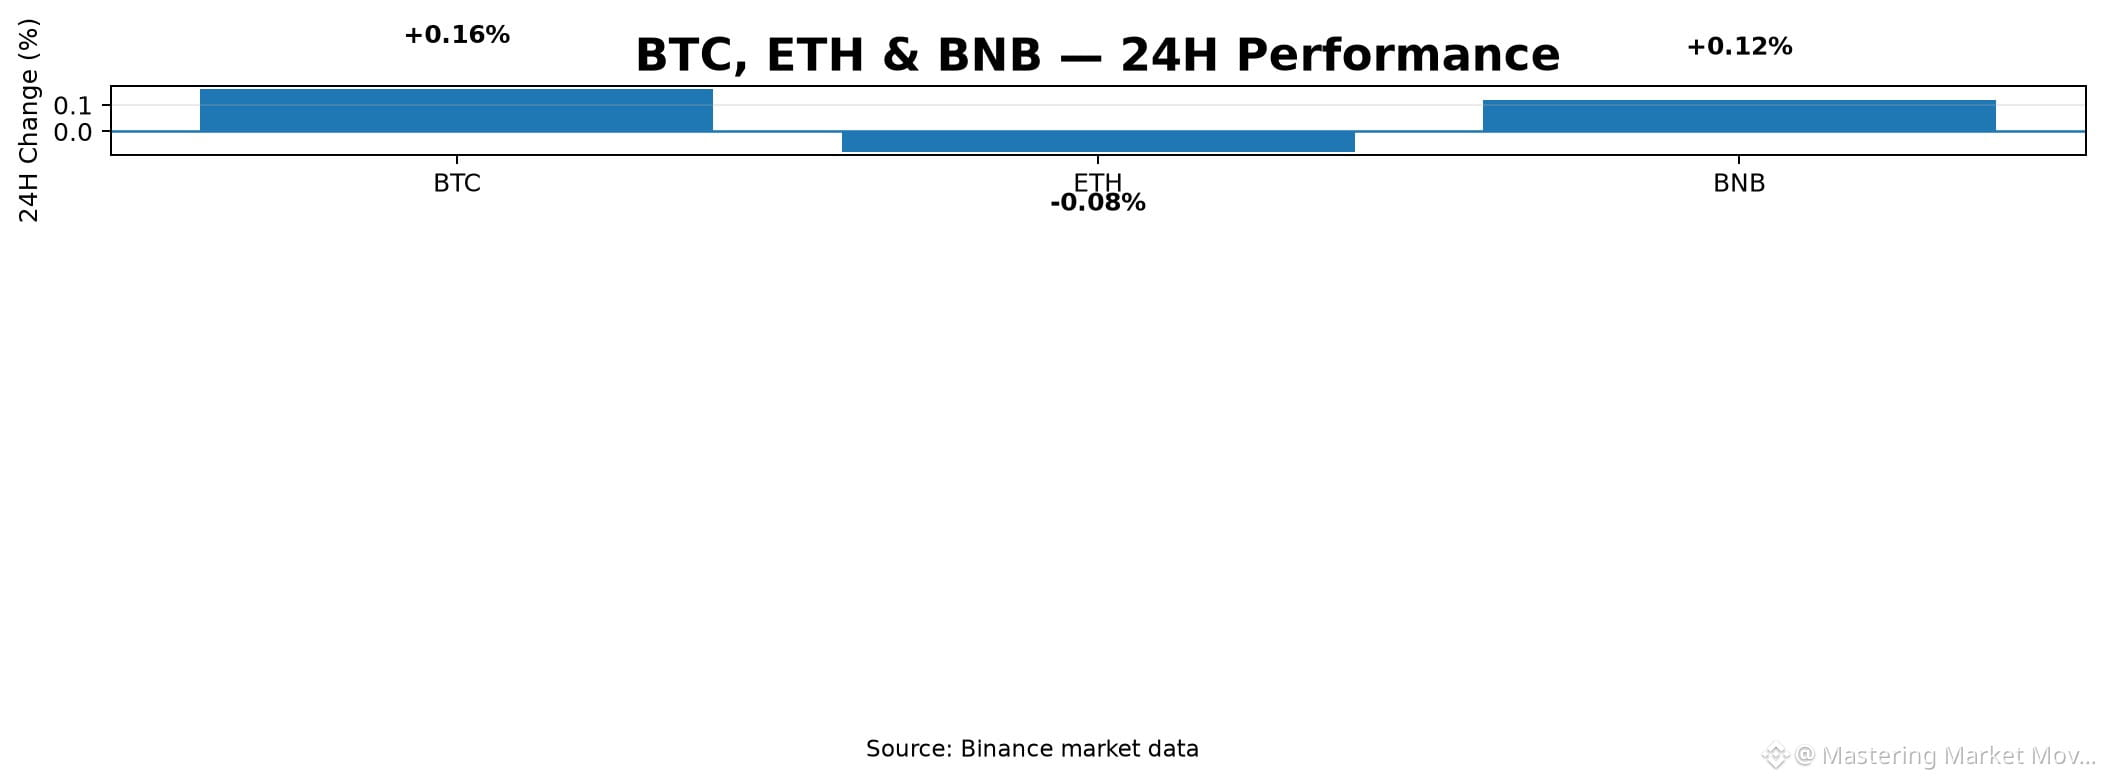
- $BTC is currently trading at $65,065.01, showing a modest 24-hour gain of +0.161%. The asset established a 24-hour high of $65,696.16 and a low of $63,905.01.
- $ETH is priced at $1,824.07, down -0.077% over the last 24 hours, trading between a high of $1,866.89 and a low of $1,787.11.
- $BNB sits at $592.37, recording a +0.117% move in the last 24 hours, with a high of $598.42 and a low of $583.81.
Volume & Relative Strength:
Trading volume remains concentrated, with Bitcoin leading at ~$1.41B in 24-hour quote volume (21,794.95 units). Ethereum logged ~$571.79M in quote volume (314,216.32 units), while BNB recorded ~$69.18M (117,036.78 units). Bitcoin and BNB demonstrate slight relative strength over Ethereum, which is slightly underperforming in negative territory.
Volatility & High/Low Ranges:
Market volatility is relatively subdued across all three assets. Bitcoin moved within a $1,791.15 range, Ethereum fluctuated within a $79.78 window, and BNB remained bounded in a tight $14.61 range.
Potential Scenarios:
- Bullish Scenario: A move above the respective 24-hour highs ($65,696.16, $1,866.89, and $598.42) accompanied by expanding volume could indicate a bullish breakout and resumption of upward momentum.
- Bearish Scenario: A drop below key 24-hour support levels ($63,905.01, $1,787.11, and $583.81) on high volume could signal short-term downside risks.
Risks & Key Factors to Watch:
Primary risks involve prolonged low-volatility chop and false breakouts. Market participants should watch for volume expansion around 24-hour high and low boundaries to confirm the validity of any direction.
#CryptoAnalysis #MarketUpdate #BinanceSquare
Crypto Market Overview: Compression and Consolidation in Major Assets
Market Overview & Price Performance:
- $BTC is currently trading at $65,065.01, showing a modest 24-hour gain of +0.161%. The asset established a 24-hour high of $65,696.16 and a low of $63,905.01.
- $ETH is priced at $1,824.07, down -0.077% over the last 24 hours, trading between a high of $1,866.89 and a low of $1,787.11.
- $BNB sits at $592.37, recording a +0.117% move in the last 24 hours, with a high of $598.42 and a low of $583.81.
Volume & Relative Strength:
Trading volume remains concentrated, with Bitcoin leading at ~$1.41B in 24-hour quote volume (21,794.95 units). Ethereum logged ~$571.79M in quote volume (314,216.32 units), while BNB recorded ~$69.18M (117,036.78 units). Bitcoin and BNB demonstrate slight relative strength over Ethereum, which is slightly underperforming in negative territory.
Volatility & High/Low Ranges:
Market volatility is relatively subdued across all three assets. Bitcoin moved within a $1,791.15 range, Ethereum fluctuated within a $79.78 window, and BNB remained bounded in a tight $14.61 range.
Potential Scenarios:
- Bullish Scenario: A move above the respective 24-hour highs ($65,696.16, $1,866.89, and $598.42) accompanied by expanding volume could indicate a bullish breakout and resumption of upward momentum.
- Bearish Scenario: A drop below key 24-hour support levels ($63,905.01, $1,787.11, and $583.81) on high volume could signal short-term downside risks.
Risks & Key Factors to Watch:
Primary risks involve prolonged low-volatility chop and false breakouts. Market participants should watch for volume expansion around 24-hour high and low boundaries to confirm the validity of any direction.
#CryptoAnalysis #MarketUpdate #BinanceSquare
- $BTC is currently trading at $65,065.01, showing a modest 24-hour gain of +0.161%. The asset established a 24-hour high of $65,696.16 and a low of $63,905.01.
- $ETH is priced at $1,824.07, down -0.077% over the last 24 hours, trading between a high of $1,866.89 and a low of $1,787.11.
- $BNB sits at $592.37, recording a +0.117% move in the last 24 hours, with a high of $598.42 and a low of $583.81.
Volume & Relative Strength:
Trading volume remains concentrated, with Bitcoin leading at ~$1.41B in 24-hour quote volume (21,794.95 units). Ethereum logged ~$571.79M in quote volume (314,216.32 units), while BNB recorded ~$69.18M (117,036.78 units). Bitcoin and BNB demonstrate slight relative strength over Ethereum, which is slightly underperforming in negative territory.
Volatility & High/Low Ranges:
Market volatility is relatively subdued across all three assets. Bitcoin moved within a $1,791.15 range, Ethereum fluctuated within a $79.78 window, and BNB remained bounded in a tight $14.61 range.
Potential Scenarios:
- Bullish Scenario: A move above the respective 24-hour highs ($65,696.16, $1,866.89, and $598.42) accompanied by expanding volume could indicate a bullish breakout and resumption of upward momentum.
- Bearish Scenario: A drop below key 24-hour support levels ($63,905.01, $1,787.11, and $583.81) on high volume could signal short-term downside risks.
Risks & Key Factors to Watch:
Primary risks involve prolonged low-volatility chop and false breakouts. Market participants should watch for volume expansion around 24-hour high and low boundaries to confirm the validity of any direction.
#CryptoAnalysis #MarketUpdate #BinanceSquare
76
Crypto News Digest: Vitalik on Quantum-Safe Ethereum, Saylor on Bitcoin Metrics, and Binance BNB RewardsHere are the top fresh stories in crypto today:
1. Vitalik Buterin Optimistic on Quantum-Safe Ethereum
- What happened: Ethereum co-founder Vitalik Buterin stated he is strongly bullish on a faster roadmap to make $ETH quantum-safe.
- Why it matters: Accelerated quantum resistance targets core long-term security and cryptographic stability for the network.
- Source: CoinDesk
2. Saylor Points to Rare Bitcoin Metrics
- What happened: MicroStrategy's Michael Saylor highlighted four rare and extreme metrics that $BTC recently hit to explain current price levels.
- Why it matters: Highlights significant technical benchmarks occurring during the current market movement.
- Source: BeInCrypto
3. Binance Announces New BNB Quiz Activity
- What happened: Binance launched a new "Word of the Day" activity themed around stock options.
- Why it matters: Active platform users can test their knowledge to unlock $BNB rewards.
- Source: Binance
#CryptoNews #Bitcoin #Ethereum
Crypto News Digest: Vitalik on Quantum-Safe Ethereum, Saylor on Bitcoin Metrics, and Binance BNB Rewards
Here are the top fresh stories in crypto today:
1. Vitalik Buterin Optimistic on Quantum-Safe Ethereum
- What happened: Ethereum co-founder Vitalik Buterin stated he is strongly bullish on a faster roadmap to make $ETH quantum-safe.
- Why it matters: Accelerated quantum resistance targets core long-term security and cryptographic stability for the network.
- Source: CoinDesk
2. Saylor Points to Rare Bitcoin Metrics
- What happened: MicroStrategy's Michael Saylor highlighted four rare and extreme metrics that $BTC recently hit to explain current price levels.
- Why it matters: Highlights significant technical benchmarks occurring during the current market movement.
- Source: BeInCrypto
3. Binance Announces New BNB Quiz Activity
- What happened: Binance launched a new "Word of the Day" activity themed around stock options.
- Why it matters: Active platform users can test their knowledge to unlock $BNB rewards.
- Source: Binance
#CryptoNews #Bitcoin #Ethereum
1. Vitalik Buterin Optimistic on Quantum-Safe Ethereum
- What happened: Ethereum co-founder Vitalik Buterin stated he is strongly bullish on a faster roadmap to make $ETH quantum-safe.
- Why it matters: Accelerated quantum resistance targets core long-term security and cryptographic stability for the network.
- Source: CoinDesk
2. Saylor Points to Rare Bitcoin Metrics
- What happened: MicroStrategy's Michael Saylor highlighted four rare and extreme metrics that $BTC recently hit to explain current price levels.
- Why it matters: Highlights significant technical benchmarks occurring during the current market movement.
- Source: BeInCrypto
3. Binance Announces New BNB Quiz Activity
- What happened: Binance launched a new "Word of the Day" activity themed around stock options.
- Why it matters: Active platform users can test their knowledge to unlock $BNB rewards.
- Source: Binance
#CryptoNews #Bitcoin #Ethereum
CRYPTO MARKET SNAPSHOT
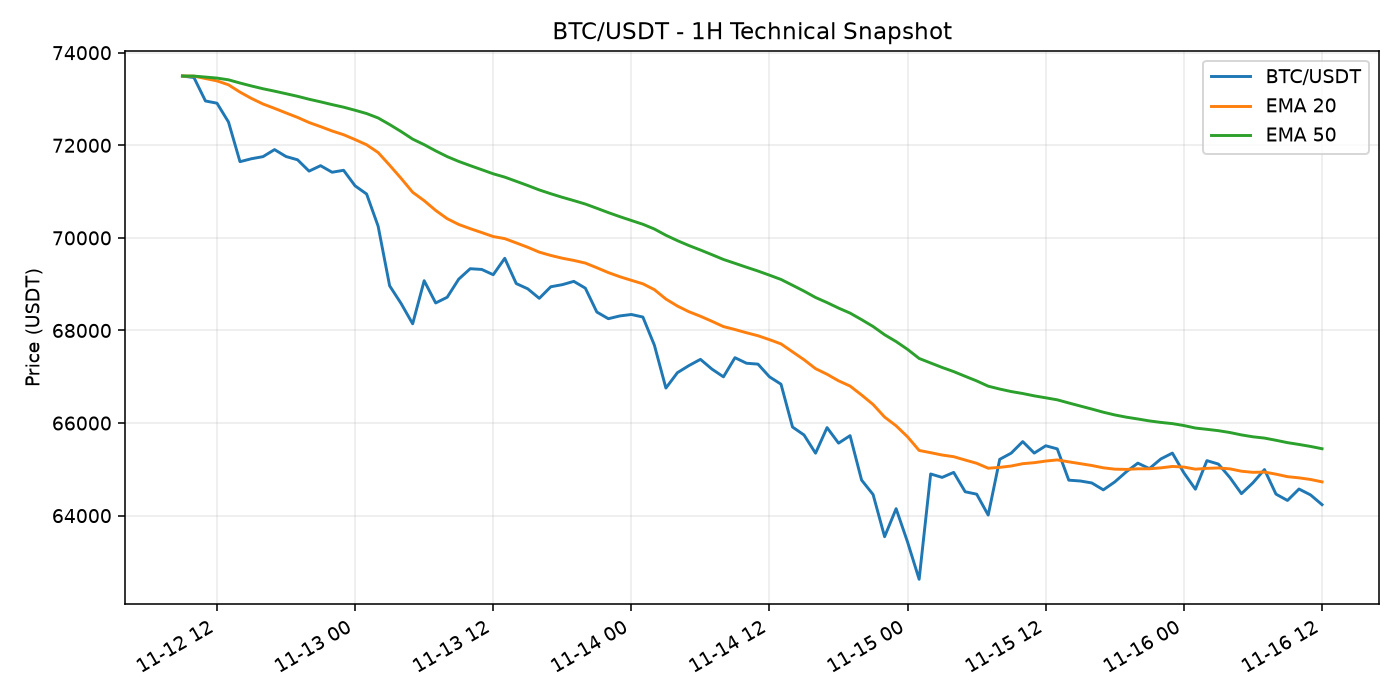
Data timestamp: 2026-11-16 12:09 UTC. BTC/USDT is $64,240.67 (-1.77% over 24h). Market direction can vary by asset and timeframe, so review liquidity and your own risk limits before making decisions.
Watchlist: $BTC $ETH
#CryptoMarket #Bitcoin #Ethereum
Educational commentary only; not financial advice.
CRYPTO MARKET SNAPSHOT
Data timestamp: 2026-11-16 12:09 UTC. BTC/USDT is $64,240.67 (-1.77% over 24h). Market direction can vary by asset and timeframe, so review liquidity and your own risk limits before making decisions.
Watchlist: $BTC $ETH
#CryptoMarket #Bitcoin #Ethereum
Educational commentary only; not financial advice.
Data timestamp: 2026-11-16 12:09 UTC. BTC/USDT is $64,240.67 (-1.77% over 24h). Market direction can vary by asset and timeframe, so review liquidity and your own risk limits before making decisions.
Watchlist: $BTC $ETH
#CryptoMarket #Bitcoin #Ethereum
Educational commentary only; not financial advice.
72
HIGH-VOLUME ALTCOIN WATCH
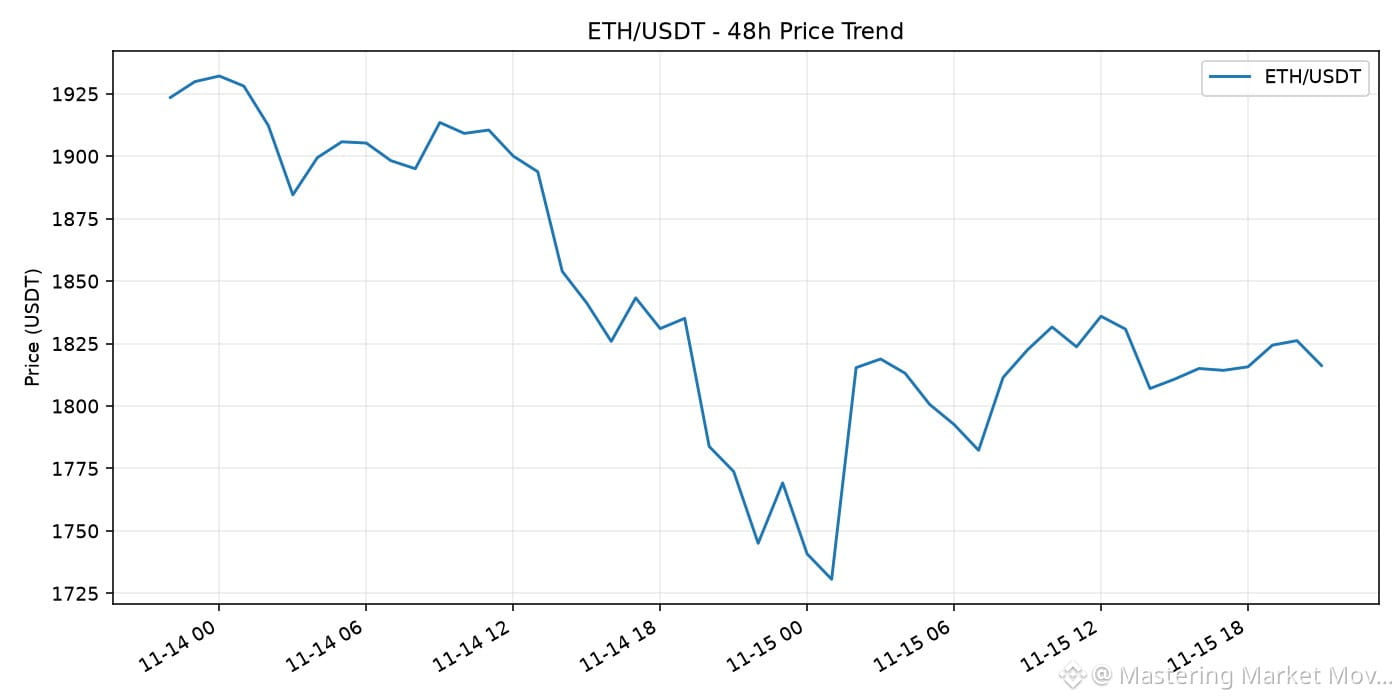
Snapshot: 2026-11-15 21:23 UTC. $ETH/USDT is among the highest-volume eligible USDT spot pairs in this snapshot. Last price: $1,816.36; 24h change: +2.60%; 24h quote volume: $882,273,308.
High volume signals activity, not guaranteed continuation. Check the chart, official announcements and downside scenarios independently.
$ETH #Crypto #Altcoins #MarketAnalysis
Educational commentary only; not financial advice.
HIGH-VOLUME ALTCOIN WATCH
Snapshot: 2026-11-15 21:23 UTC. $ETH /USDT is among the highest-volume eligible USDT spot pairs in this snapshot. Last price: $1,816.36; 24h change: +2.60%; 24h quote volume: $882,273,308.
High volume signals activity, not guaranteed continuation. Check the chart, official announcements and downside scenarios independently.
$ETH #Crypto #Altcoins #MarketAnalysis
Educational commentary only; not financial advice.
Snapshot: 2026-11-15 21:23 UTC. $ETH /USDT is among the highest-volume eligible USDT spot pairs in this snapshot. Last price: $1,816.36; 24h change: +2.60%; 24h quote volume: $882,273,308.
High volume signals activity, not guaranteed continuation. Check the chart, official announcements and downside scenarios independently.
$ETH #Crypto #Altcoins #MarketAnalysis
Educational commentary only; not financial advice.
1
52
Demystifying Market Depth: How Order Book Dynamics Shape Crypto PricesWhen evaluating cryptocurrency markets, most market participants focus almost entirely on candlestick charts. While historical price action provides valuable context, candlesticks only show where the price has been. They do not show the underlying supply and demand mechanics currently resting in the market.
To understand where price might head next—and more importantly, how easily it can move—intermediate traders must learn to read market depth.
Market depth represents an asset’s ability to sustain large market orders without impacting its price significantly. It is a real-time window into the limit orders sitting on exchange order books. By mastering market depth, you transition from viewing price as a static line on a screen to understanding it as a dynamic equilibrium driven by resting liquidity.
---
### The Anatomy of an Order Book
Before analyzing depth, we must break down the structural foundation of digital asset exchanges: the central limit order book (CLOB).
An order book consists of two main components:
1. **Bids (Buy Orders):** Resting limit orders placed by buyers below the current prevailing market price.
2. **Asks or Offers (Sell Orders):** Resting limit orders placed by sellers above the current market price.
The highest price a buyer is willing to pay is the **Best Bid**, and the lowest price a seller is willing to accept is the **Best Ask**. The difference between these two values is known as the **Bid-Ask Spread**.
When a trader submits a **Market Order**, they accept the best available price on the order book instantly. A market buy order matches against resting ask orders, while a market sell order matches against resting bid orders. Conversely, a **Limit Order** adds liquidity to the order book, sitting at a specified price until another participant fills it. Limit order traders are known as *liquidity makers*, while market order traders are *liquidity takers*.
Market depth is simply the cumulative visualization of these resting limit buy and sell orders across various price levels away from the current market price.
---
### Understanding the Market Depth Chart
Most major exchanges display market depth visually alongside the standard order book ladder. This visual representation typically features two colored zones meeting at the center:
* **Green Zone (Bids):** Accumulates all resting buy orders from the best bid down to lower price levels.
* **Red Zone (Asks):** Accumulates all resting sell orders from the best ask up to higher price levels.
The horizontal axis represents price, while the vertical axis represents cumulative volume.
#### Interpreting Slope and Walls
The shape of the depth curve provides immediate structural insights:
* **Steep Slopes (Thick Depth):** A steep upward slope indicates that large amounts of volume are sitting within a narrow price range. This suggests robust liquidity, meaning it takes significant capital to move the price through this zone.
* **Shallow Slopes (Thin Depth):** A flat or shallow line indicates low volume resting at those price levels. In thin markets, relatively small market orders can push the price rapidly across multiple price ticks.
* **Order Walls:** A near-vertical spike in the depth chart represents a massive concentration of limit orders at a single price point—commonly referred to as a "buy wall" or "sell wall."
While order walls often act as psychological support or resistance levels, they must be interpreted with caution. Market makers and institutional participants frequently place and cancel large limit orders dynamically, meaning visual walls are not guaranteed to hold price action.
---
### Practical Example: Slippage and Price Impact
To appreciate the importance of market depth, consider how liquidity affects order execution in real-world trading scenarios.
Imagine an asset trading at $100. The order book displays the following sell liquidity (asks):
* Level 1: 10 units available at $100.00
* Level 2: 20 units available at $100.50
* Level 3: 50 units available at $101.00
* Level 4: 100 units available at $102.00
If Trader A submits a market buy order for **10 units**, the order is entirely filled at $100.00. The total cost is $1,000, and the average fill price is $100.00. The trade has zero execution slippage.
Now consider Trader B, who submits a market buy order for **70 units** into the exact same book:
* The first 10 units fill at $100.00 ($1,000)
* The next 20 units fill at $100.50 ($2,010)
* The remaining 40 units fill at $101.00 ($4,040)
Trader B spends $7,050 to buy 70 units, resulting in an average purchase price of **$100.71 per unit**.
This difference between the expected execution price ($100.00) and the actual average execution price ($100.71) is **slippage**. It occurred because the buyer's order was larger than the liquidity available at the best ask price, forcing the order to consume liquidity higher up the order book ladder.
In low-depth assets, large market orders can cause massive price spikes or drops, creating extreme volatility and poor execution for traders who rely solely on market orders.
---
### Hidden Layers, Manipulations, and Limitations
While market depth analysis offers vital clues, relying on visible order book data alone carries distinct risks. Modern crypto markets are complex, fast-moving environments influenced by automated trading systems and institutional tactics.
#### 1. Spoofing and Fake Liquidity
Spoofing occurs when a market participant places large, visible limit orders with no intention of letting them fill. For instance, a trader might place a massive buy wall at $95 to create the illusion of strong support, encouraging retail traders to buy at $96. Just before market price falls to hit the $95 wall, the spoofer cancels the order.
#### 2. Iceberg Orders
Institutional traders executing large positions rarely place multi-million-dollar limit orders directly onto the visible order book. Instead, they utilize **Iceberg Orders**—automated execution algorithms that split a massive order into small, visible slices. As soon as one visible slice is filled, the algorithm automatically places the next slice at the same or nearby price level. As a result, a price level that looks "thin" on the market depth chart may actually contain substantial hidden liquidity.
#### 3. Fragmentation Across Exchanges
Unlike traditional equity markets operating under centralized systems, crypto liquidity is fragmented across dozens of centralized exchanges and decentralized automated market makers (AMMs). Strong market depth on one major exchange does not guarantee deep liquidity globally. Cross-exchange arbitrage bots work constantly to align prices across platforms, but liquidity fragmentation remains an important structural limitation.
---
### Strategic Takeaways for Intermediate Traders
Understanding market depth changes how you structure your trades and manage risk:
* **Order Type Selection:** For large trade sizes relative to an asset's average daily volume, use limit orders or algorithmic execution strategies (such as TWAP or VWAP) rather than market orders to minimize slippage.
* **Identifying High-Liquidity Zones:** Instead of treating technical levels as precise lines, cross-reference support and resistance areas with order book depth. Price zones backed by persistent, genuine limit orders often provide more reliable structural support.
* **Volatility Forecasting:** When market depth thins out dramatically on both sides of the book (bids and asks), expect heightened volatility. In thin order books, minor spikes in buying or selling volume can cause disproportionate price swings.
* **Context Over Isolation:** Never analyze market depth in isolation. Combine order book data with volume indicators, macroeconomic conditions, and price trends to form a holistic thesis.
---
### Final Thoughts
Market depth is one of the most powerful tools for understanding the immediate balance between supply and demand. By looking past surface-level price movement and analyzing the structure of resting liquidity, intermediate traders can better protect themselves against slippage, recognize institutional footprint dynamics, and execute trades with greater efficiency.
However, market depth is dynamic, constantly changing in milliseconds as orders are created, filled, and canceled. Managing trade execution requires continuous monitoring, strict risk control, and an appreciation for the structural mechanics that drive modern digital asset exchanges.
#CryptoEducation #MarketDepth #TradingStrategy
Demystifying Market Depth: How Order Book Dynamics Shape Crypto Prices
When evaluating cryptocurrency markets, most market participants focus almost entirely on candlestick charts. While historical price action provides valuable context, candlesticks only show where the price has been. They do not show the underlying supply and demand mechanics currently resting in the market.
To understand where price might head next—and more importantly, how easily it can move—intermediate traders must learn to read market depth.
Market depth represents an asset’s ability to sustain large market orders without impacting its price significantly. It is a real-time window into the limit orders sitting on exchange order books. By mastering market depth, you transition from viewing price as a static line on a screen to understanding it as a dynamic equilibrium driven by resting liquidity.
---
### The Anatomy of an Order Book
Before analyzing depth, we must break down the structural foundation of digital asset exchanges: the central limit order book (CLOB).
An order book consists of two main components:
1. **Bids (Buy Orders):** Resting limit orders placed by buyers below the current prevailing market price.
2. **Asks or Offers (Sell Orders):** Resting limit orders placed by sellers above the current market price.
The highest price a buyer is willing to pay is the **Best Bid**, and the lowest price a seller is willing to accept is the **Best Ask**. The difference between these two values is known as the **Bid-Ask Spread**.
When a trader submits a **Market Order**, they accept the best available price on the order book instantly. A market buy order matches against resting ask orders, while a market sell order matches against resting bid orders. Conversely, a **Limit Order** adds liquidity to the order book, sitting at a specified price until another participant fills it. Limit order traders are known as *liquidity makers*, while market order traders are *liquidity takers*.
Market depth is simply the cumulative visualization of these resting limit buy and sell orders across various price levels away from the current market price.
---
### Understanding the Market Depth Chart
Most major exchanges display market depth visually alongside the standard order book ladder. This visual representation typically features two colored zones meeting at the center:
* **Green Zone (Bids):** Accumulates all resting buy orders from the best bid down to lower price levels.
* **Red Zone (Asks):** Accumulates all resting sell orders from the best ask up to higher price levels.
The horizontal axis represents price, while the vertical axis represents cumulative volume.
#### Interpreting Slope and Walls
The shape of the depth curve provides immediate structural insights:
* **Steep Slopes (Thick Depth):** A steep upward slope indicates that large amounts of volume are sitting within a narrow price range. This suggests robust liquidity, meaning it takes significant capital to move the price through this zone.
* **Shallow Slopes (Thin Depth):** A flat or shallow line indicates low volume resting at those price levels. In thin markets, relatively small market orders can push the price rapidly across multiple price ticks.
* **Order Walls:** A near-vertical spike in the depth chart represents a massive concentration of limit orders at a single price point—commonly referred to as a "buy wall" or "sell wall."
While order walls often act as psychological support or resistance levels, they must be interpreted with caution. Market makers and institutional participants frequently place and cancel large limit orders dynamically, meaning visual walls are not guaranteed to hold price action.
---
### Practical Example: Slippage and Price Impact
To appreciate the importance of market depth, consider how liquidity affects order execution in real-world trading scenarios.
Imagine an asset trading at $100. The order book displays the following sell liquidity (asks):
* Level 1: 10 units available at $100.00
* Level 2: 20 units available at $100.50
* Level 3: 50 units available at $101.00
* Level 4: 100 units available at $102.00
If Trader A submits a market buy order for **10 units**, the order is entirely filled at $100.00. The total cost is $1,000, and the average fill price is $100.00. The trade has zero execution slippage.
Now consider Trader B, who submits a market buy order for **70 units** into the exact same book:
* The first 10 units fill at $100.00 ($1,000)
* The next 20 units fill at $100.50 ($2,010)
* The remaining 40 units fill at $101.00 ($4,040)
Trader B spends $7,050 to buy 70 units, resulting in an average purchase price of **$100.71 per unit**.
This difference between the expected execution price ($100.00) and the actual average execution price ($100.71) is **slippage**. It occurred because the buyer's order was larger than the liquidity available at the best ask price, forcing the order to consume liquidity higher up the order book ladder.
In low-depth assets, large market orders can cause massive price spikes or drops, creating extreme volatility and poor execution for traders who rely solely on market orders.
---
### Hidden Layers, Manipulations, and Limitations
While market depth analysis offers vital clues, relying on visible order book data alone carries distinct risks. Modern crypto markets are complex, fast-moving environments influenced by automated trading systems and institutional tactics.
#### 1. Spoofing and Fake Liquidity
Spoofing occurs when a market participant places large, visible limit orders with no intention of letting them fill. For instance, a trader might place a massive buy wall at $95 to create the illusion of strong support, encouraging retail traders to buy at $96. Just before market price falls to hit the $95 wall, the spoofer cancels the order.
#### 2. Iceberg Orders
Institutional traders executing large positions rarely place multi-million-dollar limit orders directly onto the visible order book. Instead, they utilize **Iceberg Orders**—automated execution algorithms that split a massive order into small, visible slices. As soon as one visible slice is filled, the algorithm automatically places the next slice at the same or nearby price level. As a result, a price level that looks "thin" on the market depth chart may actually contain substantial hidden liquidity.
#### 3. Fragmentation Across Exchanges
Unlike traditional equity markets operating under centralized systems, crypto liquidity is fragmented across dozens of centralized exchanges and decentralized automated market makers (AMMs). Strong market depth on one major exchange does not guarantee deep liquidity globally. Cross-exchange arbitrage bots work constantly to align prices across platforms, but liquidity fragmentation remains an important structural limitation.
---
### Strategic Takeaways for Intermediate Traders
Understanding market depth changes how you structure your trades and manage risk:
* **Order Type Selection:** For large trade sizes relative to an asset's average daily volume, use limit orders or algorithmic execution strategies (such as TWAP or VWAP) rather than market orders to minimize slippage.
* **Identifying High-Liquidity Zones:** Instead of treating technical levels as precise lines, cross-reference support and resistance areas with order book depth. Price zones backed by persistent, genuine limit orders often provide more reliable structural support.
* **Volatility Forecasting:** When market depth thins out dramatically on both sides of the book (bids and asks), expect heightened volatility. In thin order books, minor spikes in buying or selling volume can cause disproportionate price swings.
* **Context Over Isolation:** Never analyze market depth in isolation. Combine order book data with volume indicators, macroeconomic conditions, and price trends to form a holistic thesis.
---
### Final Thoughts
Market depth is one of the most powerful tools for understanding the immediate balance between supply and demand. By looking past surface-level price movement and analyzing the structure of resting liquidity, intermediate traders can better protect themselves against slippage, recognize institutional footprint dynamics, and execute trades with greater efficiency.
However, market depth is dynamic, constantly changing in milliseconds as orders are created, filled, and canceled. Managing trade execution requires continuous monitoring, strict risk control, and an appreciation for the structural mechanics that drive modern digital asset exchanges.
#CryptoEducation #MarketDepth #TradingStrategy
To understand where price might head next—and more importantly, how easily it can move—intermediate traders must learn to read market depth.
Market depth represents an asset’s ability to sustain large market orders without impacting its price significantly. It is a real-time window into the limit orders sitting on exchange order books. By mastering market depth, you transition from viewing price as a static line on a screen to understanding it as a dynamic equilibrium driven by resting liquidity.
---
### The Anatomy of an Order Book
Before analyzing depth, we must break down the structural foundation of digital asset exchanges: the central limit order book (CLOB).
An order book consists of two main components:
1. **Bids (Buy Orders):** Resting limit orders placed by buyers below the current prevailing market price.
2. **Asks or Offers (Sell Orders):** Resting limit orders placed by sellers above the current market price.
The highest price a buyer is willing to pay is the **Best Bid**, and the lowest price a seller is willing to accept is the **Best Ask**. The difference between these two values is known as the **Bid-Ask Spread**.
When a trader submits a **Market Order**, they accept the best available price on the order book instantly. A market buy order matches against resting ask orders, while a market sell order matches against resting bid orders. Conversely, a **Limit Order** adds liquidity to the order book, sitting at a specified price until another participant fills it. Limit order traders are known as *liquidity makers*, while market order traders are *liquidity takers*.
Market depth is simply the cumulative visualization of these resting limit buy and sell orders across various price levels away from the current market price.
---
### Understanding the Market Depth Chart
Most major exchanges display market depth visually alongside the standard order book ladder. This visual representation typically features two colored zones meeting at the center:
* **Green Zone (Bids):** Accumulates all resting buy orders from the best bid down to lower price levels.
* **Red Zone (Asks):** Accumulates all resting sell orders from the best ask up to higher price levels.
The horizontal axis represents price, while the vertical axis represents cumulative volume.
#### Interpreting Slope and Walls
The shape of the depth curve provides immediate structural insights:
* **Steep Slopes (Thick Depth):** A steep upward slope indicates that large amounts of volume are sitting within a narrow price range. This suggests robust liquidity, meaning it takes significant capital to move the price through this zone.
* **Shallow Slopes (Thin Depth):** A flat or shallow line indicates low volume resting at those price levels. In thin markets, relatively small market orders can push the price rapidly across multiple price ticks.
* **Order Walls:** A near-vertical spike in the depth chart represents a massive concentration of limit orders at a single price point—commonly referred to as a "buy wall" or "sell wall."
While order walls often act as psychological support or resistance levels, they must be interpreted with caution. Market makers and institutional participants frequently place and cancel large limit orders dynamically, meaning visual walls are not guaranteed to hold price action.
---
### Practical Example: Slippage and Price Impact
To appreciate the importance of market depth, consider how liquidity affects order execution in real-world trading scenarios.
Imagine an asset trading at $100. The order book displays the following sell liquidity (asks):
* Level 1: 10 units available at $100.00
* Level 2: 20 units available at $100.50
* Level 3: 50 units available at $101.00
* Level 4: 100 units available at $102.00
If Trader A submits a market buy order for **10 units**, the order is entirely filled at $100.00. The total cost is $1,000, and the average fill price is $100.00. The trade has zero execution slippage.
Now consider Trader B, who submits a market buy order for **70 units** into the exact same book:
* The first 10 units fill at $100.00 ($1,000)
* The next 20 units fill at $100.50 ($2,010)
* The remaining 40 units fill at $101.00 ($4,040)
Trader B spends $7,050 to buy 70 units, resulting in an average purchase price of **$100.71 per unit**.
This difference between the expected execution price ($100.00) and the actual average execution price ($100.71) is **slippage**. It occurred because the buyer's order was larger than the liquidity available at the best ask price, forcing the order to consume liquidity higher up the order book ladder.
In low-depth assets, large market orders can cause massive price spikes or drops, creating extreme volatility and poor execution for traders who rely solely on market orders.
---
### Hidden Layers, Manipulations, and Limitations
While market depth analysis offers vital clues, relying on visible order book data alone carries distinct risks. Modern crypto markets are complex, fast-moving environments influenced by automated trading systems and institutional tactics.
#### 1. Spoofing and Fake Liquidity
Spoofing occurs when a market participant places large, visible limit orders with no intention of letting them fill. For instance, a trader might place a massive buy wall at $95 to create the illusion of strong support, encouraging retail traders to buy at $96. Just before market price falls to hit the $95 wall, the spoofer cancels the order.
#### 2. Iceberg Orders
Institutional traders executing large positions rarely place multi-million-dollar limit orders directly onto the visible order book. Instead, they utilize **Iceberg Orders**—automated execution algorithms that split a massive order into small, visible slices. As soon as one visible slice is filled, the algorithm automatically places the next slice at the same or nearby price level. As a result, a price level that looks "thin" on the market depth chart may actually contain substantial hidden liquidity.
#### 3. Fragmentation Across Exchanges
Unlike traditional equity markets operating under centralized systems, crypto liquidity is fragmented across dozens of centralized exchanges and decentralized automated market makers (AMMs). Strong market depth on one major exchange does not guarantee deep liquidity globally. Cross-exchange arbitrage bots work constantly to align prices across platforms, but liquidity fragmentation remains an important structural limitation.
---
### Strategic Takeaways for Intermediate Traders
Understanding market depth changes how you structure your trades and manage risk:
* **Order Type Selection:** For large trade sizes relative to an asset's average daily volume, use limit orders or algorithmic execution strategies (such as TWAP or VWAP) rather than market orders to minimize slippage.
* **Identifying High-Liquidity Zones:** Instead of treating technical levels as precise lines, cross-reference support and resistance areas with order book depth. Price zones backed by persistent, genuine limit orders often provide more reliable structural support.
* **Volatility Forecasting:** When market depth thins out dramatically on both sides of the book (bids and asks), expect heightened volatility. In thin order books, minor spikes in buying or selling volume can cause disproportionate price swings.
* **Context Over Isolation:** Never analyze market depth in isolation. Combine order book data with volume indicators, macroeconomic conditions, and price trends to form a holistic thesis.
---
### Final Thoughts
Market depth is one of the most powerful tools for understanding the immediate balance between supply and demand. By looking past surface-level price movement and analyzing the structure of resting liquidity, intermediate traders can better protect themselves against slippage, recognize institutional footprint dynamics, and execute trades with greater efficiency.
However, market depth is dynamic, constantly changing in milliseconds as orders are created, filled, and canceled. Managing trade execution requires continuous monitoring, strict risk control, and an appreciation for the structural mechanics that drive modern digital asset exchanges.
#CryptoEducation #MarketDepth #TradingStrategy
1
77
BTC/USDT TECHNICAL CHECK - 1H
Snapshot: 2026-11-15 19:15 UTC. Latest close: $65,011.09. RSI(14): 56.3. EMA20 is below EMA50 on this snapshot. This is a momentum observation, not a standalone buy or sell signal. RSI can remain elevated or depressed during strong trends; confirm with price structure and risk management.
$BTC #Bitcoin #TechnicalAnalysis
Educational commentary only; not financial advice.
BTC/USDT TECHNICAL CHECK - 1H
Snapshot: 2026-11-15 19:15 UTC. Latest close: $65,011.09. RSI(14): 56.3. EMA20 is below EMA50 on this snapshot. This is a momentum observation, not a standalone buy or sell signal. RSI can remain elevated or depressed during strong trends; confirm with price structure and risk management.
$BTC #Bitcoin #TechnicalAnalysis
Educational commentary only; not financial advice.
Snapshot: 2026-11-15 19:15 UTC. Latest close: $65,011.09. RSI(14): 56.3. EMA20 is below EMA50 on this snapshot. This is a momentum observation, not a standalone buy or sell signal. RSI can remain elevated or depressed during strong trends; confirm with price structure and risk management.
$BTC #Bitcoin #TechnicalAnalysis
Educational commentary only; not financial advice.
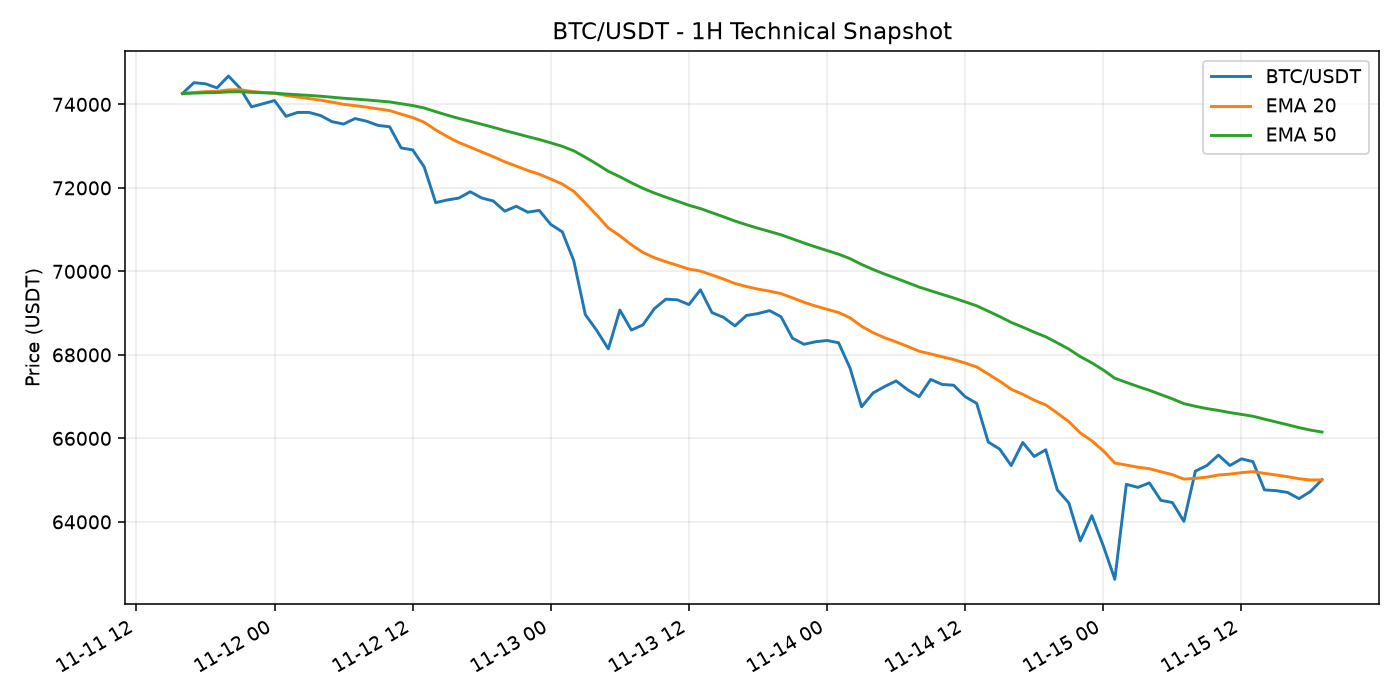
57
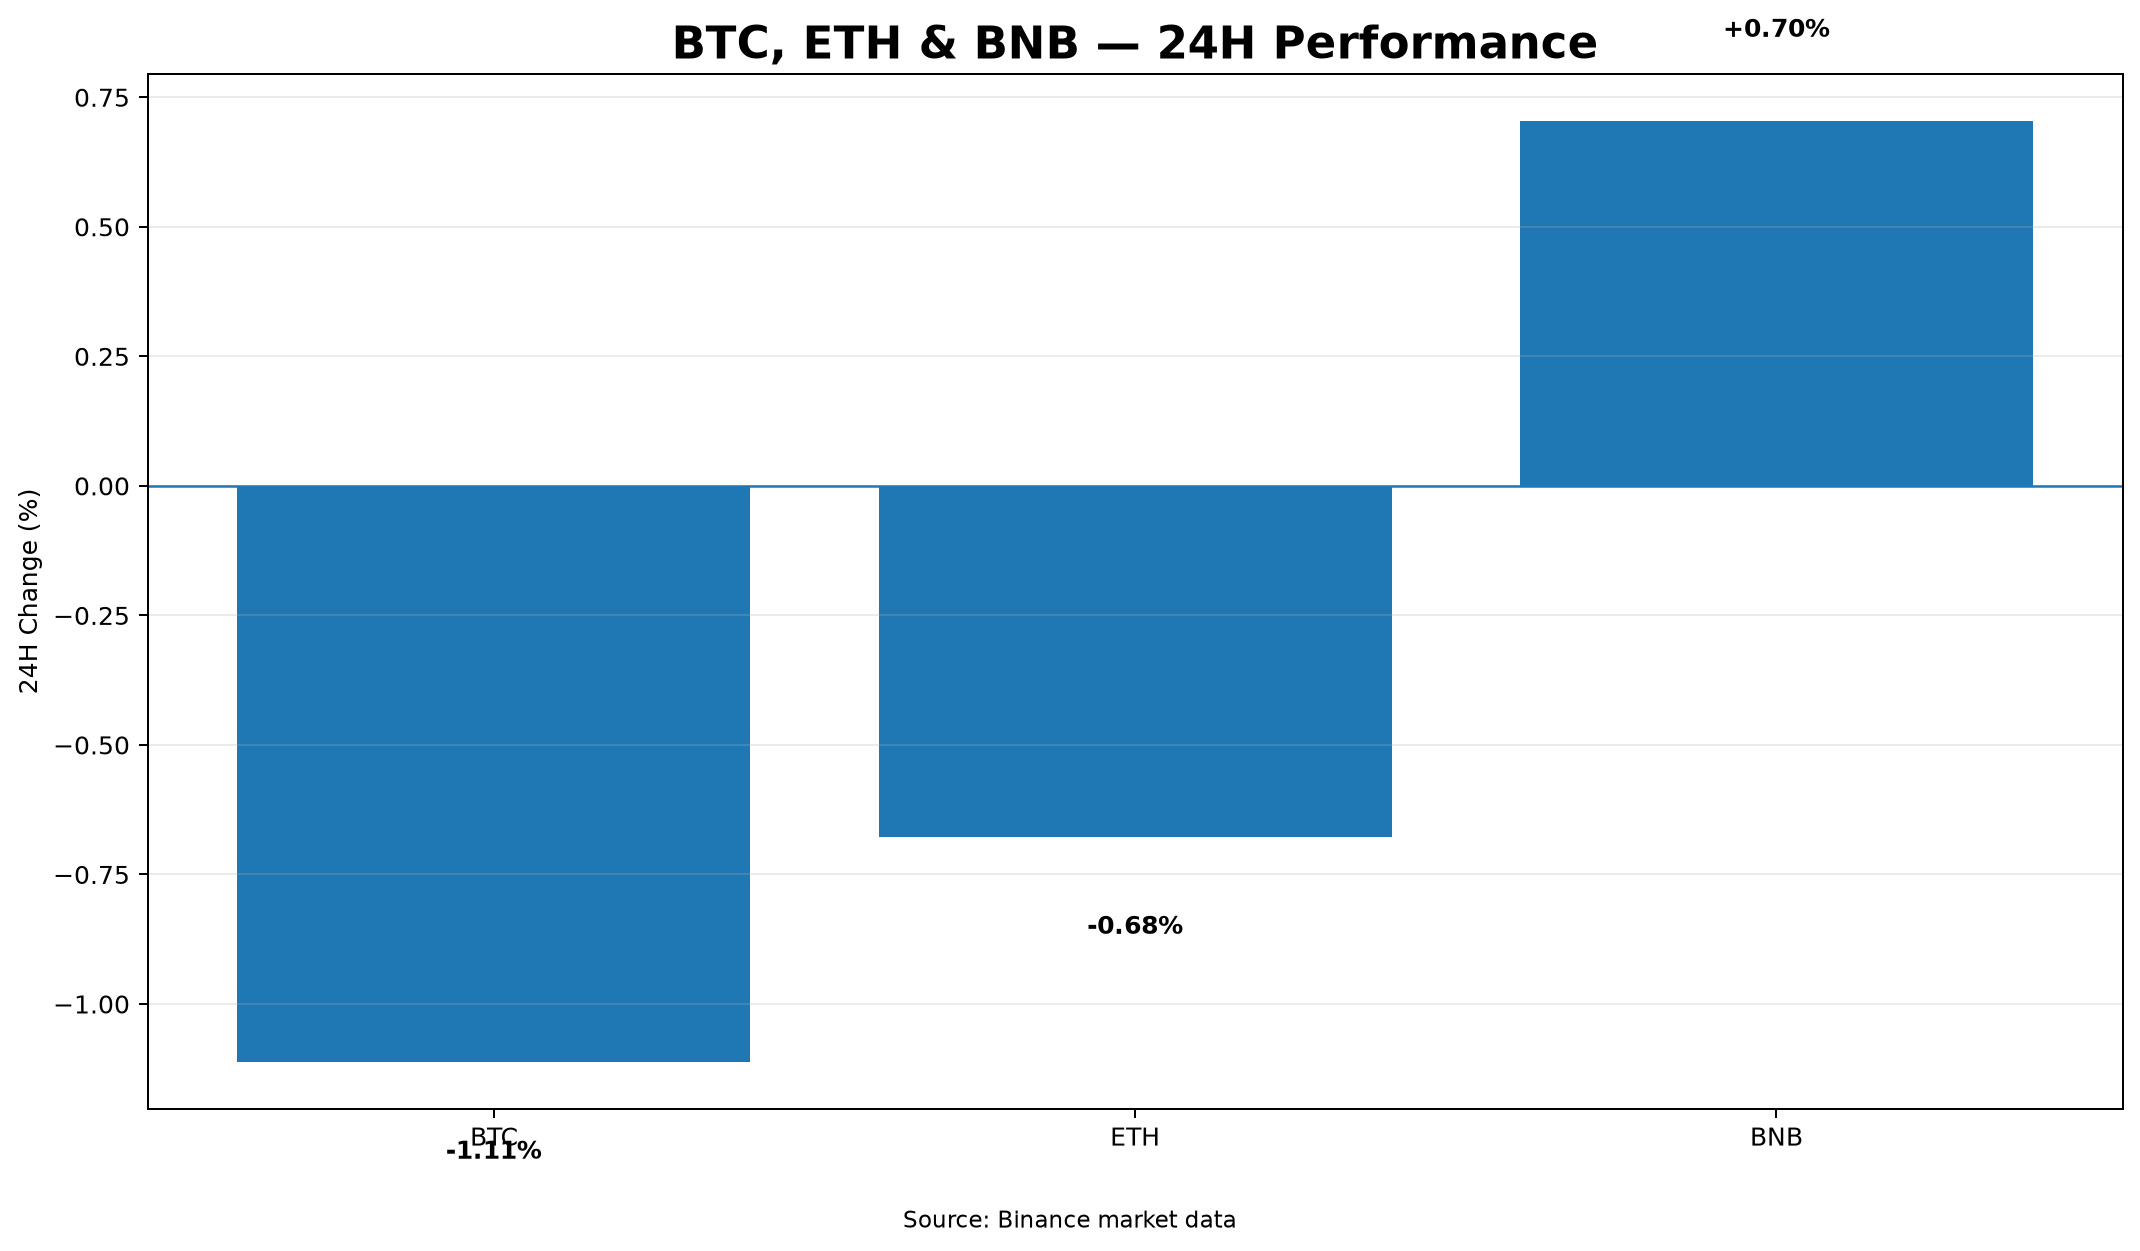
Мақала
Market Analysis: Evaluating Price Movements, Volatility, and Key Levels across Major AssetsThe crypto market displays a mixed landscape over the past 24 hours, with varying performance and notable intraday ranges across major assets.
**Price Action & Performance**
- $BTC is trading at $64,621.75, down 1.112% in the last 24 hours. It registered a 24h high of $66,189.88 and a low of $62,006.00, accompanied by a 24h quote volume of approximately $2.34B (36,273.13 units).
- $ETH stands at $1,814.07, representing a 0.678% decrease over the daily period. Its 24h range spans from $1,711.08 to $1,858.25, with a quote volume of $991.84M (553,208.25 units).
- $BNB shows relative strength compared to the broader market, gaining 0.705% to reach $590.36. It recorded a 24h low of $566.00 and a high of $599.72, generating $120.10M in quote volume (205,160.51 units).
**Relative Strength & Volatility**
BNB is currently outperforming Bitcoin and Ethereum, showing positive momentum despite overall market pullbacks. Volatility remains substantial, particularly for Bitcoin, which traded within a wide $4,183.88 range over the past day. Ethereum experienced a $147.17 spread, while BNB fluctuated by $33.72.
**Market Scenarios**
- **Bullish Scenario:** A sustained move above the 24h resistance levels—$66,189.88 for Bitcoin, $1,858.25 for Ethereum, and $599.72 for BNB—could signal renewed upward momentum if backed by expanding volume.
- **Bearish Scenario:** Failure to hold near current levels could lead to retests of the recent 24h lows at $62,006.00 for Bitcoin, $1,711.08 for Ethereum, and $566.00 for BNB, increasing the likelihood of deeper consolidation.
**Risks & What to Watch**
Key risks include potential liquidity spikes near support and resistance bounds. Market participants should closely monitor trading volume patterns and price behavior near daily highs and lows for clues on trend direction.
#CryptoAnalysis #MarketUpdate #TradingOverview
Market Analysis: Evaluating Price Movements, Volatility, and Key Levels across Major Assets
The crypto market displays a mixed landscape over the past 24 hours, with varying performance and notable intraday ranges across major assets.
**Price Action & Performance**
- $BTC is trading at $64,621.75, down 1.112% in the last 24 hours. It registered a 24h high of $66,189.88 and a low of $62,006.00, accompanied by a 24h quote volume of approximately $2.34B (36,273.13 units).
- $ETH stands at $1,814.07, representing a 0.678% decrease over the daily period. Its 24h range spans from $1,711.08 to $1,858.25, with a quote volume of $991.84M (553,208.25 units).
- $BNB shows relative strength compared to the broader market, gaining 0.705% to reach $590.36. It recorded a 24h low of $566.00 and a high of $599.72, generating $120.10M in quote volume (205,160.51 units).
**Relative Strength & Volatility**
BNB is currently outperforming Bitcoin and Ethereum, showing positive momentum despite overall market pullbacks. Volatility remains substantial, particularly for Bitcoin, which traded within a wide $4,183.88 range over the past day. Ethereum experienced a $147.17 spread, while BNB fluctuated by $33.72.
**Market Scenarios**
- **Bullish Scenario:** A sustained move above the 24h resistance levels—$66,189.88 for Bitcoin, $1,858.25 for Ethereum, and $599.72 for BNB—could signal renewed upward momentum if backed by expanding volume.
- **Bearish Scenario:** Failure to hold near current levels could lead to retests of the recent 24h lows at $62,006.00 for Bitcoin, $1,711.08 for Ethereum, and $566.00 for BNB, increasing the likelihood of deeper consolidation.
**Risks & What to Watch**
Key risks include potential liquidity spikes near support and resistance bounds. Market participants should closely monitor trading volume patterns and price behavior near daily highs and lows for clues on trend direction.
#CryptoAnalysis #MarketUpdate #TradingOverview
**Price Action & Performance**
- $BTC is trading at $64,621.75, down 1.112% in the last 24 hours. It registered a 24h high of $66,189.88 and a low of $62,006.00, accompanied by a 24h quote volume of approximately $2.34B (36,273.13 units).
- $ETH stands at $1,814.07, representing a 0.678% decrease over the daily period. Its 24h range spans from $1,711.08 to $1,858.25, with a quote volume of $991.84M (553,208.25 units).
- $BNB shows relative strength compared to the broader market, gaining 0.705% to reach $590.36. It recorded a 24h low of $566.00 and a high of $599.72, generating $120.10M in quote volume (205,160.51 units).
**Relative Strength & Volatility**
BNB is currently outperforming Bitcoin and Ethereum, showing positive momentum despite overall market pullbacks. Volatility remains substantial, particularly for Bitcoin, which traded within a wide $4,183.88 range over the past day. Ethereum experienced a $147.17 spread, while BNB fluctuated by $33.72.
**Market Scenarios**
- **Bullish Scenario:** A sustained move above the 24h resistance levels—$66,189.88 for Bitcoin, $1,858.25 for Ethereum, and $599.72 for BNB—could signal renewed upward momentum if backed by expanding volume.
- **Bearish Scenario:** Failure to hold near current levels could lead to retests of the recent 24h lows at $62,006.00 for Bitcoin, $1,711.08 for Ethereum, and $566.00 for BNB, increasing the likelihood of deeper consolidation.
**Risks & What to Watch**
Key risks include potential liquidity spikes near support and resistance bounds. Market participants should closely monitor trading volume patterns and price behavior near daily highs and lows for clues on trend direction.
#CryptoAnalysis #MarketUpdate #TradingOverview
116
CRYPTO MARKET SNAPSHOT
Data timestamp: 2026-11-15 11:36 UTC. BTC/USDT is $65,478.00 (-2.54% over 24h). Market direction can vary by asset and timeframe, so review liquidity and your own risk limits before making decisions.
Watchlist: $BTC $ETH
#CryptoMarket #Bitcoin #Ethereum
Educational commentary only; not financial advice.
CRYPTO MARKET SNAPSHOT
Data timestamp: 2026-11-15 11:36 UTC. BTC/USDT is $65,478.00 (-2.54% over 24h). Market direction can vary by asset and timeframe, so review liquidity and your own risk limits before making decisions.
Watchlist: $BTC $ETH
#CryptoMarket #Bitcoin #Ethereum
Educational commentary only; not financial advice.
Data timestamp: 2026-11-15 11:36 UTC. BTC/USDT is $65,478.00 (-2.54% over 24h). Market direction can vary by asset and timeframe, so review liquidity and your own risk limits before making decisions.
Watchlist: $BTC $ETH
#CryptoMarket #Bitcoin #Ethereum
Educational commentary only; not financial advice.
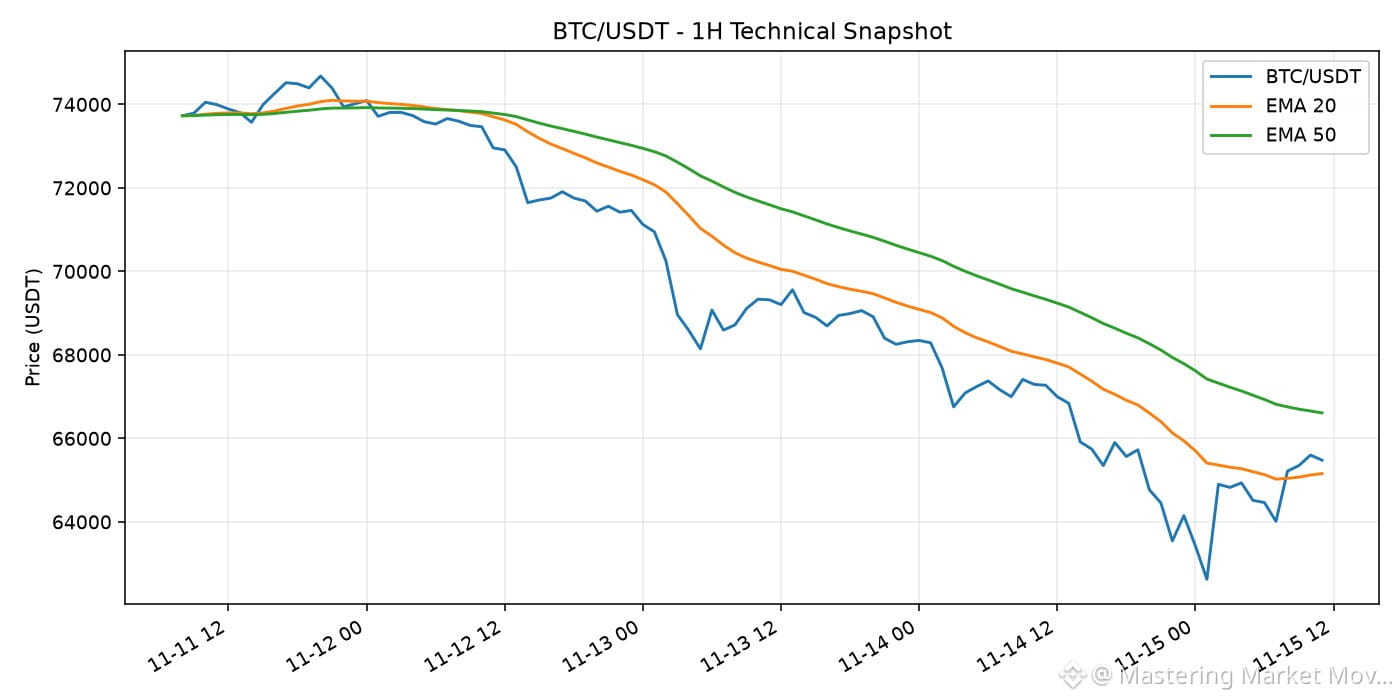
74
Көбірек контент көру үшін кіріңіз
Binance Square платформасында әлемдік криптоқоғамдастыққа қосылыңыз
⚡️ Криптовалюта туралы ең соңғы және пайдалы ақпаратты алыңыз.
💬 Әлемдегі ең ірі криптобиржаның сеніміне ие.
👍 Расталған авторлардың нақты пікірлерін табыңыз.
Электрондық пошта/телефон нөмірі
Трендтегі тақырыптар
NvidiaBeatsEstimatesWith$130BQ4Outlook
51,543 рет көрілді
272 адам талқылап жатыр
Nvidia Beats With $115.8 Billion in Revenue, Guides to $130 Billion and Adds $150 Billion Buyback
Binance News
·72 лайк
·48.4k рет көрілді
AnthropicIPOPriceCouldExceed$80
53,785 рет көрілді
233 адам талқылап жатыр
RussiaCentralBankAddsAlfaBankToCryptoExchangeRegister
2,922 рет көрілді
42 адам талқылап жатыр